Abstract
Gross primary productivity (GPP), representing organic carbon fixation through photosynthesis, is crucial for developing science-based strategies for sustainable development. Given that the tropical region harbors nearly half of all species, it plays a pivotal role in safeguarding the global environment against climate change and preserving global biodiversity. Thus, investigating changes in vegetation productivity within this region holds substantial practical importance for estimating global vegetation productivity. In this study, we employed an enhanced P model to estimate vegetation GPP in the tropical region from 2001 to 2020, based on which we quantified the spatiotemporal changes and associated mechanisms. The results reveal that the annual mean GPP in the tropical region ranged from 2603.9 to 2757.1 g·cm−2 a−1, demonstrating an overall apparent increasing trend. Inland areas were mainly influenced by precipitation, while coastal areas were primarily influenced by temperature. Land cover changes, especially conversion to cropland, significantly influence GPP, with deciduous—evergreen forest transitions causing notable decreases. Climate change emerges as the dominant factor affecting GPP, as indicated by the contribution rate analysis. This research interprets the spatiotemporal pattern and mechanisms of GPP in the tropics, offering valuable insights for sustainable ecosystem management.
1. Introduction
Vegetation is the primary component of terrestrial ecosystems and plays a pivotal role in regulating global climate, carbon balance, and other environmental factors [1]. Increasing the carbon sink of terrestrial vegetation has become a necessary strategic choice for humans to adapt to climate change [1,2]. Gross primary productivity (GPP) refers to the total amount of organic carbon fixed by green plants through photosynthesis per unit area of ecosystem and per unit time and serves as an important indicator to characterize the intensity of plant photosynthesis [3,4]. This process determines the total amount of the original substances [5]. Vegetation GPP is the largest component of the carbon sink in terrestrial ecosystems and plays an important role in regulating the global carbon cycle [6,7]. Therefore, studying the evolution of GPP is essential for assessing ecosystem health and the status of forest types in response to climate change.
The tropics play a pivotal role in safeguarding the global environment from the adverse effects of global warming and maintaining global biodiversity as a potential carbon sink. They are home to nearly half of the planet’s species and about 70%–80% of the world’s tree species [8]. The dominant land cover type in the tropics is forest, with tropical forests accounting for approximately 50% of the world’s forests and 45% of the carbon content of terrestrial forests [8,9]. Tropical forests are responsible for the production and storage of 40% of the world’s biomass carbon, and they also act as a significant carbon sink, absorbing approximately six times more carbon through photosynthesis than humans release into the atmosphere from fossil fuels. This makes the existence of this carbon sink crucial to the global carbon cycle and human ecological security [10]. Consequently, tropical forests contribute significantly to the global carbon balance, are the most productive terrestrial ecosystems, and are globally important carbon sinks [11]. Any increase or decrease in their biomass will have a significant impact on the Earth’s carbon cycle [12]. The study of the spatial and temporal patterns of GPP in the tropics and its mechanisms has far-reaching implications for the study of the terrestrial carbon cycle and global climate change.
The current research on GPP is focused on the following aspects:
- (1)
- Analysis of trends in spatial and temporal evolution: Previous studies have demonstrated a significant increase in the occurrence of GPP over the past decades [12,13,14]. The largest increase is in the southern part of the Amazon rainforest in the tropics, with an increase of 5 g·cm−2year−1 [15]. Among these regions, the low-latitude tropical region near the equator has the highest GPP, with GPP per unit area exceeding 2000 g·cm−2year−1 [16,17]. Overall, the regions with increasing trends of GPP in the tropics are mainly north of the equator, while the regions with decreasing trends are mainly south of the equator. Among these regions, the change in GPP in the Australian region is not significant, while the Southeast Asian region shows predominantly a decreasing trend [18,19].
- (2)
- To investigate the mechanisms underlying GPP, factors such as the CO2 fertilization effect [20,21], climate change [14,22], nitrogen deposition [23], and land cover change [11,24,25] have been shown to positively influence the increase in GPP. CO2 fertilization effect: Increased carbon dioxide concentration leads to increased vegetation productivity, commonly known as the CO2 fertilization effect (CFE). In recent years, the vegetation response to CO2 has declined over much of the world’s landmass, implying that the positive impact of increased atmospheric CO2 on terrestrial carbon sequestration has been substantially reduced [26]. Climate change: It has been proposed that the impact of CO2 on GPP in the tropics may be offset by the effects of climate-related changes. Globally, abundant rainfall and sunlight favor vegetation growth and increases in GPP [17,22]. However, different regions in the tropics also have different temperature and rainfall patterns, which may lead to different carbon cycle responses; further analysis is therefore required to determine the impact of these changes on GPP in specific regions [27]. Nitrogen deposition: The carbon balance of most terrestrial ecosystems is affected by nitrogen deposition, and in the case of the tropics, tropical forests do not respond significantly to nitrogen deposition due to phosphorus limitation [28,29]. Land cover change: Hou et al. showed that land cover change negatively affects GPP on a global scale [30]. In the tropics, land cover change has more pronounced negative impacts in southeastern South America, eastern and central Africa, and the Indian Peninsula, with slightly positive impacts observed in Southeast Asia.
- (3)
- Methods for estimating GPP: Methods for estimating regional and global GPP are broadly categorized into observation-driven and model-driven approaches [31]. The first category, observation-driven methods employing machine learning algorithms, scales tower-based GPP to regional and global levels, such as random forest [32]. These models rely heavily on extensive datasets of field observations for training. A paucity of training data can significantly impair the precision of these models’ GPP estimates. The second category involves estimating GPP from satellite-based photosynthetic proxies, such as Light Use Efficiency (LUE) and Solar-Induced Fluorescence (SIF) models [33,34]. The dependability of GPP estimates using observation-driven methods hinges largely on the quality and quantity of the observations used to train the models. Such models, which involve multiple parameters and inputs, are inherently complex. This complexity can introduce uncertainties, particularly when parameters are set based on broad vegetation types, potentially impacting the accuracy of regional and global GPP estimates [35]. Despite the advancements in data-driven models, remote sensing models based on LUE remain predominant in multi-scale GPP estimation due to their greater data accessibility and fewer parameters [36]. Accurately determining the actual LUE is both a challenge and a prerequisite for reducing uncertainties in GPP estimation [37]. Compared to traditional LUE models, the original P model exhibits superior performance and has been successfully applied to GPP estimation across various regions [38]. Nevertheless, the original P model does not account for the impact of water stress on GPP [39]. Therefore, numerous scholars have proposed various enhancements to the original P model. For instance, the P model by Stocker et al., which calculates absorbed photosynthetically active radiation (APAR) using a big-leaf algorithm, fails to distinguish between sunlit and shaded leaves, potentially leading to inaccuracies in capturing the actual APAR [40]. Consequently, this paper utilizes Zhang et al.’s improved P model, which integrates five water stress factors, thereby significantly enhancing the accuracy of GPP estimation [36].
Although datasets for global Gross Primary Productivity (GPP) estimation have been available for some time, each dataset relies on assumptions. Whereas most regions in the tropics have conditions conducive to photosynthesis, GPP estimation exhibits significant variability and uncertainty. The GPP products from different satellites exhibit significant variability [41], which still needs further analysis. Previous studies have not thoroughly analyzed how various influencing factors contribute to GPP, often overlooking the interactions among variables. This gap may hinder accurate modeling and prediction of ecosystem behavior. To address these deficiencies, our study adopts an innovative approach by utilizing the improved P model to estimate GPP. The P model, a LUE-like model, captures deeper mechanisms of photosynthesis and simplifies parameterization [39]. The enhanced P model, integrating the water stress factors, effectively considers the impact of environmental factors such as drought on photosynthesis efficiency [36]. This approach provides new perspectives and methodologies for global ecological studies and the future improvement of GPP models. Consequently, this paper employs the improved P model to estimate GPP since the global application of the P model remains limited. We specifically examine the effects of microclimatic variations and land use changes on GPP. Our methodology not only elucidates the complex contributions and interactions of these factors but also offers crucial guidance for developing targeted strategies to enhance ecosystem sustainability and resilience. The study focuses on the tropics and comprises the following tasks: (1) Calculating the spatiotemporally continuous GPP data in the tropics using the improved P model [39]. (2) Exploring the spatiotemporal evolution characteristics of GPP in the tropics over the past 20 years. (3) Combining climate data (temperature and precipitation data) with land cover data to quantify the impacts of land cover change and climate change on vegetation GPP and analyzing the driving factors of vegetation GPP change.
2. Materials and Methods
2.1. Overview of the Study Area and Data Sources
2.1.1. Overview of the Study Area
The tropics lie between the Tropic of Capricorn and the Tropic of Cancer, spanning both sides of the equator from 23°26′ north to 23°26′ south latitudes, accounting for 39.8% of the total global area (Figure 1) [42]. The climate is characterized by consistently high temperatures throughout the year, and the seasons are not clearly defined; there are only hot and cool or rainy and dry seasons, with the lowest temperature of the year above 15 °C [43]. Tropical regions encompass a variety of climate types. The tropical rainforest climate is primarily concentrated near the equator, characterized by high temperatures and year-round rainfall, with consistent monthly patterns [44]. The tropical savanna climate predominates in Africa and South America, flanking the equatorial rainforest climate. It features high temperatures year-round and distinct wet and dry seasons. The tropical monsoon climate is most pronounced in southern and southeastern Asia, including the Indian Peninsula and the Central and Southern Peninsula. The tropical desert climate is primarily found along the west coast of continents near the Tropic of Cancer and inland areas. Precipitation is scarce, resulting in hot and dry conditions year-round, characterized by extensive desert terrain.
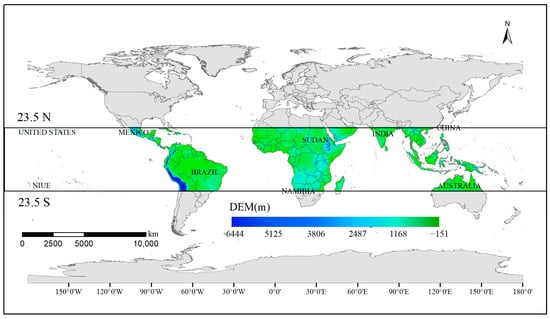
Figure 1.
Schematic representation of the study area.
According to our calculations: 75.77% of the tropics consist of water bodies, with the remaining surface cover types including cropland, mosaic cropland, evergreen broad-leaf forest, broadleaved deciduous forest, evergreen needle-leaved forest, deciduous coniferous forest, mixed forest, shrubland, grassland, wetland, urban areas, bare areas, snow, and ice, among others. Among these, evergreen broad-leaf forest is the most widely distributed, covering 22.95% of the land area and primarily found in the Amazon Plain in northern South America, central Africa, and the southern islands of Asia. Bare land accounts for 13.73% of the total area, primarily located in Africa and Asia near the Tropic of Cancer, including the Sahara Desert and the Arabian Peninsula. Arable land is primarily concentrated in southeastern South America and the Indian Peninsula in southern Asia, with additional distribution in central Africa, comprising 13.57% of the total area. Broadleaved deciduous forest covers 11.53% of the area, mainly distributed in central Africa, while grassland covers 10.14% of the area, primarily found in central Australia and the transition zones between deserts and forests in northern Africa. The remaining land cover types are dispersed.
2.1.2. Data Sources
The data used in this study to calculate the GPP values include monthly total precipitation data, monthly mean 2 m temperature (T), solar shortwave radiation downwards (SSRD), surface pressure (SP), relative humidity (RH), leaf area index (LAI), atmospheric CO2 concentration (CB), and land cover, as shown in Table 1. Among them, the monthly total precipitation data, monthly mean 2 m air temperature (T), solar shortwave radiation downwards (SSRD), surface pressure (SP), relative humidity (RH), and land cover data were obtained from the ERA5 dataset of the European Centre for Medium-Range Weather Forecasts (https://cds.climate.copernicus.eu (accessed on 13 March 2024)), with spatial and temporal resolutions shown in Table 1. The monthly LAI data were obtained from the GLASS dataset (http://www.glass.umd.edu/Download.html (accessed on 10 November 2023)), with a spatial resolution of 0.1° × 0.1°. The atmospheric CO2 concentration was developed by Hou et al. [30], with a spatial resolution of 2° × 2.5° and a temporal resolution of one month.

Table 1.
Research data.
2.1.3. Data Pre-Processing
Based on the University of Maryland (UMD) Land Cover Classification Scheme (LCCS), the Biogeochemical Cycle (BGC) classification scheme of the Food and Agriculture Organization of the United Nations (UN FAO), and related research results [34,35], we reclassified the land cover data of the study area and extracted more than 30 land cover types (Table 2). Owing to the rich diversity of vegetation cover types in tropical regions, we preserved the original classification of non-vegetated areas. For vegetated zones, we refined our classification method by grouping these areas according to species composition similarity. This approach enhances the accuracy of reflecting the ecological characteristics and interrelationships among the diverse vegetation types found in these regions. Subsequently, we identified 14 primary land cover types, including cropland, mosaic cropland, evergreen broadleaf forest, broadleaved deciduous forest, deciduous coniferous forest, shrubland, evergreen needle-leaved forest, urban, grassland, wetland, bare areas, water, snow and ice, and tree mixed (Figure 2).
Table 2.
Types and their percentages before and after reclassification of land cover data.
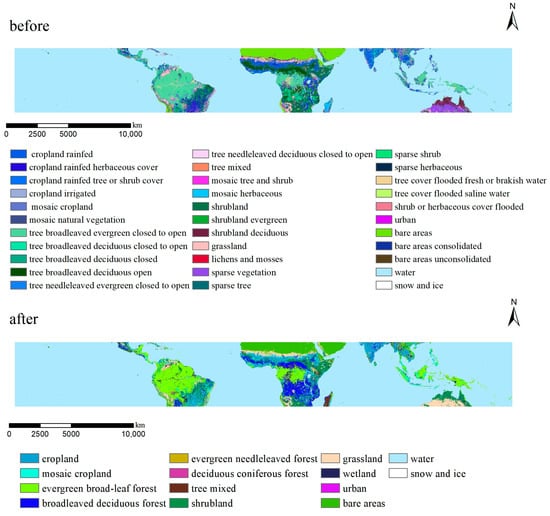
Figure 2.
Comparison before and after reclassification of land cover types, 2001.
In calculating the GPP, all the data we used were monthly data with a spatial resolution of 0.1° × 0.1°. To harmonize their spatial resolution, we resampled the relative humidity and carbon dioxide concentration data to adjust their spatial resolution to 0.1°. When analyzing the impact factors of GPP, the air temperature, precipitation, and land cover data need to be standardized into annual data with a spatial resolution of 0.1° × 0.1°. The spatial resolution of the raw temperature and precipitation data was one month. We aggregated and averaged the monthly data to calculate annual average climate data with a temporal resolution of one year. Subsequently, the land cover data were resampled to a spatial resolution of 0.1° × 0.1°.
3. Research Methodology
In this study, we initially employed the P model to compute the GPP values in the tropical region from 2001 to 2020. Subsequently, we investigated the spatiotemporal evolution trends of GPP in the tropics using a trend analysis approach. Finally, we analyzed the factors influencing GPP changes by employing land cover transfer matrices, calculating Pearson correlation coefficients, and determining contribution rates.
3.1. Estimation of GPP
In this paper, the improved P model [36,39] is used to calculate monthly GPP.
3.1.1. Calculation of GPP
The formula of the improved P model employed to calculate the monthly GPP can be expressed as
where LUE is light use efficiency, which refers to the efficiency of conversion of light energy intercepted by plants into chemical energy, expressed as the ratio of productivity to absorbed light energy; Iabs is photosynthetic photon flux density (PPFD) (molm−2month−1); and yet
So the formula for GPP can be expressed as
where m is the CO2 limiting factor; c denotes the CO2 consumption that maintains Jmax equal to 0.41; and in this paper, the value of c is taken to be 0.41.
3.1.2. Calculation of m
In Equation (3), m is computed as
where CD is the ambient CO2 partial pressure (Pa); Gstar is the photorespiratory compensation point (Pa); F is the viscosity of water relative to its value at 25 °C [39]; β is a constant of 240; K is the effective Michaelis–Menten coefficient of Rubisco (Pa).
where V is the vapor pressure deficit (Pa); RH is the relative humidity; T is the average monthly temperature (°C).
The ambient CO2 partial pressure (CD) is calculated as
where CB is the atmospheric CO2 concentration (ppm) and SP is the surface pressure (Pa). Gstar is calculated as
where GS25 = 4.3320 at 25 °C (about 4.22 Pa) for ; DHA is the activation energy at 25 °C (about 37,830 Jmol−1); KR is the gas constant (8.3145 J mol−1K−1); atm is the standard atmospheric pressure (101,325 Pa); T is the average monthly temperature (°C).
F is calculated as
where T is the average monthly temperature (°C).
In Equation (4), K is calculated as
where VC is the Michaelis–Menten constant for CO2 (Pa); VO is the Michaelis–Menten constant for carboxylation and oxidation reactions (Pa).
3.1.3. Calculation of maxQE
The maxQE in Equation (3) is calculated as
where:
3.1.4. Calculation of Iabs
FPAR is calculated as
where LAI is the leaf area index; θ is the zenith angle of the sun.
3.2. Analysis of Inter-Annual Trends in Vegetation GPP
In this paper, the trend analysis method was applied to analyze the inter-annual trend of vegetation GPP from 2001 to 2020, and the significance test of the trend was conducted using the following calculation formula:
where, is the slope of the regression trend, if > 0, it means that GPP has an increasing trend during the study period, and vice versa; n is the length of time.
The F-test for the regression effect is performed using the following formula:
where: is the regression value of GPP in year i; is the multi-year average value; is the value of GPP in year i. Based on critical values from the F-distribution table, the trend of change was categorized into three levels: non-significant, significant, and highly significant, according to significance levels of 0.05 and 0.01.
3.3. Correlation Analysis between Vegetation GPP and Meteorological Factors
In this paper, the Pearson correlation coefficient was used to calculate the correlation between precipitation, air temperature, and vegetation GPP at the pixel scale.
The Pearson correlation coefficient was calculated using the following formula:
where and denote the value of GPP and climate factor in year i. and denote the multi-year average GPP and multi-year average climate factor values; n is the length of the time series.
To exclude the interference of variables, the partial correlation coefficient was introduced to study the effect of precipitation (air temperature) on vegetation GPP after accounting for the interference of air temperature (precipitation). The coefficient is calculated as follows:
where Rxy,z is the partial correlation coefficient between the independent variable y and the dependent variable x after the independent variable z is fixed. The significance of the partial correlation coefficient is tested by a t-test, which is calculated as follows:
where n is the number of samples and m is the number of independent variables.
Considering that the change of an element is influenced by multiple factors, the compound correlation coefficient is introduced to study the correlation between temperature, precipitation, and vegetation GPP, and the formula is calculated as follows:
where Rxy denotes the linear correlation coefficient between x and y; Rxz,y is the partial correlation coefficient between the independent variable z and the dependent variable x after the independent variable y is fixed; and R x,yz is the complex correlation coefficient of the dependent variable x and the independent variables y and z.
The significance of the complex correlation coefficients was tested by the F-test, which was calculated as follows:
where n is the number of samples and k is the number of independent variables.
3.4. Contribution of Climate Change and Land Cover Change to Vegetation GPP Change
In this study, the contribution of climate change and land cover change to changes in vegetation GPP from 2001 to 2020 was quantified using the contribution rate method proposed by Hicke et al. [45]. In each study time period, the relative contribution of climate change to vegetation GPP (Rht) is expressed as the difference between the actual GPP and the GPP estimated under the condition of constant temperature and precipitation stabilization, while the relative contribution of land cover change (forest, shrub, grassland, and cropland) to vegetation GPP (Rlc) is expressed as the difference between the actual GPP and the GPP estimated under the condition of constant land cover. The relative contribution of each factor can be expressed by the following equation:
where S1 is the area of the land cover type at the beginning of a period of time; ΔS is the amount of change in the area of different land cover types at a period of time; GPP1 is the value of GPP at the beginning of a period of time; ΔGPP is the amount of change in the GPP of the land cover type at a period of time; ΔGPP × S1 is the amount of climate change impact on the total amount of GPP in the tropics; and ΔS × GPP1 is the amount of land cover change and the amount of impact on total GPP in the tropics.
4. Results
4.1. Characteristics of the Spatial and Temporal Distribution of Gross Primary Productivity of Vegetation in the Tropics
4.1.1. Characteristics of the Temporal Distribution of Gross Primary Productivity of Vegetation in the Tropics
The magnitude of total vegetation primary productivity (GPP) is an important indicator for evaluating the quality of vegetation in terrestrial ecosystems. The graph illustrating the trend of the annual average value of the gross primary productivity of vegetation in the study area from 2001 to 2020 (Figure 3) shows that the overall GPP exhibited a fluctuating and increasing trend over the past 20 years. The correlation coefficient R2 is 0.90, indicating a strong linear relationship. Specifically, the average GPP of vegetation increased from 2557.08 g·cm−2a−1 in 2001 to 2757.11 g·cm−2a−1 in 2020, representing an increase of 7.82% (Figure 3). The average GPP over the 20 years was 2665.19 g·cm−2a−1, with an average annual rate of increase of 10.21 g·cm−2a−1, which was statistically significant (p < 0.05). Vegetation GPP varied from 2511.28 to 2757.11 g·cm−2a−1, with the lowest value occurring in 2002, representing a 5.77% decrease from the 20-year average GPP, and the highest value occurring in 2020, representing a 3.45% increase from the 20-year average GPP. The fluctuation of the data over the 20 years was small and observable. The GPP data exhibited minor declines in the years 2002, 2005, 2014, and 2016, indicating a slight decrease in the gross primary productivity of vegetation compared to the previous year. Conversely, small peaks were observed in 2001, 2006, 2015, and 2020, indicating a slight increase in the gross primary productivity of vegetation compared to the previous year. These fluctuations may be influenced by various factors, such as climate change, land cover change, and human activities. Despite some annual fluctuations, the overall trend shows steady growth.
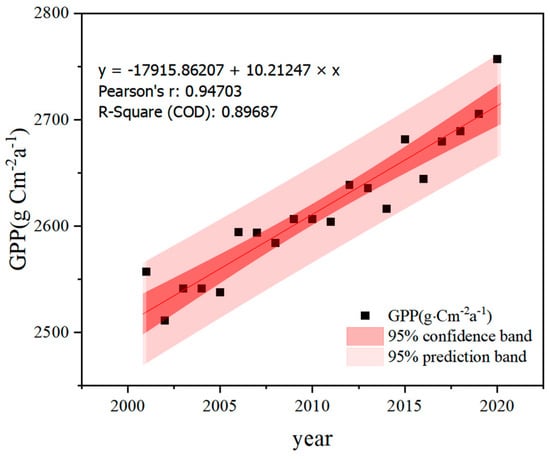
Figure 3.
Interannual variation of vegetation GPP in the tropical zone from 2001 to 2020 (COD indicates the coefficient of determination for the data).
4.1.2. Characteristics of the Spatial Distribution of Gross Primary Productivity of Vegetation in the Tropics
The spatial distribution of vegetation GPP in the tropics (Figure 4) demonstrates that the tropics as a whole exhibit a high level of gross primary productivity, with high GPP concentrated in a limited area of southern North America, the majority of northern and central South America, central Africa, and the southern islands of Asia, while low GPP is observed in the western mountain ranges of South America, northern and southern Africa, the Indian Peninsula, and the majority of Oceania. In general, GPP is higher in the inland plains of the tropics and lower in coastal areas and in areas with special topography, such as deserts and mountains. With the exception of areas with special topography, such as deserts, GPP in the tropics tends to be higher in the northern hemisphere and lower in the southern hemisphere.
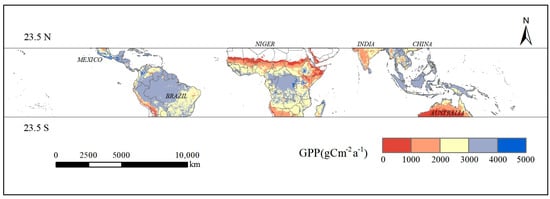
Figure 4.
Spatial distribution of the average annual vegetation GPP from 2001 to 2020 in the tropical zone.
The analysis of the trend of the annual average value of vegetation GPP (Figure 5) reveals that the majority of regions exhibit an increasing trend in GPP. Conversely, the regions displaying the least notable increase in GPP are concentrated in mountainous and plateau regions of South America and Africa, coastal areas of the southern islands of Asia, and the transition between shrubland and grassland in Oceania. Significant decline is observed, with the most notable losses occurring on the island of New Guinea. Conversely, the areas with a non-significant decrease are more dispersed and mainly located in the grassland region of Oceania. Finally, the areas with non-significant change are concentrated in the bare areas of Africa, specifically the Sahara Desert. A comparison of the spatial distribution of vegetation GPP in the tropics (Figure 4) reveals a positive correlation between the magnitude of GPP and the positivity, negativity, and significance of GPP growth. Regions with higher GPP values, such as the southern part of North America, the northern and central parts of South America, and the central part of Africa, have shown significant positive growth in GPP. In contrast, regions with lower GPP values, such as the western mountain ranges of South America, the northern and southern parts of Africa, and Oceania, have shown significant positive growth in GPP. Additionally, the northern and southern regions of South America, as well as Oceania, have exhibited non-significant positive or negative growth in GPP.
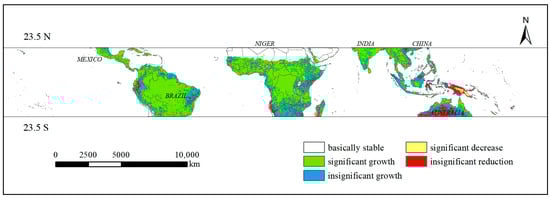
Figure 5.
Trend chart of the annual mean GPP of vegetation in the tropical zone from 2001 to 2020.
4.2. Impact of Climatic Factors on GPP
In order to spatially analyze the effects of temperature and precipitation on GPP, the correlation between vegetation GPP and temperature and precipitation in the tropics was calculated image by image and expressed as the magnitude of partial correlation coefficients and complex correlation coefficients (Figure 6). A positive partial correlation coefficient indicates that when temperature (or precipitation) increases in the region, GPP also increases, reflecting a positive correlation. Conversely, a negative partial correlation coefficient indicates that temperature (or precipitation) in the region is negatively correlated with GPP. The complex correlation coefficient indicates the combined effect of temperature and precipitation on the GPP of vegetation in the region. A positive complex correlation coefficient indicates a positive correlation between climate and GPP, whereas a negative complex correlation coefficient indicates a negative correlation between climate and GPP. The closer the absolute value of the correlation coefficient is to 0, the smaller the effect of climate change on GPP in the region; conversely, the closer the absolute value is to 1, the larger the effect of climate change on GPP in the region.
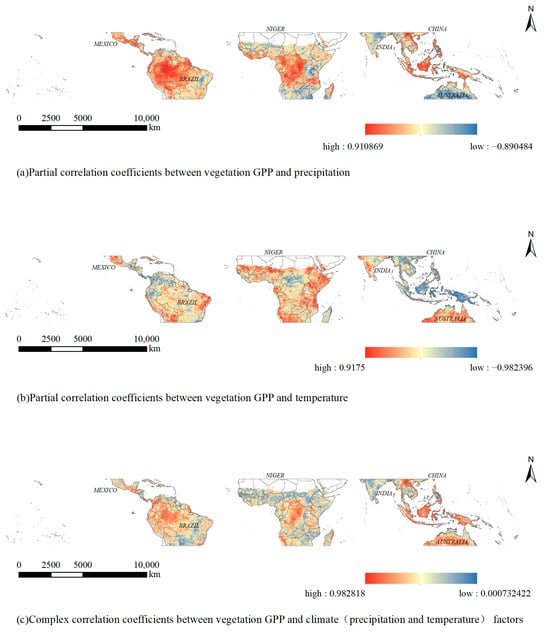
Figure 6.
Plot of partial correlation and complex correlation coefficients between vegetation GPP and climate (precipitation and temperature) factors in the tropical zone from 2001 to 2020.
The results indicate that the coefficient of partial correlation between vegetation GPP and precipitation exhibits fluctuations within the range of −0.89 to 0.91, with a mean value of 0.21, indicating an overall positive correlation (Figure 6a). The regions exhibiting a high positive bias correlation between vegetation GPP and precipitation in the tropics were primarily concentrated in South America and central Africa, along with the southern archipelago of Asia. Conversely, the regions displaying a high negative bias correlation were predominantly situated in eastern South America, southern and eastern Africa, the Indian Peninsula, and Oceania.
A review of the bias correlation coefficient of temperature and GPP (Figure 6b) reveals a fluctuation range of −0.98~0.92, with an average value of −0.011, indicating an overall negative correlation. The regions exhibiting a high positive correlation between vegetation GPP and air temperature in the tropics are primarily located in the eastern and western regions of South America and the coast of Africa. Conversely, the northwestern region of South America, the central region of Africa, and the southern region of Asia exhibit a high negative correlation.
A plot of the complex correlation coefficients between climate and GPP (Figure 6c) reveals that regions with strong positive correlations between climate factors and GPP are mainly located in South America and central Africa, the southeastern islands of Asia, and central Oceania. This indicates that the GPP in these regions increases significantly when the temperature increases. The regions with strong negative correlations are located in the northern and southern parts of South America, the coastal areas of Africa, and the Indian Peninsula. These regions exhibit stronger negative correlations, suggesting that GPP in these regions decreases significantly when temperatures increase and precipitation increases. A comparison of the three images in Figure 6 reveals that the degree of similarity between Figure 6a,c is greater than that between Figure 6b,c. This indicates that the biased correlation between vegetation GPP and precipitation is stronger than that between temperature and precipitation. In other words, the influence of precipitation on GPP is greater than that of temperature.
4.3. Impact of Land Cover Type Transformation on Gross Primary Productivity
The map of land cover types in 2001–2020 (Figure 7) indicates that the following land cover types are more intensively distributed: evergreen broad-leaf forest is concentrated in the Amazon rainforest in the central part of South America, in the central part of Africa, and in Southeast Asia; broadleaved deciduous forest is concentrated in southern and central Africa; cropland is concentrated in eastern South America and southern Asia; grassland is concentrated in central Australia; and bare areas are concentrated in the desert areas of northern Africa. The main land cover types in the tropics are cropland and various forests. The most transferred type is evergreen broad-leaf forest, covering a total of 5.44 × 10⁵ km2. It is primarily transferred to mosaic cropland (2.66 × 10⁵ km2), tree mixed (5.80 × 10⁴ km2), and shrubland (5.33 × 10⁴ km2). This is followed by shrubland and mosaic cropland, covering 3.62 × 10⁵ km2 and 2.83 × 10⁴ km2, respectively. The largest transfer is mosaic cropland, totaling 3.79 × 10⁵ km2, composed of evergreen broad-leaf forest (2.66 × 10⁵ km2). The area of water bodies remains relatively stable with little change. The urban area, although relatively small, is increasing, with its transferred area much larger than the transferred area. At the macro level, the land where land cover type transfer occurs accounts for 4.39% of the total area, which is relatively small. The vast majority of the tropics remain unchanged in terms of land cover type.
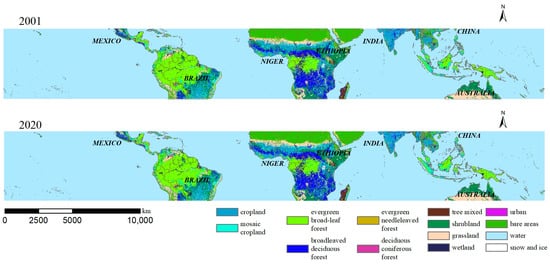
Figure 7.
Spatial distribution map of land cover type transfer in the tropical zone from 2001 to 2020.
From the land cover type maps of the tropical region in 2001 and 2020, we can calculate the amount of vegetation GPP transfer caused by changes in land cover types and derive the land use transfer matrix for the period of 2001–2020 (Table 3). Over the 20-year span, the cumulative area of land cover types transferred out exceeds one million nine hundred thousand hectares. The impact of land cover type conversion on GPP primarily manifests in two scenarios: firstly, the conversion of diverse land types into evergreen needle-leaved forest, cropland, or bare areas; secondly, the transformation of mosaic cropland, grassland, and bare areas into cropland leads to an increase in GPP. Cropland exhibited the highest total GPP transfer, with an increase of 5.54 × 10⁶ GgC, while grassland showed the greatest decrease in total GPP transfer, amounting to 8.85 × 10⁴ GgC. Additionally, the highest total GPP transfer occurred from bare areas, with an increase of 1.06 × 10⁷ GgC. Grassland, snow, and ice also exhibited significant total GPP transfers, amounting to 6.84 × 10⁶ GgC and 4.33 × 10⁶ GgC, respectively. The most substantial decrease in total transfer was observed in evergreen broad-leaf forest, with a decrease of 5.03 × 10⁶ GgC. Moreover, evergreen needle-leaved forest experienced a considerable decrease in total transfer, totaling 3.63 × 10⁶ GgC. The data reveals that mutual transfers among forests, grasslands, and croplands are more frequent within the tropics.
Table 3.
GPP transfer matrix of vegetation in the tropical zone from 2001 to 2020 (GgC).
4.4. Relative Contribution of Climate Change and Land Cover Change to Vegetation GPP Change
A contribution rate analysis (Figure 8) revealed that deciduous coniferous forest, tree mixed, and urban land types in the tropics contributed more to the change in total vegetation GPP than did climate change. The remaining land types used climate change as the dominant factor affecting local vegetation GPP. Among the land cover types, the urban area exhibited the highest contribution of land cover change to the change in total GPP, reaching 90%. The deciduous coniferous forest area also exhibited a notable contribution of 61.25%. Conversely, the tree mixed area exhibited a relatively modest contribution of 49.99%, with a 3.67% increase due to land cover change compared to climate change. Upon examination of the contribution rates of the two factors, it can be observed that overall climate change was significantly more influential than land cover change. In most areas, climate change contributed more than 70% to total vegetation GPP change. The land types with the highest contribution rates of climate change to GPP change were wetland and cropland, accounting for 95.12% and 89.42%, respectively. Additionally, water, snow and ice, and bare areas exhibited higher contribution rates to climate change, at 99.96%, 99.7%, and 85.96%, respectively. However, the local vegetation GPP production was extremely low, rendering the results inconclusive. In summary, climate change is the most significant factor influencing vegetation GPP in the tropics.
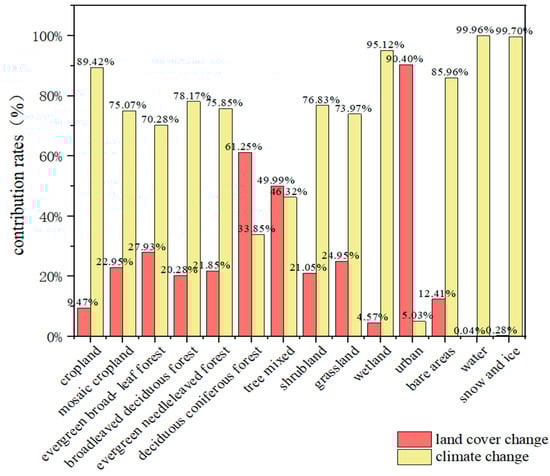
Figure 8.
Comparison of impacts and contribution rates of climate change and land cover change on the total GPP of different land cover types from 2001 to 2020.
5. Discussion
5.1. Overall Increasing Trend in Tropical GPP
The results of this study showed that the mean GPP of vegetation in the tropics exhibited an increasing trend from 2001 to 2020. Among them, the tropical regions located near the equator had the highest GPP, with GPP unit area estimates exceeding 2000 g·cm−2year−1, which is consistent with what has been reported so far [16,17,46]. Bo et al. showed that GPP increased by 3.9% per decade. The GPP obtained in this experiment increased by 7.82% over the 20-year period, with an average increase of 3.91% per decade [47], which is basically consistent with the experimental results of Bo et al. The regions with more significant growth are mainly located in South America, Central Africa, and parts of South Asia. While Zhao et al. found that most of the vegetation GPP in the highlands showed a decreasing trend [48], the higher altitude areas in this experiment, such as the Andes in western South America, also showed a decreasing trend in the vegetation GPP; however, the GPP in the plains increased more rapidly, which is hypothesized to be affected by topographic factors. Overall, the regions with increasing trends in GPP in the tropics are mostly north of the equator, and the regions with decreasing trends are mostly south of the equator. Among them, the change in GPP in the Australian region is not significant, while the Southeast Asian region primarily exhibits a decreasing trend, which is somewhat consistent with existing studies [18,19].
5.2. Analysis of the Transmission Situation of GPP
Over the past two decades, transformations in land cover types have significantly influenced GPP in two primary ways. Firstly, the conversion of various land uses into forests, shrublands, and other green spaces has led to an increase in GPP. Secondly, transformations into bare areas and cropland have resulted in a decrease in GPP. These changes underscore the critical role that land degradation and the conversion of forested areas into agricultural land play in diminishing GPP. Consequently, it is crucial to focus on mitigating the decline in productivity that results from the conversion of broadleaf forests into cropland. Such efforts are aimed at enhancing forest cover, thereby promoting increased vegetation productivity [49]. Additionally, specific measures to implement the Returning Farmland to Forest Program (RFFP) should be considered. To ensure the effectiveness of future forest policies, they must be crafted with a comprehensive understanding of the specific regional context and the prevailing natural and socioeconomic conditions [50].
5.3. Climate and Land Cover Regulation of GPP in the Tropics
GPP changes in the tropics are influenced by a combination of temperature and precipitation factors, but precipitation is the main driver affecting GPP changes overall, consistent with the findings of Sun et al. [15]. In coastal areas, GPP was positively correlated with temperature and negatively correlated with precipitation, while in inland areas, the opposite was true. This may be due to the fact that inland areas are relatively drier and plant growth is limited by precipitation, while high temperatures accelerate the rate of water transpiration; conversely, in coastal areas, where precipitation is abundant, temperature becomes the limiting factor for growth. The partial correlation between vegetation GPP and precipitation in the tropics was more significant than that of temperature, indicating that precipitation conditions predominated the growth of vegetation GPP in the tropics among the two climatic factors of temperature and precipitation. In general, the vast majority of the tropical region has high temperatures throughout the year, and changes in temperature have a relatively small impact on vegetation growth; meanwhile, the precipitation factor, with its differences in spatial and temporal distribution, is the main factor affecting GPP.
Bai et al. showed that in arid and tropical regions [19], vegetation productivity is usually limited by water availability. In contrast, high temperatures extend the length of the growing season, thereby increasing vegetation productivity. However, high temperatures also promote evapotranspiration, which may lead to severe water loss and inhibit the growth of vegetation productivity. The inland areas of the tropics are more arid, and the influencing factors of vegetation GPP changes are similar to the findings of He et al. [51], Zhang et al. [52], and Wang et al. [53], indicating precipitation is the main regulator of GPP changes in the arid region, whereas the coastal areas are more humid, and the results of the study are similar to those of Tian et al. [54] and Wang et al. [55], indicating the GPP changes in the humid region are mainly regulated by air temperature. In the wet region, increased precipitation led to both insufficient sunshine hours and temperature conditions as well as the root system of vegetation being soaked by water and unable to carry out aerobic respiration, thus affecting the efficiency of nutrient and water uptake and limiting the growth and development of the vegetation. Yang et al. showed that [56] in the more arid region (the precipitation in the growing season was less than 200 mm), the aboveground biomass was negatively correlated with the temperature, while in the wet region (the precipitation in the growing season was less than 200 mm), the aboveground biomass was negatively correlated with the temperature. wetter areas (growing season precipitation over 200 mm), aboveground biomass was weakly positively correlated with temperature, which was consistent with the results of this experiment.
Land cover change plays a major role in GPP change [15]. The areas in the tropics where land cover change is the main driver are deciduous coniferous forest, tree mixed, and urban areas, mostly distributed in the central part of South America, central and southeastern Africa, and Madagascar Island, while the rest of the areas are more affected by climatic factors. Sun et al.’s results showed that the largest negative effect on GPP change comes from land cover change [15], and these negatively affected areas are concentrated in South America, Eurasian tropical rainforests, and tropical dry forests in Africa, i.e., the central part of South America and Africa, as well as Southeast Asia. Hou et al. showed that land cover change has a more significant negative impact on GPP in southeastern South America [57], eastern and central Africa, and the Indian Peninsula, and in Southeast Asia, on the other hand, showed a slight positive impact. Both papers mention that South America and Central Africa in the tropics are more negatively affected by land cover change, which is consistent with the results of this paper. The opposite results were found for Southeast Asia, which may be due to the fact that vegetation growth in Southeast Asia is mainly driven by climatic factors, which may interfere with the local land cover impacts.
The synthesis of the full analysis shows that vegetation in the tropics is subject to the combined effects of climate change and land cover change. Among them, land cover change has a relatively weak ability to regulate tropical GPP, which is mainly reflected in a slight negative impact on regions such as the central part of South America, the central part of Africa, and the southeastern island of Madagascar, with climate change as the main driver in the rest of the regions. Of the two climate factors, temperature and precipitation, precipitation is the main influence on GPP changes in tropical vegetation. The findings of this study can provide data for GPP estimation, carbon emissions, and sustainable development in the tropics.
5.4. Summaries and Limitations
In this paper, the improved P model was used to calculate the gross primary productivity (GPP) of vegetation in the tropics using remote sensing data and meteorological reanalysis information. The spatial and temporal distribution trend of GPP in the tropics and the influence mechanisms of factors such as temperature and land cover change were explored through Pearson correlation analysis and contribution analysis. The results indicated that the annual average value of GPP in the tropics exhibited a fluctuating pattern, ranging from 2603.9 to 2757.1 cm−2 a−1. GPP showed a significant increasing trend over the past 20 years. With regard to the factors influencing GPP, it can be observed that climate exerts its influence primarily in inland areas, where precipitation is the dominant factor, whereas in coastal areas, temperature is the primary determinant. The average annual GPP exhibited a significant variation among different land cover types. The conversion of bare land into cropland was associated with the largest increase in GPP, amounting to 1.38 × 10⁷ GgC, while the conversion of broadleaf evergreen forest into cropland was associated with the largest decrease in GPP, amounting to 4.96 × 10⁶ GgC. By calculating the contribution of the influencing factors, with the exception of mixed forests, deciduous coniferous forests, and urban areas, where the main influencing factor for GPP was land cover change, the other regions were climate change factors. These findings indicate that climate has a significant effect on tropical vegetation productivity, and in the context of global climate change, it is crucial to identify strategies to reduce the negative impact of climate change on productivity.
Clearly, this study has its limitations. Primarily, the analysis of the spatiotemporal evolution pattern of GPP in the tropics did not include a comparison with existing GPP products. Furthermore, combining multi-source datasets would be beneficial to derive more reliable conclusions. Secondly, when analyzing the impact of climate change on vegetation GPP in the tropics, only two climate factors, temperature and precipitation, were considered, while other climate factors, such as surface scattering and solar radiation, also play a role in influencing GPP growth. Thirdly, the remote sensing data employed to calculate and analyze GPP have low temporal and spatial resolution, limiting the analysis of its long-term, large-scale evolution pattern. Additionally, in order to facilitate the calculation and analysis, reclassifying the initial dataset’s 38 land types into 14 may have reduced the accuracy of the study. In future studies, expanding the data sources, utilizing satellite or drone data with higher resolution and timeliness, and constructing more sophisticated models should be considered to enhance the objectivity and credibility of the analysis results.
6. Conclusions
In this study, the enhanced P model was utilized to GPP of tropical vegetation, employing remote sensing data and meteorological reanalysis. We analyzed the spatial and temporal trends of GPP and investigated the impacts of temperature and land cover changes using Pearson correlation analysis and contribution assessments.
- (1)
- Trend Analysis: The annual average value of GPP in the tropics exhibited a fluctuating pattern, ranging from 2603.9 to 2757.1 cm−2 a−1. GPP showed a significant increasing trend over the past 20 years.
- (2)
- Climate Influence: In inland areas, precipitation significantly affected GPP, while temperature was a more decisive factor in coastal regions.
- (3)
- Land Cover Impact: There were notable differences in annual GPP among various land cover types. Specifically, converting bare land to cropland resulted in the most substantial increase in GPP, whereas the transformation of broadleaf evergreen forests into cropland led to the most pronounced decline.
- (4)
- Combined Effects of Climate and Land Cover Change: While land cover change was the primary driver of GPP alterations in mixed forests, deciduous coniferous forests, and urban areas, climate change factors predominantly influenced GPP in other regions.
Author Contributions
Conceptualization, Y.C. and S.Z.; methodology, Y.C. and S.Z.; validation, Y.C.; formal analysis, Y.C.; investigation, Y.C.; resources, Y.C., S.Z. and J.G.; data curation, Y.C. and S.Z.; writing—original draft preparation, Y.C. and Y.S.; writing—review and editing, Y.C., S.Z., J.G. and Y.S.; visualization, Y.C.; supervision, Y.S.; project administration, Y.S.; funding acquisition, Y.S. All authors have read and agreed to the published version of the manuscript.
Funding
This research was jointly funded by the National Natural Science Foundation of China, grant number 42361053, the Hainan Provincial Natural Science Foundation of China, grant number 422RC598, and start-up fund of Hainan University, grant number KYQD(ZR)22081.
Data Availability Statement
Data is contained within the article.
Conflicts of Interest
The authors declare no conflicts of interest.
References
- Fang, J.; Yu, G.; Liu, L.; Hu, S.; Chapin III, F.S. Climate change, human impacts, and carbon sequestration in China. Proc. Natl. Acad. Sci. USA 2018, 115, 4015–4020. [Google Scholar] [CrossRef] [PubMed]
- Shi, Z.; Wang, Y.; Zhao, Q.; Zhang, L.; Zhu, C. The spatiotemporal changes of NPP and its driving mechanisms in China from 2001 to 2020. Ecol. Environ. 2022, 31, 2111. [Google Scholar]
- Koffi, E.; Rayner, P.; Scholze, M.; Beer, C. Atmospheric constraints on gross primary productivity and net ecosystem productivity: Results from a carbon-cycle data assimilation system. Glob. Biogeochem. Cycles 2012, 26, 1024. [Google Scholar] [CrossRef]
- Von Caemmerer, S.; Furbank, R.T. Modeling C4 photosynthesis. C4 Plant Biology. 1999, 173–211. [Google Scholar]
- Chagas, M.C.; Delgado, R.C.; de Souza, L.P.; de Carvalho, D.C.; Pereira, M.G.; Teodoro, P.E.; Junior, C.A.S. Gross primary productivity in areas of different land cover in the western Brazilian Amazon. Remote Sens. Appl. Soc. 2019, 16, 100259. [Google Scholar] [CrossRef]
- Canadell, J.G.; Le Quéré, C.; Raupach, M.R.; Field, C.B.; Buitenhuis, E.T.; Ciais, P.; Conway, T.J.; Gillett, N.P.; Houghton, R.; Marland, G. Contributions to accelerating atmospheric CO2 growth from economic activity, carbon intensity, and efficiency of natural sinks. Proc. Natl. Acad. Sci. 2007, 104, 18866–18870. [Google Scholar] [CrossRef] [PubMed]
- Zhao, M.; Running, S.W. Drought-induced reduction in global terrestrial net primary production from 2000 through 2009. Science 2010, 329, 940–943. [Google Scholar] [CrossRef] [PubMed]
- Baccini, A.; Goetz, S.; Walker, W.; Laporte, N.; Sun, M.; Sulla-Menashe, D.; Hackler, J.; Beck, P.; Dubayah, R.; Friedl, M. Estimated carbon dioxide emissions from tropical deforestation improved by carbon-density maps. Nat. Clim. Change 2012, 2, 182–185. [Google Scholar] [CrossRef]
- Bello, C.; Galetti, M.; Pizo, M.A.; Magnago, L.F.S.; Rocha, M.F.; Lima, R.A.; Peres, C.A.; Ovaskainen, O.; Jordano, P. Defaunation affects carbon storage in tropical forests. Sci. Adv. 2015, 1, e1501105. [Google Scholar] [CrossRef] [PubMed]
- Qi, C.; Cao, F.; Cao, S. Debate around tropical forests: Carbon sink or carbon source. Acta Ecol. Sin. 2010, 30, 6613–6623. [Google Scholar]
- Krause, A.; Papastefanou, P.; Gregor, K.; Layritz, L.S.; Zang, C.S.; Buras, A.; Li, X.; Xiao, J.; Rammig, A. Quantifying the impacts of land cover change on gross primary productivity globally. Sci. Rep. 2022, 12, 18398. [Google Scholar] [CrossRef] [PubMed]
- de Souza, C.R.; Coelho de Souza, F.; Maia, V.A.; de Aguiar-Campos, N.; Coelho, P.A.; Farrapo, C.L.; Santos, A.B.; Araújo, F.C.; Gianasi, F.M.; Paula, G.G. Tropical forests structure and diversity: A comparison of methodological choices. Methods Ecol. Evol. 2021, 12, 2017–2027. [Google Scholar] [CrossRef]
- Madani, N.; Parazoo, N.C.; Kimball, J.S.; Ballantyne, A.P.; Reichle, R.H.; Maneta, M.; Saatchi, S.; Palmer, P.I.; Liu, Z.; Tagesson, T. Recent amplified global gross primary productivity due to temperature increase is offset by reduced productivity due to water constraints. AGU Adv. 2020, 1, e2020AV000180. [Google Scholar] [CrossRef]
- Lv, Y.; Li, X.; Chi, W. Maximum Gross Primary Productivity Dominates the Trend in Gross Primary Productivity in China’s Deciduous Forest Ecosystems. Forests 2023, 14, 1880. [Google Scholar] [CrossRef]
- Sun, Z.; Wang, X.; Yamamoto, H.; Tani, H.; Zhong, G.; Yin, S.; Guo, E. Spatial pattern of GPP variations in terrestrial ecosystems and its drivers: Climatic factors, CO2 concentration and land-cover change, 1982–2015. Ecol. Inform. 2018, 46, 156–165. [Google Scholar] [CrossRef]
- Dong, J.; Li, L.; Li, Y.; Yu, Q. Inter-comparisons of mean, trend and interannual variability of global terrestrial gross primary production retrieved from remote sensing approach. Sci. Total Environ. 2022, 822, 153343. [Google Scholar] [CrossRef] [PubMed]
- Lu, Q.; Liu, H.; Wei, L.; Zhong, Y.; Zhou, Z. Global prediction of gross primary productivity under future climate change. Sci. Total Environ. 2024, 912, 169239. [Google Scholar] [CrossRef] [PubMed]
- Chen, M.; Rafique, R.; Asrar, G.R.; Bond-Lamberty, B.; Ciais, P.; Zhao, F.; Reyer, C.P.; Ostberg, S.; Chang, J.; Ito, A. Regional contribution to variability and trends of global gross primary productivity. Environ. Res. Lett. 2017, 12, 105005. [Google Scholar] [CrossRef]
- Bai, Y.; Liang, S.; Jia, A.; Li, S. Different Satellite Products Revealing Variable Trends in Global Gross Primary Production. J. Geophys. Res. Biogeosci. 2023, 128, e2022JG006918. [Google Scholar] [CrossRef]
- Keeling, C.D.; Chin, J.; Whorf, T. Increased activity of northern vegetation inferred from atmospheric CO2 measurements. Nature 1996, 382, 146–149. [Google Scholar] [CrossRef]
- Myneni, R.B.; Keeling, C.; Tucker, C.J.; Asrar, G.; Nemani, R.R. Increased plant growth in the northern high latitudes from 1981 to 1991. Nature 1997, 386, 698–702. [Google Scholar] [CrossRef]
- Piao, S.; Fang, J.; Zhou, L.; Ciais, P.; Zhu, B. Variations in satellite-derived phenology in China’s temperate vegetation. Glob. Change Biol. 2006, 12, 672–685. [Google Scholar] [CrossRef]
- Pan, Y.; Birdsey, R.; Hom, J.; McCullough, K. Separating effects of changes in atmospheric composition, climate and land-use on carbon sequestration of US Mid-Atlantic temperate forests. For. Ecol. Manag. 2009, 259, 151–164. [Google Scholar] [CrossRef]
- Fang, J.; Chen, A.; Peng, C.; Zhao, S.; Ci, L. Changes in forest biomass carbon storage in China between 1949 and 1998. Science 2001, 292, 2320–2322. [Google Scholar] [CrossRef] [PubMed]
- Pan, Y.; Chen, J.; Birdsey, R.; McCullough, K.; He, L.; Deng, F. Age structure and disturbance legacy of North American forests. Biogeosciences 2011, 8, 715–732. [Google Scholar] [CrossRef]
- Wang, S.; Zhang, Y.; Ju, W.; Chen, J.M.; Ciais, P.; Cescatti, A.; Sardans, J.; Janssens, I.A.; Wu, M.; Berry, J.A.J.S. Recent global decline of CO2 fertilization effects on vegetation photosynthesis. Science 2020, 370, 1295–1300. [Google Scholar] [CrossRef] [PubMed]
- Liu, J.; Bowman, K.W.; Schimel, D.S.; Parazoo, N.C.; Jiang, Z.; Lee, M.; Bloom, A.A.; Wunch, D.; Frankenberg, C.; Sun, Y. Contrasting carbon cycle responses of the tropical continents to the 2015–2016 El Niño. Science 2017, 358, eaam5690. [Google Scholar] [CrossRef] [PubMed]
- Schulteâ Uebbing, L.; de Vries, W. Globalâ scale impacts of nitrogen deposition on tree carbon sequestration in tropical, temperate, and boreal forests: A metaâ analysis. Glob. Change Biol. 2018, 24, e416–e431. [Google Scholar]
- Fleischer, K.; Dolman, A.; van Der Molen, M.K.; Rebel, K.T.; Erisman, J.W.; Wassen, M.J.; Pak, B.; Lu, X.; Rammig, A.; Wang, Y.P. Nitrogen deposition maintains a positive effect on terrestrial carbon sequestration in the 21st century despite growing phosphorus limitation at regional scales. Glob. Biogeochem. Cycles 2019, 33, 810–824. [Google Scholar] [CrossRef]
- Hou, W.; Jin, J.; Yan, T. A Satellite-Based Dataset of Global Atmospheric Carbon Dioxide Concentration with a Spa-tial Resolution of 2 × 2.5 from 1992 to 2020. J. Glob. Chang. Data Discov. 2022, 2, 191–199. [Google Scholar]
- Zhang, Z.; Ju, W.; Li, X.; Cheng, X.; Zhou, Y.; Xu, S.; Liu, C.; Li, J.J.A.; Meteorology, F. Joint improvement on absorbed photosynthetically active radiation and intrinsic quantum yield efficiency algorithms in the P model betters the estimate of terrestrial gross primary productivity. Agric. For. Meteorol. 2024, 346, 109883. [Google Scholar] [CrossRef]
- Yu, T.; Sun, R.; Xiao, Z.; Zhang, Q.; Liu, G.; Cui, T.; Wang, J. Estimation of global vegetation productivity from global land surface satellite data. Remote Sens. 2018, 10, 327. [Google Scholar] [CrossRef]
- Franzke, C.L.; Graves, T.; Watkins, N.W.; Gramacy, R.B.; Hughes, C. Robustness of estimators of long-range dependence and self-similarity under non-Gaussianity. Philos. Trans. R. Soc. A Math. Phys. Eng. Sci. 2012, 370, 1250–1267. [Google Scholar] [CrossRef] [PubMed]
- Porcar-Castell, A.; Tyystjärvi, E.; Atherton, J.; Van der Tol, C.; Flexas, J.; Pfündel, E.E.; Moreno, J.; Frankenberg, C.; Berry, J.A. Linking chlorophyll a fluorescence to photosynthesis for remote sensing applications: Mechanisms and challenges. J. Exp. Bot. 2014, 65, 4065–4095. [Google Scholar] [CrossRef] [PubMed]
- Shi, X.; Shi, M.; Zhang, N.; Wu, M.; Ding, H.; Li, Y.; Chen, F. Effects of climate change and human activities on gross primary productivity in the Heihe River Basin, China. Environ. Sci. Pollut. Res. 2023, 30, 4230–4244. [Google Scholar] [CrossRef] [PubMed]
- Zhang, Z.; Li, X.; Ju, W.; Zhou, Y.; Cheng, X. Improved estimation of global gross primary productivity during 1981–2020 using the optimized P model. Sci. Total Environ. 2022, 838, 156172. [Google Scholar] [CrossRef] [PubMed]
- Zhao, P.; Bai, Y.; Zhang, Z.; Wang, L.; Guo, J.; Wang, J. Differences in diffuse photosynthetically active radiation effects on cropland light use efficiency calculated via contemporary remote sensing and crop production models. Ecol. Inform. 2023, 73, 101948. [Google Scholar] [CrossRef]
- Ren, Y.; Yang, K.; Wang, H.; Zhao, L.; Chen, Y.; Zhou, X.; La, Z. The South Asia monsoon break promotes grass growth on the Tibetan Plateau. J. Geophys. Res. Biogeosci. 2021, 126, e2020JG005951. [Google Scholar] [CrossRef]
- Wang, H.; Prentice, I.C.; Keenan, T.F.; Davis, T.W.; Wright, I.J.; Cornwell, W.K.; Evans, B.J.; Peng, C. Towards a universal model for carbon dioxide uptake by plants. Nat. Plants 2017, 3, 734–741. [Google Scholar] [CrossRef] [PubMed]
- Stocker, B.D.; Wang, H.; Smith, N.G.; Harrison, S.P.; Keenan, T.F.; Sandoval, D.; Davis, T.; Prentice, I.C. P-model v1. 0: An optimality-based light use efficiency model for simulating ecosystem gross primary production. Geosci. Model Dev. 2020, 13, 1545–1581. [Google Scholar] [CrossRef]
- Anav, A.; Friedlingstein, P.; Beer, C.; Ciais, P.; Harper, A.; Jones, C.; Murray-Tortarolo, G.; Papale, D.; Parazoo, N.C.; Peylin, P. Spatiotemporal patterns of terrestrial gross primary production: A review. Rev. Geophys. 2015, 53, 785–818. [Google Scholar] [CrossRef]
- Lambin, E.F.; Geist, H.J.; Lepers, E. Dynamics of land-use and land-cover change in tropical regions. Annu. Rev. Environ. Resour. 2003, 28, 205–241. [Google Scholar] [CrossRef]
- Janzen, D.H. The future of tropical ecology. Annu. Rev. Ecol. Syst. 1986, 17, 305–324. [Google Scholar] [CrossRef]
- Roth, M. Review of urban climate research in (sub) tropical regions. Int. J. Climatol. A J. R. Meteorol. Soc. 2007, 27, 1859–1873. [Google Scholar] [CrossRef]
- Hicke, J.A.; Lobell, D.B.; Asner, G.P. Cropland area and net primary production computed from 30 years of USDA agricultural harvest data. Earth Interact. 2004, 8, 1–20. [Google Scholar] [CrossRef]
- Huang, Y.; Yang, S.; Zhao, H. Distinct Contributions of Climate Change and Anthropogenic Activities to Evapotranspiration and Gross Primary Production Variations over Mainland China. Remote Sens. 2024, 16, 475. [Google Scholar] [CrossRef]
- Bo, Y.; Li, X.; Liu, K.; Wang, S.; Zhang, H.; Gao, X.; Zhang, X. Three decades of gross primary production (GPP) in China: Variations, trends, attributions, and prediction inferred from multiple datasets and time series modeling. Remote Sens. 2022, 14, 2564. [Google Scholar] [CrossRef]
- Zhao, X.; Luo, M.; Meng, F.; Sa, C.; Bao, S.; Bao, Y. Spatiotemporal changes of gross primary productivity and its response to drought in the Mongolian Plateau under climate change. J. Arid. Land 2024, 16, 46–70. [Google Scholar] [CrossRef]
- Li, J.; Liu, Y.; Hai, X.; Shangguan, Z.; Deng, L. Dynamics of soil microbial C: N: P stoichiometry and its driving mechanisms following natural vegetation restoration after farmland abandonment. Sci. Total Environ. 2019, 693, 133613. [Google Scholar] [CrossRef] [PubMed]
- Li, W.; Wang, W.; Chen, J.; Zhang, Z. Assessing effects of the Returning Farmland to Forest Program on vegetation cover changes at multiple spatial scales: The case of northwest Yunnan, China. J. Environ. Manag. 2022, 304, 114303. [Google Scholar] [CrossRef] [PubMed]
- He, P.; Ma, X.; Sun, Z.; Han, Z.; Ma, S.; Meng, X. Compound drought constrains gross primary productivity in Chinese grasslands. Environ. Res. Lett. 2022, 17, 104054. [Google Scholar] [CrossRef]
- Zhang, J.; Zhang, C.; Zhang, A.; Fang, M.; Wu, M.; Lin, Z.; Zhang, Y.; Song, X. Relative effects of hydrothermal fluctuation and land cover changes on vegetation net primary productivity in Northeast China. Acta Oceanol. Sin. 2020, 40, 7733–7744. [Google Scholar]
- Wang, J.; Zhao, A.; Zhang, Z.; Zhang, A.; Hu, X. Spatio-temporal evolution of vegetation net primary productivity and its driving factors in Beijing-Tianjin-Hebei region from 2000 to 2018. Ecol. Sci. 2021, 40, 103–111. (In Chinese) [Google Scholar] [CrossRef]
- Yichao, T.; Tang, Y.; Xin, X. Temporal and spatial distribution characteristics and influencing factors of net primary productivity of vegetation in typical basin entering the sea in Beibu Gulf. Ecol. Environ. 2021, 30, 938. [Google Scholar]
- Wang, S.; Lu, D.; Chen, Y.; Tang, Y.; Zheng, Y.; Huang, Y. Spatial-temporal evolution characteristics and influencing factors of net primary vegetation productivity in Xiamen-Zhangzhou-Quanzhou Region from 2001 to 2020. Chin. J. Ecol. 2023, 43, 823–832. [Google Scholar]
- Yang, Y.; Fang, J.; Pan, Y.; Ji, C. Aboveground biomass in Tibetan grasslands. J. Arid. Environ. 2009, 73, 91–95. [Google Scholar] [CrossRef]
- Hou, H.; Zhou, B.B.; Pei, F.; Hu, G.; Su, Z.; Zeng, Y.; Zhang, H.; Gao, Y.; Luo, M.; Li, X. Future land use/land cover change has nontrivial and potentially dominant impact on global gross primary productivity. Earth’s Future 2022, 10, e2021EF002628. [Google Scholar] [CrossRef]
Disclaimer/Publisher’s Note: The statements, opinions and data contained in all publications are solely those of the individual author(s) and contributor(s) and not of MDPI and/or the editor(s). MDPI and/or the editor(s) disclaim responsibility for any injury to people or property resulting from any ideas, methods, instructions or products referred to in the content. |
© 2024 by the authors. Licensee MDPI, Basel, Switzerland. This article is an open access article distributed under the terms and conditions of the Creative Commons Attribution (CC BY) license (https://creativecommons.org/licenses/by/4.0/).