Article

Root Distribution and Water Uptake Applied by Hydrogen and Oxygen Stable Isotopes for Lianas in Northwest China

1
School of Civil Engineering and Water Resources, Qinghai University, Xining 810016, China
2
Laboratory of Ecological Protection and High Quality Development in the Upper Yellow River, Xining 810016, China
3
Key Laboratory of Western China’s Environmental Systems with the Ministry of Education, College of Earth and Environmental Sciences, Lanzhou University, Lanzhou 730000, China
*
Author to whom correspondence should be addressed.
Forests 2024, 15(4), 626; https://doi.org/10.3390/f15040626
Submission received: 28 February 2024 / Revised: 25 March 2024 / Accepted: 27 March 2024 / Published: 29 March 2024
(This article belongs to the Section Forest Hydrology)

Abstract

:
The root distribution and water uptake of irrigated vines (Vitis vinifera L.) in arid oasis areas remain poorly understood, particularly in terms of the variations in water uptake resulting from plant type and growing period. In this study, excavation and soil coring were employed to investigate the root distribution of vines. Meanwhile, the water uptake dynamics of irrigated vines in an arid oasis area were developed using stable isotopes of hydrogen and oxygen in water bodies (δD and δ18O) and in crops and soil water, coupled with a direct inference approach and a linear mixed model (IsoSource). The soil layers were divided into nine layers via hierarchical cluster analysis. The results indicated that the vertical distributions of the total and fine roots of grapevines were mainly in the range of 40–160 cm, accounting for 93.1% (91.2%) and 92.5% (90.0%) of the total root (200 cm) distribution during May and October, respectively. In the horizontal direction, both the total root and fine root systems were mainly distributed within 0–100 cm from the trunk and contributed 81.2% and 79.8% of the total root distribution, respectively. Meanwhile, both the total root weight (length) density and fine root weight (length) density decreased gradually with increasing radial distance from the trunk in the 0–80 cm range. The main water uptake of vines was at 0–40 cm in June, 20–80 cm in July, and 40–100 cm in August. These findings suggest that the main depth of root water uptake increases during the whole growth stage for grapevines in arid oasis ecosystems. This information will help growers to improve irrigation efficiency and provide a data analysis of water conservation in an arid oasis area during water stress.

1. Introduction

Roots are crucial to the function of crops and ecosystems via water extraction from soils and act as a critical mediator to control vegetation conditions or water availability [1,2,3]. Water flows through soils and is consumed by crops depending on the root distribution along soil layers [4,5,6,7,8]. Thus, the spatial distribution of roots should be analyzed first when investigating water uptake. The observation of crop root systems (e.g., excavating, soil coring, rhizotrons) has been universally applied to develop the crop water uptake patterns in many kinds of ecosystems, although it takes a lot of time and is costly [5,9,10]. The most widely used technique in recent decades remains excavation or soil coring and subsequent root separation. Nevertheless, our lack of knowledge regarding the distribution of crop roots in soil layers might be attributed to the fact that the root systems reach deep into the ground and are blocked by the soil. Additionally, little attention has been directed towards understanding the root distribution of irrigated grapevines in arid oasis areas.
In the late 1950s and early 1960s, stable isotopes (e.g., δ2H and δ18O) began to be used in hydrological studies, such as those by Gonfiantini and Roberto [11] and Galewsky et al. [12]. Due to the ensuing boom in technical and research analysis methods, stable isotope (δ2H and δ18O) techniques are now of great value in various disciplines such as hydrology, oceanography, ecology, and paleoclimatology [5,13,14,15,16,17,18,19,20,21,22,23,24,25]. Ecohydrological processes (e.g., crop water uptake and spatiotemporal patterns) can also be explored via stable isotope methods; we would highlight the papers by Wang et al. [5,14,23,26,27,28,29,30,31,32,33]. As a vital tool in the study of plant–water adaptation strategies, stable isotope methods have been proven to be powerful methods to help clarify root water uptake, as studied in Smith et al. [34], Wang et al. [28], Phillips and Gregg [35], Dai et al. [36], and Rothfuss and Javaux, [37]. These approaches include the direct inference of the isotopic values between potential source waters and xylem water [16,17], linear mixing models of water originating from different pools [28,34,36,38,39], statistical Bayesian mixing frameworks [13,14,23,30,40,41,42,43], models and numerical simulations means [34,44,45,46,47,48], and the ellipsoid method, as studied in Amin et al. [49], and Tetzlaff et al. [50]. Among these methods, “IsoSource” is a linear mixed model with a wide range of applications on the basis of the mass balance equation [35]. Meanwhile, recent studies have employed stable isotope methods to investigate water uptake by many crop species; we would highlight the papers by Ma et al. [13], Wang et al. [14], Zhao et al. [5], Qiu et al. [22], Wang et al. [23], Wang et al. [28], Wu et al. [30], Dai et al. [36], Liu et al. [38], Barbeta and Peñuelas [39], Parnell et al. [41], Yang et al. [42], Amin et al. [49], and Yang et al. [51]. Despite its many important roles, studies on the water uptake of irrigated vines in arid oasis areas are still largely absent.
In the present study, both the excavating and soil coring approaches (Section 2.2.1) were applied to evaluate root distributions. Then, direct inference and “IsoSource” means (Section 2.3) were applied to explicitly quantify the depth distribution of water uptake in a vineyard. The main objectives were (1) to evaluate the one- and two-dimensional spatial root distributions in soil profiles and (2) to identify the depth distribution of water uptake of irrigated vines in a hyper-arid region.

2. Materials and Methods

2.1. Study Sites

The experiment was conducted over an area of about 450 m × 160 m in the Dunhuang Oasis, Gansu province in northwestern China (39°52′34″ N, 94°06′19″ E; 1300 m a.s.l.). The Thompson Seedless grape (Vitis vinifera L.) is the dominant crop in this area. The vineyard canopy height at the study site was about 2.5 m above the soil surface (Figure 1a,c). The planting pattern was in rows oriented from north to south, with a spacing of 1.0 m between vine trellises and about 3.0 m between rows (Figure 1c), as studied in Wang et al. [23]. The approximate root system of the grapevine obtained via excavating is displayed in Figure 1d. Most of the vines were about 10 years old. The contribution of groundwater is not considered in this paper due to the deep water table, as studied in Ma et al. [52]. The vines were flooded approximately every 20 days (border irrigation), with the average irrigation depth being about 150 mm. The annual average rainfall and temperature were 36.9 mm and 9.3 °C, respectively. The average monthly air temperature ranged from −9.3 °C in January to 24.9 °C in July [53]. The soil type is Arenosol, with the mean soil bulk density being 1.41 g cm−3 [53]. The θF (field water capacity) and θW (wilting point) at the study site were about 0.23 m3m−3 and 0.13 m3m−3, respectively [53]. The root distribution and stable isotope experiments were carried out at the study site, with the root sampling dates being in May and October, 2018 and the isotope sampling dates being from June to August of the same year.

2.2. Sampling and Measurements

2.2.1. Root Distribution Experiment

In this study, using the excavating method, the root distribution of vines was investigated in the early- (19 May) and mid- (26 August) 2018 growing season. Four hundred vines were randomly selected from the study site and their diameter at breast height was measured.
Vine root samples were taken on 11 October, 2018 to represent the later growth stage and on 21 May, 2018 to represent the early growth stage by soil coring means. Weeds surrounding the plants were removed to exclude the influence of other crop roots. Sampling was conducted using a sand borer (0.1 m diameter) based on the root distribution investigation. The soil was sampled at 0.2 m, 0.4 m, 0.6 m, 0.8 m, 1.0 m, 1.2 m, and 1.5 m in the direction of the east and west sides of the sample lianas. Plant root samples were obtained from 15 depth intervals (0–10, 10–20, 20–30, 30–40, 40–50, 50–60, 60–70, 70–80, 80–90, 90–100, 100–120, 120–140, 140–160, 160–180, and 180–200 cm) with an auger. A total of 420 samples were obtained in 2018. After sampling, all roots in the soil samples were picked out and marked individually. The root samples were meticulously washed to remove dead roots, then baked at 105 °C for about 10 min, and dried at 80–85 °C for 36 h. For coarse roots (>2 mm diameter), the root length and weight were measured directly, while for fine roots (<2 mm diameter), the root length was obtained from a random selection of about 150 roots, and then the root length was modeled according to the correlation between the root weight (g) and root length (mm) (length = 5176.6 *weight + 23.57, R2 = 0.93, p < 0.01).

2.2.2. Stable Isotope Experiment

Soil samples were collected at a horizontal distance of about 0.5 m around the stem sampling site and at depths of 0–10, 10–20, 20–30, 30–40, 40–50, 50–60, 60–70, 70–80, 80–90, 90–100, 100–120, 120–140, 140–160, 160–180, and 180–200 cm using an auger. Three replicates were collected at each depth. Soil samples were taken on 15 June, 2018, 27 July, 2018, and 28 August, 2018. Xylem samples were obtained on the same dates. The subsamples were stored at −20 °C to determine the δ2H and δ18O ratios of the soil water, whereas the remaining samples were sealed to estimate the soil water content (SWC) by applying the oven drying method, as - described in Liu et al. [24]. Due to the deep water table (10–50 m), the effect of groundwater on plant root water uptake was not considered.
To develop the δ2H and δ18O ratios of stem water in grapevines, branches were sampled from three individual lianas at the study site. Xylem and soil samples were taken on the middle day of each month, and three xylem samples were obtained for each plant. Xylem samples included nongreen parts with a length of 3–5 cm. The bark and phloem of grapevines were peeled off immediately, and the xylems were retained to avoid the interference of isotope enrichment and were then stored at −20 °C [23,54].
A cryogenic-vacuum distillation apparatus (LI-2000, LICA United Technology Limited, Beijing, China) was applied to extract soil and plant xylem water [23,54]. The whole process lasted for 1–2 h for the soil and 4–6 h for the plant samples. The values of δ2H and δ18O ratios of soil water were measured using a water isotope analyzer (PICARRO L2130-I, Picarro, Santa Clara, CA, USA), while the δ2H and δ18O contents of the stem water were measured using an isotope ratio mass spectrometer system (MAT253, Thermo Fisher Scientific, Bremen, Germany). The Vienna Standard Mean Ocean Water (VSMOW, 0‰) was applied to calibrate and normalize all water samples.

2.2.3. Meteorological and Hydrological Factors Observation

An automatic weather station was applied to measure the weather variables. Relative humidity (RH) and air temperature at 3.0, 2.5, 2.0, 1.5, and 1.0 m above the ground were monitored (HMP60, Vaisala, Helsinki, Finland). The volumetric water content (VWC) was observed continuously during the study periods at 5, 10, 20, 50, 80, and 100 cm depths (ML2x, Delta-T Devices, Cambridge, UK). Meanwhile, the rainfall (R; mm; observed by TE525, Texas Electronics, Dallas, TX, USA) and wind speed (WS; ms−1; measured by 5103, R. M. Young, Traverse City, MI, USA) were recorded half-hourly and the data were stored using a CR1000 data logger.

2.3. Data Processing

The dry root weight/length densities were calculated as follows:
  R o o t   w e i g h t   d e n s i t y   ( g / m 3 ) = d r y   r o o t   w e i g h t / s o i l   v o l u m e
R o o t   l e n g t h   d e n s i t y   ( m / m 3 ) = d r y   r o o t   l e n g t h / s o i l   v o l u m e
The direct inference method was employed during the experimental period to evaluate the root water uptake depth, as reported in Brunel et al. [17]. The intersection of the soil water isotopes’ profile and the vertical dotted line of the xylem water isotopic composition represents the probable dominating root water uptake depth of irrigated vines [17,28].
The IsoSource model [35] was also used in this study to evaluate the potential proportional contribution of water uptake for grapevines at depths of 0–20, 20–40, 40–60, 60–80, 80–100, 100–120, 120–140, 140–160, and 160–200 cm.
The equations of the IsoSource model were expressed as follows:
δ D = i = 1 n X i δ D i
δ 18 O = i = 1 n X i δ 18 O i
1 = i = 1 n X i
where δDi and δ18Oi are the δ2H and δ18O ratios at depth i in the soil water, respectively, and Xi is the proportion of δDi or δ18Oi required for total xylem water absorption.

3. Results and Discussion

3.1. Meteorological and Hydrological Factors

Figure 2 shows the daily hydrological and meteorological factors, including the daily reference evapotranspiration (ET0; mm d−1), the crest, lowest, and mean daily air temperature (Ta; °C), rainfall (Rain; mm), vapor pressure deficit (VPD; kPa), mean wind speed (WS; ms−1), and the volumetric water content at 5 cm, 10 cm, 20 cm, 50 cm, 80 cm, and 100 cm below the ground (VWC; m3m−3) during the growth periods in 2018. The ET0 was estimated by applying the P–M equation, which is reported in Allen et al., 1998 [55]. The daily maximum (minimum) Ta varied from 15.1 (−1.05) to 37.52 (21.22) °C with a mean value of 27.47 (11.18) °C during the study periods in 2018 (Figure 2a). The daily ET0 differed from 0.97 to 6.23 mm d−1 with a mean value of 3.82 mm d−1 in 2018 (Figure 2a). The total rain was 16.5 mm in 2018 (Figure 2b). The maximum value of rainfall in 2018 was 3.73 mm d−1, which indicates that the study area is located in a hyper-arid region. The VWC had a wide range over the whole growth stage. Local irrigation systems and rainfall may be the main contributors to the variability of the VWC (Figure 2b). The VWC reached its maximum value after a rainfall or irrigation event (about 0.23 m3m−3) and then showed a gradual decrease until the next irrigation (rainfall) occurred, when it gradually returned to higher values. The VPD varied from 0.39 to 2.70 kPa, with an average value of 1.44 kPa in 2018 (Figure 2c). The WS ranged from 0.11 to 11.56 ms−1 in 2018 (Figure 2c).

3.2. Root Distribution

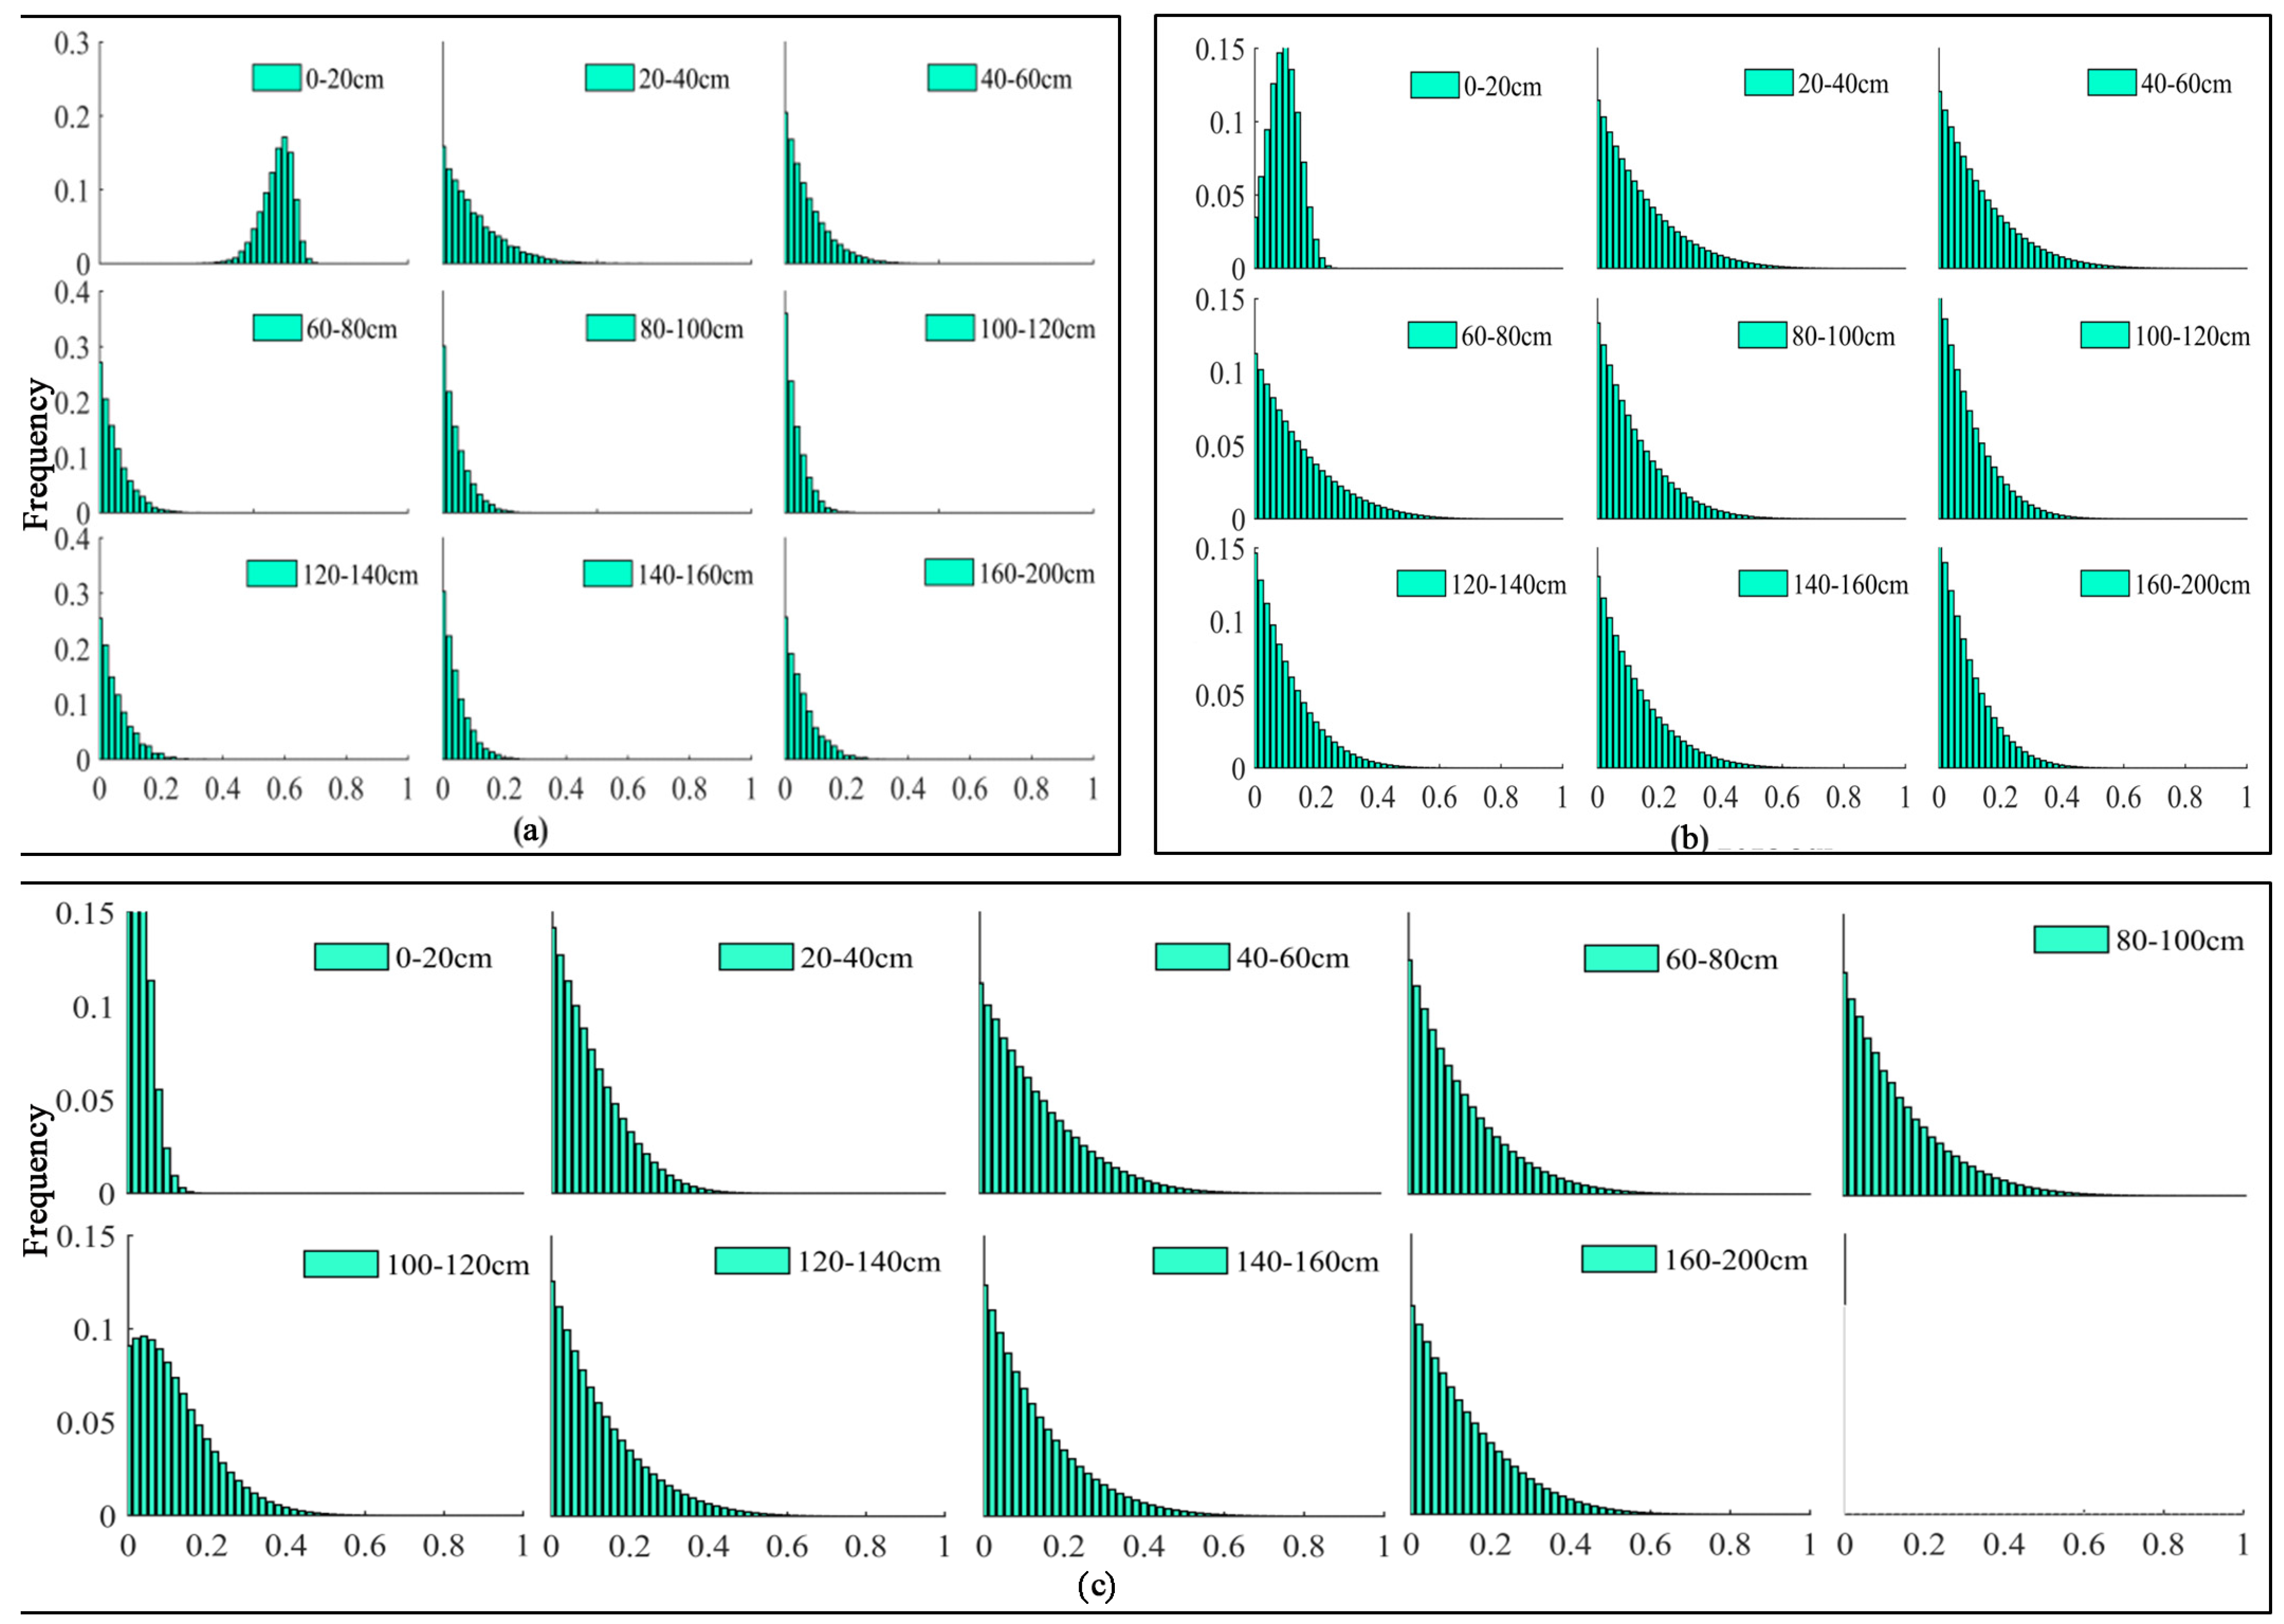
3.2.1. Vertical Root Distribution

The one-dimensional vertical variations in the root weight density of total and fine roots during the growth stages in 2018 are presented in Figure 3. As is presented in Figure 3, the vertical distributions of both the total root and the fine root systems show a trend of increasing first and then decreasing with the increasing soil depth. Both the total root and fine root systems are mainly distributed in the depth range of 40–160 cm, which contributed 93.1% (91.2%) and 92.5% (90.0%) of the total root (200 cm) distribution in the vertical direction during May and October, respectively. Meanwhile, the total root and fine root distribution from the ground surface to 30 cm underground contributed 4.7% (4.8%) and 4.3% (6.2%) of the total root (200 cm) distribution during May and October, respectively. Then, there were almost no fine roots in the soil below the 160 cm profiles. In most soil profiles, the distribution pattern of plant roots increases and then decreases or decays exponentially with soil depth, as studied in Araki et al. [56], suggesting that our estimates in this study agree with those of our predecessors. Generally, the characteristics of soil nutrients, SWC, and soil texture affect the vertical distribution of the root system, as studied in Ma et al. [7]. The vertical distribution of the root system is a crucial factor influencing plant water uptake, especially the fine roots’ vertical distribution in the soil layers below the ground surface, which largely determines the extent of water use by plants in different soil layers [28,29].

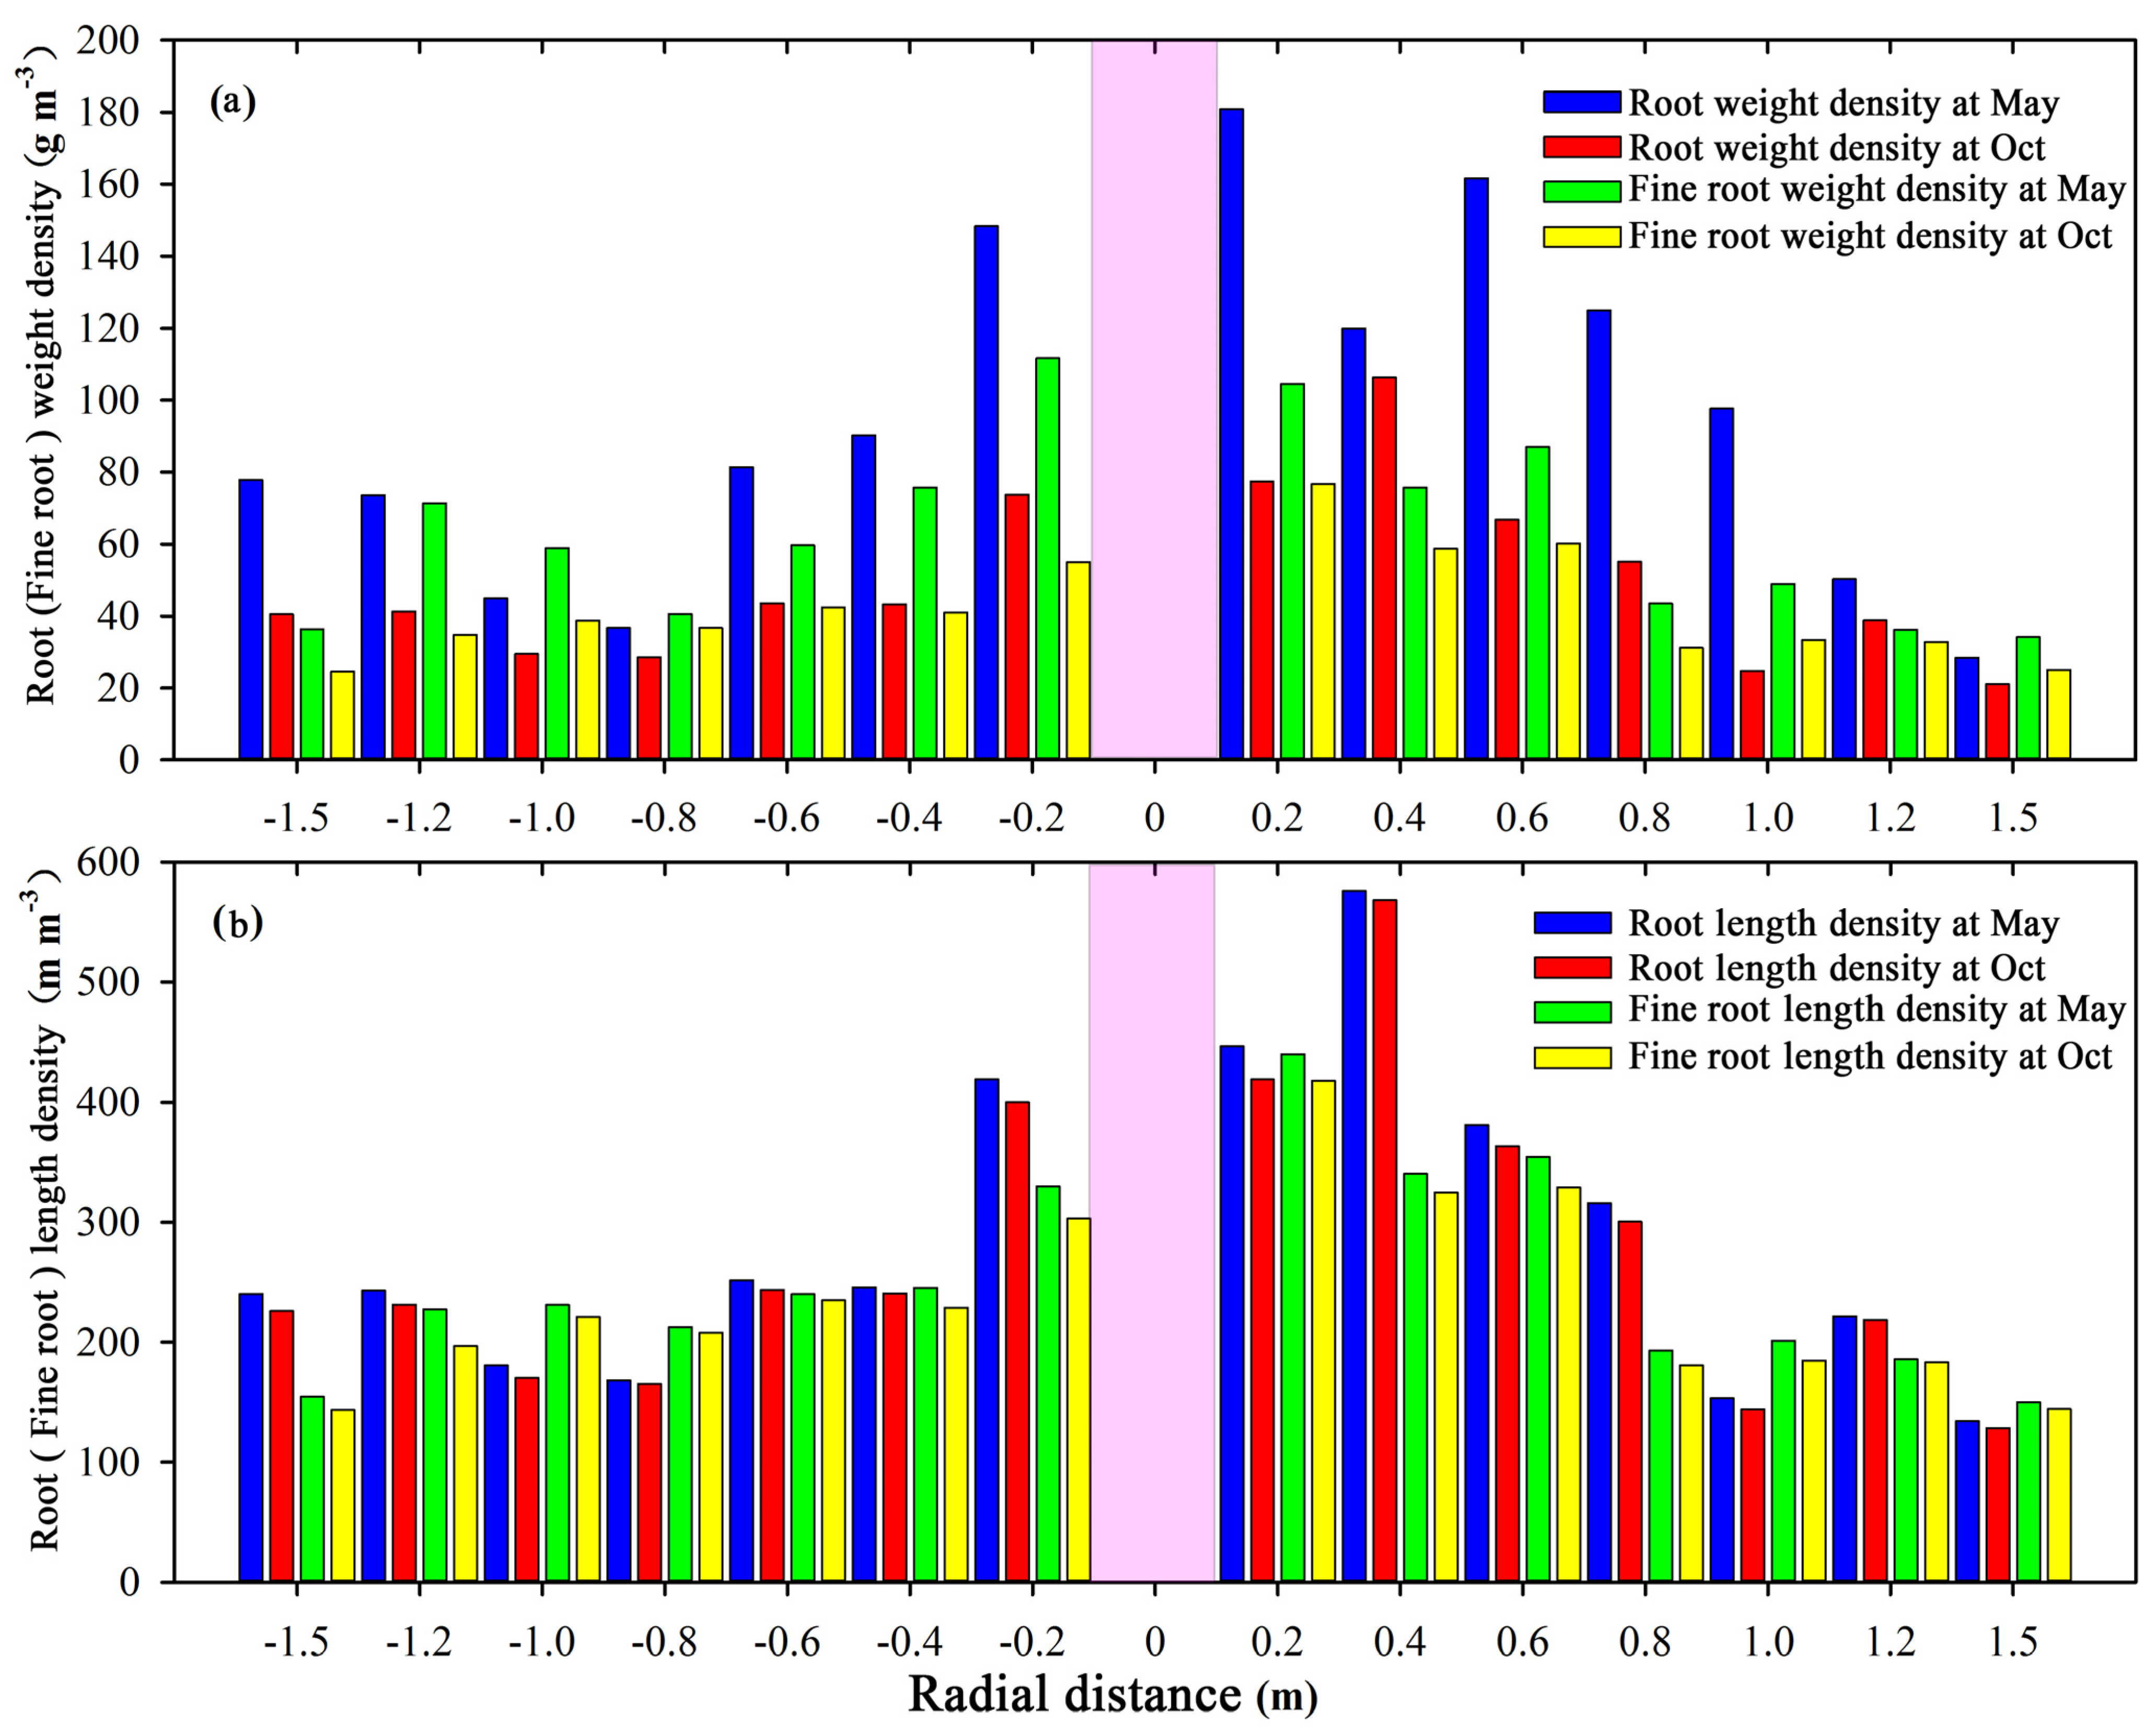
3.2.2. Horizontal Root Distribution

The horizontal variations in the root weight and length density of total and fine roots during the initial growth stage (May) and the end stage (October) in 2018 are presented in Figure 4a,b, respectively. As is presented in Figure 4, both the total root and the fine root systems are chiefly located 0–100 cm from the trunk, which contributed 81.2% and 79.8% of the total root distribution in the horizontal direction, respectively. Furthermore, the total root and fine root systems are more concentrated in the range of 0–60 cm from the trunk, contributing to 58.8% and 58.1% of the total root system distribution, respectively. Meanwhile, the total (fine) root weight (length) density decreases gradually with an increase in radial distance from the trunk in the 0–80 cm range. When more than 80 cm from the trunk, the differences between total root weight (length) density and fine root weight (length) density with radial distance were not significant (p > 0.05). Our results agree with those of previous studies, as studied by Ma et al. [7], which may be due partly to the mature root systems (more than ten years old) of the vines in the study area. Furthermore, the overlapping and interlocking pattern of the root distributions of neighboring trunks formed a network of underground spaces between the grapevines, which may have contributed to the characteristics of the horizontal root systems [57]. The spatial root distribution of the vine in the arid region provides the soil water and nutrient conditions needed for its normal growth.

3.3. Water Uptake of Grapevines

3.3.1. Soil Water Content

The soil water content (SWC; in weight; %) in the study area was different at different depths of soil and growth stages (Figure 5c). The SWC in the 0–40 cm soil layer displayed higher variations than in deep soil profiles. The SWC reached its maximum value at a depth of 120–140 cm (about 15.9% in June). The SWC at 0–40 cm depth presented a lower value (about 6.2%) during the same period. The SWC reached the maximum values of 14.5% and 12.9% at a depth of 160 cm in July and August; however, the SWC at 90 cm depth presented a lower value in the same period. To sum up, the diversity in SWC in various soil layers might be chiefly related to factors such as the distribution of plant roots, soil texture, soil evaporation, and plant water uptake [23,58,59].

3.3.2. Isotopes in Different Soil Depths and Xylem Water

Figure 5 shows the δD and δ18O isotopes at different soil depths and corresponding plant stems from June to August. The results of δ18O isotopes were primarily focused on in this study area and may be attributed to δD isotopes being more sensitive to the environment compared to δ18O isotopes, which may give rise to considerable uncertainty as described by Qiu et al. [22]. The soil water δD and δ18O isotopes values obviously differed during the growing stages and changed with the soil depth in 2018 (Figure 5a,b). The δ18O in the soil water ranged from −9.46 to −5.95‰, −8.57 to −3.28‰, and −8.29 to −4.35‰, with average values of −8.25‰, −7.24‰, and −7.32‰ in June, July, and August, respectively (Figure 5a). Meanwhile, the δD in soil water ranged from −73.99 to −57.56‰, −67.65 to −51.47‰, and −65.59 to −38.33‰, with average values of −65.61‰, −61.11‰, and −58.05‰ in June, July, and August, respectively (Figure 5b). The values of δD and δ18O of soil water in the shallow soil profiles (0–40 cm) seemed enriched compared with that of the deeper soil water in the study area, likely because of the intense soil evaporation giving rise to isotopic enrichment, as suggested by Wang et al. [23]. By and large, the soil water isotopic compositions synthesized the processes associated with soil evaporation, rainfall, irrigation, and antecedent moisture [23,60]. These noticeable variations in isotopic soil water depth are the basis for the use of isotopic means to evaluate the possible sources of soil water consumed by plants, as reported in Wang et al. [28].
The stem water isotopic composition varied slightly among the experimental periods. The mean values of δ18O for xylem water were −7.35‰, −7.33‰, and −7.61‰ in June, July, and August, respectively (Figure 5a). The mean values of δD for xylem water were −58.60‰, −59.20‰, and −54.3‰ in June, July, and August, respectively (Figure 5b).
To investigate the potential water uptake depth of irrigated vines (Vitis vinifera L.), the direct inference method was employed during the experimental period, as reported in Brunel et al. [17]. The intersection of the soil water isotopes’ profile and the vertical dotted line of the xylem water isotopic composition represents the probable dominating root water uptake depth of irrigated vines [17,28]. As is presented in Figure 5a, the δ18O of crop water interacted with the 0–40 cm soil layer in June, indicating that the dominating root water uptake depth was 0–40 cm. The δ18O of crop water and soil water had several intersections at various soil depths during July (20–60 cm, 80–100 cm) and August (40–60 cm, 80–100 cm), suggesting that the irrigated vines (Vitis vinifera L.) may collect water from several soil layers. This approach suggests the plant’s possible root water uptake depth; however, this method only provides the central uptake depth and ignores the possibility of identifying water sources derived simultaneously from different depths [14,28].

3.3.3. Proportional Contributions of Soil Water

The evaluation of the potential proportional contribution range of total water uptake from various soil layers (frequency histogram) to irrigated vines (Vitis vinifera L.) was quantified by the IsoSource model [29,35]. The method chosen mainly depended on the isotopic composition of the soil and stem, the soil water content, and the root distribution. As can be seen from the frequency histograms generated by the IsoSource model (Figure 6) at different growing periods of irrigated vines (Vitis vinifera L.), the histogram patterns were relatively focused in some soil profiles but diffuse in other layers.
The histogram patterns for the shallow depths below the ground surface (0–40 cm) are relatively straightforward, while patterns at deep profiles below the ground surface are more diffuse (Figure 6a), suggesting that the soil water from 0 to 40 cm contributes 67.2% in June for vines (Vitis vinifera L.). Similarly, vines (Vitis vinifera L.) primarily consumed water from the 20–80 cm layer in July, accounting for 39.7% of the total water uptake (Figure 6b) and from the 40–100 cm layer in August, accounting for 38.3% of the total water uptake (Figure 6c).
Combining Figure 5 and Figure 6 and according to the irrigation, evaporation, and successive root growth, the main water uptake depth was indicated as 0–40 cm in June, 20–80 cm in July, and 40–100 cm in August. The IsoSource model yields a similar depth of primary water uptake to the direct inference method. Although some of the discrete frequency distribution patterns are currently difficult to interpret, the method allows for the systematic analysis of isotopic data and the quantitative description of the proportion of each depth of water utilization, thus reducing the errors that can arise from the direct comparison method [28,29]. The results of the variation in the -mainwater uptake of grapevines in 2018 show more significant diversity in the depth of the root water uptake of grapevines (Vitis vinifera L.) in the study area in different months. Therefore, in arid oasis agroecosystems, the root distribution of perennial plants and their physiology is one of the main factors influencing the water uptake of plants. A study of the water uptake of grapevines (Vitis vinifera L.) in arid oasis areas may require further information (e.g., meteorological data, soil water potential, stem and leaf water potential) to obtain more complete results.

4. Conclusions

(1) In most soil profiles, the vertical distribution pattern of the roots of grapevines increases and then decreases or decays exponentially with soil depth. Both the total root and fine root systems are mainly distributed in the depth range of 40–160 cm, which contributed 93.1% (91.2%) and 92.5% (90.0%) of the total root (200 cm) distribution in the vertical direction during May and October, respectively. Meanwhile, there were almost no fine roots in the soil below 160 cm from the ground surface.
In the horizontal direction, both the total root and fine root systems were chiefly distributed 0–100 cm from the trunk and contributed 81.2% and 79.8% of the total root distribution in the horizontal direction, respectively. Meanwhile, the total and fine root weight and length density decreased gradually with increasing radial distance from the trunk in the 0–80 cm range. When more than 80 cm from the trunk, the differences between the total root weight and length density and fine root weight and length density with radial distance were not significant (p > 0.05).
(2) According to the irrigation, evaporation, and successive root growth data, the main water uptake depth was indicated as being 0–40 cm in June, 20–80 cm in July, and 40–100 cm in August.

Supplementary Materials

The following supporting information can be downloaded at: https://www.mdpi.com/article/10.3390/f15040626/s1.

Author Contributions

Conceptualization, S.W. and G.Z.; data curation, S.W. and Y.Z.; writing—original draft preparation, S.W.; writing—review and editing, S.W.; visualization, S.W., R.Y. and W.B.; funding acquisition, G.Z., S.W. and W.B. All authors have read and agreed to the published version of the manuscript.

Funding

This research was funded by the National Natural Science Foundation of China (No. 41871078), the Natural Science Foundation of Technology Department of Qinghai Province (Grant No. 2023-ZJ-971Q), and the Open Research Fund Program of the State Key Laboratory of Hydroscience and Engineering (No. sklhse-2022-A-04).

Data Availability Statement

Data are contained within the article and Supplementary Materials.

Acknowledgments

The authors would like to thank the anonymous referees for their useful suggestions and comments. The usual disclaimer applies.

Conflicts of Interest

The authors declare no conflicts of interest.

References

  1. Hodge, A. The plastic plant: Root responses to heterogeneous supplies of nutrients. New Phytol. 2004, 162, 9–24. [Google Scholar] [CrossRef]
  2. Schenk, H.J. Vertical vegetation structure below ground: Scaling from root to globe. Prog. Bot. 2005, 66, 341–373. [Google Scholar]
  3. Warren, J.M.; Hanson, P.J.; Iversen, C.M.; Kumar, J.; Walker, A.P.; Wullschleger, S.D. Root structural and functional dynamics in terrestrial biosphere models—Evaluation and recommendations. New Phytol. 2015, 205, 59–78. [Google Scholar] [CrossRef] [PubMed]
  4. Porporato, A.; Daly, E.; Rodriguez-Iturbe, I.; Fagan, W.F. Soil water balance and ecosystem response to climate change. Am. Nat. 2004, 164, 625–632. [Google Scholar] [CrossRef] [PubMed]
  5. Zhao, P.; Tang, X.; Zhao, P.; Tang, J. Dynamics of water uptake by maize on sloping farmland in a shallow entisol in southwest china. Catena 2016, 147, 511–521. [Google Scholar] [CrossRef]
  6. Yu, T.; Feng, Q.; Si, J.; Xi, H.; Li, Z.; Chen, A. Hydraulic redistribution of soil water by roots of two desert riparian phreatophytes in northwest china’s extremely arid region. Plant Soil 2013, 372, 297–308. [Google Scholar] [CrossRef]
  7. Ma, L.H.; Wu, P.T.; Wang, X. Root distribution chrono sequence of a dense dwarfed jujube plantation in the semiarid hilly region of the chinese loess plateau. J. For. Res. 2014, 19, 62–69. [Google Scholar] [CrossRef]
  8. Allen, S.T.; Kirchner, J.W.; Braun, S.; Siegwolf, R.; Goldsmith, G.R. Seasonal origins of soil water used by trees. Hydrol. Earth Syst. Sci. Discuss. 2019, 23, 1199–1210. [Google Scholar] [CrossRef]
  9. Jackson, R.B.; Canadell, J.G.; Ehleringer, J.R.; Mooney, H.A.; Schulze, E.D. A global analysis of root distributions for terrestrial biomes. Oecologia 1996, 108, 389–411. [Google Scholar] [CrossRef]
  10. Teste, F.P.; Marchesini, V.A.; Veneklaas, E.J.; Dixon, K.W.; Lambers, H. Root dynamics and survival in a nutrient-poor and species-rich woodland under a drying climate. Plant Soil 2018, 424, 91–102. [Google Scholar] [CrossRef]
  11. Gonfiantini, R. Some results on oxygen isotope stratigraphy in the deep drilling at king baudouin station, antarctica. J. Geophys. Res. 1965, 70, 1815–1819. [Google Scholar] [CrossRef]
  12. Galewsky, J.; Steen-Larsen, H.C.; Field, R.D.; Worden, J.; Risi, C.; Schneider, M. Stable isotopes in atmospheric water vapor and applications to the hydrologic cycle. Rev. Geoph. 2016, 54, 809–865. [Google Scholar] [CrossRef] [PubMed]
  13. Ma, Y.; Song, X. Using stable isotopes to determine seasonal variations in water uptake of summer maize under different fertilization treatments. Sci. Total Environ. 2016, 550, 471–483. [Google Scholar] [CrossRef] [PubMed]
  14. Wang, J.; Fu, B.; Nan, L.; Li, Z. Seasonal variation in water uptake patterns of three plant species based on stable isotopes in the semi-arid loess plateau. Sci. Total Environ. 2017, 609, 27. [Google Scholar] [CrossRef] [PubMed]
  15. Zhao, P.; Zhao, P.; Liang, C.; Li, T.; Zhou, B. Understanding the rapidity of subsurface storm flow response from a fracture-oriented shallow vadose through a new perspective. J. Hydrol. 2017, 544, 628–639. [Google Scholar] [CrossRef]
  16. Dawson, T.E.; Ehleringer, J.R. Streamside trees that do not use stream water. Nature 1991, 350, 335–337. [Google Scholar] [CrossRef]
  17. Brunel, J.P.; Walker, G.R.; Dighton, J.C.; Monteny, B. Use of stable isotopes of water to determine the origin of water used by the vegetation and to partition evapotranspiration. a case study from hapex-sahel. J. Hydrol. 1997, 188, 466–481. [Google Scholar] [CrossRef]
  18. Dawson, T.E.; Mambelli, S.; Plamboeck, A.H.; Templer, P.H.; Tu, K.P. Stable isotopes in plant ecology. Annu. Rev. Ecol. Syst. 2002, 33, 507–559. [Google Scholar] [CrossRef]
  19. Augustin, L.; Barbante, C.; Barnes, P.R.; Barnola, J.M.; Bigler, M.; Castellano, E.; Cattani, O.; Chappellaz, J.; Dahl-Jensen, D.; Delmonte, B.; et al. Eight glacial cycles from an antarctic ice core. Nature 2004, 429, 623–628. [Google Scholar]
  20. Ma, J.; Zhang, P.; Zhu, G.; Wang, Y.; Edmunds, W.M.; Ding, Z.; He, J. The composition and distribution of chemicals and isotopes in precipitation in the shiyang river system, northwestern china. J. Hydrol. 2012, 436–437, 92–101. [Google Scholar] [CrossRef]
  21. Thompson, L.G.; Mosley-Thompson, E.; Davis, M.E.; Zagorodnov, V.S.; Howat, I.M.; Mikhalenko, V.N.; Lin, P.N. Annually resolved ice core records of tropical climate variability over the past ~1800 years. Science 2013, 340, 945–950. [Google Scholar] [CrossRef] [PubMed]
  22. Qiu, X.; Zhang, M.; Wang, S. Preliminary research on hydrogen and oxygen stable isotope characteristics of different water bodies in the qilian mountains, northwestern tibetan plateau. Environ. Earth Sci. 2016, 75, 1491. [Google Scholar] [CrossRef]
  23. Wang, J.; Fu, B.; Lu, N.; Wang, S.; Zhang, L. Water use characteristics of native and exotic shrub species in the semi-arid loess plateau using an isotope technique. Agric. Ecosyst. Environ. 2019, 276, 55–63. [Google Scholar] [CrossRef]
  24. Liu, W.; HChen Zou, Q.; Nie, Y. Divergent root water uptake depth and coordinated hydraulic traits among typical karst plantations of subtropical China: Implication for plant water adaptation under precipitation changes. Agric. Water Manag. 2021, 249, 106798. [Google Scholar] [CrossRef]
  25. Zhao, Y.; Wang, L. Insights into the isotopic mismatch between bulk soil water and salix matsudana koidz trunk water from root water stable isotope measurements. Hydrol. Earth Syst. Sci. 2021, 25, 3975–3989. [Google Scholar] [CrossRef]
  26. Brooks, J.R.; Barnard, H.R.; Coulombe, R.; Mcdonnell, J.J. Ecohydrologic separation of water between trees and streams in a mediterranean climate. Nat. Geosci. 2010, 3, 100–104. [Google Scholar] [CrossRef]
  27. Liu, W.; Liu, W.; Li, P.; Duan, W.; Li, H. Dry season water uptake by two dominant canopy tree species in a tropical seasonal rainforest of Xishuangbanna, SW China. Agric. For. Meteorol. 2010, 150, 380–388. [Google Scholar] [CrossRef]
  28. Wang, P.; Song, X.; Han, D.; Zhang, Y.; Liu, X. A study of root water uptake of crops indicated by hydrogen and oxygen stable isotopes: A case in Shanxi Province, China. Agric. Water Manag. 2010, 97, 475–482. [Google Scholar] [CrossRef]
  29. Wu, Y.; Du, T.; Li, F.; Li, S.; Ding, R.; Tong, L. Quantification of maize water uptake from different layers and root zones under alternate furrow irrigation using stable oxygen isotope. Agric. Water Manag. 2016, 168, 35–44. [Google Scholar] [CrossRef]
  30. Wu, H.; Li, J.; Zhang, C.; He, B.; Zhang, H.; Wu, X.; Li, X.Y. Determining root water uptake of two alpine crops in a rainfed cropland in the Qinghai Lake watershed: First assessment using stable isotopes analysis. Field Crop. Res. 2018, 215, 113–121. [Google Scholar] [CrossRef]
  31. Zhao, X.; Li, F.; Ai, Z.; Li, J.; Gu, C. Stable isotope evidences for identifying crop water uptake in a typical winter wheat–summer maize rotation field in the north China plain. Sci. Total Environ. 2018, 618, 121–131. [Google Scholar] [CrossRef] [PubMed]
  32. Nehemy, M.F.; Benettin, P.; Asadollahi, M.; Pratt, D.; Mcdonnell, J. How plant water status drives tree source water partitioning. Hydrol. Earth Syst. Sci. Discuss. 2019, 2019, 1–26. [Google Scholar]
  33. Mennekes, D.; Rinderer, M.; Seeger, S.; Orlowski, N. Ecohydrological travel times derived from in situ stable water isotope measurements in trees during a semi-controlled pot experiment. Hydrol. Earth Syst. Sci. 2021, 25, 4513–4530. [Google Scholar] [CrossRef]
  34. Smith, A.; Tetzlaff, D.; Landgraf, J.; Dubbert, M.; Soulsby, C. Modelling temporal variability of in-situ soil water and vegetation isotopes reveals ecohydrological couplings in a willow plot. Biogeosciences 2022, 19, 2465–2485. [Google Scholar] [CrossRef]
  35. Phillips, D.L.; Gregg, J.W. Source partitioning using stable isotopes: Coping with too many sources. Oecologia 2003, 136, 261–269. [Google Scholar] [CrossRef] [PubMed]
  36. Dai, Y.; Zheng, X.J.; Tang, L.S.; Li, Y. Stable oxygen isotopes reveal distinct water use patterns of two haloxylon species in the gurbantonggut desert. Plant Soil 2015, 389, 73–87. [Google Scholar] [CrossRef]
  37. Youri, R.; Mathieu, J. Reviews and syntheses: Isotopic approaches to quantify root water uptake: A review and comparison of methods. Biogeosciences 2017, 14, 2199–2224. [Google Scholar]
  38. Liu, S.; Chen, Y.; Chen, Y.; Friedman, J.M.; Hati, J.H.A.; Fang, G. Use of 2H and 18O stable isotopes to investigate water sources for different ages of Populus euphratica, along the lower Heihe River. Ecol. Res. 2015, 30, 581–587. [Google Scholar] [CrossRef]
  39. Barbeta, A.; Peñuelas, J. Relative contribution of groundwater to plant transpiration estimated with stable isotopes. Sci. Rep. 2017, 7, 10580. [Google Scholar] [CrossRef]
  40. Moore, J.W.; Semmens, B.X. Incorporating uncertainty and prior information into stable isotope mixing models. Ecol. Lett. 2008, 11, 470–480. [Google Scholar] [CrossRef]
  41. Parnell, A.C.; Phillips, D.L.; Bearhop, S.; Semmens, B.X.; Ward, E.J.; Moore, J.W.; Jackson, A.L.; Grey, J.; Kelly, D.J.; Inger, R. Bayesian stable isotope mixing models. Environmetrics 2013, 24, 387–399. [Google Scholar] [CrossRef]
  42. Yang, B.; Wen, X.; Sun, X. Seasonal variations in depth of water uptake for a subtropical coniferous plantation subjected to drought in an East Asian monsoon region. Agric. For. Meteorol. 2015, 201, 218–228. [Google Scholar] [CrossRef]
  43. Freyberg, J.V.; Allen, S.T.; Grossiord, C.; Dawson, T.E. Plant and root-zone water isotopes are difficult to measure, explain, and predict: Some practical recommendations for determining plant water sources. Methods Ecol. Evol. 2020, 11, 1352–1367. [Google Scholar] [CrossRef]
  44. Ogle, K.; Tucker, C.; Cable, J.M. Beyond simple linear mixing models: Process-based isotope partitioning of ecological processes. Ecol. Appl. 2014, 24, 181–195. [Google Scholar] [CrossRef]
  45. De Melo, M.L.A.; de Jong van Lier, Q. Revisiting the Feddes reduction function for modeling root water uptake and crop transpiration. J. Hydrol. 2021, 603, 126952. [Google Scholar] [CrossRef]
  46. Coppola, A.; Chaali, N.; Dragonetti, G.; Lamaddalena, N.; Comegna, A. Root uptake under non-uniform root-zone salinity. Ecohydrology 2015, 8, 1363–1379. [Google Scholar] [CrossRef]
  47. Difonzo, F.V.; Masciopinto, C.; Vurro, M.; Berardi, M. Shooting the Numerical Solution of Moisture Flow Equation with Root Water Uptake Models: A Python Tool. Water Resour. Manag. 2021, 35, 2553–2567. [Google Scholar] [CrossRef]
  48. Brunetti, G.; Kodešová, R.; Šimůnek, J. Modeling the Translocation and Transformation of Chemicals in the Soil-Plant Continuum: A Dynamic Plant Uptake Module for the HYDRUS Model. Water Resour. Res. 2019, 55, 8967–8989. [Google Scholar] [CrossRef]
  49. Amin, A.; Zuecco, G.; Geris, J.; Schwendenmann, L.; Penna, D. Depth distribution of soil water sourced by plants at the global scale: A new direct inference approach. Ecohydrology 2020, 13, e2177. [Google Scholar] [CrossRef]
  50. Tetzlaff, D.; Buttle, J.; Carey, S.K.; Kohn, M.J.; Laudon, H.; Mcnamara, J.P.; Smith, A.; Sprenger, M.; Soulsby, C. Stable isotopes of water reveal differences in plant–soil water relationships across northern environments. Hydrol. Process. 2021, 35, e14023. [Google Scholar] [CrossRef]
  51. Yang, B.; Wen, X.; Sun, X. Irrigation depth far exceeds water uptake depth in an oasis cropland in the middle reaches of Heihe River Basin. Sci. Rep. 2015, 5, 15206. [Google Scholar] [CrossRef] [PubMed]
  52. Ma, J.; He, J.; Qi, S.; Zhu, G.; Zhao, W.; Edmunds, W.M.; Zhao, Y. Groundwater recharge and evolution in the Dunhuang Basin, northwestern China. Appl. Geochem. 2013, 28, 19–31. [Google Scholar] [CrossRef]
  53. Wang, S.; Xia, D.; Ma, J.; Han, T.; Zhu, G. The characteristics of evapotranspiration and crop coefficients of an irrigated vineyard in arid Northwest China. Agric. Water Manag. 2019, 212, 388–398. [Google Scholar] [CrossRef]
  54. West, A.G.; Patrickson, S.J.; Ehleringer, J.R. Water extraction times for plant and soil materials used in stable isotope analysis. Rapid Commun. Mass Spectrom. 2006, 20, 1317–1321. [Google Scholar] [CrossRef] [PubMed]
  55. Allen, R.G.; Pereira, L.S.; Raes, D.; Smith, M. Crop Evapotranspiration Guidelines for Computing Crop Water Requirements; FAO Irrigation and Drainage Paper No. 56; FAO: Rome, Italy, 1998. [Google Scholar]
  56. Araki, H.; Iijima, M. Stable isotope analysis of water extraction from subsoil in upland rice (Oryza sativa L.) as affected by drought and soil compaction. Plant Soil 2007, 270, 147–157. [Google Scholar] [CrossRef]
  57. Janssens, P.; Diels, J.; Vanderborght, J.; Elsen, F.; Elsen, A.; Deckers, T.; Vandendriessche, H. Numerical calculation of soil water potential in an irrigated ‘conference’ pear orchard. Agric. Water Manag. 2015, 148, 113–122. [Google Scholar] [CrossRef]
  58. Seneviratne, S.I.; Corti, T.; Davin, E.L.; Hirschi, M.; Jaeger, E.B.; Lehner, I.; Orlowsky, B.; Teuling, A.J. Investigating soil moisture–climate interactions in a changing climate: A review. Earth Sci. Rev. 2010, 99, 125–161. [Google Scholar] [CrossRef]
  59. Wu, J.; Liu, W.; Chen, C. How do plants share water sources in a rubber-tea agroforestry system during the pronounced dry season. Agric. Ecosyst. Environ. 2017, 236, 69–77. [Google Scholar] [CrossRef]
  60. Brooks, P.D.; Chorover, J.; Fan, Y.; Godsey, S.E.; Maxwell, R.M.; Mcnamara, J.P.; Tague, C. Hydrological partitioning in the critical zone: Recent advances and opportunities for developing transferable understanding of water cycle dynamics. Water Resour. Res. 2015, 51, 6973–6987. [Google Scholar] [CrossRef]
Figure 1. Overview of the research area. (a) Location of the study site. (b) Vineyard. (c) Root distribution. (d) Equipment used for meteorological measurements.
Forests 15 00626 g001
Figure 2. Seasonal variation in daily hydrological and meteorological factors in 2018 during the study period. (a) ET0 (mm d−1) and Ta (°C). (b) Rainfall (mm) and VWC (m3m−3). (c) VPD (kPa) and WS (ms−1).
Forests 15 00626 g002
Figure 3. Vertical distribution of the root (fine root) weight (length) density. (a) Root weight density in May and October. (b) Fine root weight density in May and October. (c) Root length density in May and October. (d) Fine root length density in May and October.
Forests 15 00626 g003
Figure 4. Horizontal distribution of the root and fine root weight and length density. (a) Root weight density of total and fine roots in May and October. (b) Root length density of total and fine roots in May and October.
Forests 15 00626 g004
Figure 5. δD and δ18O in soil and stem water in June to August of 2018. (a) δ18O in 2018. (b) δD in 2018. (c) Soil water content in 2018.
Forests 15 00626 g005
Figure 6. Histograms obtained via IsoSource. (a) 2018 June. (b) 2018 July. (c) 2018 August.
Forests 15 00626 g006
Disclaimer/Publisher’s Note: The statements, opinions and data contained in all publications are solely those of the individual author(s) and contributor(s) and not of MDPI and/or the editor(s). MDPI and/or the editor(s) disclaim responsibility for any injury to people or property resulting from any ideas, methods, instructions or products referred to in the content.

