
Prediction and Transition of Vegetation Vulnerability in the Mara River Basin under Different Shared Socio-Economic Pathways (SSPs), East Africa


Abstract
1. Introduction
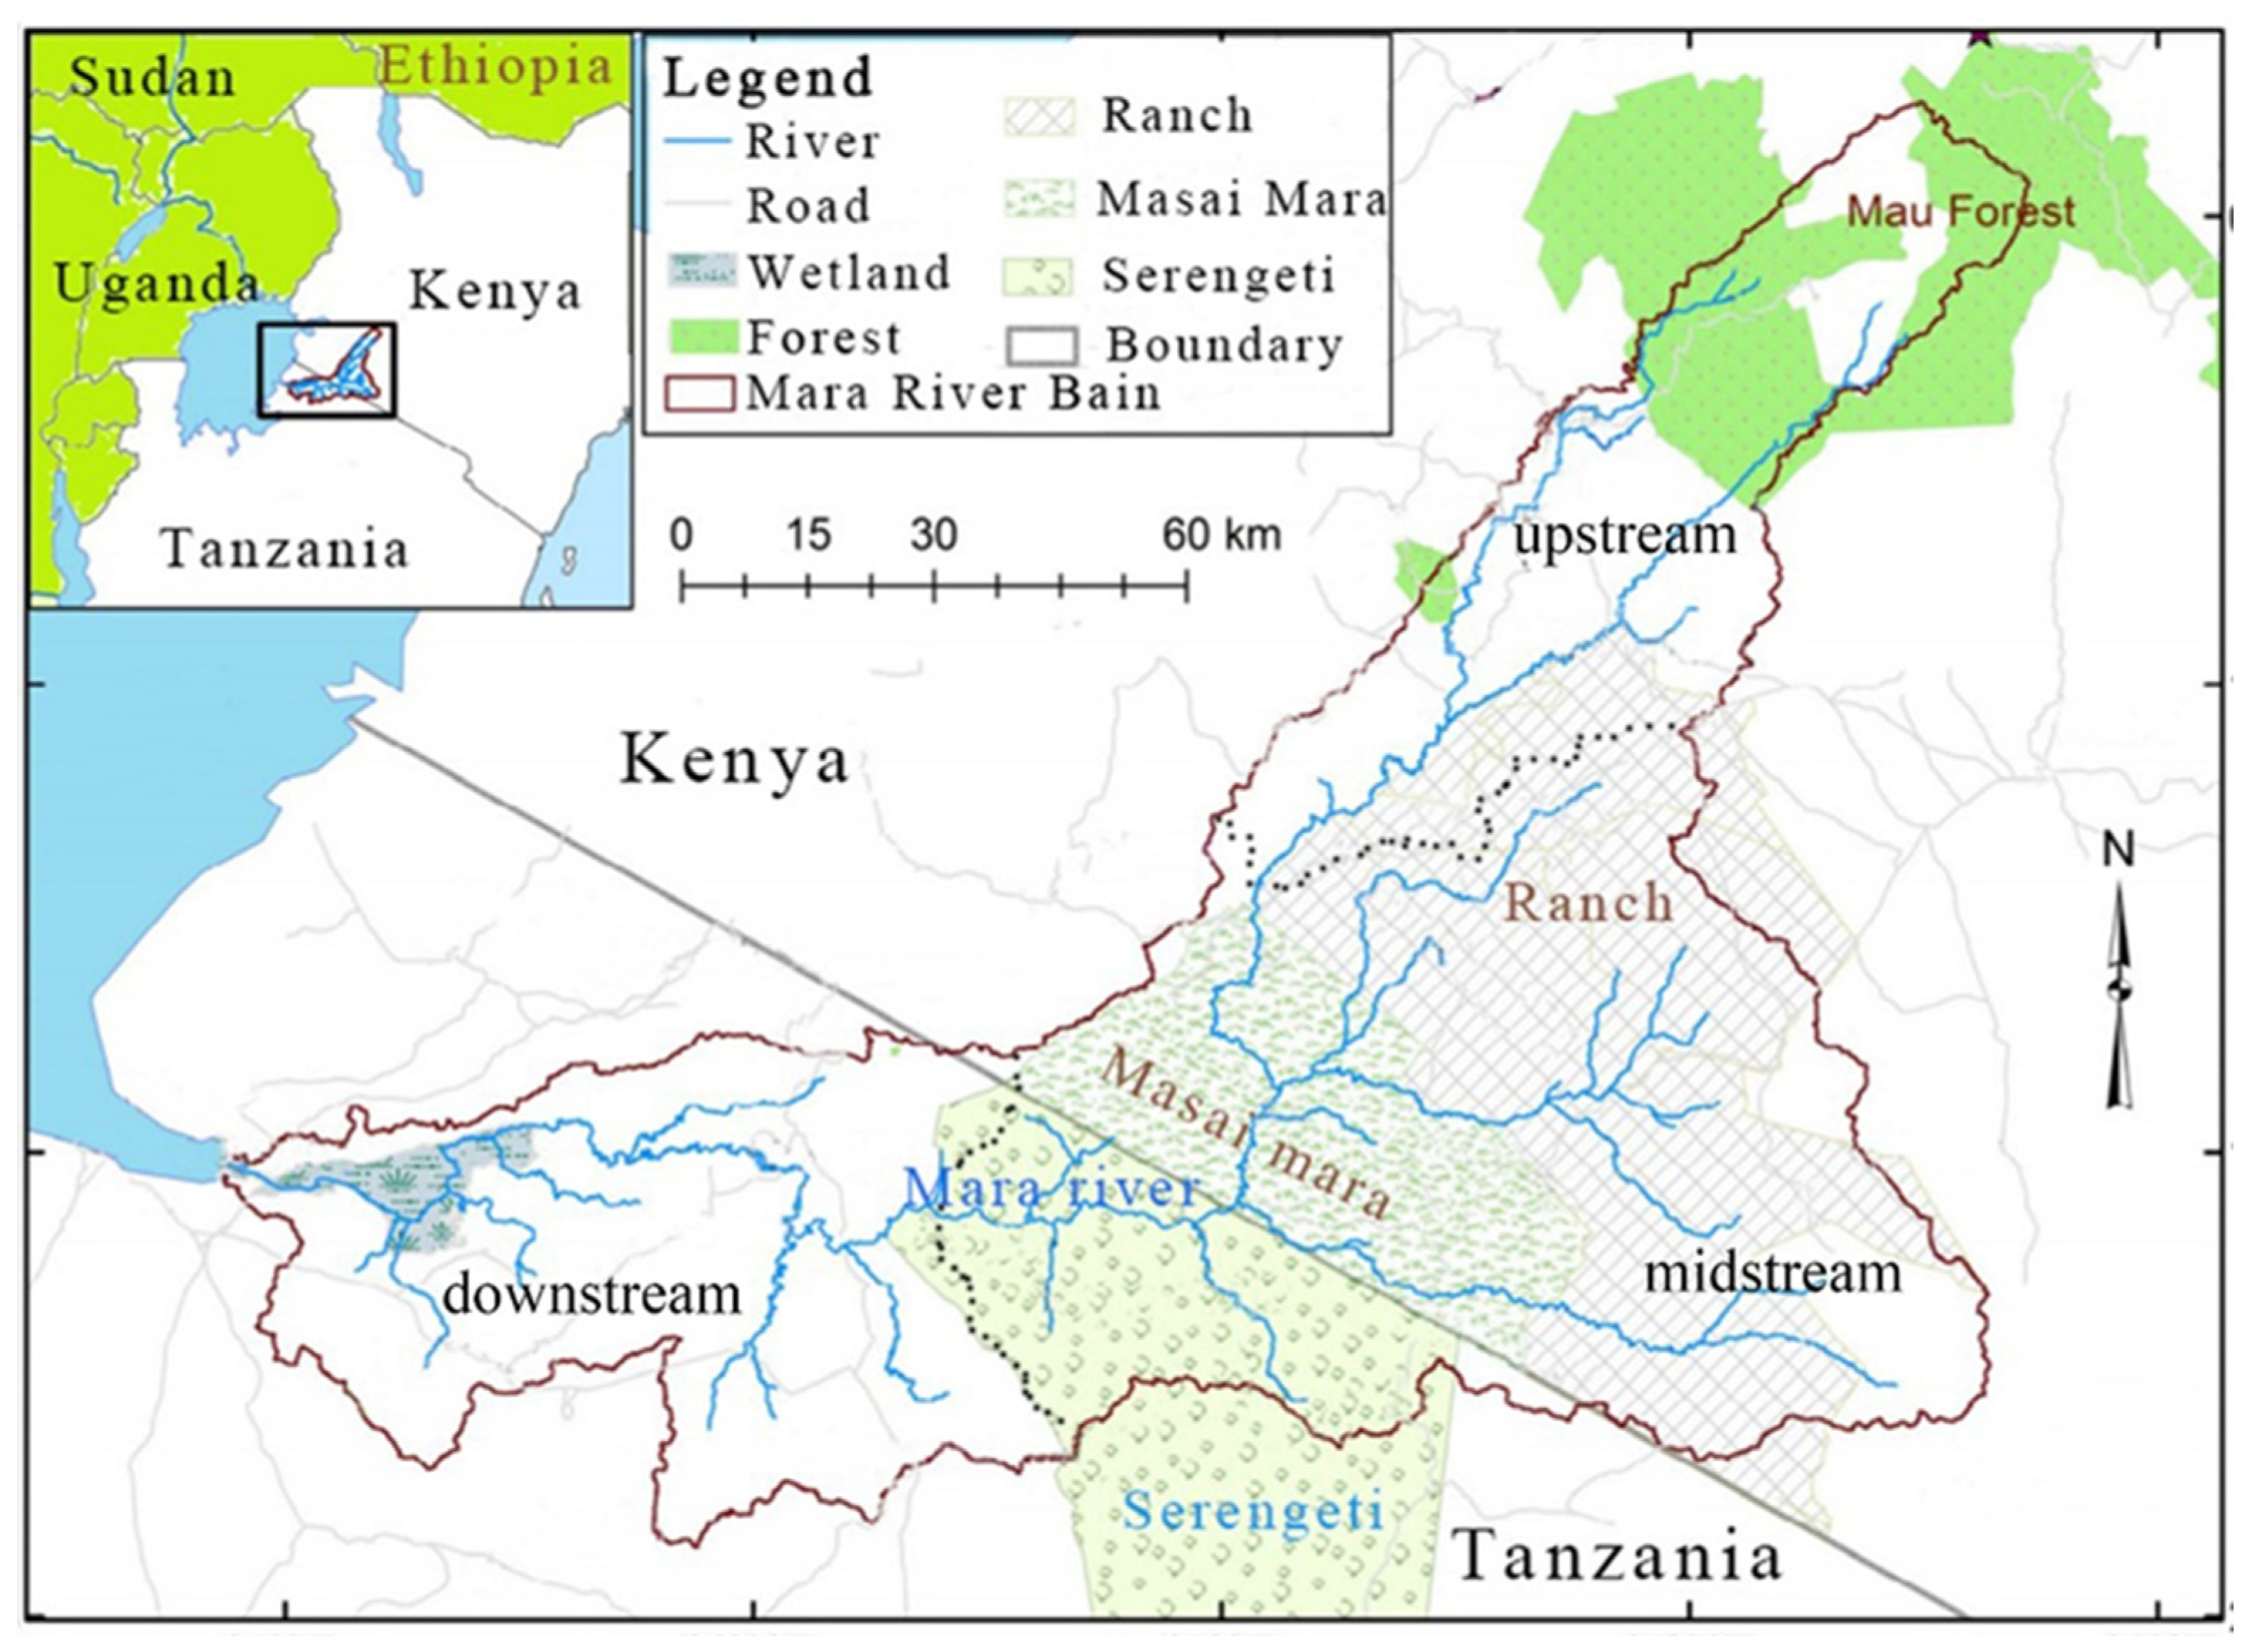
2. Study Area
3. Methods and Data
3.1. Methods
3.1.1. Scenario Assumptions
3.1.2. Factors
3.1.3. Vegetation Vulnerability
- Data standardization
- 2.
- Vegetation vulnerability
- 3.
- Spatial cluster of vegetation vulnerability
3.1.4. Transition of Vegetation Vulnerability
3.2. Data
- Climate. The temperature and precipitation data for the base period were obtained from ERA5-Land monthly average reanalysis data. As the study area is not large and the data needed for predicting future vegetation ecological water should include radiation, temperature, precipitation, wind speed, and humidity, the CNRM-CM6-1-HR model in the CMIP6 dataset under SSP1-2.6, SSP2-4.5, and SSP5-8.5 was chosen for including all the above elements and having a relatively small spatial resolution [32].
- Land use. The land use data for the base period were obtained from the European Space Agency, the land type accounted for the largest proportion of a grid and was taken as the land use type for that grid. The land use data for the near future period and distinct future period under SSP1-2.6, SSP2-4.5, and SSP5-8.5 were from Land Use Harmonization 2 (LUH2) [33].
- Population. The population data for the base period were sourced from the WorldPop population density dataset. According to Our World in Data, the population growth rate in Kenya from 2020 to 3030 is about 2.0%, from 2030 to 2059 is about 1.3%, and from 2060 to 2099 is about 0.3%. The population growth rate in Tanzania from 2020 to 3030 is about 2.8%, from 2030 to 2059 is about 2.1%, and from 2060 to 2099 is about 1.0%. The average population growth rate of Kenya and Tanzania was taken as the population growth rate of MRB. Therefore, the population growth rate of the MRB from 2020 to 3030 is about 2.4%, from 2030 to 2059 is about 1.7%, from 2060 to 2099 is about 0.7%, and the population density is shown in Table 3.
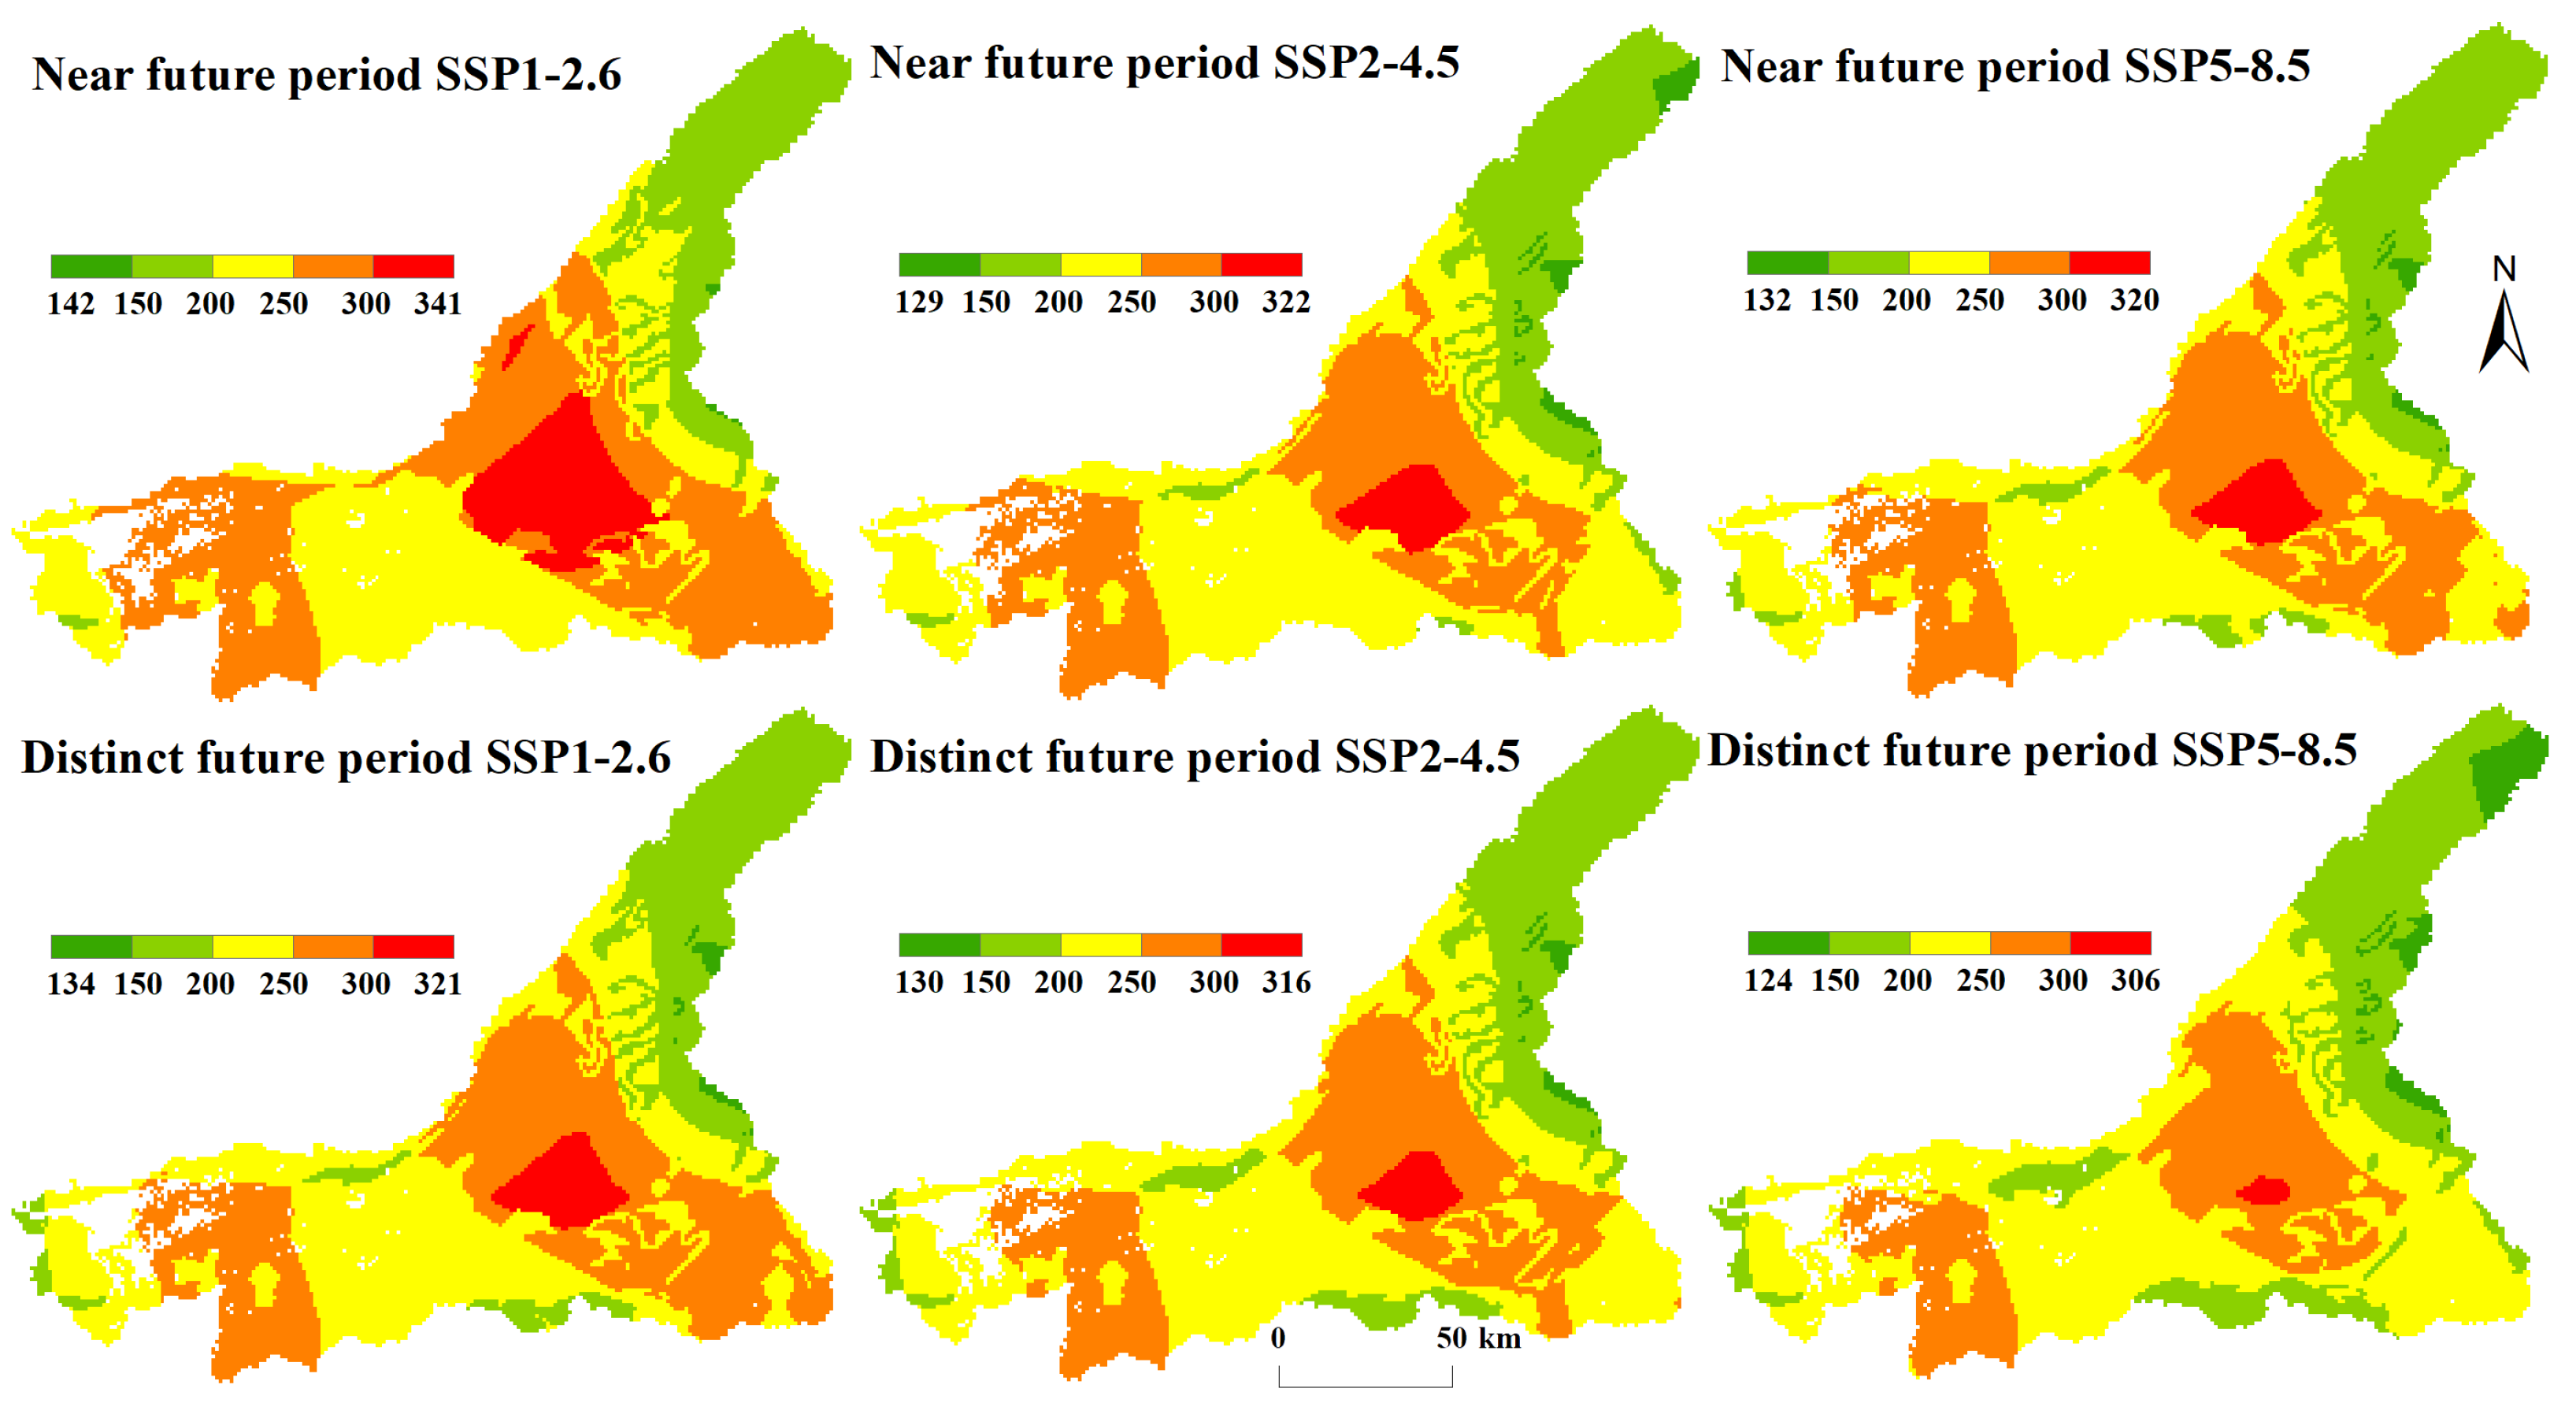
- Vegetation ecological water. The vegetation ecological water of the base period was from the research results [25]. The vegetation ecological water under SSP1-2.6, SSP2-4.5, and SSP5-8.5 of the near future period and distinct future period were calculated by the RF algorithm with elevation and CMIP6 data. The minimum R2 in all scenarios is 0.74, indicating good results (Figure 2).
4. Results
4.1. Factor Scores
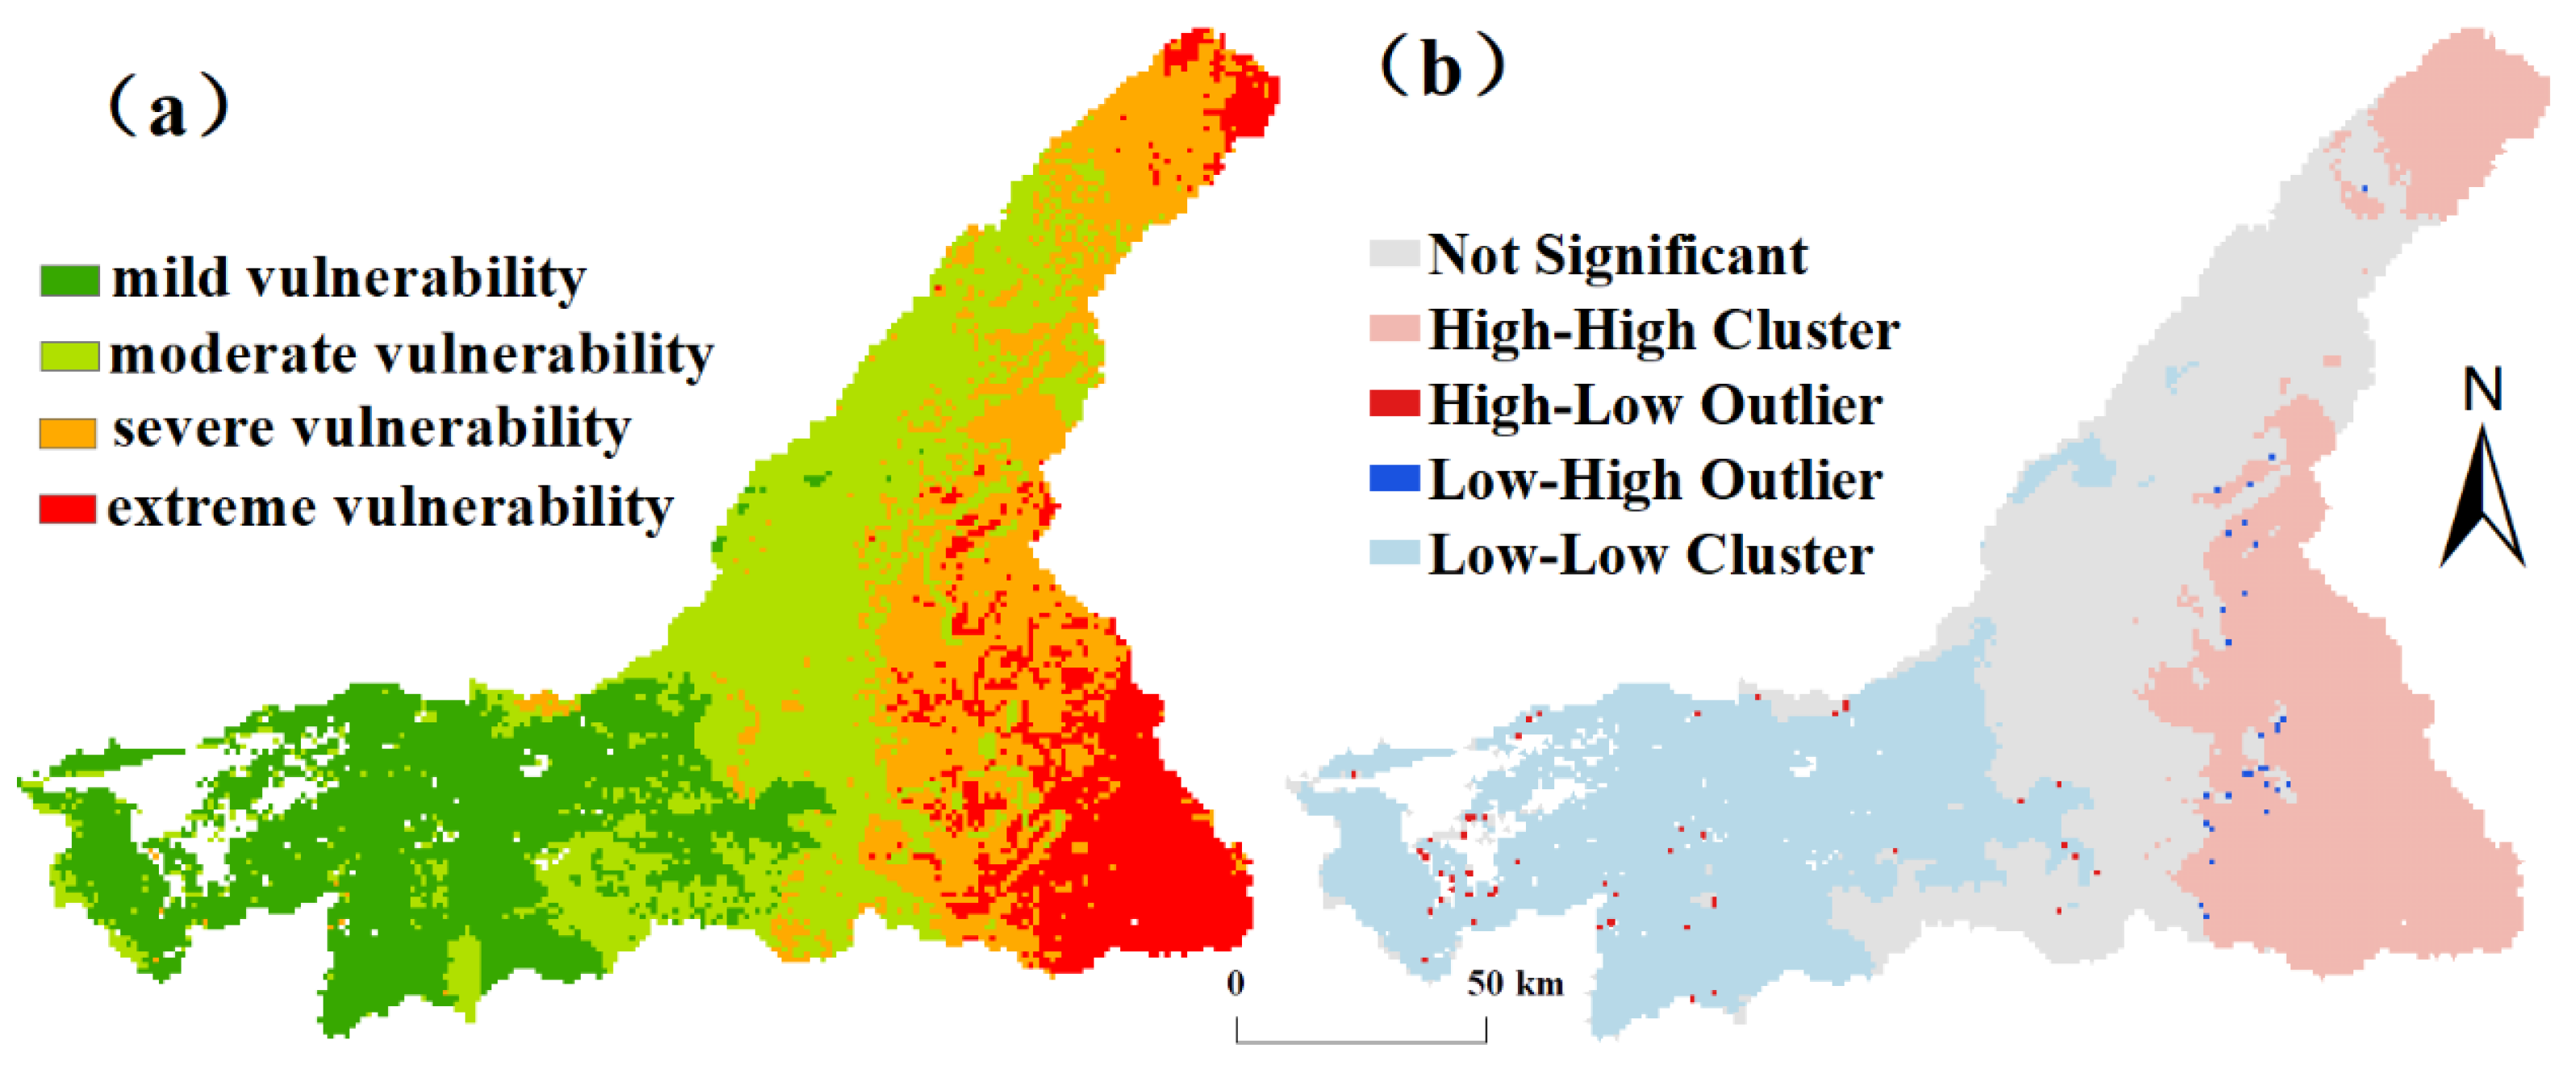
4.2. Vegetation Vulnerability and Spatial Cluster for the Base Period in MRB
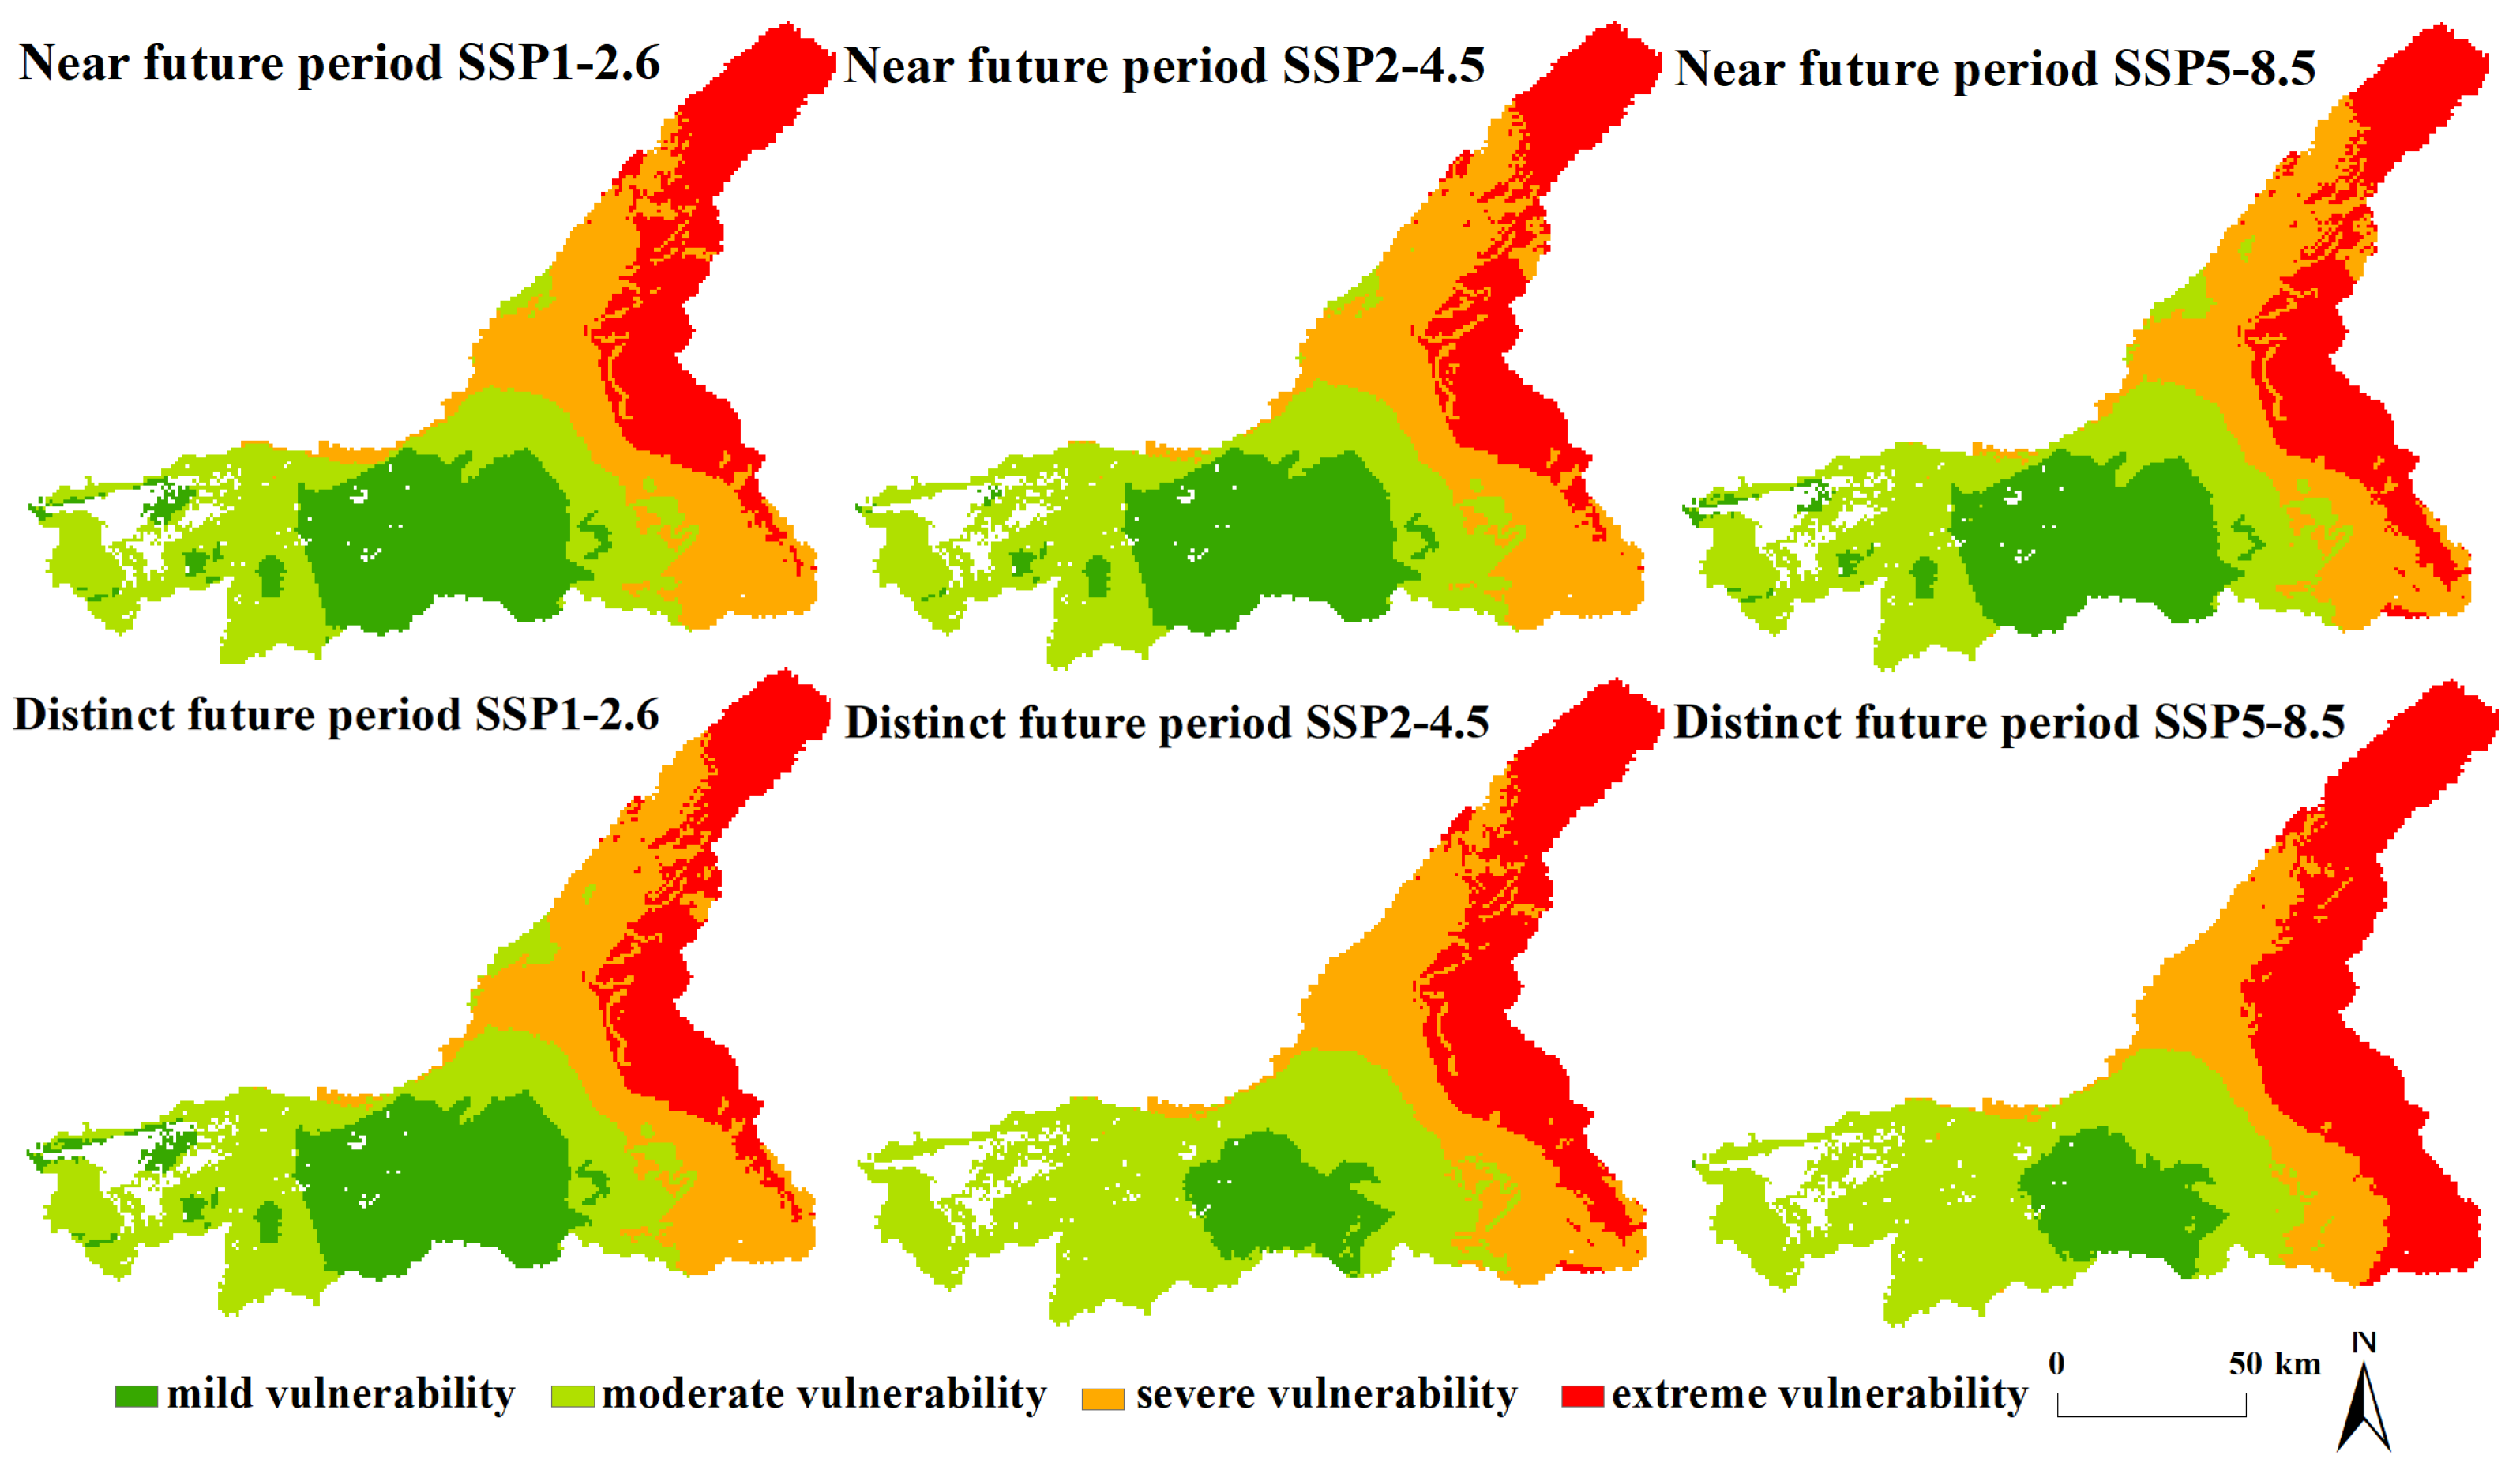
4.3. Vegetation Vulnerability for the Near-Term and Distinct Future Period in MRB
4.4. Spatial Cluster of Vegetation Vulnerability for the near Future Period and the Distinct Future Period in the MRB
4.4.1. Global Moran’s I
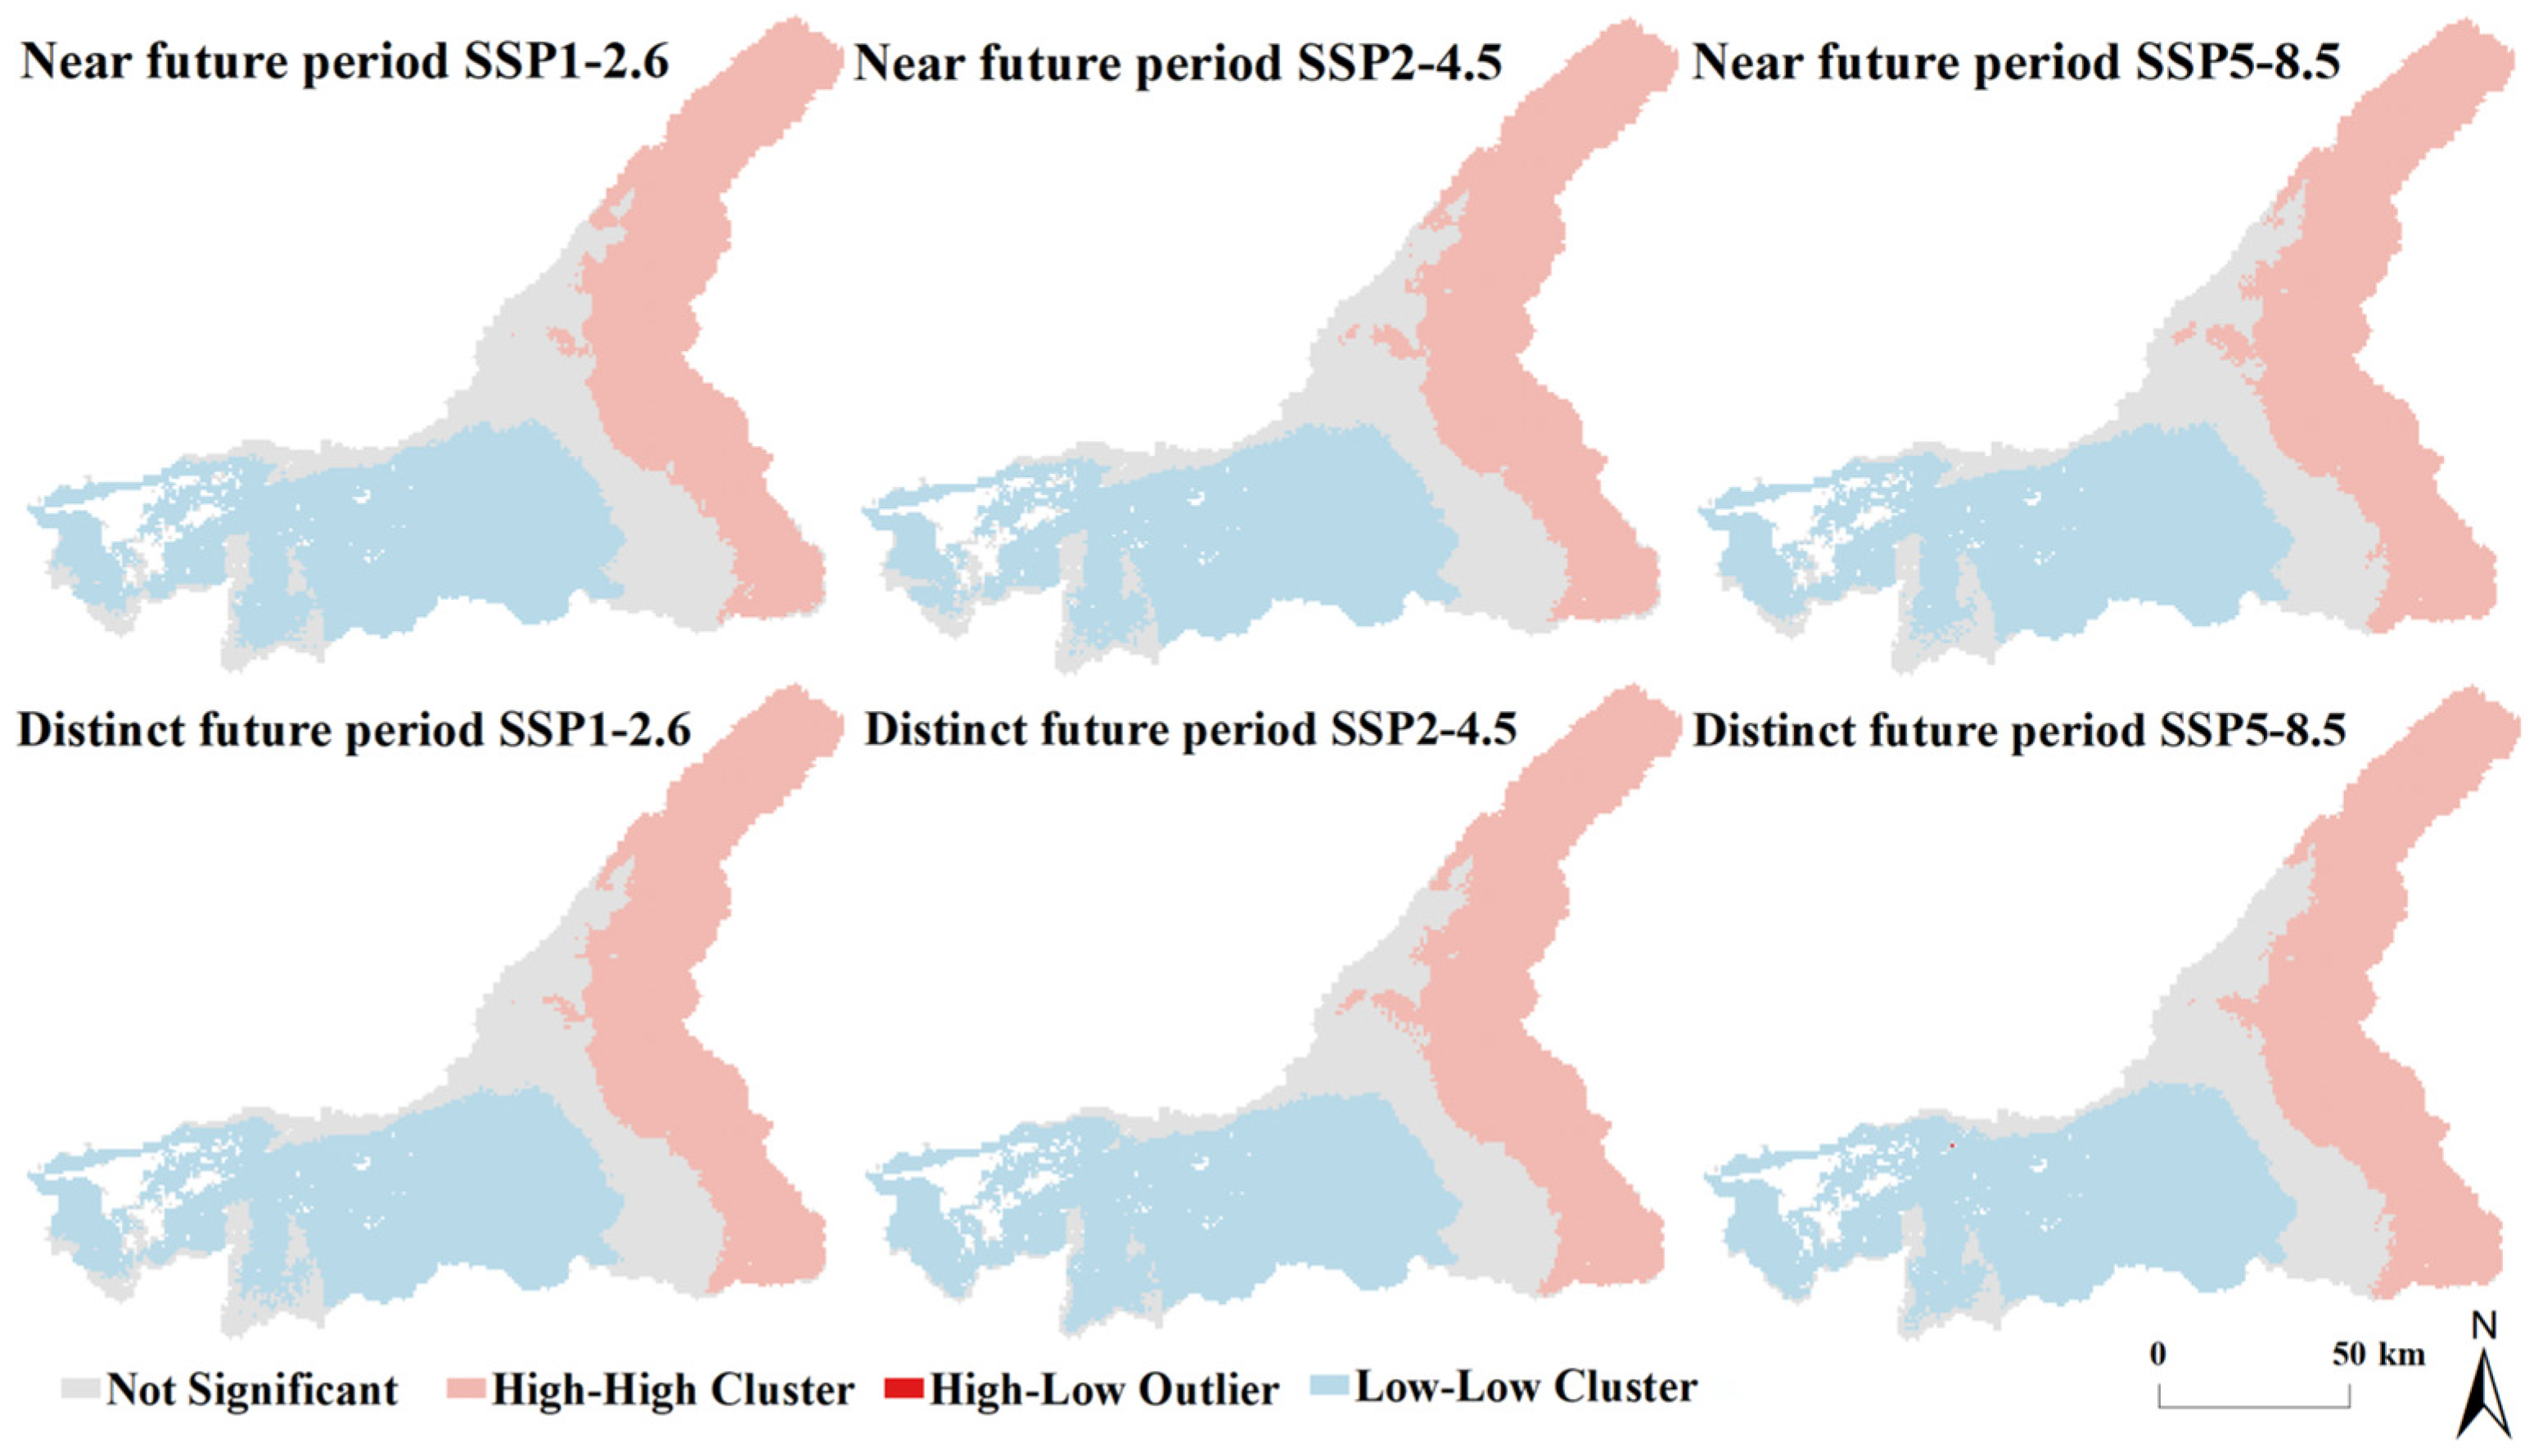
4.4.2. Local Moran’s I
4.5. Transition of Vegetation Vulnerability during Different Periods in the MRB
5. Discussion
5.1. Effects of Factors on Vegetation Vulnerability in the MRB
5.2. Transition of Vegetation Vulnerability under Different Scenarios in the MRB
6. Conclusions
- (1)
- The vegetation vulnerability in MRB for the base period showed a decreasing trend from east to west. The high–high cluster had high vulnerability, and the low–low cluster had low vulnerability.
- (2)
- For the near future period and distinct future period, vegetation vulnerability was highest upstream, followed by the downstream, and the lowest midstream. The vegetation vulnerability showed a high–high cluster in the east, and a low–low cluster in the midstream and downstream.
- (3)
- The upstream of the MRB will experience the highest vegetation vulnerability increase due to intense human activity and less protection. The vegetation vulnerability decreased only under the SSP1-2.6, therefore, the MRB should control population growth, actively respond to climate change, and take the sustainable development path with low-emission to promote the sustainable vegetation in the MRB.
Author Contributions
Funding
Data Availability Statement
Acknowledgments
Conflicts of Interest
References
- Schwalm, C.R.; Anderegg, W.R.; Michalak, A.M.; Fisher, J.B.; Biondi, F.; Koch, G.; Tian, H. Global patterns of drought recovery. Nature 2017, 548, 202–205. [Google Scholar] [CrossRef]
- Zhang, X.; Yu, W.; Cai, H.; Guo, X. Review of the evaluation methods of regional eco-environmental vulnerability. Acta Ecol. Sin 2018, 38, 5970–5981. [Google Scholar]
- Seaquist, J.W.; Hickler, T.; Eklundh, L.; Ardö, J.; Heumann, B.W. Disentangling the effects of climate and people on Sahel vegetation dynamics. Biogeosciences 2009, 6, 469–477. [Google Scholar] [CrossRef]
- Dai, X.; Feng, H.; Xiao, L.; Zhou, J.; Wang, Z.; Zhang, J.; Yao, Y.; Zhang, J.; Fu, T.; Shan, Y.; et al. Ecological vulnerability assessment of a China’s representative mining city based on hyperspectral remote sensing. Ecol. Indic. 2022, 145, 109663. [Google Scholar] [CrossRef]
- Gonzalez, P.; Neilson, R.P.; Lenihan, J.M.; Drapek, R.J. Global patterns in the vulnerability of ecosystems to vegetation shifts due to climate change. Glob. Ecol. Biogeogr. 2010, 19, 755–768. [Google Scholar] [CrossRef]
- Zhao, D.; Wu, S. Vulnerability of natural ecosystem in China under regional climate scenarios: An analysis based on eco-geographical regions. J. Geogr. Sci. 2014, 24, 237–248. [Google Scholar] [CrossRef]
- Turner, B.L.; Kasperson, R.E.; Matson, P.A.; McCarthy, J.J.; Corell, R.W.; Christensen, L.; Eckley, N.; Kasperson, J.X.; Luers, A.; Martello, M.L. A framework for vulnerability analysis in sustainability science. Proc. Natl. Acad. Sci. USA 2003, 100, 8074–8079. [Google Scholar] [CrossRef] [PubMed]
- Wu, C.; Liu, G.; Huang, C.; Liu, Q.; Guan, X. Ecological vulnerability assessment based on fuzzy analytical method and analytic hierarchy process in Yellow River Delta. Int. J. Environ. Res. Public Health 2018, 15, 855. [Google Scholar] [CrossRef] [PubMed]
- Ru, S.F.; Ma, R.H. Evaluation, spatial analysis and prediction of ecological environment vulnerability of Yellow River Basin. J. Nat. Resour 2022, 37, 1722–1734. [Google Scholar] [CrossRef]
- Hyandye, C.; Tao, W.; Hua, C.Z. Evaluation of eco-environmental vulnerability using RS and GIS: Case of Ma Keng iron mining area in Fu Jian Province, China. Environ. Res. J 2008, 2, 196–204. [Google Scholar]
- Bele, M.Y.; Tiani, A.M.; Somorin, O.A.; Sonwa, D.J. Exploring vulnerability and adaptation to climate change of communities in the forest zone of Cameroon. Clim. Chang. 2013, 119, 875–889. [Google Scholar] [CrossRef]
- Nunes, J.P.; Seixas, J.; Pacheco, N.R. Vulnerability of water resources, vegetation productivity and soil erosion to climate change in Mediterranean watersheds. Hydrol. Process. Int. J. 2008, 22, 3115–3134. [Google Scholar] [CrossRef]
- Sitch, S.; Huntingford, C.; Gedney, N.; Levy, P.E.; Lomas, M.; Piao, S.L.; Woodward, F.I.; Betts, R.; Ciais, P.; Cox, P. Evaluation of the terrestrial carbon cycle, future plant geography and climate-carbon cycle feedbacks using five Dynamic Global Vegetation Models (DGVMs). Glob. Chang. Biol. 2008, 14, 2015–2039. [Google Scholar] [CrossRef]
- O’Neill, B.C.; Tebaldi, C.; Van Vuuren, D.P.; Eyring, V.; Friedlingstein, P.; Hurtt, G.; Sanderson, B.M.; Knutti, R.; Kriegler, E.; Lamarque, J.F. The scenario model intercomparison project (ScenarioMIP) for CMIP6. Geosci. Model Dev. 2016, 9, 3461–3482. [Google Scholar] [CrossRef]
- Popp, A.; Calvin, K.; Fujimori, S.; Havlik, P.; Humpenöder, F.; Stehfest, E.; van Vuuren, D.P.; Bodirsky, B.L.; Dietrich, J.P.; Doelmann, J.C. Land-use futures in the shared socio-economic pathways. Glob. Environ. Chang. 2017, 42, 331–345. [Google Scholar] [CrossRef]
- Fenta, A.A.; Tsunekawa, A.; Haregeweyn, N.; Tsubo, M.; Yasuda, H.; Shimizu, K.; Sun, J.; Kawai, T.; Ebabu, K.; Berihun, M.L. Cropland expansion outweighs the monetary effect of declining natural vegetation on ecosystem services in sub-Saharan Africa. Ecosyst. Serv. 2020, 45, 101154. [Google Scholar] [CrossRef]
- Mango, L.M.; Melesse, A.M.; McClain, M.E.; Gann, D.; Setegn, S. Land use and climate change impacts on the hydrology of the upper Mara River Basin, Kenya: Results of a modeling study to support better resource management. Hydrol. Earth Syst. Sci. 2011, 15, 2245–2258. [Google Scholar] [CrossRef]
- Mwemezi, B.R.; Luvara, V.G. Reliability of the environmental feasibility studies to the mining and construction projects: A case of Mara river basin in Tanzania. Am. J. Environ. Eng 2017, 7, 65–72. [Google Scholar]
- Zermoglio, F.; Scott, O.; Said, M. Vulnerability and Adaptation Assessment in the Mara River Basin; U.S. Agency for International Development: Washington, DC, USA, 2019; pp. 102–105. [Google Scholar]
- Inglada, J.; Mercier, G. A new statistical similarity measure for change detection in multitemporal SAR images and its extension to multiscale change analysis. IEEE Trans. Geosci. Remote Sens. 2007, 45, 1432–1445. [Google Scholar] [CrossRef]
- Minale, A.S. Retrospective analysis of land cover and use dynamics in Gilgel Abbay Watershed by using GIS and remote sensing techniques, Northwestern Ethiopia. Int. J. Geosci. 2013, 4, 1003. [Google Scholar] [CrossRef]
- del Río, S.; Canas, R.; Cano, E.; Cano-Ortiz, A.; Musarella, C.; Pinto-Gomes, C.; Penas, A. Modelling the impacts of climate change on habitat suitability and vulnerability in deciduous forests in Spain. Ecol. Indic. 2021, 131, 108202. [Google Scholar] [CrossRef]
- Li, W.; Buitenwerf, R.; Munk, M.; Bøcher, P.K.; Svenning, J.C. Deep-learning based high-resolution mapping shows woody vegetation densification in greater Maasai Mara ecosystem. Remote Sens. Environ. 2010, 247, 111953. [Google Scholar] [CrossRef]
- Zhu, W.; Zhang, Z.; Zhao, S.; Guo, X.; Das, P.; Feng, S.; Liu, B. Vegetation Greenness Trend in Dry Seasons and Its Responses to Temperature and Precipitation in Mara River Basin, Africa. ISPRS Int. J. Geo-Inf. 2022, 11, 426. [Google Scholar] [CrossRef]
- Zhu, W.; Zhang, Z.; Guo, X.; Feng, S.; Jiang, D.; Jiang, F. Characteristics and estimation of vegetation ecological water demand in the Mara River Basin. Acta Ecol. Sin. 2023, 43, 7523–7535. [Google Scholar]
- Mwangi, H.M.; Julich, S.; Patil, S.D.; McDonald, M.A.; Feger, K.H. Modelling the impact of agroforestry on hydrology of Mara River Basin in East Africa. Hydrol. Process. 2016, 30, 3139–3155. [Google Scholar] [CrossRef]
- Bregoli, F.; Crosato, A.; Paron, P.; McClain, M.E. Humans reshape wetlands: Unveiling the last 100 years of morphological changes of the Mara Wetland, Tanzania. Sci. Total Environ. 2019, 691, 896–907. [Google Scholar] [CrossRef] [PubMed]
- Mati, B.M.; Mutie, S.; Gadain, H.; Home, P.; Mtalo, F. Impacts of land-use/cover changes on the hydrology of the transboundary Mara River, Kenya/Tanzania. Lakes Reserv. Res. Manag. 2008, 13, 169–177. [Google Scholar] [CrossRef]
- Hu, X.; Ma, C.; Huang, P.; Guo, X. Ecological vulnerability assessment based on AHP-PSR method and analysis of its single parameter sensitivity and spatial autocorrelation for ecological protection–A case of Weifang City, China. Ecol. Indic. 2021, 125, 107464. [Google Scholar] [CrossRef]
- He, L.; Shen, J.; Zhang, Y. Ecological vulnerability assessment for ecological conservation and environmental management. J. Environ. Manag. 2018, 206, 1115–1125. [Google Scholar] [CrossRef]
- Blüthgen, N.; Dormann, C.F.; Prati, D.; Klaus, V.H.; Kleinebecker, T.; Hölzel, N.; Weisser, W.W.; Alt, F.; Boch, S.; Gockel, S. A quantitative index of land-use intensity in grasslands: Integrating mowing, grazing and fertilization. Basic Appl. Ecol. 2012, 13, 207–220. [Google Scholar] [CrossRef]
- Hurtt, G.C.; Chini, L.; Sahajpal, R.; Frolking, S.; Bodirsky, B.L.; Calvin, K.; Fisk, J.; Fujimori, S.; Klein Goldewijk, K. Harmonization of global land use change and management for the period 850–2100 (LUH2) for CMIP6. Geosci. Model Dev. 2020, 13, 5425–5464. [Google Scholar] [CrossRef]
- Eyring, V.; Bony, S.; Meehl, G.A.; Senior, C.A.; Stevens, B.; Stouffer, R.J.; Taylor, K.E. Overview of the Coupled Model Intercomparison Project Phase 6 (CMIP6) experimental design and organization. Geosci. Model Dev. 2016, 9, 1937–1958. [Google Scholar] [CrossRef]
- Schröter, D.; Cramer, W.; Leemans, R.; Prentice, I.C.; Araújo, M.B.; Arnell, N.W.; Bondeau, A.; Bugmann, H.; Carter, T.R.; Gracia, C.A.; et al. Ecosystem service supply and vulnerability to global change in Europe. Science 2005, 310, 1333–1337. [Google Scholar] [CrossRef]
- Williams, J.W.; Jackson, S.T.; Kutzbach, J.E. Projected distributions of novel and disappearing climates by 2100 AD. Proc. Natl. Acad. Sci. USA 2007, 104, 5738–5742. [Google Scholar] [CrossRef]
- Dessu, S.B.; Melesse, A.M.; Bhat, M.G.; McClain, M.E. Assessment of water resources availability and demand in the Mara River Basin. Catena 2014, 115, 104–114. [Google Scholar] [CrossRef]
- Ogutu, J.O.; Owen-Smith, N. ENSO, rainfall and temperature influences on extreme population declines among African savanna ungulates. Ecol. Lett. 2003, 6, 412–419. [Google Scholar] [CrossRef]
- Galvin, K.A.; Thornton, P.K.; Boone, R.B.; Sunderland, J. Climate variability and impacts on East African livestock herders: The Maasai of Ngorongoro Conservation Area, Tanzania. Afr. J. Range Forage Sci. 2004, 21, 183–189. [Google Scholar] [CrossRef]
- Bradford, J.B.; Andrews, C.M.; Robles, M.D.; McCauley, L.A.; Woolley, T.J.; Marshall, R.M. Landscape-scale restoration minimizes tree growth vulnerability to 21st century drought in a dry forest. Ecol. Appl. 2021, 31, e2238. [Google Scholar] [CrossRef]
- Li, H.; Li, Z.; Chen, Y.; Xiang, Y.; Liu, Y.; Kayumba, P.M.; Li, X. Drylands face potential threat of robust drought in the CMIP6 SSPs scenarios. Environ. Res. Lett. 2021, 16, 114004. [Google Scholar] [CrossRef]
- Perfect, H. Methods of constructing certain stochastic matrices. Duke Math. J. 1953, 22, 305–311. [Google Scholar] [CrossRef]
- Chen, Z.T.; Liu, H.Y.; Xu, C.Y.; Wu, X.C.; Liang, B.Y.; Cao, J.; Chen, D. Deep learning projects future warming-induced vegetation growth changes under SSP scenarios. Adv. Clim. Chang. Res. 2022, 13, 251–257. [Google Scholar] [CrossRef]
- Yuxi, W.; Li, P.; Yuemin, Y.; Tiantian, C. Global vegetation-temperature sensitivity and its driving forces in the 21st century. Earth’s Future 2024, 12, e2022EF003395. [Google Scholar] [CrossRef]
- Li, W.; Buitenwerf, R.; Munk, M.; Amoke, I.; Bøcher, P.K.; Svenning, J.C. Accelerating savanna degradation threatens the Maasai Mara socio-ecological system. Glob. Environ. Chang. 2020, 60, 102030. [Google Scholar] [CrossRef]
- Wang, T.; Sun, F. Integrated drought vulnerability and risk assessment for future scenarios: An indicator based analysis. Sci. Total Environ. 2023, 900, 165591. [Google Scholar] [CrossRef]
- Ma, S.; Qiao, Y.P.; Wang, L.J.; Zhang, J.C. Terrain gradient variations in ecosystem services of different vegetation types in mountainous regions: Vegetation resource conservation and sustainable development. For. Ecol. Manag. 2021, 482, 118856. [Google Scholar] [CrossRef]


| Factors | Index | Unit | Property |
|---|---|---|---|
| Natural factors | Precipitation | mm | − |
| Temperature | °C | − | |
| Elevation | m | + | |
| Vegetation ecological water | m3 | − | |
| Human factors | Population density | person/km2 | + |
| Land use | % | + |
| Farmlands | Forests | Grasslands | Shrubs |
|---|---|---|---|
| 0.71 | 0.17 | 0.29 | 0.29 |
| 2019 | 2020–2059 | 2060–2099 | |
|---|---|---|---|
| Population density/person·km−2 | 121.17 | 197.79 | 261.45 |
| Factors | Base Period | Near Future Period | Distinct Future Period | ||||
|---|---|---|---|---|---|---|---|
| SSP1-2.6 | SSP2-4.5 | SSP5-8.5 | SSP1-2.6 | SSP2-4.5 | SSP5-8.5 | ||
| Precipitation | −0.67 | −0.69 | −0.62 | −0.56 | −0.69 | −0.65 | −0.60 |
| Temperature | −0.79 | −0.85 | −0.80 | −0.75 | −0.86 | −0.84 | −0.79 |
| Elevation | 0.77 | 0.81 | 0.80 | 0.83 | 0.82 | 0.81 | 0.87 |
| Vegetation | −0.61 | −0.63 | −0.60 | −0.50 | −0.66 | −0.62 | −0.51 |
| Population | 0.60 | 0.59 | 0.70 | 0.83 | 0.68 | 0.78 | 0.89 |
| Land use | 0.78 | 0.64 | 0.70 | 0.72 | 0.74 | 0.80 | 0.87 |
| Period | Scenario | Global Moran’s I | p-Value | Z-Value | Variance |
|---|---|---|---|---|---|
| Near future period | SSP1-2.6 | 0.5963 | p < 0.01 | 12.9971 | 0.0021 |
| SSP2-4.5 | 0.6077 | p < 0.01 | 13.4134 | 0.0021 | |
| SSP5-8.5 | 0.6028 | p < 0.01 | 11.2632 | 0.0029 | |
| Distinct future period | SSP1-2.6 | 0.5024 | p < 0.01 | 11.0596 | 0.0021 |
| SSP2-4.5 | 0.4108 | p < 0.01 | 8.8842 | 0.0021 | |
| SSP5-8.5 | 0.4811 | p < 0.01 | 10.7101 | 0.0020 |
| Base Period | |||||
|---|---|---|---|---|---|
| Mild | Moderate | Severe | Extreme | ||
| Near future period SSP1-2.6 | Mild | 1427.61 | 1057.06 | 73.70 | 0.08 |
| Moderate | 1676.52 | 1379.37 | 503.02 | 86.39 | |
| Severe | 22.74 | 1289.47 | 464.29 | 954.46 | |
| Extreme | 0.00 | 106.47 | 1559.48 | 455.86 | |
| Near future period SSP2-4.5 | Mild | 1351.47 | 1024.37 | 73.73 | 0.13 |
| Moderate | 1752.05 | 1041.04 | 415.79 | 102.43 | |
| Severe | 24.24 | 1496.44 | 424.03 | 901.02 | |
| Extreme | 0.00 | 170.01 | 1687.06 | 493.15 | |
| Near future period SSP5-8.5 | Mild | 1338.22 | 979.58 | 68.75 | 0.05 |
| Moderate | 1752.92 | 959.38 | 309.23 | 73.93 | |
| Severe | 36.71 | 1413.57 | 544.01 | 795.42 | |
| Extreme | 0.00 | 379.88 | 1678.56 | 625.36 | |
| Distinct future period SSP1-2.6 | Mild | 1459.88 | 1094.89 | 76.52 | 0.13 |
| Moderate | 1660.31 | 1041.00 | 513.20 | 86.40 | |
| Severe | 7.25 | 1410.49 | 585.67 | 836.62 | |
| Extreme | 0.00 | 187.05 | 1425.16 | 573.64 | |
| Distinct future period SSP2-4.5 | Mild | 577.33 | 480.51 | 28.75 | 0.00 |
| Moderate | 2535.59 | 1406.58 | 445.61 | 35.13 | |
| Severe | 16.63 | 1435.84 | 496.37 | 780.14 | |
| Extreme | 0.00 | 407.28 | 1628.81 | 679.34 | |
| Distinct future period SSP5-8.5 | Mild | 506.43 | 502.26 | 40.70 | 0.00 |
| Moderate | 2604.85 | 983.15 | 293.66 | 15.30 | |
| Severe | 18.47 | 1584.28 | 493.95 | 373.88 | |
| Extreme | 0.00 | 660.82 | 1771.22 | 1108.06 | |
Disclaimer/Publisher’s Note: The statements, opinions and data contained in all publications are solely those of the individual author(s) and contributor(s) and not of MDPI and/or the editor(s). MDPI and/or the editor(s) disclaim responsibility for any injury to people or property resulting from any ideas, methods, instructions or products referred to in the content. |
© 2024 by the authors. Licensee MDPI, Basel, Switzerland. This article is an open access article distributed under the terms and conditions of the Creative Commons Attribution (CC BY) license (https://creativecommons.org/licenses/by/4.0/).
Share and Cite
Zhu, W.; Zhang, Z.; Feng, S.; Ren, H. Prediction and Transition of Vegetation Vulnerability in the Mara River Basin under Different Shared Socio-Economic Pathways (SSPs), East Africa. Forests 2024, 15, 610. https://doi.org/10.3390/f15040610
Zhu W, Zhang Z, Feng S, Ren H. Prediction and Transition of Vegetation Vulnerability in the Mara River Basin under Different Shared Socio-Economic Pathways (SSPs), East Africa. Forests. 2024; 15(4):610. https://doi.org/10.3390/f15040610
Chicago/Turabian StyleZhu, Wanyi, Zhenke Zhang, Shouming Feng, and Hang Ren. 2024. "Prediction and Transition of Vegetation Vulnerability in the Mara River Basin under Different Shared Socio-Economic Pathways (SSPs), East Africa" Forests 15, no. 4: 610. https://doi.org/10.3390/f15040610
APA StyleZhu, W., Zhang, Z., Feng, S., & Ren, H. (2024). Prediction and Transition of Vegetation Vulnerability in the Mara River Basin under Different Shared Socio-Economic Pathways (SSPs), East Africa. Forests, 15(4), 610. https://doi.org/10.3390/f15040610