Article

How Does Carbon Trading Impact China’s Forest Carbon Sequestration Potential and Carbon Leakage?

1
School of Economics and Management, Beijing Forestry University, Beijing 100083, China
2
School of Agricultural Economics and Rural Development, Renmin University of China, Beijing 100872, China
*
Author to whom correspondence should be addressed.
Forests 2024, 15(3), 497; https://doi.org/10.3390/f15030497
Submission received: 1 February 2024 / Revised: 5 March 2024 / Accepted: 6 March 2024 / Published: 7 March 2024

Abstract

:
This paper presents an in-depth analysis of the impact of forest carbon sink trading in China, examining its effects from 2018 to 2030 under various carbon pricing scenarios. Using the Global Timber Market Model (GFPM) along with the IPCC Carbon Sink Model, we simulate the potential shifts in China’s forest resources and the global timber market. The study finds that forest carbon trading markedly boosts China’s forest stock and carbon sequestration, aligning with its dual carbon objectives. China’s implementation of forest carbon trading is likely to result in a degree of carbon leakage on a global scale. During the forecast period, our study reveals that the carbon leakage rates under three different forest carbon trading price scenarios, which at estimated at 81.5% (USD 9.8/ton), 64.0% (USD 25/ton), and 57.8% (USD 54/ton), respectively. Notably, the leakage rate diminishes as the forest carbon sink price increases. Furthermore, analysis also suggests that regional variations in the average carbon sequestration capacity of forests, alongside the structure of China’s timber imports, emerge as significant factors influencing the extent of carbon leakage.

1. Introduction

In 2020, the Chinese government set ambitious targets to reach a carbon peak by 2030 and achieve carbon neutrality by 2060. A key strategy in meeting these dual carbon goals involves leveraging forest carbon sinks, which are recognized for their cost-effectiveness and multifaceted benefits in economic, ecological, and social domains [1,2,3]. The inclusion of forest carbon sinks in China’s carbon emissions trading market marks a significant step in enhancing ecological value compensation mechanisms and optimizing ecosystem carbon sinks [4,5].
However, implementing forest carbon sink policies poses unique challenges including the issue of carbon leakage and the unintended reduction in carbon sinks in regions where these policies are not implemented [6]. This phenomenon can weaken the efficacy of carbon sink policies and impact global carbon emission reduction efforts [7]. Existing studies primarily using equilibrium modeling reveal varying global carbon leakage rates from 5% to 95%, highlighting the complexity of addressing this issue in the forest sector [8,9,10,11]. This study aims to assess the potential and challenges of forest carbon sink policies in China, with a particular focus on understanding and mitigating carbon leakage, thereby contributing to the broader objective of global carbon emission reduction.
Scientifically assessing the potential of forest carbon sinks is vital for shaping and analyzing forest policies. Sedjo and Solomon estimated global forest growth trends and carbon sequestration capabilities, and they concluded that forest carbon sinks are an effective strategy for reducing global carbon emissions [12]. Following this, numerous scholars have developed and refined large-scale carbon dynamics and cycle models by considering various factors to improve prediction accuracy [13]. In line with this international trend, domestic researchers have also focused on the potential of China’s forest carbon sinks by employing commonly used international models for predictions and assessments [14,15]. Analysis of forest inventory data and an evaluation of China’s forest policy suggest that China’s forest carbon sinks possess considerable potential [16,17]. While these studies primarily focus on ecological growth patterns by analyzing relationships between age groups, tree species, forest biomass, and carbon sinks [18], they often overlook the economic attributes of forest carbon sinks, which are significantly influenced by economic activities [19]. Subsequent research improved the partial equilibrium forestry model to include economic factors and forestry policies, such as economic development levels, policy reforms, and forest land tenure, thereby offering a more precise assessment of the potential of China’s forest carbon sinks [20,21].
China’s ambitious dual carbon targets mirror its dedication to active participation in global climate governance [22]. Central to this mission is the assessment of the role of China’s forest carbon sinks within its carbon emission trading market, with a particular emphasis on the broader issue of carbon leakage and its worldwide impact [23]. This assessment is pivotal in refining China’s forest carbon policies and in reinforcing its strategic role in global climate discussions. However, the wider global effects of these policies have not been thoroughly investigated in existing research.
This study addresses these research gaps by utilizing the Global Forest Product Model (GFPM) to simulate the impacts of various forest carbon sink price scenarios on forest and carbon stocks, as well as on the timber market, both within China and globally from 2018 to 2030. Our analysis extends beyond domestic perspectives, incorporating the global repercussions of China’s forest carbon sink policies. The innovative application of the GFPM, which is enhanced with bilateral trade data between China and importing countries of key forest products, enables a nuanced prediction of the shifts in China’s forest product import patterns under different carbon sink trading scenarios. This approach represents a significant advancement in the assessment of China’s forest carbon sink policies, filling a crucial gap in the current body of research.

2. Theoretical and Framework Analysis

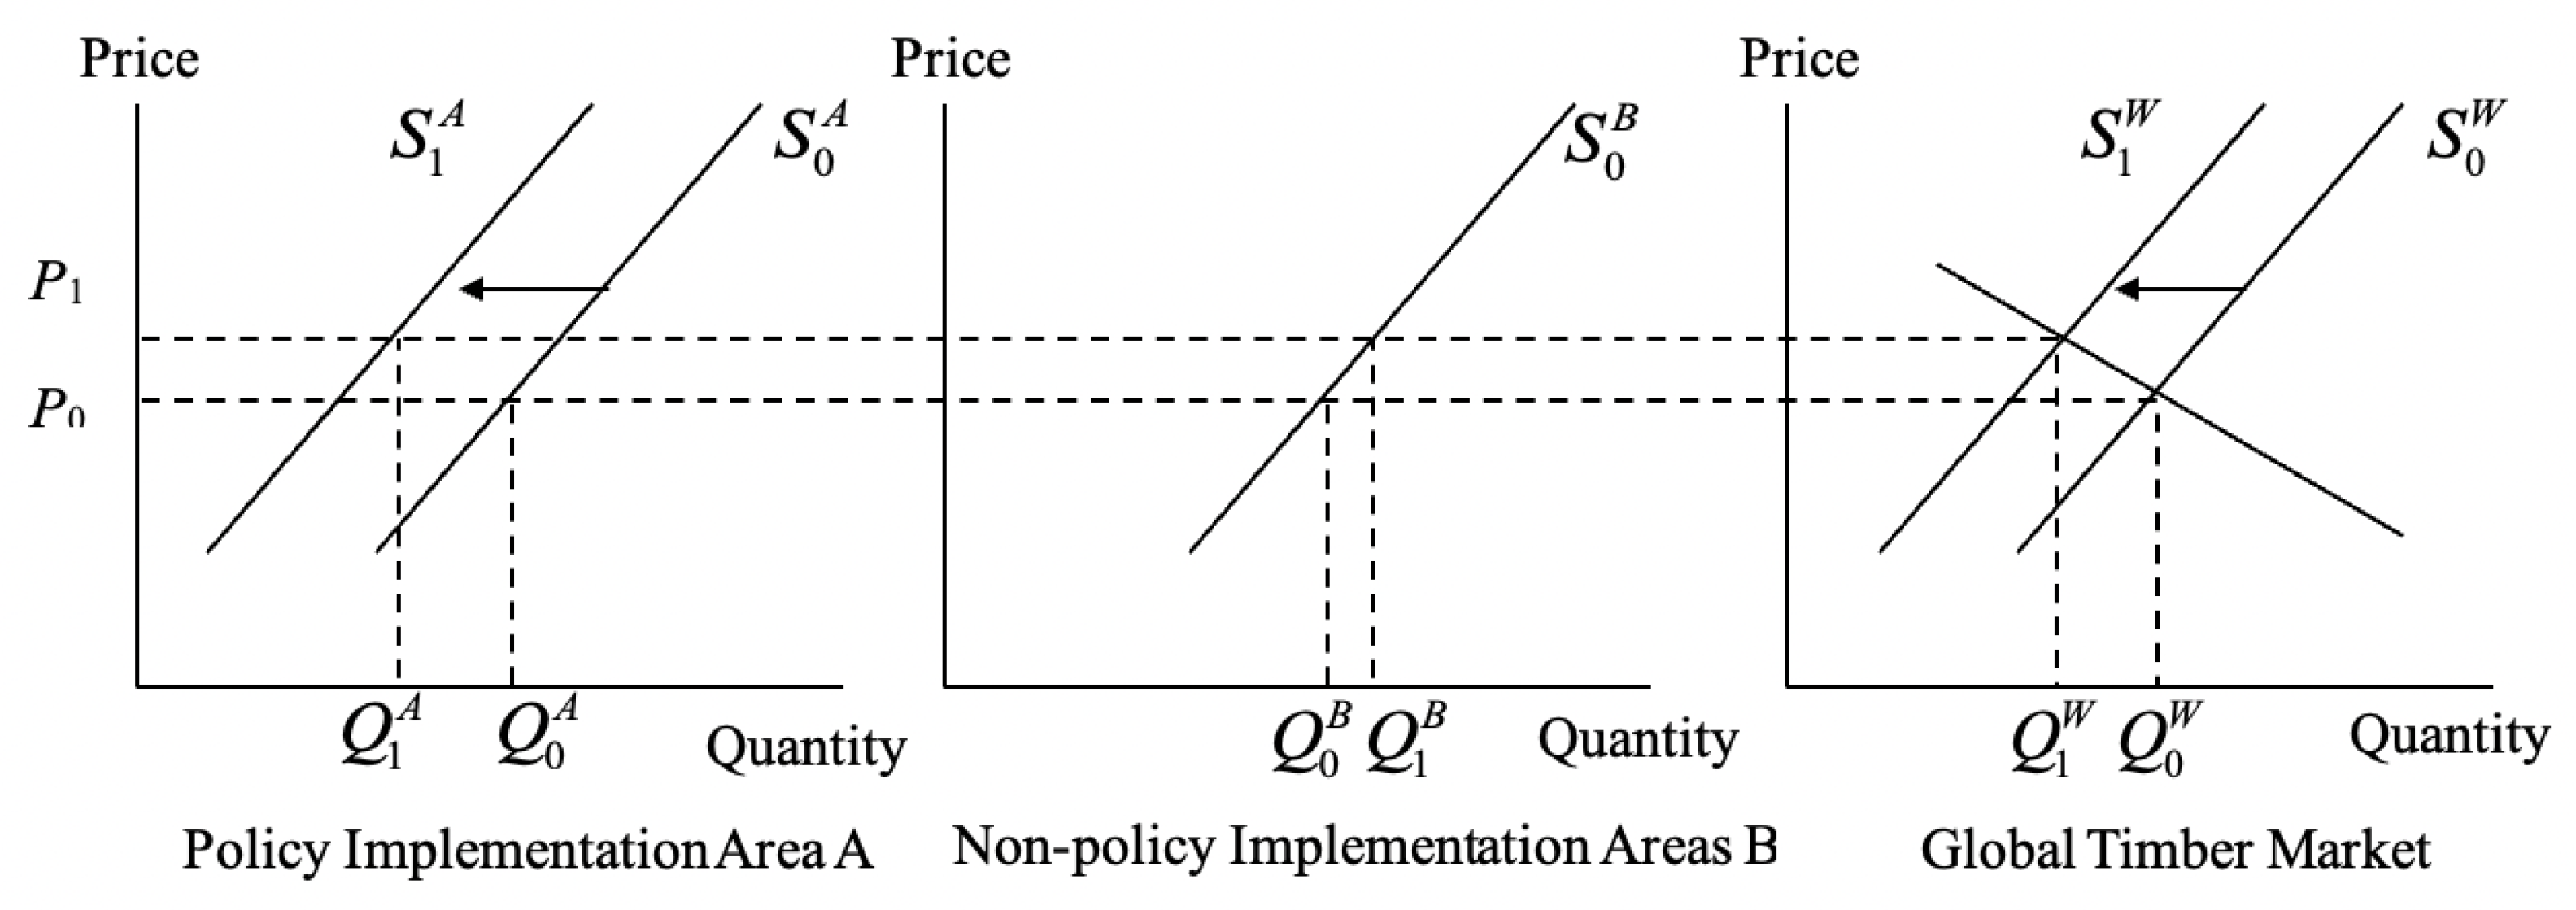
2.1. Economic Analysis of Carbon Leakage
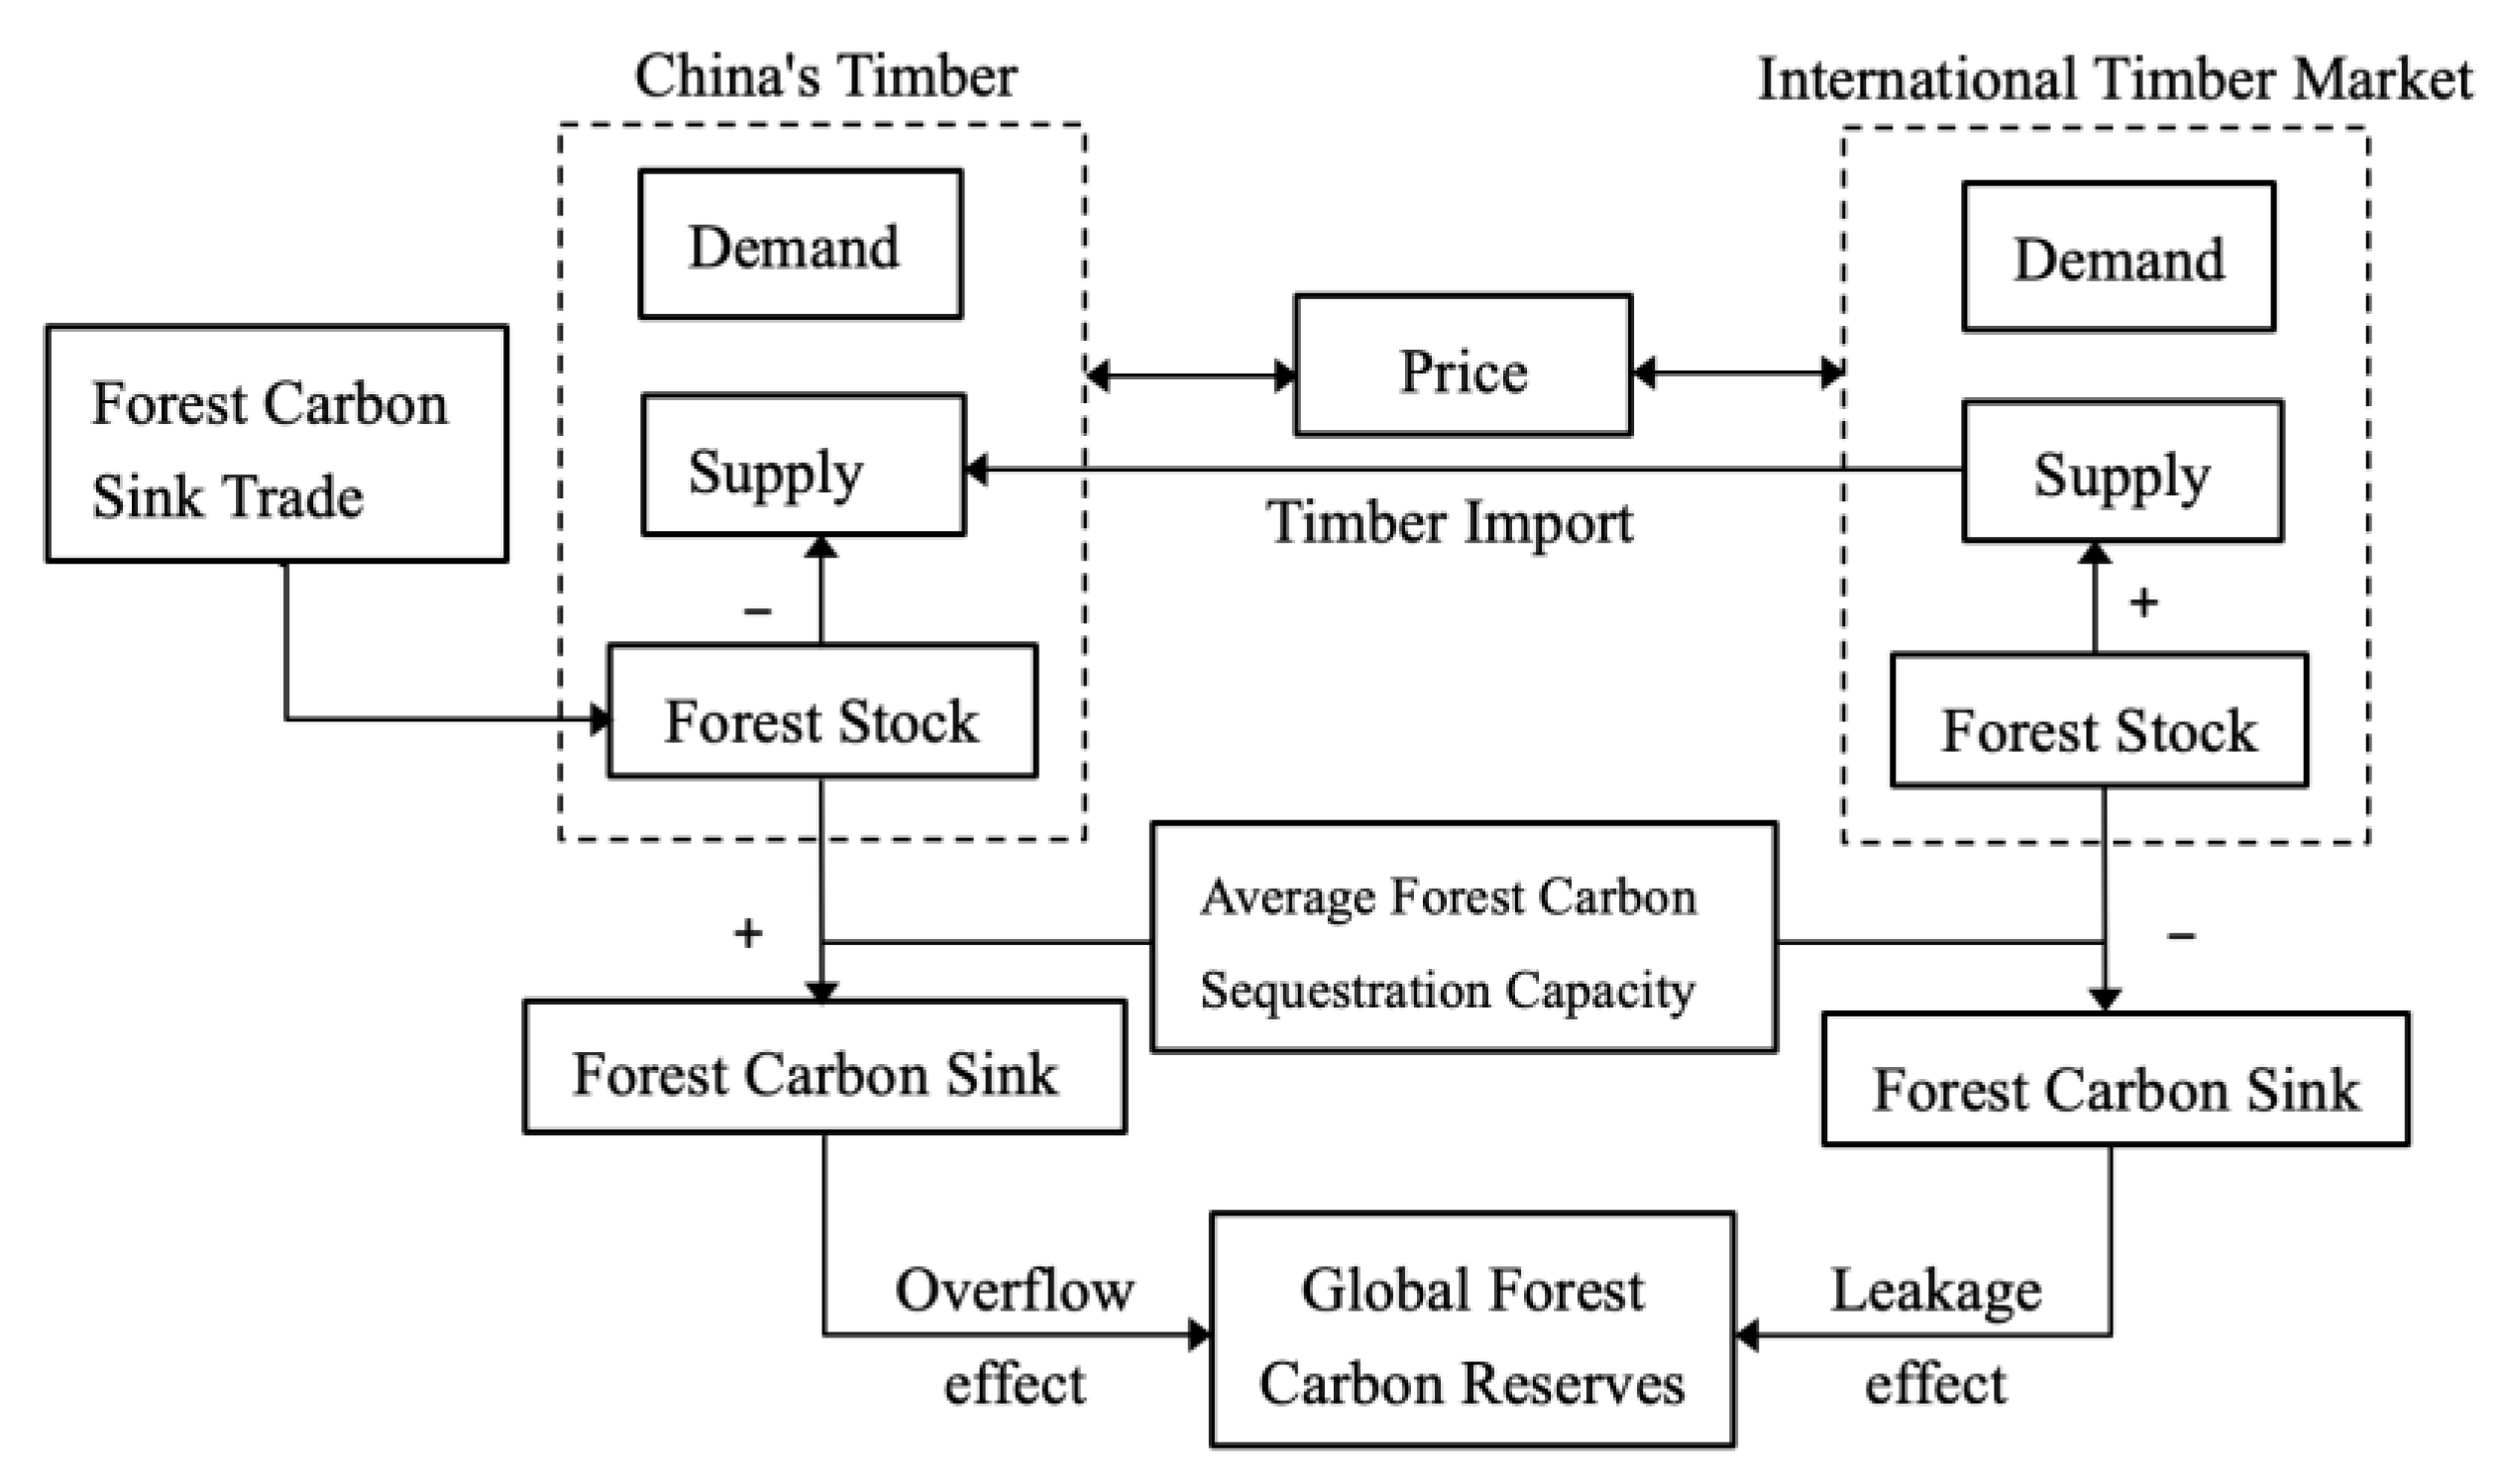
Figure 1 describes how connectivity in the global timber market can lead to leakage from forest carbon sink policies. The theoretical model of carbon leakage divides the study area into forest carbon sink policy implementation region A and non-implementation region B, which together constitute the global timber market.
The implementation of the forest carbon sink policy leads to a decrease in wood supply in region A and a leftward shift of the wood supply curve from S 0 A to S 1 A , whereas region B, which is not constrained by the forest carbon sink policy, maintains the level of wood supply at the original level, and there is no shift in the wood supply curve S 0 B . At the same time, implementing the forest carbon sink policy leads to a decline in supply in the global timber market ( S 0 W shifts left to S 1 W in Figure 1). Since the region-wide demand for timber is fixed, the decline in the timber supply leads to a region-wide increase in the price of timber from P 0 to P 1 . Under the price mechanism, the supply of timber in policy non-implementation region B grows from Q 0 B to Q 1 B . The process by which the implementation of a carbon sink policy in region A leads to a decrease in the forest carbon sink due to an increase in timber harvesting in policy non-implementation region B is called carbon leakage.

2.2. Framework

As a leading player in forest product processing and trade, China’s forest carbon sink policy wields substantial influence both domestically and internationally. Figure 2 delineates the dual mechanisms by which China’s forest carbon sink trading affects global forest carbon stocks. Firstly, this trading provides compensation for the carbon sequestration capabilities of forests, thereby increasing the opportunity cost that is associated with timber harvesting. This leads to a decrease in domestic timber supply, resulting in an enhancement of both the forest stock and carbon sinks within China and consequently exerting a positive influence on global forest carbon stocks.
Secondly, the interconnected nature of the global timber market means that any decrease in China’s timber supply is likely to be offset by a rise in timber imports. Such a shift could diminish forest stock and carbon sinks in exporting countries, resulting in a “leakage effect” that adversely impacts global forest carbon stocks. This phenomenon demonstrates how forest carbon sink trading can influence domestic timber supply dynamics, thereby affecting the equilibrium of the global timber market [24]. The resulting changes in supply and demand lead to an increase in global timber prices, incentivizing landowners in non-policy regions to increase deforestation for financial gain [8,25]. Furthermore, regional differences in the price elasticity of supply and demand for forest products alongside the varying average carbon sequestration capacities of forests play crucial roles in shaping the overall impact of these dynamics [26,27].

3. Methodology and Materials

3.1. GFPM

The Global Forest Products Model (GFPM) is a recursive dynamic economic model of the global forest sector that has been documented in detail [28,29]. Over approximately 30 years, it has undergone extensive international validation and testing, with assessing the global carbon emission based on harvested wood products [30,31]. This model has become a crucial instrument for predicting forest carbon sink potentials [20,32] and assessing the impact of carbon offsetting on global forest product markets [33,34]. The GFPM encompasses market equilibrium states for 14 different forest products, ranging from raw materials to intermediate and final products, across around 180 trading countries and regions [35]. This comprehensive scope enables the GFPM to accurately reflect the dynamics of global forest product trade and related industries. As such, it is particularly adept at analyzing the potential of forest carbon sinks and carbon leakage [36]. In this study, we employ the forestry-specific partial equilibrium model of the GFPM, focusing on the global timber market, for our empirical analysis.
GFPM solves a global spatial market equilibrium problem for selected years at periodic intervals over a multi-decadal time frame, and also simulates dynamic changes in supplies, demands, input coefficients and costs from period to period [37]. GFPM includes various variables including the supply of industrial logs, as well as imports and exports by country [29]. It represents demand and supply for each product through econometric functions and activity analysis, with trade being influenced by the economic growth of countries and their relative competitive advantages. The model determines the equilibrium for each year by maximizing the quasi-welfare of the global forest sector. This is calculated as the value of forest products to consumers, subtracting the costs of production and transportation. The equilibrium price in the model is represented as the shadow price of each country’s material balance constraint. For every product and country, the model equates demand to the sum of domestic production, imports, and exports.
The GFPM contains static and dynamic statistics. The static component corresponds to the market’s short-run equilibrium. It aims to maximize the combined sum of consumer and producer surplus for all products and countries. The sum of producer and consumer surplus is given by the area under all of the demand curve up to the quantities demanded minus the area under all of the supply curves up the quantities supplied minus the sum of net manufacturing costs or marginal costs of production and minus the transportation costs.
The principal constraints in GFPM are material balance constraints, which ensure in each period for each commodity and each country or region that total demand quantity plus the quantity used in manufacturing other products plus exports must be less than or equal to total supply quantity plus production quantity plus imports, as represented in general by Equation (1).
max   Z = i k 0 D i k P i k ( D i k ) d D i k i k 0 S i k P i k ( S i k ) d S i k i k 0 Y i k m i k ( Y i k ) d Y i k i j k c i j k T i j k
Subject to:
j T j i k + S i k + Y i k D i k n a i k n Y i n j T i j k   =   0 i , k
T i j k L T i j k T i j k U
where Z = the sum of all producer surplus and consumer surplus in the forest products market.
i, j—the countries.
k—a certain type of forest product
p—the price.
D—the demand for final products.
S—the supply of raw materials.
Y—the quantity of processed products.
m—the processing cost.
T—the quantity of trade.
c—the transportation cost, including tariff.
a i k n —the input of product k per unit of product n in country i .
L, U—the upper and lower trade bounds.
In addition to material balance constraints, the quantity imported plus the supplied and manufactured domestically equal domestic demand plus the quantity used to manufacture other products and exported. In order to restrict the final trade outcome to a reasonable range, the model sets “trade inertia” based on historical trade volumes between countries (Equations (2) and (3)).
Under exogenous shocks, the equilibrium price, quantity of supply and demand, quantity of production and quantity of trade at short-run market clearing can be solved according to Equations (1)–(3). While the long-run equilibrium consists of a series of short-run equilibria, the dynamic solution process is realized by dynamic recursion to update the parameters. In the long-run equilibrium, the GFPM assumes that economic growth affects the demand for forest products, the price of forest products, and ultimately the stock of forest resources on the one hand, and the area and stock of forests on the other hand, through the environmental Kuznets curve and the growth-consumption equation. Due to space limitation, the principle of solving the long-term dynamics of the GFPM is described in Buongiorno et al. [38].
The central exogenous variable in this study is the forest carbon sink trading price. The forest carbon sink price is described as the opportunity cost of timber harvesting in this model, which affects the log price, see Equation (4). Where P denotes log price, S denotes log supply, and ω denotes the loss of forest biomass due to timber harvesting in t C/m3. P c 1 is the current forest carbon sink price, P c 0 is the forest carbon sink price in the previous period, and a 1 and b 1 are the parameters of the log supply function.
P = a 1 + b 1 S + ϖ ( P c 1 P c 0 )
where P—the log price.
S—the log supply.
ω—the forest biomass loss due to timber harvesting, calculated in t C/m3.
Pc1—the current period forest carbon sequestration price.
Pc0—the previous period forest carbon sequestration price.
a1, b1—the parameters of log supply function.

3.2. Data

This study utilizes the 2020 version of the Global Forest Products Model (GFPM) with 2017 as the base year. The foundational data for this model encompass a range of global forest resource information, economic and demographic statistics, forest product trading, and various elasticity parameters. The global forest resource data are sourced from the Global Forest Resources Assessment released by the FAO, detailing each country’s forest area, volume, and annual changes (FAO). Economic data for forest products, covering import and export quantities and values for 14 categories from 180 countries, are obtained from the FAOSTAT database. Additionally, economic data, including each country’s GDP and population figures, are derived from the World Bank.
In this research, we have specifically augmented the GFPM with trade data between China and 37 other countries (added countries include: Cameroon, Equatorial Guinea, Gabon, Gambia, Ghana, Nigeria, Zambia, Brazil, Indonesia, Laos, Malaysia, Myanmar, Thailand, Vietnam, Papua New Guinea, Solomon Islands, Russia, Canada, the United States, Chile, Uruguay, Japan, South Korea, Australia, New Zealand, Austria, Belgium, Finland, France, Germany, Italy, Netherlands, Romania, Spain, Sweden, Switzerland and and the United Kingdom), which are sourced from both the FAOSTAT database and the United Nations trade database. This addition enriches the model’s representation of bilateral trade dynamics.

3.3. Calculation of Forest Carbon Stocks

The GFPM is employed to estimate and calibrate other necessary parameters. The calculation of forest carbon stocks is based on the forest stock data obtained from the GFPM, employing the “average conversion factor method”. This method enables the estimation of forest biomass, which is then used to calculate the corresponding carbon stock. For the purposes of this study, China’s forest carbon stock calculation includes the carbon stock of living forest organisms (both above-ground and below-ground biomass) and dead-wood carbon stocks. However, it excludes the carbon stock of fallen leaves, soil, bamboo forests, and economic forests.
C = A × V × B C E F S × ( 1 + R ) × ( 1 + R D W ) × C F
where C—forest carbon storage, A—forest area, V—outgrowth storage, BCEFS—biomass conversion and expansion factors, R—root-shoot ratio, RDW—deadwood dry weight to cargo biomass dead-live ratio, CF—dry matter carbon content ratio, and A × V—forest stock, which can be predicted using the GFPM.

4. Results

4.1. Forest Carbon Leakage

This paper calculates forest carbon leakage based on the definition provided by Pan et al. [39] who articulated carbon leakage (CL) in Equation (6). In this equation, CL represents carbon leakage, p E A signifies the increase in forest carbon sinks resulting from the implementation of China’s forest carbon sink policy, and p E B indicates the reduction in forest carbon sinks in the rest of the world. If p E B > p E A , it implies that the decrease in forest carbon sinks in other countries completely neutralizes the increase in China’s forest carbon sinks. Conversely, if 0 < p E B < p E A , it suggests that the reduction in forest carbon sinks in other countries only partially compensates the increase in China’s forest carbon sinks.
C L = p E B p E A × 100 %

4.2. Alternative Scenarios

In this study, we use the carbon sink trading price as an exogenous variable to establish various scenarios for analyzing forest carbon leakage. We set four scenarios based on historical data. First is historical Carbon Emission Allowance (CEA) prices in the national carbon emissions trading market, averaging around USD 9.8 per ton in 2023 with a trading volume exceeding 350 million tons. Additionally, we draw on a 2015 Synapse report [40] that proposes a “low carbon price” scenario of USD 25 per ton and a “high carbon price” scenario of USD 54 per ton by 2030. Complementing these, Zhu et al. suggest that a price above USD 40 per ton could incentivize shorter forest rotation periods, thereby enhancing carbon sinks [41]. Similarly, Shen et al. set varied carbon sink prices at USD 5.5, USD 40, and USD 55 per ton, assessing their impact on forest management decisions in Zhejiang Province and Jiangxi Province [42].
Building on these insights, four distinct scenarios are formulated in our paper. Scenario 1, which is the baseline, assumes a carbon sink trading price of USD 0/ton for the baseline comparison. Scenario 2, which is the CEA Scenario, is based on the 2023 average CEA market price set at USD 9.8/ton. Scenarios 3 and 4, which are informed by Synapse’s projections, are the Low Forestry Carbon Sink Price Scenario (LFCSP) and High Forestry Carbon Sink Price Scenario (HFCSP) priced at USD 25/ton and USD 54/ton, respectively. Each scenario is designed to explore the dynamics of forest carbon leakage under different carbon pricing conditions.

4.3. Forest Carbon Sink Potential Prediction

By 2030, China’s forest stock under the baseline scenario will reach 22.36 billion cubic meters, and forest carbon stock will reach 9906.9 megatons, which is an increase of 2624.9 megatons of new carbon sinks compared with that of 2017, or an increase of 36.04%. The average annual increase in sinks within the forecast period from 2018 to 2030 is 201.9 million tons. Zhang et al. used a power function model to predict that China’s forest stock could reach 22.738 billion m3 by 2030 [43], which is more similar to the simulation results of the baseline scenario of this paper, further enhancing the credibility of the baseline scenario of this paper.
Under the forest carbon trading scenario, the forest carbon stocks in the carbon emission allowance (CEA) price scenario, the low carbon sink projected price scenario, and the high carbon sink projected price scenario amount to 9932.1, 9990.8, and 10,096 megatons in 2030, with an average annual increase in the remittances of 203.9, 208.3, and 216.5 megatons, respectively (see Table 1). According to data released by BP, China’s carbon emissions reached 9899 million tons in 2020, and the average annual carbon sequestration by China’s forests exceeds 2% of average annual carbon emissions.

4.4. Timber Market Prediction

China’s forest carbon trading has led to a reduction in China’s timber production and higher domestic log market prices, and the shortfall in China’s reduced domestic timber production will be made up of imported timber as a result of the market mechanism. As can be seen from Table 2, from 2018 to 2030, China’s roundwood production decreases by a total of 54.75 million m3 under the CEA scenario compared with the baseline scenario, with an average annual decrease of 4.21 million m3, and the average annual decrease is about 0.5% of China’s timber production in 2017. In the low carbon sink projected price scenario, China’s roundwood production decreases from the baseline scenario by a total of 185.22 million cubic meters, with an average annual decrease of 14.25 million cubic meters and an average annual decrease of about 16.9% of China’s roundwood production in 2017. Under the high carbon sink projected price scenario, China’s roundwood production decreases by a total of 423.49 million cubic meters compared with the baseline scenario, with an average annual decrease of 32.57 million cubic meters and an average annual decrease of about 38.78% of China’s timber production in 2017. Except for China, all other countries and regions in the world showed increases in roundwood production over the base case scenario, with the increase in production coming mainly from Oceania (see Table 2).
In this study, we observe that China’s roundwood imports escalate to compensate for the reduction in domestic roundwood production (see Table 2). As shown in Table 3, from 2018 to 2030, under the CEA scenario, China’s roundwood imports witness an overall increase of 19,323,000 m3 compared with the baseline scenario. This translates to an average annual increase of 1,486,300 m3, which is approximately 1.95% higher than China’s roundwood imports in 2017. In the LFCSP scenario, the increase totals 59,756,300 cubic meters, with an average annual increase of 4,596,600 cubic meters, which is around 6% of the 2017 figures. The HFCSP projects an even higher increase of a total of 158,837,700 cubic meters above the baseline, averaging 12,182,200 cubic meters annually, which is about 16% higher than 2017 imports.
As forest carbon sink prices rise, China’s roundwood imports grow both in volume and geographical scope. Under the CEA scenario, incremental imports primarily originate from Oceania and Africa. And this expansion widens to include countries like Japan, Canada, and some European nations (detailed in Table 3). We can see that Germany is presented in Table 3, which is likely due to the increase of exports just as a result of an increase in sanitary cuttings due to the death of coniferous forests as a result of an epidemic of pests. This trend is likely driven by the heightened opportunity cost of timber harvesting due to rising carbon trading prices, leading to a larger domestic timber supply gap. Consequently, China needs to broaden its roundwood import sources to offset this deficit. This growing import dependence under a forest carbon trading scenario could negatively impact China’s timber supply security.

4.5. Forest Carbon Leakage Effect

Because of China’s forest carbon trading policy, a combination of reduced domestic log production and higher domestic prices resulted in increased log imports. Meanwhile, intensified log production and exports from other countries could potentially cause a leakage effect on the global forest carbon sink. We can see this from Table 4, which details the extent of this global and regional carbon leakage under different scenarios as calculated using the formula in Equation (6). In the CEA scenario, the global leakage effect of China’s forest carbon sink trading is 81.5%, with the majority occurring in Oceania (56.9%). In the low carbon sink price scenario, the global leakage effect reduces to 64.0%, with Oceania’s contribution at 43.4%. The high carbon sink price scenario further lowers the global leakage effect to 57.8%, with Oceania’s share at 26.3%. These leakage rates, which are generally lower than those estimated by Hu et al. for China’s limited logging policy and major forestry projects, align more closely with existing studies [11].
One key factor contributing to the higher leakage rate is that of the lower average carbon sequestration capacity of China’s forests compared with other regions (as shown in Table 4). Enhancing the carbon sink capacity of China’s forests emerges as a crucial strategy to mitigate the global leakage effect. Interestingly, our study observes a decrease in the carbon leakage effect as the carbon sink trading price rises. This trend is attributed to the expanding geographical scope of China’s incremental log imports. As prices increase, imports from regions like Canada, Japan, and parts of Europe, which have lower average carbon sequestration capacities than those of Oceania, begin to rise (as detailed in Table 4). This diversification in import sources helps offset some of the carbon leakage originally emanating from Oceania, thereby reducing the overall leakage effect.

5. Discussion and Conclusions

Utilizing the Global Timber Market Model (GFPM) in conjunction with the IPCC Carbon Sink Model, this study conducts a simulation of the dynamic shifts in China’s forest resources and the global timber market from 2018 to 2030. This simulation is carried out under various forest carbon sink pricing scenarios to evaluate China’s forest carbon sink potential and the potential for global carbon leakage. The findings of this study are threefold. First, the practice of forest carbon sink trading is projected to significantly boost both the stock and carbon storage of China’s forests, aligning with the forestry development objectives of the nation’s dual carbon strategy under each scenario. Second, forest carbon trading in China is likely to result in a certain level of carbon leakage globally. The carbon leakage rates associated with the three pricing scenarios—USD 43/ton, USD 159/ton, and USD 343/ton—are 81.5%, 64.0%, and 57.8%, respectively, thereby indicating a trend where the leakage rate diminishes as the price of carbon sinks increases. Third, the regional disparities in the average forest carbon sequestration capacity coupled with the structure of China’s timber imports emerge as critical factors influencing the extent of carbon leakage.
China’s forests hold substantial potential for carbon sequestration, contributing significantly to the nation’s dual carbon goals. While forest carbon trading can augment the carbon stock of China’s forests, its direct impact on reducing the nation’s overall carbon emissions is somewhat limited. Nevertheless, this paper emphasizes the crucial role of forest carbon trading in attaining China’s dual carbon objectives. In the short term, integrating forest carbon sinks into the national carbon emissions trading market could somewhat ease the emission reduction targets for other industries. This integration can alleviate the immediate costs and technical challenges of industrial emission reductions while smoothing out the macroeconomic fluctuations caused by these reductions. In the long term, forest carbon sinks are essential for achieving carbon neutrality. Additionally, trading in forest carbon sinks aids in fulfilling ecological, economic, and social objectives.
However, carbon leakage poses a challenge to the global effectiveness of China’s forest carbon sink trading. To counteract this, China’s forest carbon sink policy development and execution should align with the broader concept of a “community of human destiny”, which involves proactively addressing potential carbon leakage. As China continues integrating forest carbon sinks into its national carbon emissions trading market, it should also tackle potential global carbon leakage and mitigate its negative impacts. Employing climate-smart forestry (CSF) is a key nature-based solution (NbS) that merges climate mitigation objectives with adaptation strategies, thereby enhancing the resilience and capacity of forest carbon sinks [44]. CSF is a vital approach for augmenting the effectiveness of forest carbon sinks, thereby aligning ecological stewardship with climate action [45].
This can firstly be achieved by expanding the area of planted forests and incorporating fast-growing, high-yield tree species, thereby reducing reliance on timber imports. This approach aligns with a NbS by harnessing natural processes and ecosystems for mitigating climate change impacts. Secondly, China should enhance the quality of its forests and raise forest management standards, adhering to CSF principles. This not only involves increasing the carbon sequestration capacity of forests but also ensuring their resilience to climate change and enhancing the overall health and productivity of forest ecosystems. Lastly, by embracing the “community of human destiny", China should engage in international cooperation focused on forest carbon sinks. This involves promoting the joint development of NbS and CSF strategies, which are crucial for effectively combating global climate change.

Author Contributions

Conceptualization, H.L.; methodology, Z.Z.; formal analysis, D.Q.; writing—original draft, D.Q. and Z.Z.; writing—review & editing, D.Q.; funding acquisition, H.L. All authors have read and agreed to the published version of the manuscript.

Funding

This research was funded by the Fundamental Research Funds for the Central Universities, grant number BLX202221 and Demonstration of Green City Construction in China, grant number 20230825.

Data Availability Statement

The data presented in this study are available on request from the corresponding author. The data are not publicly available due to limited space.

Conflicts of Interest

The authors declare no conflict of interest.

References

  1. Michetti, M.; Rosa, R. Afforestation and Timber Management Compliance Strategies in Climate Policy. A Computable General Equilibrium Analysis. Ecol. Econ. 2011, 77, 139–148. [Google Scholar] [CrossRef]
  2. Richards, K.R.; Stokes, C.A. Review of Forest Carbon Sequestration Cost Studies: A Dozen Years of Research. Clim. Chang. 2004, 63, 1–48. [Google Scholar] [CrossRef]
  3. Kindermann, G.; Obersteiner, M.; Sohngen, B.; Sathaye, J.; Andrasko, K.; Rametsteiner, E.; Schlamadinger, B.; Wunder, S.; Beach, R. Global cost estimates of reducing carbon emissions through avoided deforestation. Proc. Natl. Acad. Sci. USA 2008, 105, 10302–10307. [Google Scholar] [CrossRef]
  4. Tong, X.; Brandt, M.; Yue, Y.; Ciais, P.; Jepsen, M.R.; Penuelas, J.; Wigneron, J.-P.; Xiao, X.; Song, X.-P.; Horion, H.S.; et al. Forest management in southern China generates short term extensive carbon sequestration. Nat. Commun. 2020, 11, 129. [Google Scholar] [CrossRef] [PubMed]
  5. Cai, W.; He, N.; Li, M.; Xu, L.; Wang, L.; Zhu, J.; Zeng, N.; Yan, P.; Si, G.; Zhang, X.; et al. Carbon sequestration of Chinese forests from 2010 to 2060: Spatiotemporal dynamics and its regulatory strategies. Sci. Bull. 2022, 67, 836–843. [Google Scholar] [CrossRef] [PubMed]
  6. Murray, B.C.; Mccarl, B.A.; Lee, H.C. Estimating Leakage from Forest Carbon Sequestration Programs. Land Econ. 2003, 80, 109–124. [Google Scholar] [CrossRef]
  7. Nepal, P.; Ince, P.J.; Skog, K.E.; Chang, S.J. Forest carbon benefits, costs and leakage effects of carbon reserve scenarios in the United States. J. For. Econ. 2013, 19, 286–306. [Google Scholar] [CrossRef]
  8. Gan, J.; Mccarl, B.A. Measuring transnational leakage of forest conservation. Ecol. Econ. 2007, 64, 423–432. [Google Scholar] [CrossRef]
  9. Sohngen, B.; Brown, S. Measuring leakage from carbon projects in open economies: A stop timber harvesting project in Bolivia as a case study. Can. J. For. Res. 2004, 34, 829–839. [Google Scholar] [CrossRef]
  10. Sun, B.; Sohngen, B. Set-asides for carbon sequestration: Implications for permanence and leakage. Clim. Chang. 2009, 96, 409–419. [Google Scholar] [CrossRef]
  11. Hu, X.; Shi, G.; Hodges, D.G. International Market Leakage from China’s Forestry Policies. Forests 2014, 5, 2613–2625. [Google Scholar] [CrossRef]
  12. Sedjo, R.; Solomon, A. Climate and Forests. In Greenhouse Warming: Abatement and Adaptation; Crosson, P., Darmstadter, J., Easterling, W., Rosenberg, N., Eds.; Resources for the Future Press: Washington, DC, USA; Routkedge: London, UK, 1989; pp. 110–119. [Google Scholar]
  13. Sohngen, B.; Mendelsohn, R. An Optimal Control Model of Forest Carbon Sequestration. Am. J. Agric. Econ. 2003, 85, 448–457. [Google Scholar] [CrossRef]
  14. Xu, D.; Zhang, X.Q.; Shi, Z. Mitigation Potential for Carbon Sequestration through Forestry Activities in Southern and Eastern China. Mitig. Adapt. Strateg. Glob. Chang. 2001, 6, 213–232. [Google Scholar] [CrossRef]
  15. Liu, S.N.; Tao, Z.; Lin, Y.W.; Yang, S. The spatial distribution of forest carbon sinks and sources in China. Chin. Sci. Bull. 2012, 57, 1699–1707. [Google Scholar] [CrossRef]
  16. Xu, B.; Guo, Z.D.; Piao, S.L.; Fang, J.Y. Biomass carbon stocks in China’s forests between 2000 and 2050: A prediction based on forest biomass-age relationships. Sci. China-Life Sci. 2010, 8, 776–783. [Google Scholar] [CrossRef]
  17. Ke, S.F.; Zhang, Z.; Wang, Y.M. China’s forest carbon sinks and mitigation potential from carbon sequestration trading perspective. Ecol. Indic. 2023, 148, 110054. [Google Scholar] [CrossRef]
  18. Yu, Z.; Ciais, P.; Piao, S.; Houghton, R.A.; Lu, C.; Tian, H.; Agathokleous, E.; Kattel, G.R.; Sitch, S.; Goll, D.; et al. Forest expansion dominates China’s land carbon sink since 1980. Nat. Commun. 2022, 13, 5374. [Google Scholar] [CrossRef] [PubMed]
  19. Canadell, J.G.; Quere, C.L.; Raupach, M.R.; Field, C.B.; Buitenhuis, E.T.; Ciais, P.; Conway, T.J.; Gillett, N.P.; Houghton, R.A.; Marland, G.; et al. Contributions to accelerating atmospheric CO2 growth from economic activity, carbon intensity, and efficiency of natural sinks. Proc. Natl. Acad. Sci. USA 2007, 104, 18866–18870. [Google Scholar] [CrossRef] [PubMed]
  20. Jiang, X.; Huang, Z.H. Analysis of China’s forestry carbon sink potential under the New Economic Normal. Chin. Rural. Econ. 2016, 11, 57–67. (In Chinese) [Google Scholar]
  21. Gren, I.M.; Zeleke, A.A. Policy design for forest carbon sequestration: A review of the literature. Forest Policy Econ. 2016, 70, 128–136. [Google Scholar] [CrossRef]
  22. Liu, Z.; Deng, Z.; He, G.; Wang, H.L.; Zhang, X.; Lin, J.; Qi, Y.; Liang, X. Challenges and opportunities for carbon neutrality in China. Nat. Rev. Earth Environ. 2022, 3, 141–155. [Google Scholar] [CrossRef]
  23. Zhang, P.; Yin, G.Z.; Duan, M.S. Distortion effects of emissions trading system on intra-sector competition and carbon leakage: A case study of China. Energy Policy 2020, 137, 111126. [Google Scholar] [CrossRef]
  24. Henders, S.; Ostwald, M. Forest carbon leakage quantification methods and their suitability for assessing leakage in REDD. Forests 2012, 3, 33–58. [Google Scholar] [CrossRef]
  25. Sohngen, B.; Mendelsohn, R.; Sedjo, R. Forest Management, Conservation, and Global Timber Markets. Am. J. Agric. Econ. 1999, 81, 1–13. [Google Scholar] [CrossRef]
  26. Bosello, F.; Parrado, R.; Rosa, R. The Economic and Environmental Effects of an EU Ban on Illegal Logging Imports. Insights from a CGE Assessment. Environ. Dev. Econ. 2013, 18, 184–206. [Google Scholar] [CrossRef]
  27. Tian, X.; Sohngen, B.; Baker, J.; Ohrel, S.; Fawcett, A.A. Will U.S. Forests Continue to Be a Carbon Sink? Land Econ. 2018, 94, 97–113. [Google Scholar] [CrossRef] [PubMed]
  28. Buongiorno, J.; Zhu, S. Consequences of carbon offset payments for the global forest sector. J. For. Econ. 2013, 19, 384–401. [Google Scholar] [CrossRef]
  29. Ince, P.J.; Kramp, A.D.; Skog, K.E.; Yoo, D.I.; Sample, V.A. Modeling future U.S. forest sector market and trade impacts of expansion in wood energy consumption. J. For. Econ. 2011, 17, 142–156. [Google Scholar] [CrossRef]
  30. Johnston, C.M.T.; Radeloff, V.C. Global mitigation potential of carbon stored in harvested wood products. Proc. Natl. Acad. Sci. USA. 2019, 116, 14526–14531. [Google Scholar] [CrossRef] [PubMed]
  31. Nepal, P.; Prestemon, J.P.; Joyce, L.A.; Skog, K.E. Global forest products markets and forest sector carbon impacts of projected sea level rise. Glob. Environ. Chang. 2022, 77, 102611. [Google Scholar] [CrossRef]
  32. Buongiorno, J. Modeling some long-term implications of CO2 fertilization for global forests and forest industries. For. Ecosyst. 2015, 2, 1–13. [Google Scholar] [CrossRef]
  33. Nepal, P.; Ince, P.J.; Skog, K.E.; Chang, S.J. Projection of US forest sector carbon sequestration under US and global timber market and wood energy consumption scenarios, 2010–2060. Biomass Bioenerg. 2012, 45, 251–264. [Google Scholar] [CrossRef]
  34. Nepal, P.; Joseph, B.; Craig, M.T.J.; Jeffrey, P.; Guo, J.G. Global forest products trade model. In International Trade in Forest Products: Lumber Trade Disputes, Models and Examples; CABI: Wallingford, UK, 2021; pp. 110–141. [Google Scholar]
  35. Daigneault, A.; Baker, J.S.; Guo, J.; Lauri, P.; Favero, A.; Forsell, N.; Johnston, C.; Ohrel, S.B.; Sohngen, B.L. How the future of the global forest sink depends on timber demand, forest management, and carbon policies. Glob. Environ. Chang.-Hum. Policy Dimens. 2022, 76, 102582. [Google Scholar] [CrossRef]
  36. Buongiorno, J.; Zhu, S.S. Technical change in forest sector models: The global forest products model approach. Scand. J. Forest Res. 2015, 30, 30–48. [Google Scholar] [CrossRef]
  37. Lin, B.; Ge, J. Valued forest carbon sinks: How much emissions abatement costs could be reduced in China. J. Clean. Prod. 2019, 224, 455–464. [Google Scholar] [CrossRef]
  38. Buongiorno, J.; Zhu, S.; Zhang, D.; Turner, J.; Tomberlin, D. The Global Forest Products Model (GFPM): Structure, Estimation, Applications; Academic Press: Cambridge, MA, USA, 2003. [Google Scholar]
  39. Pan, W.; Kim, M.K.; Ning, Z.; Yang, H. Carbon leakage in energy/forest sectors and climate policy implications using meta-analysis. For. Policy Econ. 2020, 115, 102161. [Google Scholar] [CrossRef]
  40. Wilson, R.; Luckow, P.; Biewald, B.; Ackerman, F.; Hausman, E. 2015 Carbon Dioxide Price Forecast; Synapse Energy Economics, Inc.: Cambridge, UK, 2015. [Google Scholar]
  41. Zhu, Z.; Shen, Y.Q.; Wu, W.G. Household optimal forest management decision and carbon supply: Case from Zhejiang and Jiangxi Provinces. Acta Ecol. Sin. 2013, 33, 2577–2585. (In Chinese) [Google Scholar]
  42. Shen, Y.Q.; Zeng, C.; Wang, C.J.; Xu, X.Y.; Zeng, C. Impact of Carbon Sequestration Subsidy and Carbon Tax Policy on Forestry Economy——Based on CGE Model. J. Nat. Resour. 2015, 9, 560–568. (In Chinese) [Google Scholar]
  43. Zhang, Y.; Li, X.G.; Wen, Y.L. Forest carbon sequestration potential in China under background of carbon emission peak and carbon neutralization. J. Beijing For. Univ. 2022, 44, 38–47. [Google Scholar]
  44. Bowditch, E.; Santopuoli, G.; Binder, F.; del Río, M.; La Porta, N.; Kluvankova, T.; Lesinski, J.; Motta, R.; Pach, M.; Panzacchi, P.; et al. What is Climate-Smart Forestry? A definition from a multinational collaborative process focused on mountain regions of Europe. Ecosyst. Serv. 2020, 43, 101113. [Google Scholar] [CrossRef]
  45. Zhang, B.; Lan, K.; Harris, T.B.; Ashton, M.S.; Yao, Y. Climate-smart forestry through innovative wood products and commercial afforestation and reforestation on marginal land. Proc. Natl. Acad. Sci. USA 2023, 120, e2221840120. [Google Scholar] [CrossRef] [PubMed]
Figure 1. Economic analysis of carbon leakage.
Forests 15 00497 g001
Figure 2. Analytical framework of the impact of China’s forest carbon sequestration transaction on global forest carbon storage.
Forests 15 00497 g002
Table 1. Projection of forest stock and carbon storage in China under different scenarios. Unit: million m3; TgC (TgC = MtC = 1012gC).
VariablesScenarios202020252030Total
Increment
Mean Annual
Increment
Forest StockBasic177.4200.3223.659.24.5
CEA177.5200.6224.159.84.6
LFCSP177.6201.2225.461.14.7
HFCSP177.8202.2227.863.94.9
Carbon StorageBasic7863.58875.29906.92624.9201.9
CEA7866.48888.09932.12650.1203.9
LFCSP7871.48914.89990.82708.8208.3
HFCSP7880.38958.710,096.02813.9216.5
Data source: GFPM calculation results.
Table 2. Projection of global roundwood production change compared with the BAU scenario. Unit: million m3.
Region/CountryCEALFCSPHFCSP
202020252030202020252030202020252030
Africa0.200.170.150.380.740.680.471.231.67
North America0.190.130.290.280.641.271.423.286.17
South America0.070.210.210.590.961.340.813.123.67
Asia (excluding China)−3.86−4.07−3.91−10.65−15.36−16.14−21.79−33.98−41.54
China−3.92−4.34−4.99−10.71−15.78−18.31−22.44−35.97−45.78
Oceania1.421.391.222.055.134.662.167.889.40
Europe0.180.190.320.240.671.081.293.384.79
Global (excluding China)2.122.353.273.628.5611.206.7920.8629.95
Global−1.80−1.98−1.73−7.10−7.22−7.10−15.65−15.11−15.83
Data source: GFPM calculation results.
Table 3. Projection of roundwood exports from major countries in the world to China compared with the baseline scenario. Unit: million m3.
Region/CountryCEALFCSPHFCSP
202020252030202020252030202020252030
Equatorial Guinea4.334.684.948.6216.9517.668.6229.1434.05
Gambia0.991.010.961.283.683.521.2856.85
Nigeria10.677.885.821746.3936.931746.479.34
Zambia1.82.522.731.834.988.571.834.998.59
Canada00000.0125.51158.93433.68741.42
Japan00000.0116.7530.7683.95143.52
New Zealand120.81109.2894.76154.2417.58349.68154.2587.3686.66
Papua New Guinea18.0319.5720.8548.572.5977.848.5151.28150.11
Solomon Islands4.4513.3813.354.4530.5349.724.4630.5484.03
Belgium000.0109.0820.2519.6553.6191.66
Germany00000013.9538.0565.06
Roumania0000003.8210.4117.81
Sweden0000000.421.141.96
Swiss0000001.734.718.06
England0000000.380.330.24
Other countries0.0280.0680.0960.0340.0850.120.0420.1010.147
Global161.36159144.38236.22602.66607.59465.951481.542120.83
Data source: GFPM calculation results.
Table 4. Projection of global forest stock, carbon storage, and carbon leakage compared with the baseline scenario. Unit: million m3/million ton.
Region/CountryCEALFCSPHFCSP
Forest Stock VolumeForest
Carbon Storge
Leakage EffectForest Stock VolumeForest
Carbon Storge
Leakage EffectForest Stock VolumeForest
Carbon Storge
Leakage Effect
Africa−14.4−9.76.6%−37.6−25.35.4%−55−37.03.7%
North America−16.7−8.55.8%−33.7−17.23.7%−164.6−83.88.3%
South America−8.4−4.43.0%−56.2−29.26.3%−124−64.56.4%
China332.8147.5——1051.5466.0——2288.21014.0——
Asia (excluding China)−9.7−6.04.1%−14.2−8.81.9%−77.4−48.14.7%
Oceania−101.5−83.956.9%−244.5−202.143.4%−322.2−266.326.3%
Europe−15.2−7.85.3%−30.3−15.53.3%−167.9−86.08.5%
Global (excluding China)−165.9−120.381.5%−416.5−298.164.0%−911.1−585.757.8%
Notes: The figures shown in the table are the cumulative changes in stock volume and carbon sink storage over the period from 2018 to 2030. Data source: GFPM calculation results.
Disclaimer/Publisher’s Note: The statements, opinions and data contained in all publications are solely those of the individual author(s) and contributor(s) and not of MDPI and/or the editor(s). MDPI and/or the editor(s) disclaim responsibility for any injury to people or property resulting from any ideas, methods, instructions or products referred to in the content.

