Article

Impact of Intercropping on Nitrogen and Phosphorus Nutrient Loss in Camellia oleifera Forests on Entisol Soil

1
National Engineering Laboratory for Applied Technology in Forestry and Ecology in South China, Central South University of Forestry and Technology, Changsha 410004, China
2
College of Arts and Sciences, Lewis University, Romeoville, IL 60446, USA
3
College of Arts and Sciences, Governors State University, University Park, IL 60484, USA
4
Bangor College China, A Joint School between Bangor University and Central South University of Forestry and Technology, Changsha 410004, China
5
Lutou National Station for Scientific Observation and Research of Forest Ecosystem in Hunan Province, Yueyang 414000, China
*
Author to whom correspondence should be addressed.
These authors contributed equally to this work.
Forests 2024, 15(3), 461; https://doi.org/10.3390/f15030461
Submission received: 30 November 2023 / Revised: 23 February 2024 / Accepted: 28 February 2024 / Published: 1 March 2024
(This article belongs to the Section Forest Hydrology)

Abstract

:
Soil and water loss represent a significant environmental challenge in purple soil cropland in China. However, the quantity and mechanism of nutrient loss from purple soil remain unclear. To understand water and soil conservation and address nitrogen (N) and phosphorus (P) mitigation in Camellia oleifera forest stands on purple soil slope farmland, this study aimed to explore the resistance control effect of forest stands on N and P loss in such agricultural landscapes. In the study, a runoff plot experiment was conducted in purple soil slope farmland. The experiment included three distinct treatments: intercropping of oil tea (Camellia oleifera) and ryegrass (Lolium perenne L.), Camellia oleifera monoculture, and barren land served as the control treatment (CK). Water samples were collected and analyzed from the soil surface runoff and the middle soil layer at a depth of 20 cm (interflow) in three treatment plots under natural rainfall conditions in 2023. Various nutrient components, including total nitrogen (TN), dissolved nitrogen (DN), nitrate nitrogen (NO3-N), ammonium nitrogen (NH4+-N), particulate nitrogen (PN), total phosphorus (TP), dissolved phosphorus (DP), phosphate (PO4+-P), and particulate phosphorus (PP), were measured in the water samples. The results indicated that intercropping effectively mitigated the loss of various forms of N and P in both surface runoff and interflow within purple soil slope farmland. Compared to the CK, the ryegrass intercropping reduced TN and TP loss by 29.3%–37.3% and 25.7%–38.9%, respectively. The ryegrass intercropping led to a decrease in the average total loss of TN, DN, NO3N, and NH4+-N by 63.0, 24.3, 4.5, and 6.8 g/ha, corresponding to reductions of 33.3%, 47.6%, 58.3%, and 49.1%, respectively, compared to the CK. The average total loss of TP, DP, and PP decreased by 4.4, 1.8, and 1.4 g/hm2 in the intercropping, reflecting reductions of 32.3%, 31.3%, and 31.1%, respectively. The most significant proportion was observed in PN and PP within the runoff water solution, accounting for 53.3%–74.8% and 56.9%–61.0% of the TN and TP, respectively. These findings establish a foundation for purple soil and water conservation. The research provides valuable insights for land management and policymakers in developing erosion prevention and control programs for sloping cultivated land with Camellia oleifera forests in purple soils. Additionally, it offers guidance for soil and water conservation and prevention of surface source pollution in purple soil regions.

1. Introduction

Soil erosion is a worldwide environmental concern that can contribute to the degradation of soil structure and the loss of nutrients, ultimately resulting in diminished soil functionality and reduced crop yields [1]. Additionally, it significantly influences hydrological processes and the cycling of essential elements, such as nitrogen and phosphorus [2,3].
Purple soils, formed from the rapid physical weathering of nutrient-rich sedimentary rock, are classified as Inceptisols or Entisols in the United States Department of Agriculture (USDA) Taxonomy. These soils, derived from purple rocks, are particularly prevalent in the Sichuan basin of southwestern China and are considered the most important agricultural soils in the region [4]. Purple soil is characterized by a relatively short development period, rendering it susceptible to soil erosion [5]. This type of soil exhibits significant inheritance from the parent rock, which is attributed to its rapid physical soil formation process and weak chemical weathering. The swift physical soil formation primarily results from the homogeneous texture of the muddy parent rock, making it prone to crumbling under hot and humid conditions [6]. Slope farmland plays a crucial role, serving not only as a means of survival for local communities but also as a significant source of soil erosion [7]. With China’s per capita arable land dropping below 1.5 mu, a disparity between food supply and demand has emerged [6]. The annual imports of grain crops into the country match the cultivation of 800 million mu of arable land, and projections indicate a shortfall of around 31 million tons of grain by 2030. Purple soil slope farmland is an important cultivated land resource in China, covering about 0.2 million km2 and accounting for about 2% of the country’s territory [8]. Purple soil covers an area of 1.3 × 10⁴ km2 in Hunan Province, constituting 7.9% of the total land area. It is predominantly concentrated in the hilly regions of central Hunan and is largely utilized for slope farmland [9].
N and P are critical elements essential for the primary physiological and metabolic processes of plants, critical for plant growth, and significant contributors to agricultural non-point source pollution [10]. However, a significant portion of N in the soil is lost through various mechanisms such as surface runoff, interflow, ammonia volatilization, and leaching, giving rise to ecological and environmental issues [11,12,13]. Research suggests that the depletion of soil nutrients in sloping farmland can be attributed to the dissolution and subsequent loss of crucial nutrient elements such as N and P in the surface soil due to rainfall. Additionally, it causes the transport of sediment that is laden with adsorbed nutrients to enter water bodies [14]. The erosion of purple soil slope farmland not only diminishes land productivity but also poses risks to ecological and flood control security. Therefore, conducting research on soil nutrient loss in purple soil slope farmland holds significant practical importance.
Introduced as a soil conservation measure in sloping farmlands within hilly areas, the intercropping pattern holds the potential to significantly diminish soil erosion, regulate non-point source pollution, enhance system output, and notably reduce investment in sloped lands, it predominantly follows agroforestry and forest-grass intercropping systems [15]. The intercropping of gramineae and leguminous plants not only allows for the utilization of nitrogen fixation by leguminous plants but also facilitates the transfer of nitrogen to gramineae plants, enhancing their absorption and utilization of nitrogen [16,17]. Intercropping systems have the capacity to enhance P absorption, providing distinct advantages in P intercropping [18]. The interspecific relationships among crops in an intercropping system are complex, and intercropping dominance arises when crop species mutually benefit each other [19]. This, in turn, aligns with the objective of significantly enhancing crop yield and quality, which is ecologically significant in mitigating environmental degradation and the depletion of natural resources [20].
In the cultivation of oil tree forests (Camellia oleifera), it is common practice to intercrop C. oleifera trees with other crops within a few years after planting. This approach is employed to optimize and conserve land resources, particularly due to the slow expansion of the C. oleifera canopy [21]. Intercropping-crop systems have become a widely adopted traditional management strategy in C. oleifera-producing areas. However, a notable challenge arises as most crops in these intercropping systems are annual species. The harvest of autumn annual crops results in a significant reshuffling of soil nutrients, often leading to a degradation of soil fertility [22].
Ryegrass (Lolium perenne L.) is a perennial plant characterized by a stem height ranging from 30 to 90 cm and soft roots at the base node. It is primarily utilized as a perennial pasture in China. Ryegrass has been extensively employed in intercropping systems owing to its structural and biological characteristics, including a ligule measuring approximately 2 mm in length, and soft, slightly hairy leaves, occasionally accompanied by auricles [23].
Studies on soil erosion, non-point source pollution control through intercropping, and the impact of plant windbreaks on micro-topographic features have been reported both nationally and internationally over the past two decades [24]. This study demonstrated that the grass intercropping pattern can mitigate the loss of accumulated N and P, potentially reducing non-point source pollution from farmland soil to some extent [25,26]. Currently, various research efforts worldwide are underway to investigate crop utilization of N and P within the grass intercropping pattern, along with the factors influencing it [27,28,29]. However, there is limited research available regarding N and P loss on arable land with purple soil slopes. This study involved the creation of various intercropping configurations to enhance spatial coverage and minimize the impact of rainfall on the ground. By reducing runoff velocity, intercepting sediment, and mitigating soil erosion resulting from sparse crop areas, we conducted a runoff plot control experiment with oil tea (Camellia oleifera) forests on purple soil slopes. This study aimed to investigate the effects of intercropping, specifically ryegrass with C. oleifera, and compare it to C. oleifera monoculture in reducing soil N and P nutrient losses within the C. oleifera intercropping system. We hypothesize that the intercropping treatment will have a significant effect on reducing soil nutrient erosion compared to the Camellia oleifera and control plots. The objectives of this study were as follows: (1) To examine the mitigation of soil N and P nutrient erosion within an intercropping system. (2) To assess the variations in the reduction of soil N and P nutrients concerning water flow in the vertical soil profile; comparisons were made among the intercropping of ryegrass with C. oleifera and C. oleifera monoculture, and the barren land serves as the control treatment on purple soil slope farmland.

2. Materials and Methods

2.1. Study Site

This study was conducted in Changning City, Hunan Province, China, at coordinates 26°28′ N, 112°21′ E, in a subtropical monsoon climate with an average elevation of 170 m. The study area received an annual average of 3982.15 h of sunshine, with an average annual temperature ranging from 16 to 24 °C in 2022. It experienced a frost-free period lasting for 295 days each year, primarily from April to June, with an average annual precipitation ranging from 610 to 1318 mm over the three-year period from 2019 to 2022. In 2022, there was a rainfall deficit from August to October, characterized by highly uneven distribution, and daily maximum temperatures exceeding 34 °C from July to September. The predominant soil type in the area was purple sandstone-derived soil, classified as Entisol according to the United States Department of Agriculture’s classification system. The C. oleifera tree dominated the vegetation in the study site. At the outset of the experiment, we randomly selected 9 plots, which included 3 control plots (barren land) and 6 plots with 7-year-old oil tree pure forests. These plots were chosen based on similar conditions, such as a 15-degree slope and comparable oil tree growth conditions, in the purple soil area. Soil samples were taken from the 9 plots using an “X” shaped distribution, with 5 soil samples pooled into one in the 3 replicated control plots and 6 plots for oil tree forests. We conducted measurements of soil pH, organic carbon content (SOC), total nitrogen (TN), total phosphorus (TP), NO3-N, and NH4+-N. This process provided the baseline purple soil nitrogen (N) and phosphorus (P) nutrient values in May 2022 before site preparation. The soil parameters in the area provided valuable insight into our research context, with a pH range of 4.1–4.4, an organic carbon content (SOC) range of 4.73–5.76 g/kg, TN levels of 0.59–0.74 g/kg, TP at 0.05–0.06 g/kg, NO3-N at 37.46–39.88 mg/kg, and NH4+-N at 3.45–3.87 mg/kg (Table 1). To address and mitigate the effects of confounding variables from the control treatment, we have employed statistical methods to isolate the specific impact of the treatment being studied. This approach allows us to draw more accurate conclusions from the data, enhancing the validity and reliability of our findings (Table 1).

2.2. Cite Selection and Site Preparation

In December of 2022, we randomly selected three distinct types of treatment areas for the study site: intercropping of oil tea (Camellia oleifera) and ryegrass (Lolium perenne L.), Camellia oleifera monoculture, and barren land serving as the control treatment (CK). The barren land, a natural area without any human modification or plantation in the purple soil region, is characterized by its lack of significant vegetation and challenging growth conditions. It provides a standardized comparison for evaluating the efficacy of our experimental treatments. The 7-year-old Camellia oleifera monoculture was planted in March 2016 with a density of 1600 one-year-old seedlings per hectare (ha), spaced at 2 m by 3 m. The intercropping of oil tea (Camellia oleifera) and ryegrass (Lolium perenne L.) was initiated in December of 2022 with the aim of ensuring uniform land use conditions within each runoff plot (Figure 1). Our approach included broadcasting ryegrass seeds with a density of approximately 60 plants per square meter and a row spacing of 0.3 m. The preferred sowing method involved drilling sowing with a row spacing of 15 × 15 cm, with a seeding rate of about 1.5 kg per acre. After sowing, the seeds were covered with soil and thoroughly watered. Throughout the runoff monitoring experiment, the average height of ryegrass observed during each sampling plot was approximately 30 cm. The experiment was initiated in May 2022 to ensure uniform land use conditions within each runoff plot. Each runoff monitoring field consisted of a sample plot measuring 5 m in width and 15 m in length, with an area of 75 square meters (m2). The number of 7-year-old Camellia oleifera trees in each plot, exhibiting consistent growth, is maintained at approximately 15 individuals. The planting arrangement consists of three rows, each hosting 5 individuals of C. oleifera trees. The rows were spaced 0.3 m apart and distributed across a width of 5 m in each plot. The runoff community is constructed with corrosion-resistant plastic partitions. The runoff plot was inclined at 15 degrees, featuring confluence ditches positioned at the base. Surface runoff and interflow from each plot were channeled through PVC pipes and directed into runoff collection barrels (Figure 1). In preparation for our upcoming experiment, we implemented conventional agricultural practices, including leveling, weeding, plowing, and applying N and P fertilization treatments at a rate of 100 kg/ha, on the designated land before introducing ryegrass. Urea fertilizer was also uniformly applied to all experimental plots in December 2022 with a concentration of 100 kg/ha.

2.3. Experimental Design and Runoff Sampling

A split-plot experimental design was conducted in the study area. The main factor involved three types of treatments: intercropping ryegrass with C. oleifera, C. oleifera solo cropping, and barren land that served as the control treatment (CK). Each treatment was replicated three times, resulting in a total of 9 plots referring to the runoff monitoring field for this study. The subfactor was defined in layers based on the position of water pipes in the soil profile setup for each treatment plot, consisting of a 0 cm layer (representing surface runoff, water flowing over the soil surface) and a 20 cm layer from the soil surface (representing interflow layer, water flowing within the soil layers). This setup resulted in a total of 18 water pipes (3 × 3 × 2) across the entire experimental area.
The water sampling experiment took place from January 2023 to July 2023, covering a total of 9 rainfall events. Among these events, two occurred in May, two in June, and a single event took place in each of the other months. Following each instance of rainfall, the volume of water (measured in mm) collected in the surface runoff barrels for each plot was measured, and the average value was recorded as the runoff value for that plot. Three water samples were collected from each water pipe during each rainfall event for analysis of N and P concentrations. The water samples from the runoff collection barrels were thoroughly mixed, and 500 mL of the sample was promptly transferred to labeled polyethylene bottles. These samples were sent to the laboratory, stored at 4 °C, and analyzed within 48 h. We represented each individual rainfall event as an independent variable in the experiment. The events corresponded to the monthly rainfall from January to April and in July. Two rainfall events occurred in both May and June in both the surface and interflow layers of our experiment. In addition, we assessed the significant effects of the rainfall events and represented each individual rainfall event as another independent variable on the X-axis, along with the corresponding rainfall amount in the experiment, as depicted in the figures below. The water sample analysis included various forms of nitrogen, (TN, DN, NO3-N, NH4+-N, and PN), and various forms of P were analyzed, including (TP, DP, PO4+-P, and PP).

2.4. Water Sample Analysis

The water samples underwent analysis to determine TN and TP in the stock solution using molybdenum blue colorimetry with potassium persulfate oxidation [30]. The water samples were filtered through a 0.45 μm filter membrane, and the contents of DN, NO3-N, NH4+-N, DP, and PO4+-P were assessed using an Auto Analyzer-3 flow analyzer [31]. The PN was calculated by determining the difference between TN and DN, while the PP was calculated by finding the difference between TP and DP. The meteorological data collected during the test period were obtained from the meteorological observation station located in the local monitoring field.

2.5. Calculations

The formula for calculating the loss flux of a specific form of nitrogen (N) and (P) in a single rainfall-runoff event is expressed as follows:
Qi = Ci × qi/S × 10
In this formula: Qi represents the N and P loss flux (measured in grams per hectare, g/hm2) in the surface runoff or interflow of the rainfall event. Ci is the concentration of a certain form of N and P in surface runoff or interflow (measured in milligrams per liter, mg/L). qi is the volume of surface runoff or interflow for this specific event (measured in liters, L). S is the area of the runoff plot (measured in square meters, m2). The constant “10” is used for unit conversion as necessary.

2.6. Statistical Analysis

Statistical analyses were performed to assess the effects of treatments, including intercropping ryegrass with C. oleifera, C. oleifera pure forest, and the control, on both surface runoff and interflow at the soil profile depth. Additionally, the significance of the rainfall events was examined. Three-way analysis of variance (ANOVA) was employed for this purpose (Table 1). The significance of the differences between the treatments was assessed using the Duncan method with a significance level set at p < 0.05. To meet the normality and homoscedasticity assumptions of ANOVA, the original data underwent a log transformation. The statistical analyses were carried out utilizing the SPSS software (version 22.0) and the SAS statistical package [32].

3. Results

A three-way analysis of variance (ANOVA) revealed significant effects on the concentrations of N (TN, DN, NO3-N, NH4+-N, and PN) and P (TP, DP, PO4+-P, and PP) due to varying treatment modes (intercropping, solo oil tree cropping, and control treatments), runoff modes (water surface runoff and interflow), rainfall events, and their interactions (p < 0.05, Table 2). Significant differences were observed among the three treatments, between surface runoff and interflow, and among the rainfall events except for DP and PO4+-P (p < 0.05, Table 2). The interaction of treatments and runoff depths (T × R) and the interaction of treatments and event (T × E) significantly influenced all N concentrations (p < 0.05, Table 2) but not the P concentrations (p > 0.05), except for DP and PP (p < 0.05). The NO3-N interactions between treatments, runoff depths, and rainfall events (T × R × E) significantly influenced all N concentrations (p < 0.05) but not all P concentrations (p < 0.05, Table 2).

3.1. Effects of Treatments on N Concentration in Surface Runoff and Interflow in Purple Soil under Three Treatments

Figure 2 illustrates the treatment effects on N concentration in soil surface runoff and interflow in the purple soil corresponding to each of the rainfall events. The treatment effects exhibited significant changes in the concentration of various N forms in surface runoff (p < 0.05, Figure 2). It indicated that different treatments exhibited similar trends in the concentrations of various N forms in surface runoff at various time periods. Significantly, the order of the overall average N concentration in surface runoff was primarily as follows: control > C. oleifera monoculture > ryegrass intercropping (Figure 2(a1–e1)). Overall, the ryegrass intercropping treatment effectively reduced the concentration of various N forms in the water of soil interflow. From January to July 2023, the intercropped ryegrass treatment yielded the following overall average concentrations of N compounds in surface runoff: TN (2.46 mg/L), DN (1.12 mg/L), NO3-N (0.14 mg/L), NH4+-N (0.25 mg/L), and PN (1.34 mg/L). Comparatively, this treatment reduced these concentrations by 40.5%, 51.6%, 58.9%, 31.8%, and 31.9%, respectively, when compared to the control treatment. In comparison to the C oleifera pure forest, the intercropped ryegrass treatment reductions were 26.2%, 37.3%, 52.4%, 43.7%, and 22.3%, respectively (Figure 2(a1–e1)).
The N concentration in soil interflow followed the same order: control > C. oleifera monoculture > ryegrass intercropping (Figure 2(a2–e2)). The overall average concentrations of TN, DN, NO3-N, NH4+-N, and PN in the soil treated with intercropped ryegrass were 3.44, 0.86, 0.42, 0.53, and 2.58 mg/L, respectively. In comparison with the control, the reductions were 30.8%, 61.0%, 18.3%, 24.9%, and 6.7%, respectively, and compared with the C. oleifera single cropping, the reductions were 11.9%, 33.1%, 45.0%, 22.4%, and 69.7%, respectively (Figure 2(a2–d2)). When comparing soil surface runoff and interflow runoff from Figure 2(a1,a2,b1,b2,c1,c2,d1,d2,e1,e2), among the three treatments, the TN concentration in interflow runoff was consistently higher than that in surface runoff (Figure 2(a1,a2)). Under the control treatment, the DN concentration in the interflow runoff exceeded that in the surface runoff. Conversely, in the C. oleifera monoculture and ryegrass intercropping treatments, the DN concentration in the interflow runoff was lower than that in the surface runoff in May (Figure 2(b1,b2)). For NO3-N, the concentration in the soil interflow of all three treatments was consistently higher than in the surface runoff (Figure 2(c1,c2)). Initially, the NH4+-N concentration in the interflow runoff was higher than in the surface runoff in all treatments. However, the NH4+-N concentration reached its lowest point in C. oleifera monoculture and ryegrass intercropping treatments, falling below that in the surface runoff in April. Afterward, it rose higher than the surface runoff (Figure 2(d1,d2)). As for PN concentration, it was greater in the control treatment than in the surface runoff. In C. oleifera monoculture and ryegrass intercropping treatments, it initially exceeded the surface runoff levels but exhibited fluctuations over time (Figure 2(e1,e2)).
The overall pattern of N concentrations showed a decrease in trends from spring to summer of 2023 in both runoff layers (Figure 2a–e). Among the observation of rainfall events, the highest concentration of DN was found in both C. oleifera monoculture and ryegrass intercropping treatments in the interflow corresponding to two rainfall events (events 7 and 8) in June (Figure 2(b2)). A rapid decrease, with the lowest NH4+-N concentration, was observed in event 4 (April) in both surface and interflow runoff (Figure 2(d1,d2)).

3.2. Effects of Treatments on P Concentration in Surface Runoff and Interflow in Purple Soil under Three Treatments

Figure 3 demonstrated the treatment effects on P concentration in soil surface runoff and interflow in purple soil under three treatments (Figure 3). The treatment effects exhibited significant changes in the concentration of various P forms in surface runoff (p < 0.05, Figure 3). The overall pattern of concentration of P in surface runoff fluctuated in accordance with the ryegrass growth pattern, generally showing a downward trend. The order of P concentration in surface runoff was significant as follows: control > C. oleifera monoculture > ryegrass intercropping (p < 0.05, Figure 3). The ryegrass intercropping treatment effectively lowered the overall average concentration of each P form in surface runoff (Figure 3). The differences between intercropping and monocropping were reduced from May on. During the observation period, the overall average concentrations of TP, DP, PO4+-P, and PP in surface runoff treated with ryegrass were 0.19, 0.08, 0.06, and 0.11 mg/L, respectively (Figure 3). When compared to the control, these reductions were 36.5%, 44.4%, 38.6%, and 28.9%, respectively. In comparison to Camellia oleifera monoculture, reductions were 18.0%, 16.0%, 19.0%, and 19.4%, respectively (Figure 3).
The concentration of P in the interflow fluctuated with the growth pattern of ryegrass, showing an overall downward trend. Notably, the order of P concentration loss in soil flow was primarily as follows: control > C. oleifera monoculture > ryegrass intercropping. The ryegrass intercropping treatment effectively reduced the weighted average concentration of each P form in interflow. During the observation period, the average concentrations of TP, DP, PO4+-P, and PP in ryegrass-treated soil were 0.21, 0.08, 0.06, and 0.13 mg/L, respectively, which were 43.0%, 39.5%, 43.4%, and 45.1% lower than the control and 14.5%, 15.6%, 12.0%, and 13.8% lower than the C. oleifera single cropping (Figure 3(a1–d1)).
The TP concentration of the soil interflow in three treatments was slightly higher than in the surface runoff (Figure 3(a1,a2)). Significantly, the difference in TP concentration between the interflow and surface runoff was more significant in the control treatment compared to C. oleifera monoculture and ryegrass intercropping treatments (Figure 3(b1,b2)). Conversely, the DP concentration in the soil interflow of the three treatments was slightly lower than in the surface runoff. However, there were unexpected fluctuations in DP concentration in event 3 (in March) (Figure 3(b1,b2)). These deviations occurred in the surface runoff under Camellia oleifera monoculture and in the soil interflow under the control treatment, contrary to the general trend (Figure 3(b1,b2)).
Comparing the soil surface runoff and interflow runoff in Figure 3(a1,a2,b1,b2,c1,c2,d1,d2) among the three treatments, the concentrations of PO4+-P and PP in the soil interflow in the three treatments were slightly higher than those in the surface runoff (Figure 3(c1,c2)). There was a notable turning point in the concentration of PP in the surface runoff across the three treatments. Subsequently, it exhibited a tendency to stabilize in events 5 and 6 (in May) (Figure 3(d1,d2)).

3.3. Effects of Intercropping on Surface Runoff and Interflow N Loss in C. oleifera Forests

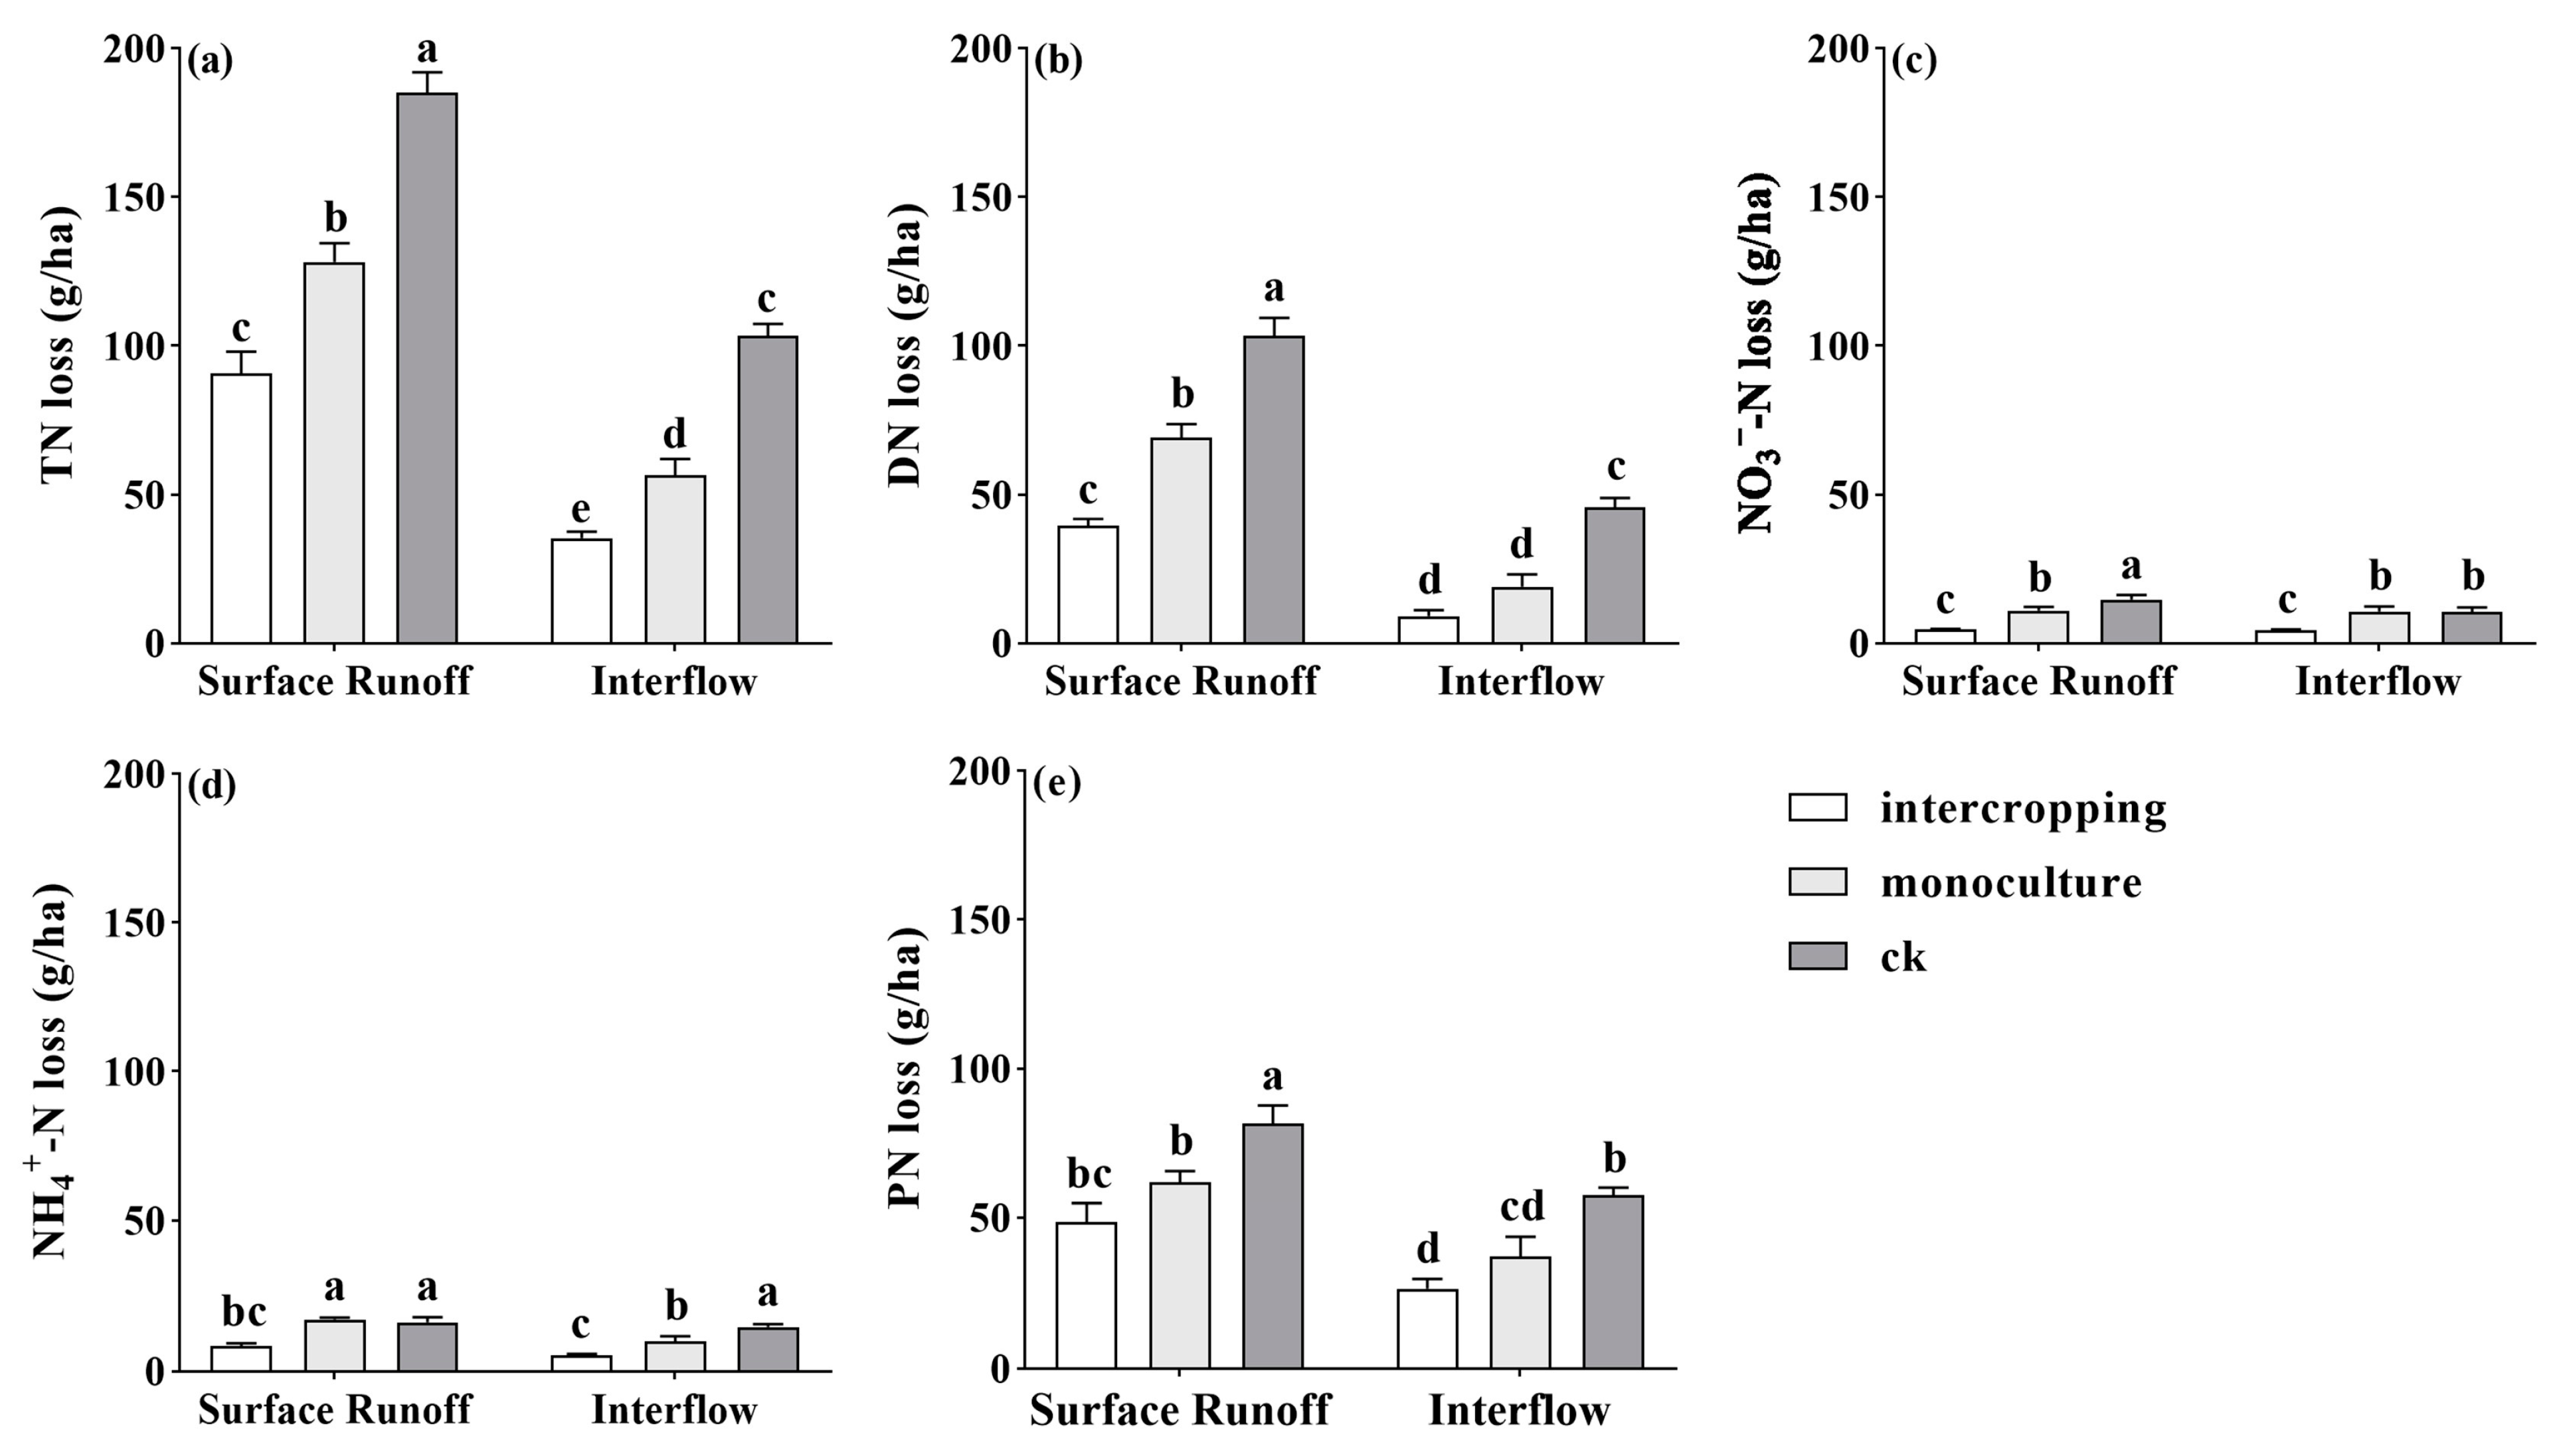
The treatment effects demonstrated significant changes in various forms of N loss in the surface runoff and interflow (p < 0.05, Figure 4). We observed that the overall pattern of nitrogen (N) loss in surface runoff varies across different treatments, primarily following the order of control > C. oleifera monoculture > ryegrass intercropping, as depicted in Figure 4. Notably, the effect of intercropping on reducing the loss of various forms of nitrogen in surface runoff significantly surpasses that of C. oleifera monoculture compared to the control. The overall cumulative losses of TN, DN, NO3-N, NH4+-N, and PN in the surface runoff of the ryegrass intercropping treatment were 90.73, 39.50, 4.74, 8.43, and 51.23 g/ha, respectively. These figures represent a reduction of 51.0%, 61.8%, 67.7%, 48.0%, and 37.2%, respectively, compared to the control. Furthermore, these losses were 29.3%, 43.0%, 57.0%, 50.7%, and 13.2% lower than those of C. oleifera monoculture (Figure 4).
The loss of various forms of N in soil interflow under different treatments followed the same order of control > C. oleifera monoculture > ryegrass intercropping. The overall cumulative losses of TN, DN, NO3-N, NH4+-N, and PN in the intercropped ryegrass amounted to 35.35, 9.11, 4.34, 5.25, and 26.24 g/ha, respectively. These losses marked a reduction of 65.8%, 80.1%, 59.0%, 64.4%, and 54.4%, respectively, compared to the control. Additionally, the reductions of N in the intercropping plots were 37.3%, 52.3%, 59.7%, 47.5%, and 29.7%, respectively, when compared to C. oleifera monoculture plots (Figure 4). The losses of TN, DN, and PN in the surface runoff of the three treatments were significantly higher than those in the soil interflow (Figure 4a,b,e). However, the differences in the losses of NO3-N and NH4+-N between surface runoff and interflow were not significant (Figure 4c,d).

3.4. Effects of Treatments on Soil Surface Runoff and Interflow in Relation to P Loss in Purple Soil under Three Treatments

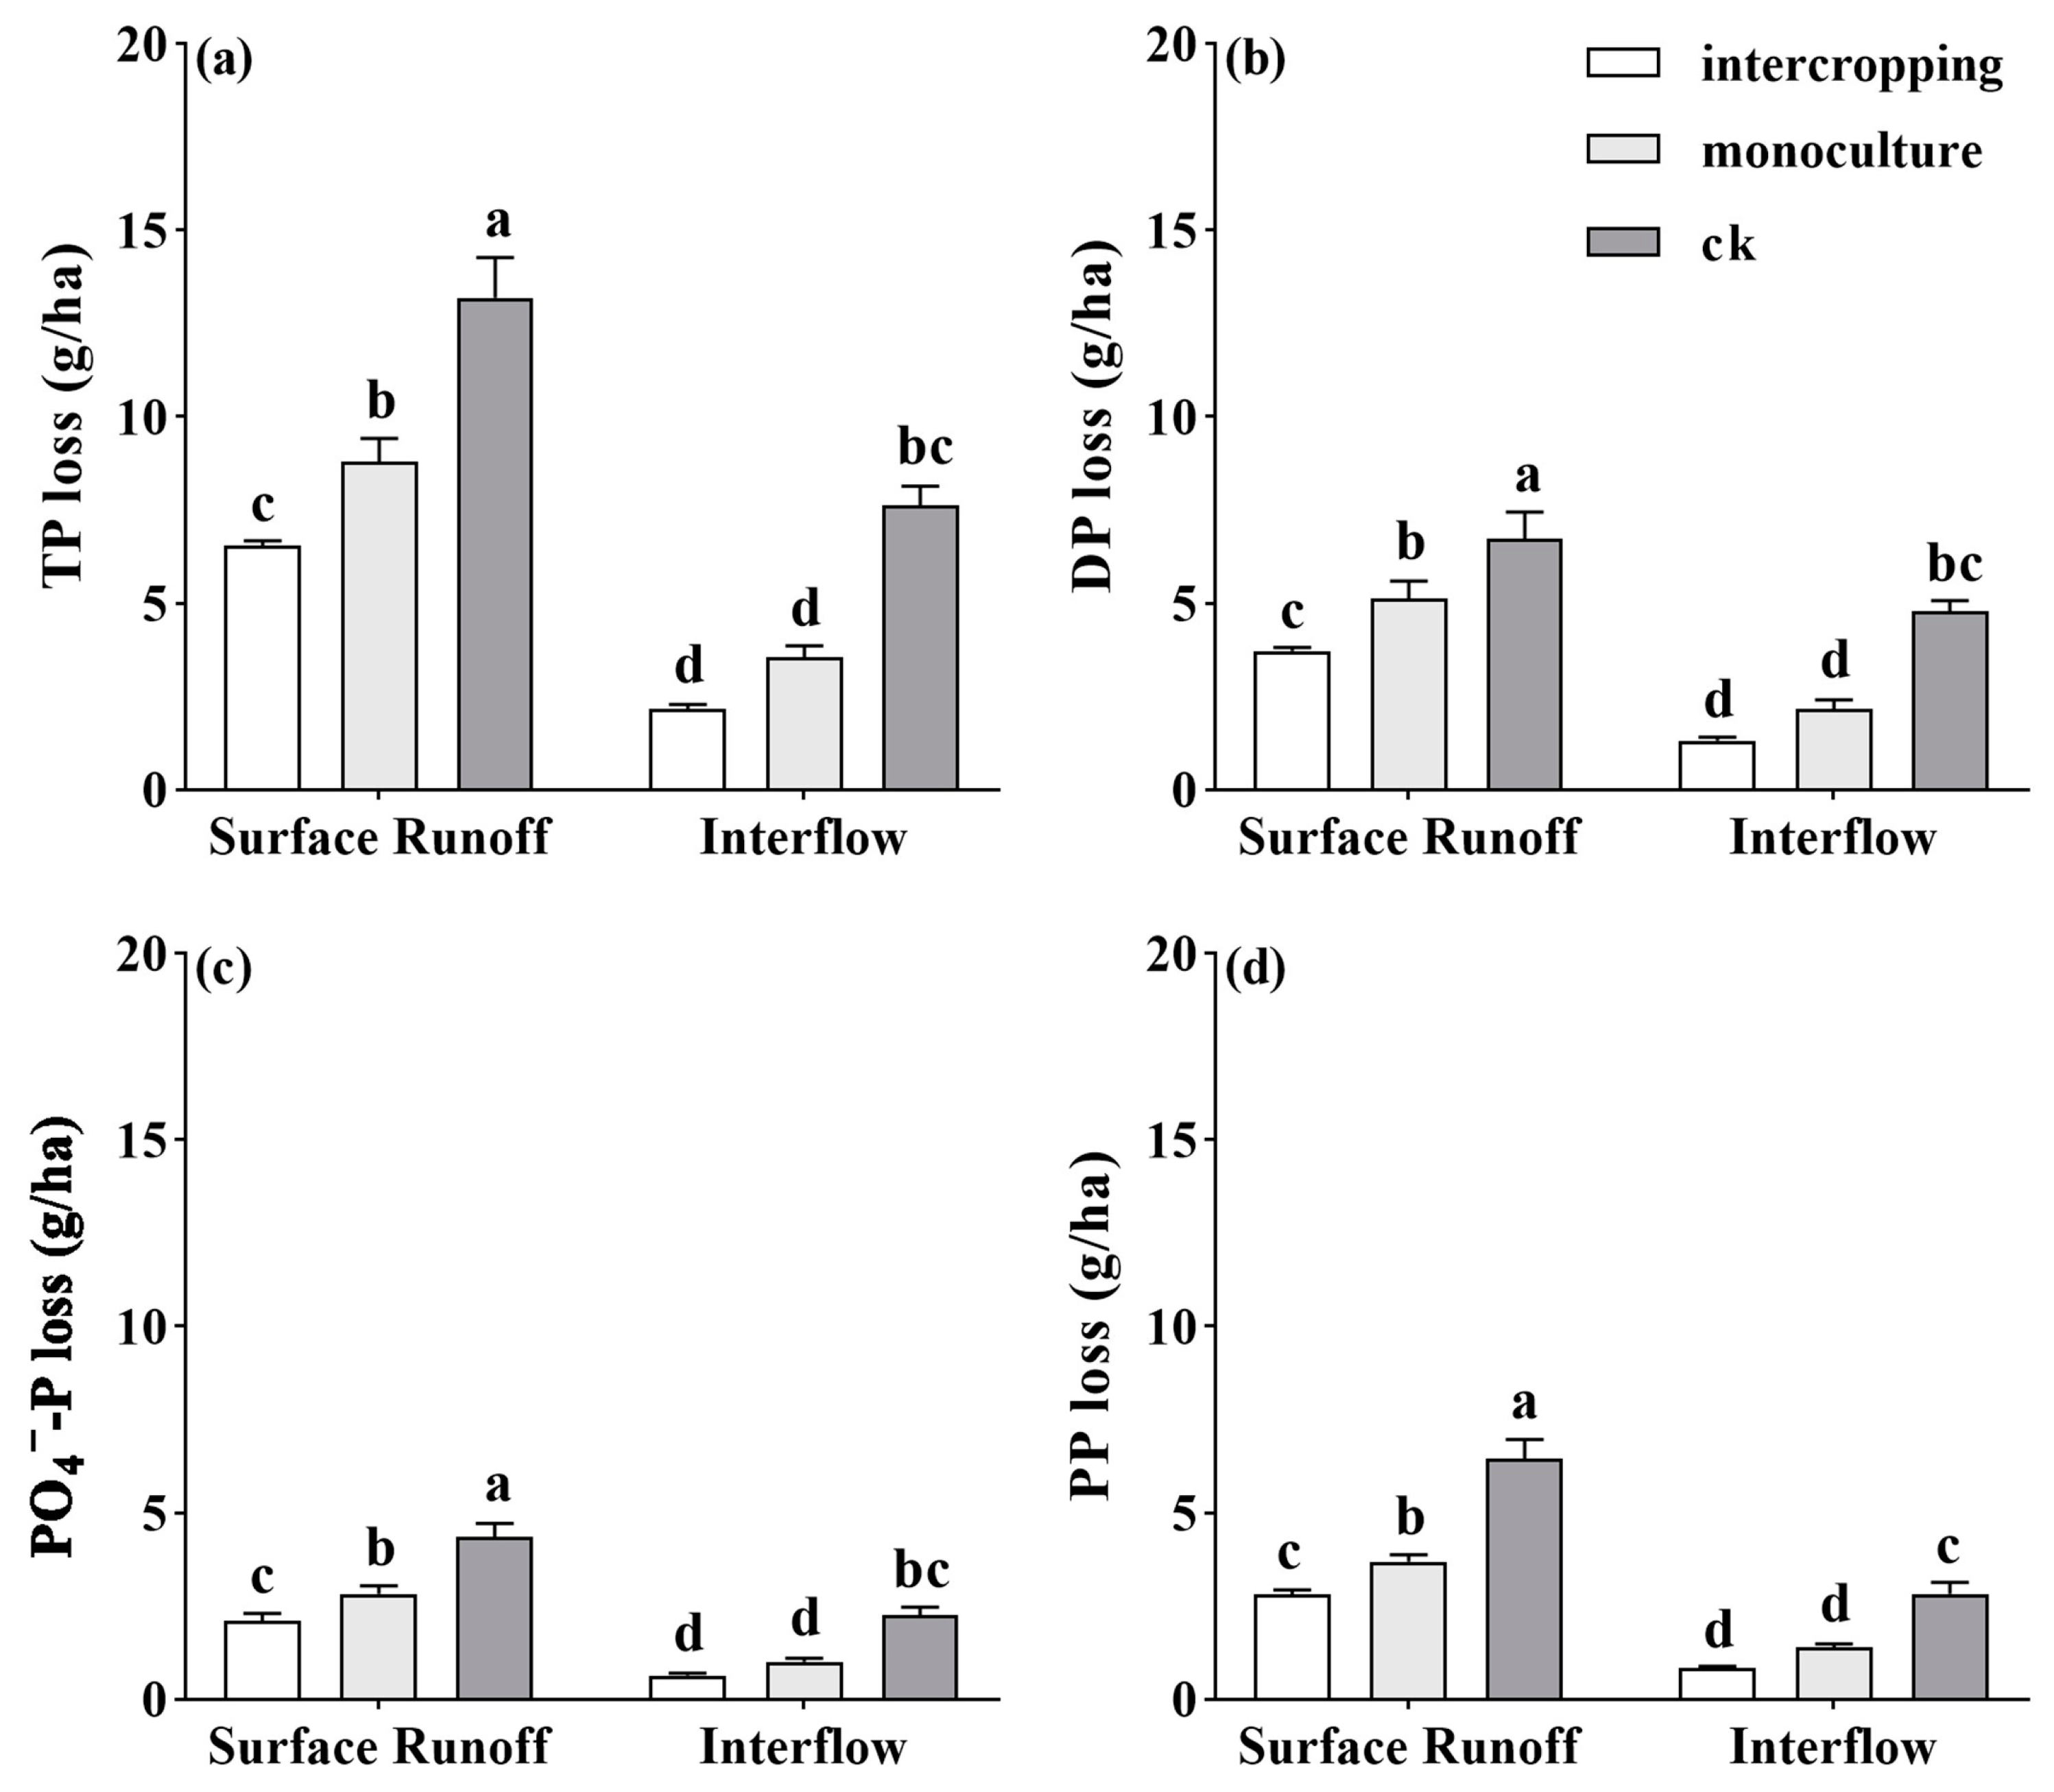
The treatment effects on soil water erosion, i.e., P loss in both soil surface runoff and interflow, are illustrated in Figure 5. It showed significant changes in various forms of P loss in both surface runoff and interflow (p < 0.05, Figure 5). The intercropping treatment had a significant reduction effect on the loss of various forms of P compared to both C. oleifera monoculture and the control plots in the purple soil (Figure 5). We observed that the loss of P in both surface runoff and interflow primarily follows the order of control > C. oleifera monoculture > ryegrass intercropping among the treatments. The loss of various forms of P in surface runoff across the three treatments exceeded that in interflow runoff. Regardless of the treatments, the proportion of PO4+-P loss in the surface runoff was significantly higher in the surface runoff than in the interflow (Figure 5a–d).
Over the observation period, the cumulative losses of TP, DP, PO4+-P, and PP in the surface runoff associated with ryegrass intercropping were 6.54, 2.82, 2.10, and 3.72 g/ha, respectively. These reductions accounted for 50.5%, 56.4%, 51.8%, and 44.8% lower than the control and 25.7%, 23.5%, 25.8%, and 27.2% lower than C. oleifera monoculture, respectively (Figure 5).
The overall average of the cumulative losses of TP, DP, PO4+-P, and PP in the interflow associated with ryegrass intercropping were 2.17, 0.85, 0.64, and 1.32 g/ha, respectively. These losses were 71.6%, 70.1%, 71.6%, and 72.4% lower than the control and 38.9%, 39.0%, 36.4%, and 38.9% lower than C. oleifera monoculture, respectively (Figure 5).
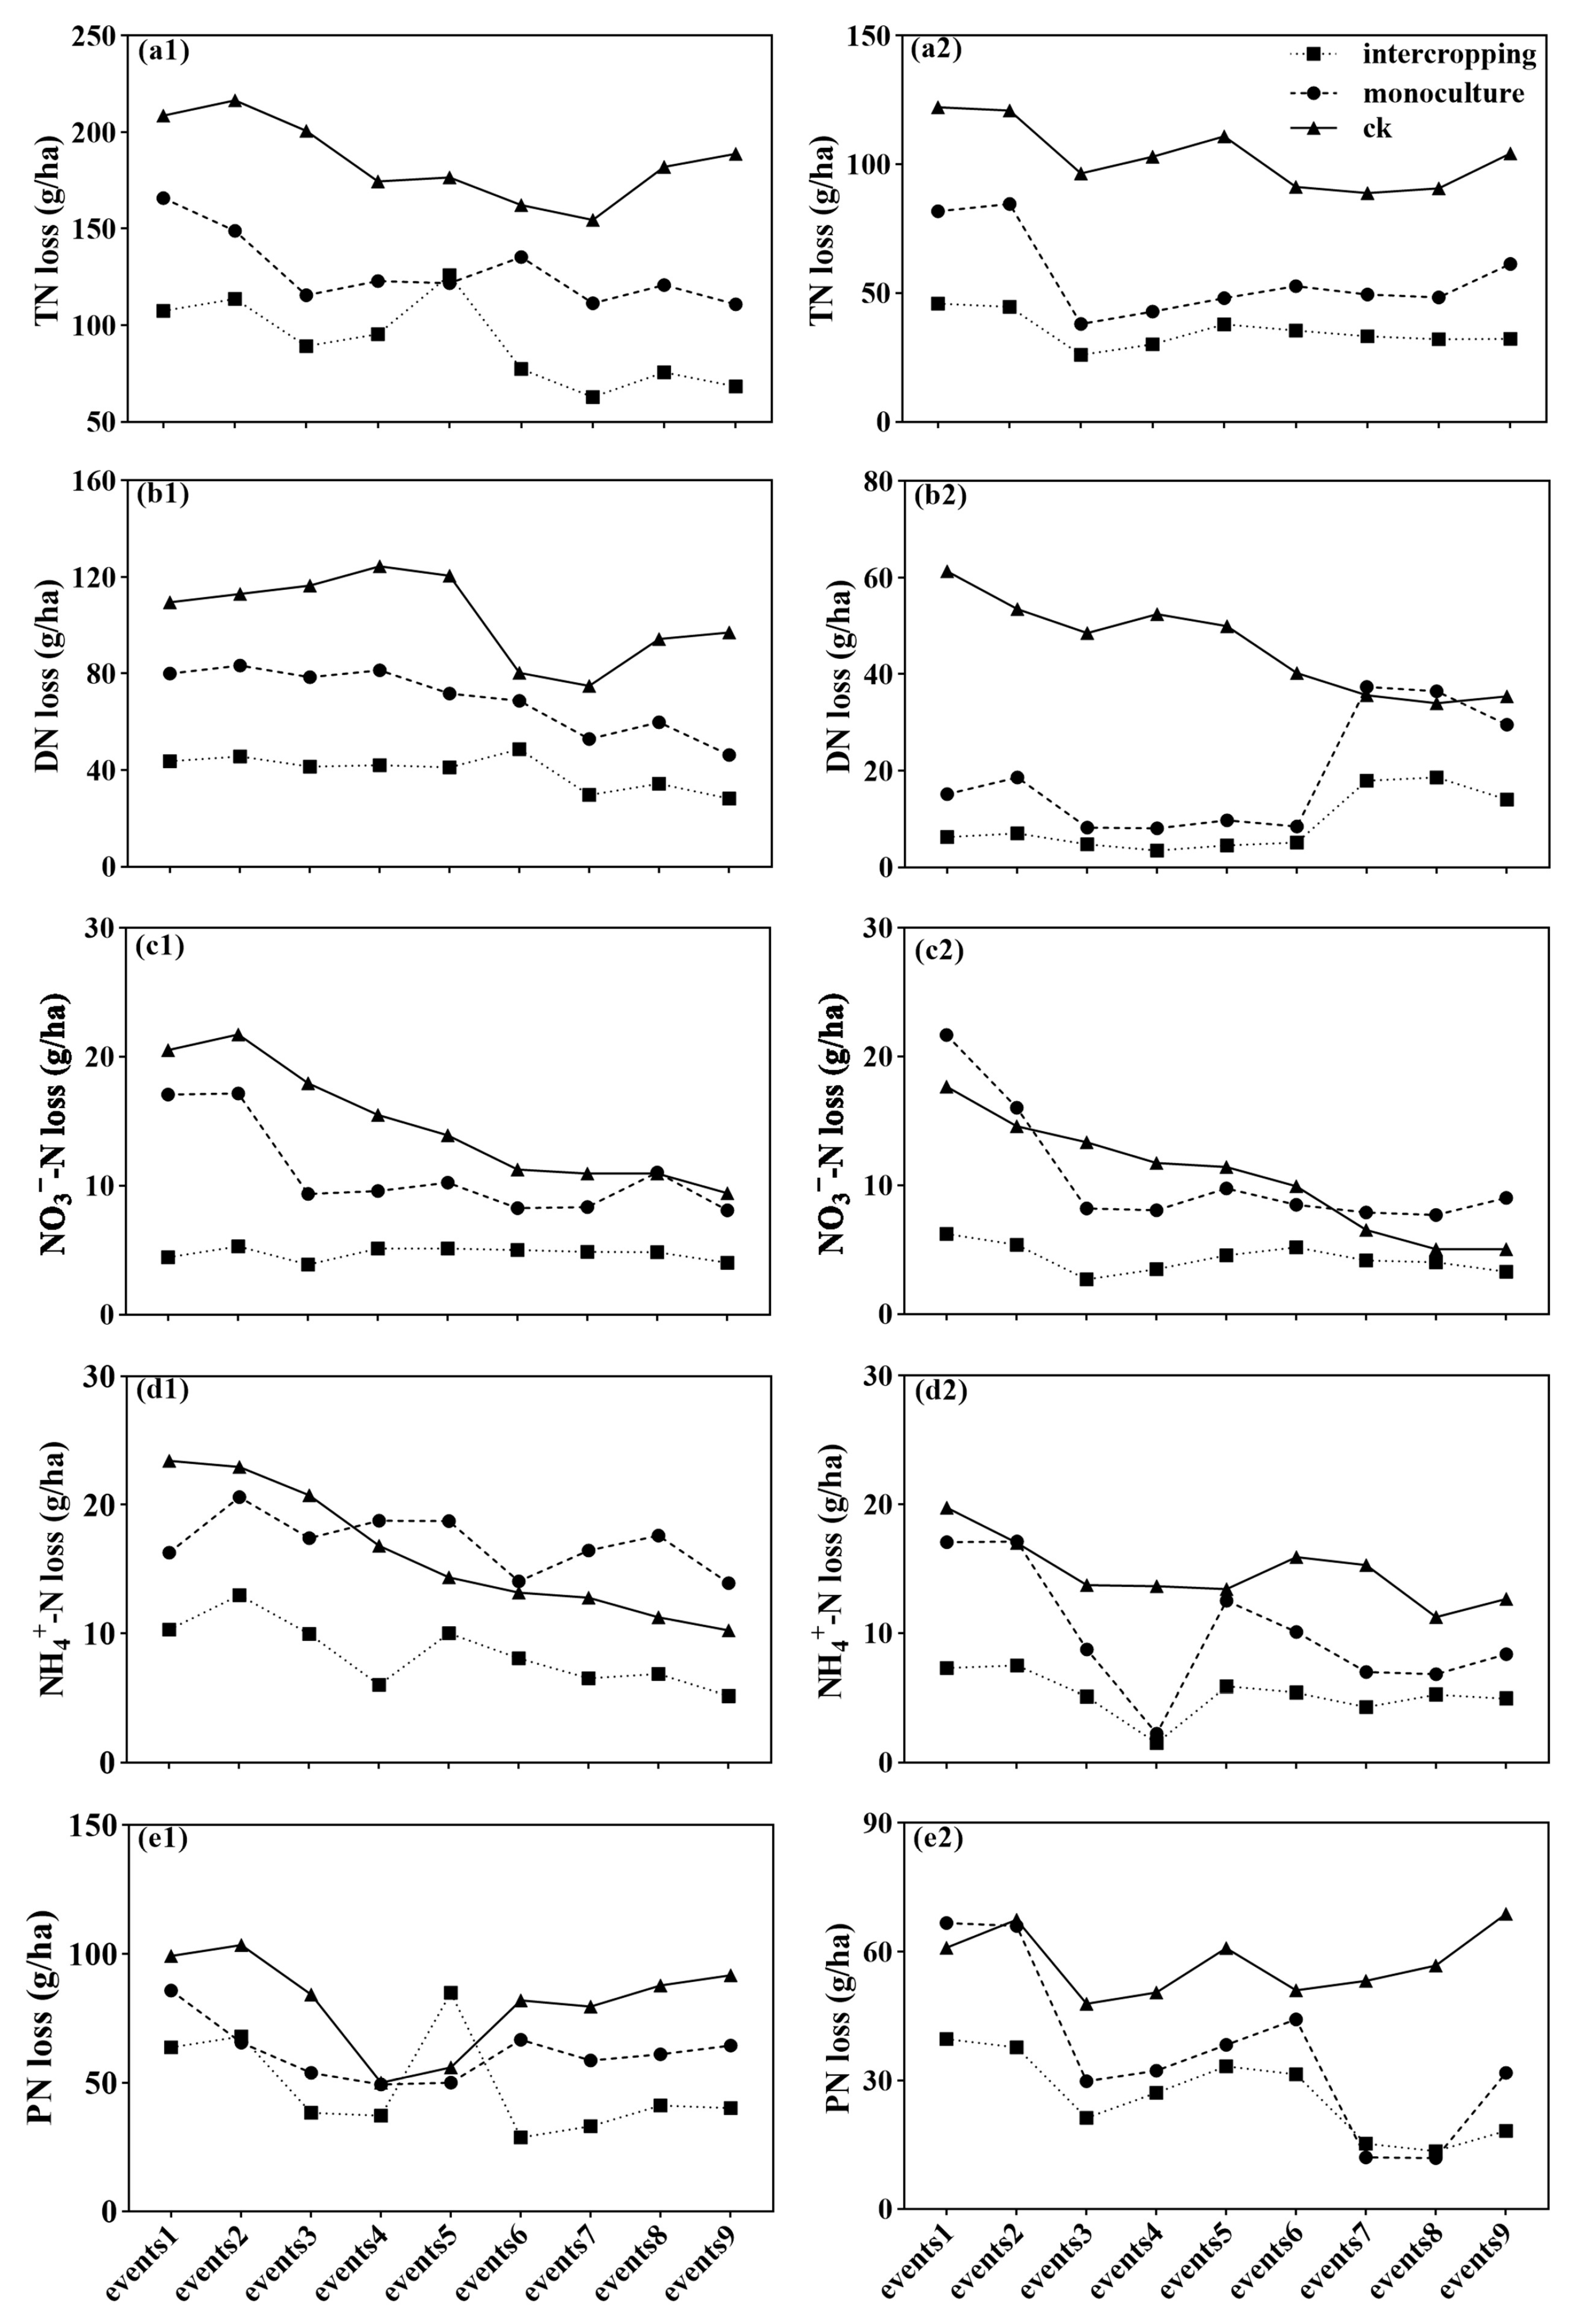
The seasonal pattern of N and P loss in response to the three treatments in surface runoff and interflow is presented in Figure 6 and Figure 7. It shows a similar seasonal pattern with a responsible growth pattern of ryegrass. A slightly increased pattern of N and P loss has been observed in July (Figure 6 and Figure 7).

4. Discussion

4.1. The effects of Intercropping on N Loss in C. oleifera Forests on Purple Soil Slope Cultivated Land

The study results suggested that intercropping ryegrass with C. oleifera had the most significant impact on reducing N and P concentrations in both surface water runoff and interflow within the C. oleifera forests on purple soil. The C. oleifera monoculture also had a significant effect on reducing soil water N and P concentrations compared with the control in our study (Figure 2 and Figure 3). Throughout the observation period, the concentrations of N in surface runoff and interflow were significantly lower in the ryegrass treatment compared to both the C. oleifera monoculture and the control treatment plots (Figure 2 and Figure 3). This phenomenon was supported by our hypothesis that ryegrass treatment significantly reduced N loss in both surface runoff and interflow in the C. oleifera forests, thereby decreasing overall N runoff. The ryegrass intercropping within the C. oleifera significantly reduced water runoff at the forest floor, and then effectively reduced soil interflow. The seasonal pattern of N concentration was followed by the growth pattern of ryegrass. The actual situation in the experimental site was that March and April of 2023 were the lush periods. Ryegrass is sensitive to both cold and heat and does not tolerate shade well. Under suitable conditions, it can persist for more than two years. However, in our research, the ryegrass may experience withering in May, possibly due to the relatively poor quality of the purple soil. The results were supported by other studies, which found that the intercropping of ryegrass and leguminous crops can increase the content of organic matter in the soil, improve the soil structure, and enhance the water and fertilizer retention capacity of the soil. Intercropping of ryegrass with certain crops can promote the growth and reproduction of beneficial microorganisms in the soil, increase the biological activity of the soil, and facilitate the circulation and utilization of soil nutrients [33]. The deep roots of ryegrass contribute to soil loosening and increase soil aeration, promoting the growth and development of crop roots. Additionally, intercropping of ryegrass with other crops proves effective in weed control, reducing the need for chemical herbicides and mitigating the negative impact of agricultural production on the environment [34,35].
The slightly increased pattern exhibited in July may contribute to an increase in N loss during the decay period during summer. This was aligned with ryegrass’s growth pattern and its rotational cycle. Ryegrass blooms and fruits from May to July, favoring a warm, cool, and humid climate. It thrives in areas with cool summers and relatively mild winters, exhibiting optimal growth at temperatures around 10 °C. It struggles at temperatures exceeding 27 °C, with growth declining notably at 35 °C. Tillering in ryegrass benefits from strong light, short days, and low temperatures, but excessive heat can halt or damage tiller development [36]. Ryegrass was withered in May during our study period, and the litter layer’s runoff retention capacity resulted in a total N runoff significantly lower than that of both the C. oleifera single cropping and control treatments [37]. Ryegrass serves as an excellent pasture and boasts notable soil improvement effects by enhancing soil organic matter and promoting soil aggregates. With a higher C/N ratio, ryegrass exhibits resistance to decay and features a slow nitrogen release rate [38]. During the growing season, ryegrass absorbs soil nitrogen nutrients. The well-developed root system and nitrogen-fixing ability of ryegrass contribute to water conservation and the maintenance of soil health [39]. The root system plays a crucial role in the subsoil’s organic carbon content, facilitating the transport of photosynthetic products into the underground soil and participating in the carbon and nitrogen cycle. The accumulation of litter in the surface soil increases the organic matter content, resulting in a higher total nitrogen content in the soil [40]. In the early growth stages, ryegrass effectively covers open spaces between rows in the Camellia oleifera forest. This coverage blocks precipitation, reducing direct soil erosion by rainwater. Additionally, some rainwater can penetrate the soil layer [41].
This study also revealed that intercropping cultivation did not significantly alter the N loss pattern. Generally, N loss primarily consists of soluble N, with distinct proportions of NO3-N and NH4+-N losses [42]. The loss of NO3-N in surface runoff constituted 4.1% to 7.8% of TN loss, while the loss of NH4+-N constituted 14.3% to 28.4% of TN loss. The NO3-N infiltrated the soil, accounting for 10.2% to 13.5% of TN loss, and NH4+-N loss accounted for 12.9% to 19.5% in our study. The N concentration and the amount lost in interflow were lower than those in surface runoff, possibly due to the lower N content of purple soil, which was more susceptible to loss during heavy precipitation [43]. The adsorption of NH4+-N by soil particles in NO3-N, making it less mobile and loss with runoff, results in a lower concentration of NH4+-N in runoff compared to the interflow [44]. Studies have shown that in sloping farmland, runoff water serves as the carrier for soil N loss [45]. Therefore, on purple soil slope-cultivated land, controlling runoff becomes a crucial step to reduce N loss load, emphasizing the importance of managing surface runoff generation.
The statement that the lowest NH4+-N concentration was observed in event 4 (April) in both surface and interflow runoff suggests that, during the specified event (event 4) in the month of April, the concentration of NH4+-N was at its minimum. The rapid decrease in NH4+-N levels during event 4 (April) may be attributed to the elevated rainfall amount in rainfall event 4 (April), along with the accelerated growth of ryegrass in warmer temperatures and rich precipitation conditions [46]. The rapid growth of ryegrass, stimulated by warmer temperatures and abundant precipitation, can influence NH4+-N levels through several mechanisms [47]. Ryegrass, as a vegetation cover, is known for its nitrogen uptake capabilities [48]. As the plant undergoes accelerated growth in response to favorable environmental conditions, it actively absorbs nitrogen compounds, including ammonium (NH4+), from the soil [49]. This uptake process is a vital component of the plant’s metabolic activities and contributes to the observed drop in NH4+-N concentrations in the runoff [50]. Furthermore, the root system of ryegrass can enhance soil structure, promoting water infiltration and reducing surface runoff [46]. Higher precipitation could result in enhanced leaching of ammonium nitrogen from the soil or affect its availability through various hydrological processes [51].
Comparing the intercropping with pure C. oleifera forests, the primary pathways of N loss in the C. oleifera monoculture system on sloping farmland are surface runoff and interflow runoff, as indicated by Wang et al. (2022) [52]. Both pathways contribute to N loss, leading to soil nutrient depletion and non-point source pollution in adjacent areas. Surface runoff is primarily influenced by factors such as precipitation, topography, soil texture, and surface cover [53]. On the other hand, soil erosion is closely linked to soil structural properties, including soil aggregate stability and porosity [54]. The practice of intercropping can influence nitrogen loss by altering soil structure and water migration dynamics, especially in purple soil slope-cultivated land [55].
The overall runoff pattern consistently showed higher values on the surface than in the interflow in our study (Figure 2, Figure 3, Figure 4, Figure 5, Figure 6 and Figure 7). These results were aligned with other research findings, for instance, some studies have indicated that surface runoff constitutes a substantial portion of the total runoff in the basin, particularly during periods of high rainfall intensity [56]. In addition, both field observations and model studies have underscored the direct and significant impact of surface runoff on river ecosystems, aquatic organisms, and human water use [57]. These findings are consistent with the principles of soil hydrology and soil fluid mechanics. In soil hydrology, subsurface flow refers to water movement within the soil, whereas surface runoff denotes water loss through the surface [58]. Despite both being integral components of the basin’s water cycle, surface runoff typically exhibits higher flow rates and faster movement speeds, exerting a more pronounced impact on water quantity and quality [59]. In conclusion, these results further validate the crucial role of surface runoff in the basin water cycle, offering valuable insights for a more comprehensive understanding of the basin’s water cycle and ecosystem complexity [52,60].

4.2. The Effects of Treatments on Phosphorus Loss in C. oleifera Forests on Purple Soil Slope-Cultivated Land

Intercropping of ryegrass reduces P losses by absorbing the kinetic energy of raindrops, protecting the soil surface, and slowing down the scouring effect of rain. Consequently, phosphorus loss through decreased runoff velocity and flow of runoff is reduced [61]. Additionally, intercropping enhances soil structure and increases soil nutrient capacity, soil microbial quantity, and soil enzyme activity [62]. This improvement contributes to enhanced soil phosphorus activation, increased soil phosphorus supply capacity, and improved absorption and utilization of phosphorus by crops. Consequently, intercropping further reduces the risk of phosphorus attrition [63,64].
During the later period of experimental observation from rainfall event 4 to event 9 (April to July), P loss concentrations in various forms in both surface runoff and interflow were lower under the ryegrass treatment. Notably, under the ryegrass treatment, the TP concentration in the interflow was slightly higher than that in the C. oleifera monoculture in May (during the rainfall events 5 and 6) (Figure 3). This difference can be primarily attributed to the seasonal growth of ryegrass. With its extended growth cycle, achieving full coverage from April to the end of July (rainfall event 4–9), ryegrass effectively minimizes direct rainwater erosion on the soil, facilitating infiltration. Additionally, owing to its slow decomposition rate and low P nutrient release rate, ryegrass absorbs soil P throughout its growth period. As a result, both the concentration and amount of phosphorus loss in surface runoff and interflow under the ryegrass treatment are relatively lower [65].

5. Conclusions

The findings of this study underscore the effectiveness of intercropping ryegrass with C. oleifera in mitigating nitrogen (N) and phosphorus (P) concentrations in both surface water runoff and interflow within C. oleifera forests on purple soil of slope-cultivated land. Notably, the intercropping exhibited a more substantial impact on reducing N and P concentrations compared to both C. oleifera monoculture and barren soil control conditions. The treatment of intercropping C. oleifera with ryegrass on sloping farmland emerged as a particularly effective strategy, significantly reducing N and P losses in surface runoff and interflow throughout the observation period from January to July 2023. The reduction rates for various nitrogen components (TN, DN, NO3-N, NH4+-N, and PN) in the intercropping system were significantly higher than those observed in C. oleifera monoculture, with reductions ranging from 29.3% to 67.7%. Moreover, the intercropping strategy demonstrated superior efficacy in reducing phosphorus components (TP, DP, PO4+-P, and PP) in both surface runoff and interflow compared to both the control and C. oleifera monoculture of purple soil. Reduction rates in the ryegrass treatment were substantially higher, ranging from 36.4% to 72.4%, underscoring the potential of this approach to mitigate phosphorus loss in sloping farmland. This study confirms that intercropping ryegrass with C. oleifera offers a promising and sustainable approach to reducing nitrogen (N) and phosphorus (P) loss in both runoff and interflow. This method contributes to enhanced environmental management on purple soil slope-cultivated land.

Author Contributions

Y.Z.: Conceptualization, Methodology, Formal analysis, Investigation, Writing—original draft, Writing—review and editing, Visualization, Project administration. J.L.: Conceptualization, Investigation, Writing—review and editing, Supervision, Project administration. Y.P. and X.C.: Writing—review and editing, Visualization, Investigation. B.L., Y.C. and Y.X.: Validation, Writing—review and editing. T.H.F.: Writing—review and editing. X.W.: Resources, Writing—review and editing, Supervision, Project administration. J.W. and W.Y.: Conceptualization, Writing—review and editing, Supervision, Project administration, Funding acquisition. All authors have read and agreed to the published version of the manuscript.

Funding

This study was supported by joint funds of the National Natural Science Foundation of China Grant numbers: U21A20187. A Project Supported by Scientific Research Fund of Hunan Provincial Education Department Grant numbers: 23A0230, the Outstanding Youth Foundation of Hunan Province (2020JJ3064), the Hunan Water Conservancy Science and Technology Project (XSKJ2022068-35) and the follow-up work of the Three Gorges Project of MWR (HY110161A0012022).

Data Availability Statement

The data presented in this study are available on request from the corresponding author. The data are not publicly available due to the funded projects not having been completed.

Acknowledgments

Thanks are also given to the staff of Lutou and Nanshan National Station for Scientific Observation and Research of Forest Ecosystems for field sampling and laboratory analysis.

Conflicts of Interest

The authors declare no conflicts of interest.

References

  1. Bhat, S.A.; Dar, M.U.D.; Meena, R.S. Soil Erosion and Management Strategies. In Sustainable Management of Soil and Environment; Springer: Singapore, 2019; pp. 73–122. [Google Scholar]
  2. Quinton, J.N.; Govers, G.; Van Oost, K.; Bardgett, R.D. The impact of agricultural soil erosion on biogeochemical cycling. Nat. Geosci. 2010, 3, 311–314. [Google Scholar] [CrossRef]
  3. Goyette, J.O.; Bennett, E.M.; Maranger, R. Differential influence of landscape features and climate on nitrogen and phosphorus transport throughout the watershed. Biogeochemistry 2019, 142, 155–174. [Google Scholar] [CrossRef]
  4. Natural Resources Conservation Service, U.S. DEPARTMENT OF AGRICULTURE (USDA). Entisols. Available online: https://www.nrcs.usda.gov/conservation-basics/natural-resource-concerns/soils/entisols (accessed on 20 February 2024).
  5. de Lima, N.M.M.; Munoz-Rojas, M.; Vazquez-Campos, X.; Branco, L.H.Z. Biocrust cyanobacterial composition, diversity, and environmental drivers in two contrasting climatic regions in Brazil. Geoderma 2021, 386, 114914. [Google Scholar] [CrossRef]
  6. Yuan, X.; Shao, Y.; Li, Y.; Liu, Y.; Zhao, Y. Cultivated land quality improvement to promote revitalization of sandy rural areas along the Great Wall in northern Shaanxi Province, China. J. Rural Stud. 2022, 93, 367–374. [Google Scholar] [CrossRef]
  7. Tefera, B.; Sterk, G. Land management, erosion problems and soil and water conservation in Fincha’a watershed, western Ethiopia. Land Use Policy 2010, 27, 1027–1037. [Google Scholar] [CrossRef]
  8. Xu, Y.; Yang, X.; Xu, G.; Fu, J.; Cai, S.; Mu, X.; Zhou, T.; Zhang, W.; Chen, J.; Li, L.; et al. Assessment of Integrated Soil and Water Conservation Practices on Soil Erosion Risk in a Typical Red-Beds Watershed in South China. Water 2023, 15, 2613. [Google Scholar] [CrossRef]
  9. Yang, N.; Zou, D.; Yang, M.; Lin, Z. Variations in soil microbial biomass carbon and soil dissolved organic carbon in the re-vegetation of hilly slopes with purple soil. PLoS ONE 2016, 11, e0166536. [Google Scholar] [CrossRef]
  10. Zhang, Y.; Xie, D.; Ni, J.; Zeng, X. Optimizing phosphate fertilizer application to reduce nutrient loss in a mustard (Brassica juncea var. tumida)-maize (Zea mays L.) rotation system in Three Gorges Reservoir area. Soil Tillage Res. 2019, 190, 78–85. [Google Scholar] [CrossRef]
  11. Khan, A.; Jan, M.T.; Marwat, K.B.; Arif, M. Organic and inorganic nitrogen treatments effects on plant and yield attributes of maize in a different tillage systems. Pak. J. Bot. 2009, 41, 99–108. [Google Scholar]
  12. Luo, S.; Yu, L.; Liu, Y.; Zhang, Y.; Yang, W.; Li, Z.; Wang, J. Effects of reduced nitrogen input on productivity and N2O emissions in a sugarcane/soybean intercropping system. Eur. J. Agron. 2016, 81, 78–85. [Google Scholar] [CrossRef]
  13. Zheng, F.; Huang, C.; Norton, L.D. Effects of near-surface hydraulic gradients on nitrate and phosphorus losses in surface runoff. J. Environ. Qual. 2004, 33, 2174–2182. [Google Scholar] [CrossRef]
  14. Himmatrao, M.S.; Raghavaiah, R.; Malamasuri Kadasiddappa, B.S. Influence of row ratio and zinc nutrition on yield, nutrient uptake and soil fertility status of maize (Zea mays)–soybean (Glycine max) intercropping systems under rainfed conditions. Environ. Ecol. 2014, 32, 169–173. [Google Scholar]
  15. Tu, S.; Chen, Y.; Zhu, Q.; Guo, Y.; Zhu, Z. Role and effect of cash crop hedgerows on controlling soil and water losses from sloping farmlands in the upper reaches of Yangtze River. J. Soil Water Conserv. 2005, 19, 1–5. [Google Scholar]
  16. Hauggaard-Nielsen, H.; Gooding, M.; Ambus, P.; Corre-Hellou, G.; Crozat, Y.; Dahlmann, C.; Dibet, A.; Von Fragstein, P.; Pristeri, A.; Monti, M. Pea–barley intercropping for efficient symbiotic N2-fixation, soil N acquisition and use of other nutrients in European organic cropping systems. Field Crop Res. 2009, 113, 64–71. [Google Scholar] [CrossRef]
  17. Song, Y.; Zhang, F.; Marschner, P.; Fan, F.; Gao, H.; Bao, X.; Sun, J.; Li, L. Effect of intercropping on crop yield and chemical and microbiological properties in rhizosphere of wheat (Triticum aestivum L.), maize (Zea mays L.), and faba bean (Vicia faba L.). Biol. Fertil. Soils 2007, 43, 565–574. [Google Scholar] [CrossRef]
  18. Li, L.; Zhang, F.; Li, X.; Christie, P.; Sun, J.; Yang, S.; Tang, C. Interspecific facilitation of nutrient uptake by intercropped maize and faba bean. Nutr. Cycl. Agroecosystems 2003, 65, 61–71. [Google Scholar] [CrossRef]
  19. Xia, H.; Wang, Z.; Zhao, J.; Sun, J.; Bao, X.; Christie, P.; Zhang, F.; Li, L. Contribution of interspecific interactions and phosphorus application to sustainable and productive intercropping systems. Field Crop Res. 2013, 154, 53–64. [Google Scholar] [CrossRef]
  20. Shittu, W.; Adedoyin, F.F.; Shah, M.I.; Musibau, H.O. An investigation of the nexus between natural resources, environmental performance, energy security and environmental degradation: Evidence from Asia. Resour. Policy 2021, 73, 102227. [Google Scholar] [CrossRef]
  21. Li, C.; Wu, Y.; Gao, B.; Zheng, K.; Wu, Y.; Li, C. Multi-scenario simulation of ecosystem service value for optimization of land use in the Sichuan-Yunnan ecological barrier, China. Ecol. Indic. 2021, 132, 108328. [Google Scholar] [CrossRef]
  22. Roberts, D.P.; Mattoo, A.K. Sustainable agriculture—Enhancing environmental benefits, food nutritional quality and building crop resilience to abiotic and biotic stresses. Agriculture 2018, 8, 8. [Google Scholar] [CrossRef]
  23. Zhang, J.; Yin, B.; Xie, Y.; Li, J.; Yang, Z.; Zhang, G. Legume-cereal intercropping improves forage yield, quality and degradability. PLoS ONE 2015, 10, e0144813. [Google Scholar] [CrossRef]
  24. Strehmel, A.; Schmalz, B.; Fohrer, N. Evaluation of land use, land management and soil conservation strategies to reduce non-point source pollution loads in the three gorges region, China. Environ. Manag. 2016, 58, 906–921. [Google Scholar] [CrossRef]
  25. Gou, F.; Van Ittersum, M.K.; Couëdel, A.; Zhang, Y.; Wang, Y.; van Der Putten, P.E.; Zhang, L.; Van Der Werf, W.J.A.P. Intercropping with wheat lowers nutrient uptake and biomass accumulation of maize, but increases photosynthetic rate of the ear leaf. AoB Plants 2018, 10, ply010. [Google Scholar] [CrossRef]
  26. Min, J.; Shi, W. Nitrogen discharge pathways in vegetable production as non-point sources of pollution and measures to control it. Sci. Total Environ. 2018, 613, 123–130. [Google Scholar] [CrossRef] [PubMed]
  27. Bright, M.B.; Diedhiou, I.; Bayala, R.; Assigbetse, K.; Chapuis-Lardy, L.; Ndour, Y.; Dick, R.P. Long-term Piliostigma reticulatum intercropping in the Sahel: Crop productivity, carbon sequestration, nutrient cycling, and soil quality. Ecosyst. Environ. 2017, 242, 9–22. [Google Scholar] [CrossRef]
  28. Mateus, G.; Crusciol, C.; Pariz, C.; Borghi, E.; Costa, C.; Martello, J.; Franzluebbers, A.; Castilhos, A.J.A.J. Sidedress nitrogen application rates to sorghum intercropped with tropical perennial grasses. Agron. J. 2016, 108, 433–447. [Google Scholar] [CrossRef]
  29. Xu, B.; Xu, W.; Wang, Z.; Chen, Z.; Palta, J.A.; Chen, Y. Accumulation of N and P in the legume Lespedeza davurica in controlled mixtures with the grass Bothriochloa ischaemum under varying water and fertilization conditions. Front. Plant Sci. 2018, 9, 165. [Google Scholar] [CrossRef] [PubMed]
  30. Lin, K.; Pei, J.; Li, P.; Ma, J.; Li, Q.; Yuan, D. Simultaneous determination of total dissolved nitrogen and total dissolved phosphorus in natural waters with an on-line UV and thermal digestion. Talanta 2018, 185, 419–426. [Google Scholar] [CrossRef]
  31. Worsfold, P.J.; Monbet, P.; Tappin, A.D.; Fitzsimons, M.F.; Stiles, D.A.; McKelvie, I.D. Characterisation and quantification of organic phosphorus and organic nitrogen components in aquatic systems: A review. Anal. Chim. Acta 2008, 624, 37–58. [Google Scholar] [CrossRef]
  32. Hodges, C.B.; Stone, B.M.; Johnson, P.K.; Carter, J.H., III; Sawyers, C.K.; Roby, P.R.; Lindsey, H.M. Researcher degrees of freedom in statistical software contribute to unreliable results: A comparison of nonparametric analyses conducted in SPSS, SAS, Stata, and R. Behav. Res. Methods 2023, 55, 2813–2837. [Google Scholar] [CrossRef]
  33. Glaze-Corcoran, S.; Hashemi, M.; Sadeghpour, A.; Jahanzad, E.; Herbert, S.J. Understanding intercropping to improve agricultural resiliency and environmental sustainability. Adv. Agron. 2020, 162, 199–256. [Google Scholar]
  34. Wang, Y.; He, L.; Xing, Y.; Zheng, Y.; Zhou, W.; Pian, R.; Yang, F.; Chen, X.; Zhang, Q. Dynamics of bacterial community and fermentation quality during ensiling of wilted and unwilted Moringa oleifera leaf silage with or without lactic acid bacterial inoculants. mSphere 2019, 4, 10–1128. [Google Scholar] [CrossRef] [PubMed]
  35. MacLaren, C.; Storkey, J.; Menegat, A.; Metcalfe, H.; Dehnen-Schmutz, K. An ecological future for weed science to sustain crop production and the environment. A review. Agron. Sustain. Dev. 2020, 40, 24. [Google Scholar] [CrossRef]
  36. Grogan, D.; Gilliland, T. A review of perennial ryegrass variety evaluation in Ireland. Ir. J. Agric. Food Res. 2011, 50, 65–81. [Google Scholar]
  37. O’neill, E.; Johnson, D.; Ledford, J.; Todd, D. Acute seasonal drought does not permanently alter mass loss and nitrogen dynamics during decomposition of red maple (Acer rubrum L.) litter. Glob. Change Biol. 2003, 9, 117–123. [Google Scholar] [CrossRef]
  38. Dai, X.; Li, X.; Zhang, D.; Chen, Y.; Dai, L. Simultaneous enhancement of methane production and methane content in biogas from waste activated sludge and perennial ryegrass anaerobic co-digestion: The effects of pH and C/N ratio. Bioresour. Technol. 2016, 216, 323–330. [Google Scholar] [CrossRef] [PubMed]
  39. Vrbnicanin, S.; Kresovic, M.; Bozic, D.; Simic, A.; Maletic, R.; Uludağ, A. The effect of ryegrass (Lolium italicum L.) stand densities on its competitive interaction with cleavers (Galium aparine L.). Turk. J. Agric. For. 2012, 36, 121–131. [Google Scholar] [CrossRef]
  40. Xu, S.; Li, P.; Sayer, E.J.; Zhang, B.; Wang, J.; Qiao, C.; Peng, Z.; Diao, L.; Chi, Y.; Liu, W. Initial soil organic matter content influences the storage and turnover of litter, root and soil carbon in grasslands. Ecosystems 2018, 21, 1377–1389. [Google Scholar] [CrossRef]
  41. Baptista, I.; Ritsema, C.; Querido, A.; Ferreira, A.; Geissen, V. Improving rainwater-use in Cabo Verde drylands by reducing runoff and erosion. Geoderma 2015, 237, 283–297. [Google Scholar] [CrossRef]
  42. Li, T.; Zhou, P.; Ding, Y.; Tang, Q.; Zhou, S.; Liu, Y. Distribution characteristics and source analysis of nitrogen and phosphorus in different rivers in two water period: A case study of Pi River and Shiting River in the upper reaches of Tuo River in China. Int. J. Environ. Res. Public Health 2022, 19, 12433. [Google Scholar] [CrossRef]
  43. Zheng, H.; Liu, Z.; Zuo, J.; Wang, L.; Nie, X. Characteristics of nitrogen loss through surface-subsurface flow on red soil slopes of Southeast China. Eurasian Soil Sci. 2017, 50, 1506–1514. [Google Scholar] [CrossRef]
  44. Chen, X.; Huang, Y.; Zhao, Y.; Mo, B.; Mi, H. Comparison of loess and purple rill erosions measured with volume replacement method. J. Hydrol. 2015, 530, 476–483. [Google Scholar] [CrossRef]
  45. Zhao, P.; Tang, X.; Tang, J.; Zhu, B. The nitrogen loss flushing mechanism in sloping farmlands of shallow Entisol in southwestern China: A study of the water source effect. Arab. J. Geosci. 2015, 8, 10325–10337. [Google Scholar] [CrossRef]
  46. Meyer, R.; Sinnett, A.; Perera, R.; Cullen, B.; Malcolm, B.; Eckard, R.J. The potential of deep roots to mitigate impacts of heatwaves and declining rainfall on pastures in Southeast Australia. Plants 2021, 10, 1641. [Google Scholar] [CrossRef] [PubMed]
  47. Barger, N.N.; Castle, S.C.; Dean, G.N. Denitrification from nitrogen-fixing biologically crusted soils in a cool desert environment, southeast Utah, USA. Ecol. Process. 2013, 2, 16. [Google Scholar] [CrossRef]
  48. Li, J.; Luo, J.; Shi, Y.; Lindsey, S.; Houlbrooke, D.; Ledgard, S. Nitrous oxide emissions from dairy farm effluent applied to a New Zealand pasture soil. Soil Use Manag. 2015, 31, 279–289. [Google Scholar] [CrossRef]
  49. Coskun, D.; Britto, D.T.; Shi, W.; Kronzucker, H.J. Nitrogen transformations in modern agriculture and the role of biological nitrification inhibition. Nat. Plants 2017, 3, 17074. [Google Scholar] [CrossRef]
  50. Yang, D.; Zhao, J.; Bi, C.; Li, L.; Wang, Z. Transcriptome and Proteomics Analysis of Wheat Seedling Roots Reveals That Increasing NH4+/NO3 ratio induced root lignification and reduced nitrogen utilization. Front. Plant Sci. 2022, 12, 797260. [Google Scholar] [CrossRef]
  51. Wang, Z.; Li, S. Nitrate N loss by leaching and surface runoff in agricultural land: A global issue (a review). Adv. Agron. 2019, 156, 159–217. [Google Scholar]
  52. Wang, T.; Xiao, W.; Huang, Z.; Zeng, L. Interflow pattern govern nitrogen loss from tea orchard slopes in response to rainfall pattern in Three Gorges Reservoir Area. Agric. Water Manag. 2022, 269, 107684. [Google Scholar] [CrossRef]
  53. Vanni, M.J.; Renwick, W.H.; Headworth, J.L.; Auch, J.D.; Schaus, M.H. Dissolved and particulate nutrient flux from three adjacent agricultural watersheds: A five-year study. Biogeochemistry 2001, 54, 85–114. [Google Scholar] [CrossRef]
  54. Jing, X.; Li, L.; Chen, S.; Shi, Y.; Xu, M.; Zhang, Q. Straw returning on sloping farmland reduces the soil and water loss via surface flow but increases the nitrogen loss via interflow. Agric. Ecosyst. Environ. 2022, 339, 108154. [Google Scholar] [CrossRef]
  55. Lin, J.; Fang, N.; Zhang, Y.; Zeng, Y.; Yang, D.; Dai, W.; Wang, L.; Shi, Z. Dynamics of soil organic carbon in different-sized aggregates under splash erosion. J. Soils Sediments 2022, 22, 1713–1723. [Google Scholar] [CrossRef]
  56. Guzha, A.C.; Rufino, M.C.; Okoth, S.; Jacobs, S.; Nóbrega, R.L.B. Impacts of land use and land cover change on surface runoff, discharge and low flows: Evidence from East Africa. J. Hydrol.-Reg. Stud. 2018, 15, 49–67. [Google Scholar] [CrossRef]
  57. Jones, J.A.; Creed, I.F.; Hatcher, K.L.; Warren, R.J.; Adams, M.B.; Benson, M.H.; Williams, M.W. Ecosystem processes and human influences regulate streamflow response to climate change at long-term ecological research sites. BioScience 2012, 62, 390–404. [Google Scholar] [CrossRef]
  58. Wang, S.; Fu, Z.; Chen, H.; Nie, Y.; Xu, Q.J.E. Mechanisms of surface and subsurface runoff generation in subtropical soil-epikarst systems: Implications of rainfall simulation experiments on karst slope. J. Hydrol. 2020, 580, 124370. [Google Scholar] [CrossRef]
  59. Jarvis, N.J. A review of non-equilibrium water flow and solute transport in soil macropores: Principles, controlling factors and consequences for water quality. Eur. J. Soil Sci. 2007, 58, 523–546. [Google Scholar] [CrossRef]
  60. Du, E.; Jackson, C.R.; Klaus, J.; McDonnell, J.J.; Griffiths, N.A.; Williamson, M.F.; Greco, J.L.; Bitew, M. Interflow dynamics on a low relief forested hillslope: Lots of fill, little spill. J. Hydrol. 2016, 534, 648–658. [Google Scholar] [CrossRef]
  61. Blanco-Canqui, H.; Gantzer, C.; Anderson, S.; Alberts, E.; Thompson, A. Grass barrier and vegetative filter strip effectiveness in reducing runoff, sediment, nitrogen, and phosphorus loss. Soil Sci. Soc. Am. J. 2004, 68, 1670–1678. [Google Scholar] [CrossRef]
  62. Wang, Z.; Bao, X.; Li, X.; Jin, X.; Zhao, J.; Sun, J.; Christie, P.; Li, L. Intercropping maintains soil fertility in terms of chemical properties and enzyme activities on a timescale of one decade. Plant Soil 2015, 391, 265–282. [Google Scholar] [CrossRef]
  63. Kamh, M.; Abdou, M.; Chude, V.; Wiesler, F.; Horst, W.J. Mobilization of phosphorus contributes to positive rotational effects of leguminous cover crops on maize grown on soils from northern Nigeria. J. Plant Nutr. Soil Sci. 2002, 165, 566–572. [Google Scholar] [CrossRef]
  64. Palanivell, P.; Ahmed, O.H.; Omar, L.; Majid, N.M.A. Nitrogen, Phosphorus, and Potassium Adsorption and Desorption Improvement and Soil Buffering Capacity Using Clinoptilolite Zeolite. Agronomy 2021, 11, 379. [Google Scholar] [CrossRef]
  65. Dougherty, W.J.; Mason, S.D.; Burkitt, L.L.; Milham, P.J. Relationship between phosphorus concentration in surface runoff and a novel soil phosphorus test procedure (DGT) under simulated rainfall. Soil Res. 2011, 49, 523–528. [Google Scholar] [CrossRef]
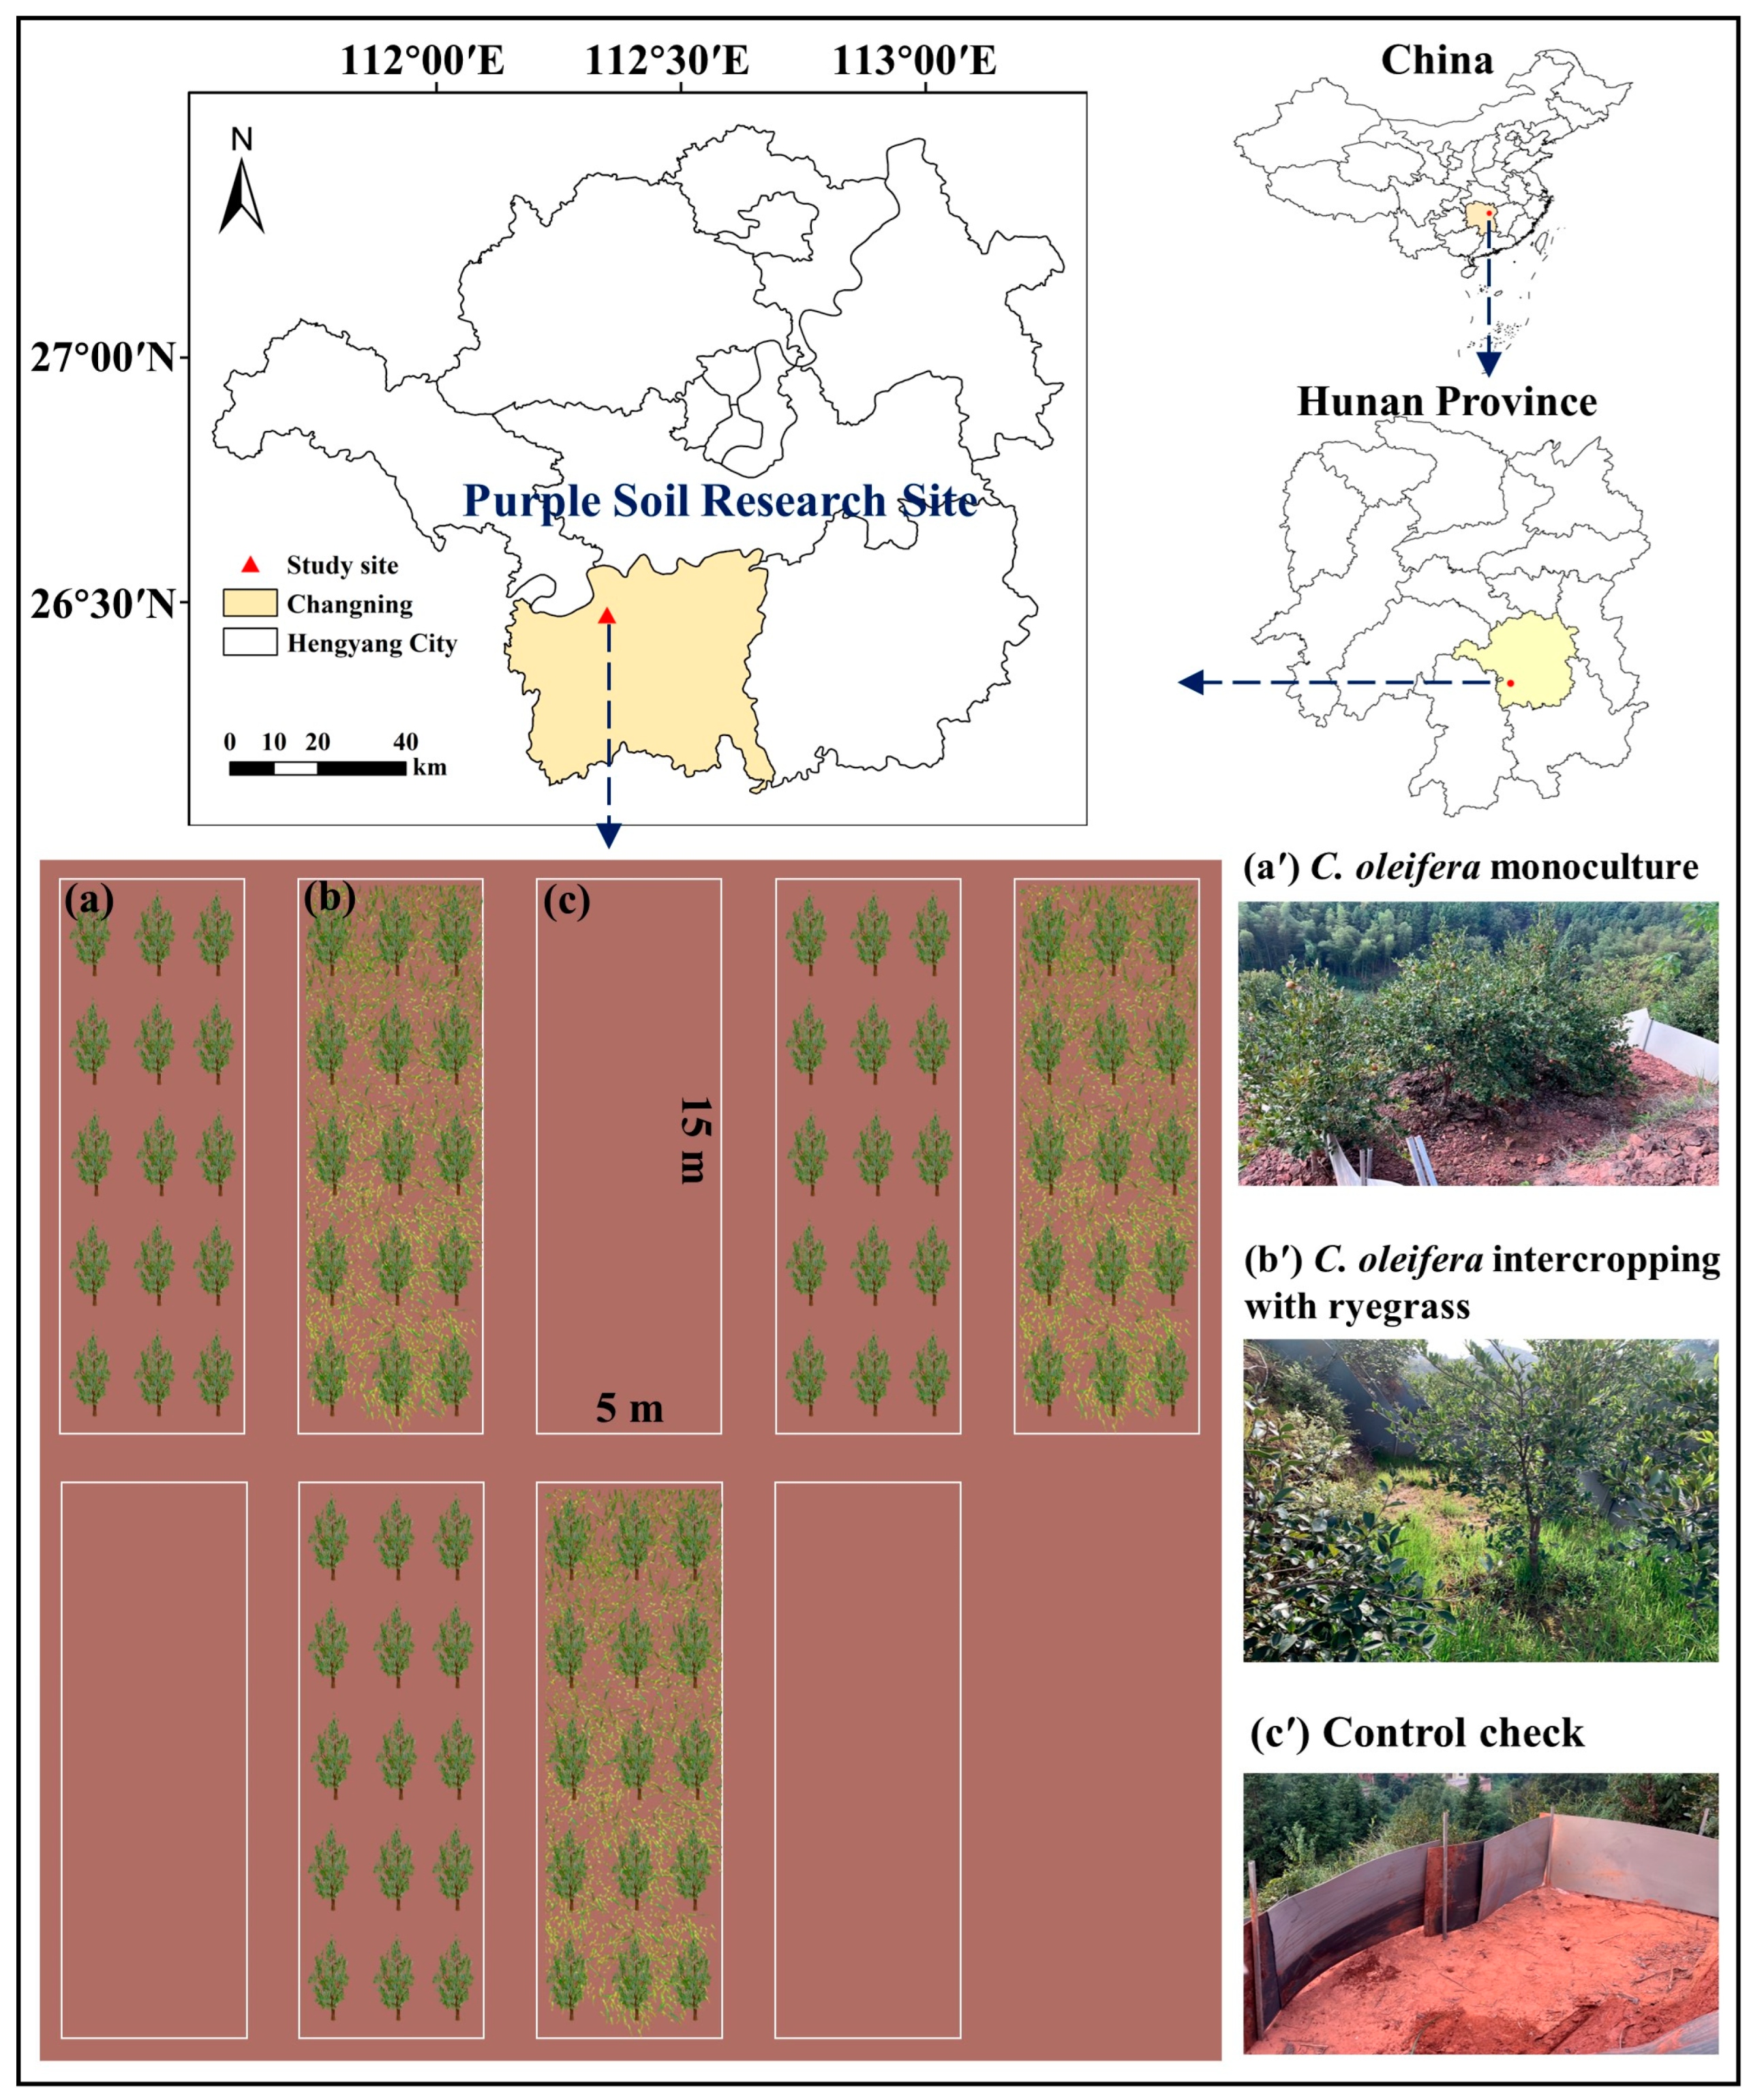
Figure 1. Sampling point distribution, experimental plots, and treatments. (a) C. oleifera monoculture; (b) ryegrass intercropping with C. oleifera; (c) the barren land control (CK).
Forests 15 00461 g001
Figure 2. The stoichiometric characteristics of TN (a1a3), DN (b1b3), NO3-N (c1c3), NH4+-N (d1d3), and PN (e1e3) in surface runoff (1) and interflow (2) in purple soil of C. Oleifera forests under three treatment plots. Events 1 to 9 represent the rainfall occurrences from January to July of 2023. Events 1 to 4 correspond to the months from January to April, events 5 and 6 occurred in May, events 7 and 8 occurred in June, and event 9 occurred in July. Three curves represent the three distinct treatments: intercropping of oil tea (Camellia oleifera) and ryegrass, Camellia oleifera monoculture, and barren land control treatment (CK). The right Y-axis represents the amount of rainfall corresponding to the 9 rainfall events. Different lowercase letters indicate significant variability (p < 0.05). Bars represent mean value with standard error (±SE) (n = 9). The abbreviations used are as follows: TN (total nitrogen), DN (dissolved nitrogen), NO3-N (nitrate nitrogen), NH4+-N (ammonium nitrogen), and PN (particulate nitrogen).
Forests 15 00461 g002
Figure 3. The stoichiometric characteristics of TP (a1a3), DP (b1b3), PO4-P (c1c3), and PP (d1d3) in surface runoff (1) and interflow (2) in purple soil of C. Oleifera forests under three treatment plots. Events 1 to 9 represent the rainfall occurrences from January to July of 2023. Events 1 to 4 correspond to the months from January to April, events 5 and 6 occurred in May, events 7 and 8 occurred in June, and event 9 occurred in July. The three curves represent the three distinct treatments: intercropping of oil tea (Camellia oleifera) and ryegrass, Camellia oleifera monoculture, and barren land control treatment (CK). The right Y-axis represents the amount of rainfall corresponding to the 9 rainfall events. Different lowercase letters indicate significant variability (p < 0.05). Bars represent mean value with standard error (±SE) (n = 9). The abbreviations used are as follows: TP (total phosphorus), DP (dissolved phosphorus), PO4-P (phosphate), and PP (particulate phosphorus).
Forests 15 00461 g003
Figure 4. The stoichiometric characteristics of TN (a), DN (b), NO3-N (c), NH4+-N (d), and PN (e) loss in surface runoff and interflow in purple soil of C. Oleifera forests under three treatment plots. Different lowercase letters indicate significant variability (p < 0.05). The abbreviations used are as follows: TN (total nitrogen), DN (dissolved nitrogen), NO3-N (nitrate nitrogen), NH4+-N (ammonium nitrogen), and PN (particulate nitrogen).
Forests 15 00461 g004
Figure 5. The overall average stoichiometric characteristics of TP (a), DP (b), PO4-P (c), and PP (d) loss in surface runoff (1) and interflow (2) in purple soil of C. Oleifera forests under three treatment plots. Different lowercase letters indicate significant variability (p < 0.05). The abbreviations used are as follows: TP (total phosphorus), DP (dissolved phosphorus), PO4+-P (phosphate), and PP (particulate phosphorus).
Forests 15 00461 g005
Figure 6. The stoichiometric characteristics of TN (a1,a2), DN (b1,b2), NO3-N (c1,c2), NH4+-N (d1,d2), and PN (e1,e2) loss in surface runoff (1) and interflow (2) in purple soil of C. oleifera forests under three treatment plots during the measurement from Jan to July. The abbreviations used are as follows: TN (total nitrogen), DN (dissolved nitrogen), NO3-N (nitrate nitrogen), NH4+-N (ammonium nitrogen), and PN (particulate nitrogen).
Forests 15 00461 g006
Figure 7. The stoichiometric characteristics of TP (a1,a2), DP (b1,b2), PO4-P (c1,c2), and PP (d1,d2) loss in surface runoff (1) and interflow (2) in purple soil of C. Oleifera forests under three treatment plots during the measurement from Jan to July. The abbreviations used are as follows: TP (total phosphorus), DP (dissolved phosphorus), PO4+-P (phosphate), and PP (particulate phosphorus).
Forests 15 00461 g007
Table 1. The background values of the experimental sample plots.
IndexSoil Depth (cm)Treatments
CKMonoculture
pH0–204.1 ± 0.03 b 4.4 ± 0.03 a
SOC (g/kg)0–204.73 ± 0.08 b 5.76 ± 0.15 a
TN (g/kg)0–200.59 ± 0.06 b 0.74 ± 0.04 a
TP (g/kg)0–200.05 ± 0.01 a 0.06 ± 0.01 a
NO3-N (mg/kg)0–2037.46 ± 1.57 a 39.88 ± 0.91 a
NH4+-N (mg/kg)0–203.45 ± 0.11 a 3.87 ± 0.18 a
Note: All data are presented as the mean ± standard error in CK and 7-year-old Camellia oleifera monoculture land plots. CK represents the barren land as the control treatment, n = 3 in CK; n = 6 in Camellia oleifera monoculture plots. Different lowercase letters represent significant differences in soil physicochemical characteristics among different treatments at the p < 0.05 level (Tukey’s test). SOC for soil organic carbon, TN for soil total nitrogen, TP for soil total phosphorus, NO3-N for nitrate nitrogen, and NH4+-N for ammonium nitrogen.
Table 2. The three-way analysis of variance (ANOVA) of soil N and P concentrations within treatments, in runoff across various soil layers, among rainfall events, and their interaction effects.
SourceDFTNDNNO3-NNH4+-NPN
FpFpFpFpFp
Treatment (T)21195.2280.000 ***4633.2420.000 ***558.1960.000 ***400.0330.000 ***2055.3540.000 ***
Runoff layer (R)1846.8580.000 ***809.8040.000 ***2714.9240.000 ***2321.0040.000 ***211.8840.000 ***
Event (E)8172.4220.000 ***85.6410.000 ***206.3060.000 ***203.6790.000 ***233.8560.000 ***
T × R219.5220.000 ***128.0960.000 ***201.7200.000 ***27.3140.000 ***741.5500.000 ***
T × E166.4920.000 ***139.0040.000 ***35.1960.000 ***20.6170.000 ***53.3240.000 ***
R × E87.0510.000 ***309.3420.000 ***57.0860.000 ***60.3600.000 ***28.3790.000 ***
T × R × E162.8740.001 **119.3400.000 ***9.0690.000 ***27.2670.000 ***41.2610.000 ***
SourceDFTPDPPO4-PPP
FpFpFpFp
Treatment (T)216.5620.000 ***3.3600.002 **3.3170.002 *6.8710.000 ***
Runoff layer (R)1172.4290.000 ***33.6360.000 ***16.9300.000 ***51.5990.000 ***
Event (E)836.4790.000 ***0.2030.6530.2170.64241.9410.000 ***
T × R25.6610.000 ***2.0930.014 *0.8540.6222.6580.001 **
T × E161.0250.4220.4450.8910.2580.9780.4130.911
R × E88.6180.000 ***0.4630.6300.4560.63512.6650.000 ***
T × R × E161.4340.1400.2160.9990.2460.9991.0930.371
Note: The values in the table represent the p-value. *, **, and *** indicate significance at p < 0.05, p < 0.01, and p < 0.001, respectively. Treatments (T): C. oleifera monoculture, ryegrass intercropping with C. oleifera, and barren land control. Runoff layer (R): surface and interflow. Events (E): nine precipitation events. The abbreviations used are as follows: TN (total nitrogen), DN (dissolved nitrogen), NO3-N (nitrate nitrogen), NH4+-N (ammonium nitrogen), PN (particulate nitrogen), TP (total phosphorus), DP (dissolved phosphorus), PO4+-P (phosphate), and PP (particulate phosphorus). Table F refers to the F-statistic, which is a measure used in the analysis of variance (ANOVA) to determine whether there are significant differences between the means of three or more groups. It is calculated by dividing the variance between groups by the variance within groups. p represents the p-value in statistics. A p-value < 0.05 indicates a significant difference between the two groups.
Disclaimer/Publisher’s Note: The statements, opinions and data contained in all publications are solely those of the individual author(s) and contributor(s) and not of MDPI and/or the editor(s). MDPI and/or the editor(s) disclaim responsibility for any injury to people or property resulting from any ideas, methods, instructions or products referred to in the content.