
The Process of Patchy Expansion for Bamboo (Phyllostachys edulis) at the Bamboo–Broadleaf Forest Interface: Spreading and Filling in Order

Abstract
1. Introduction
2. Material and Methods
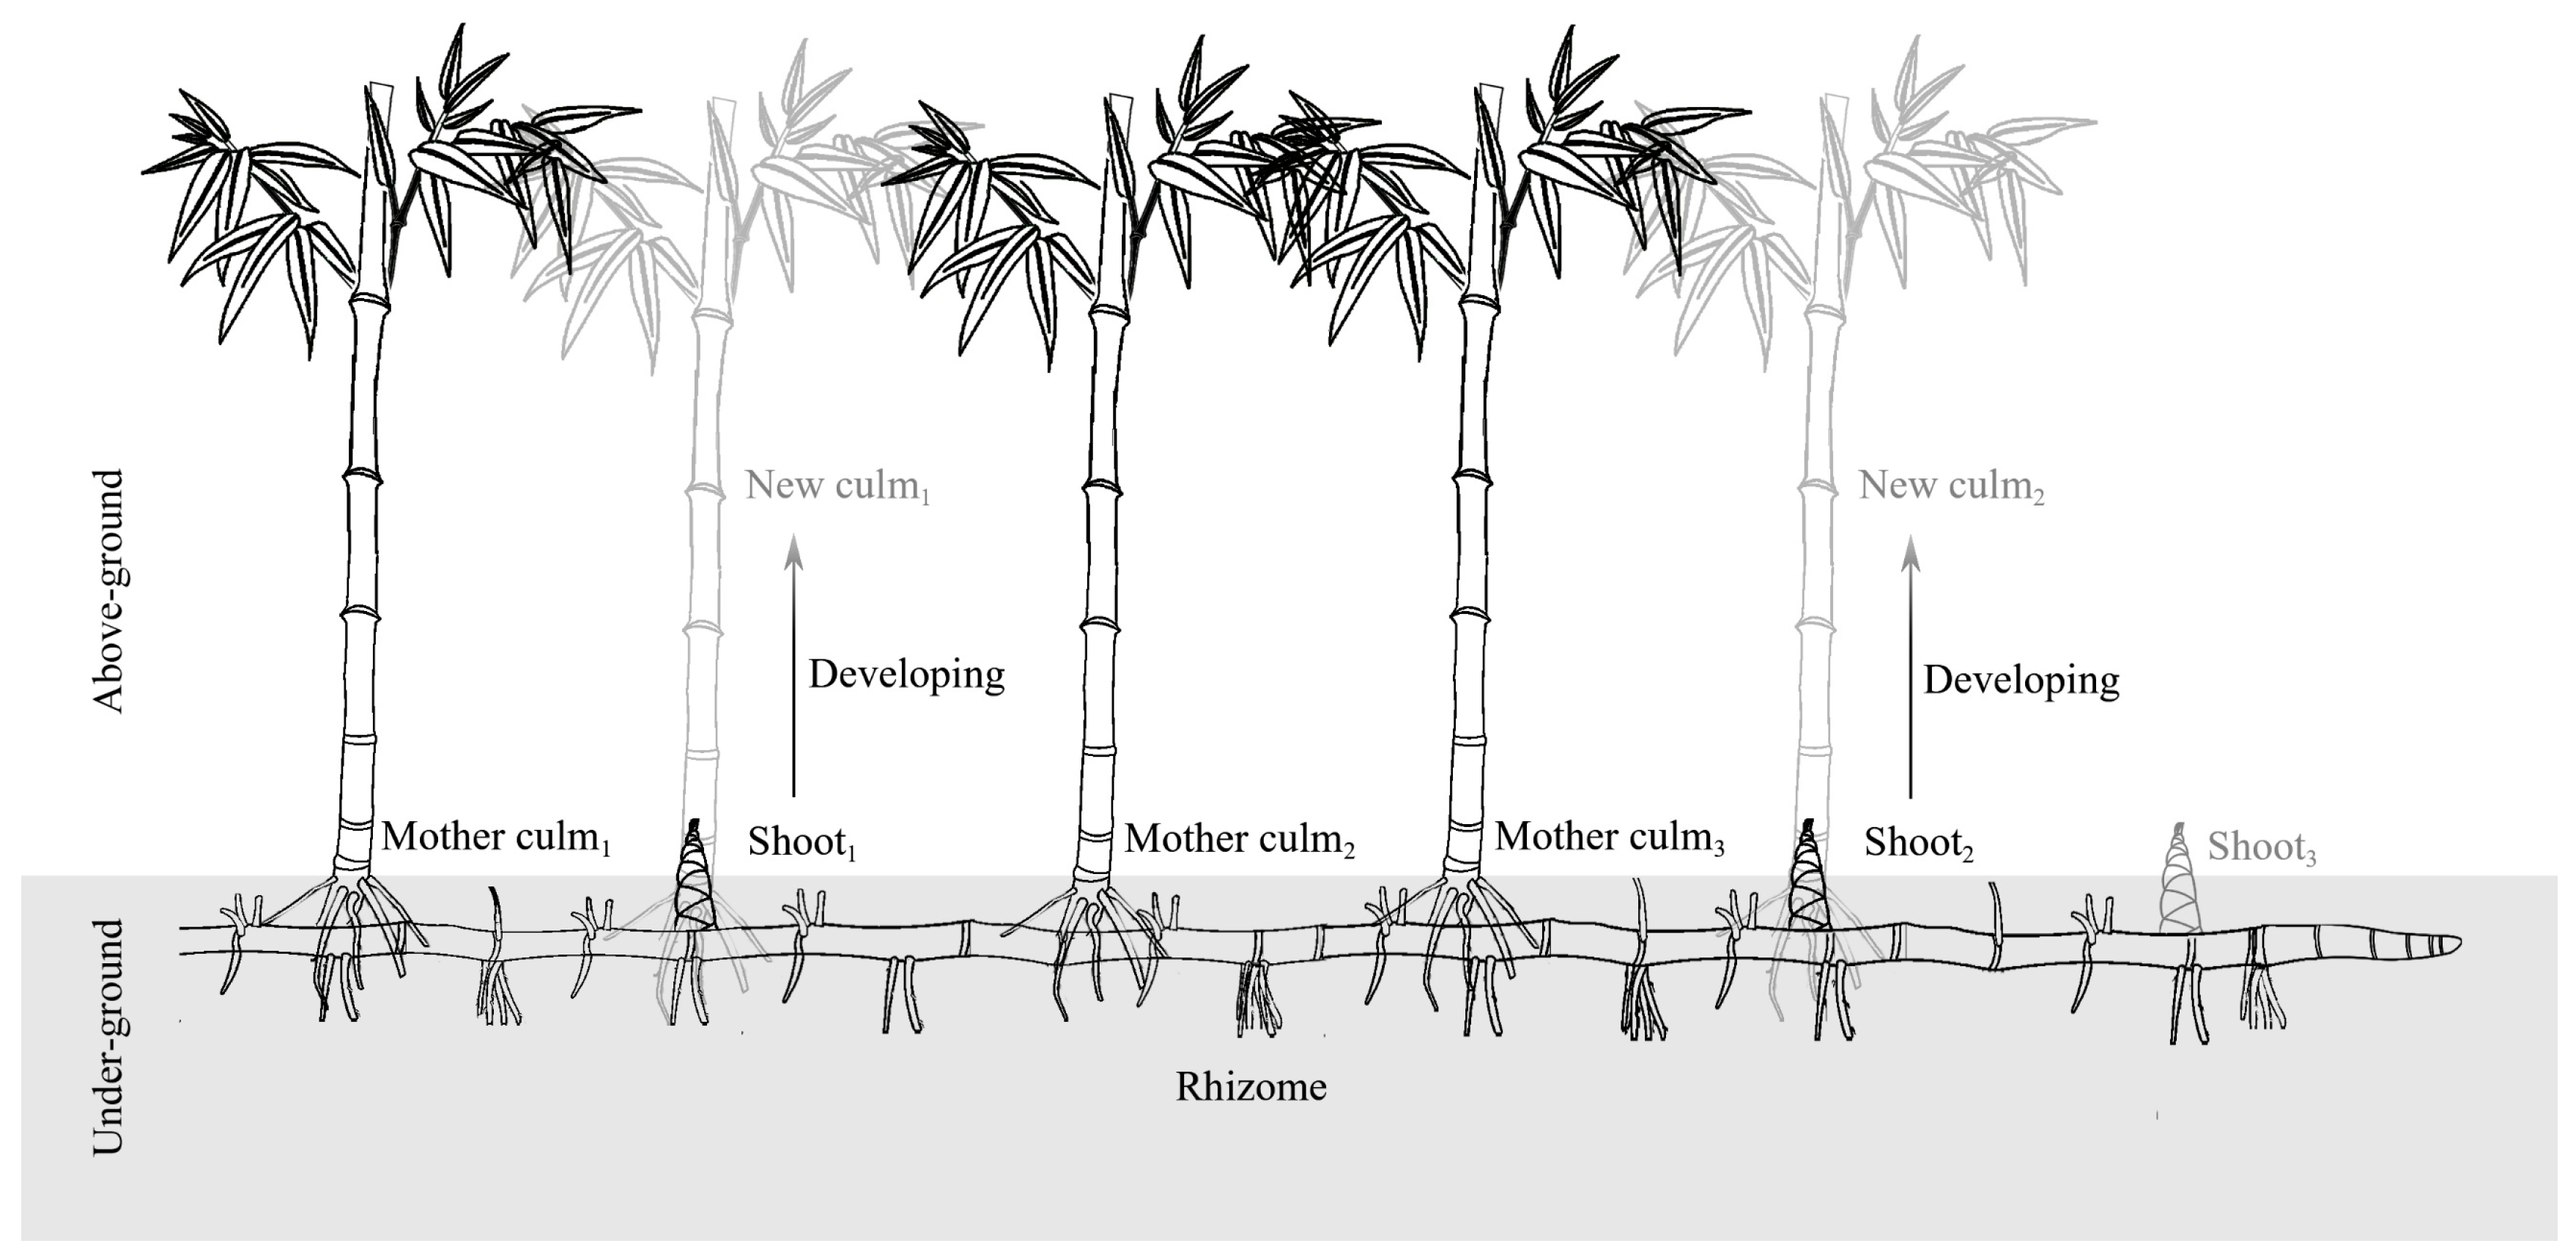
2.1. Study Species
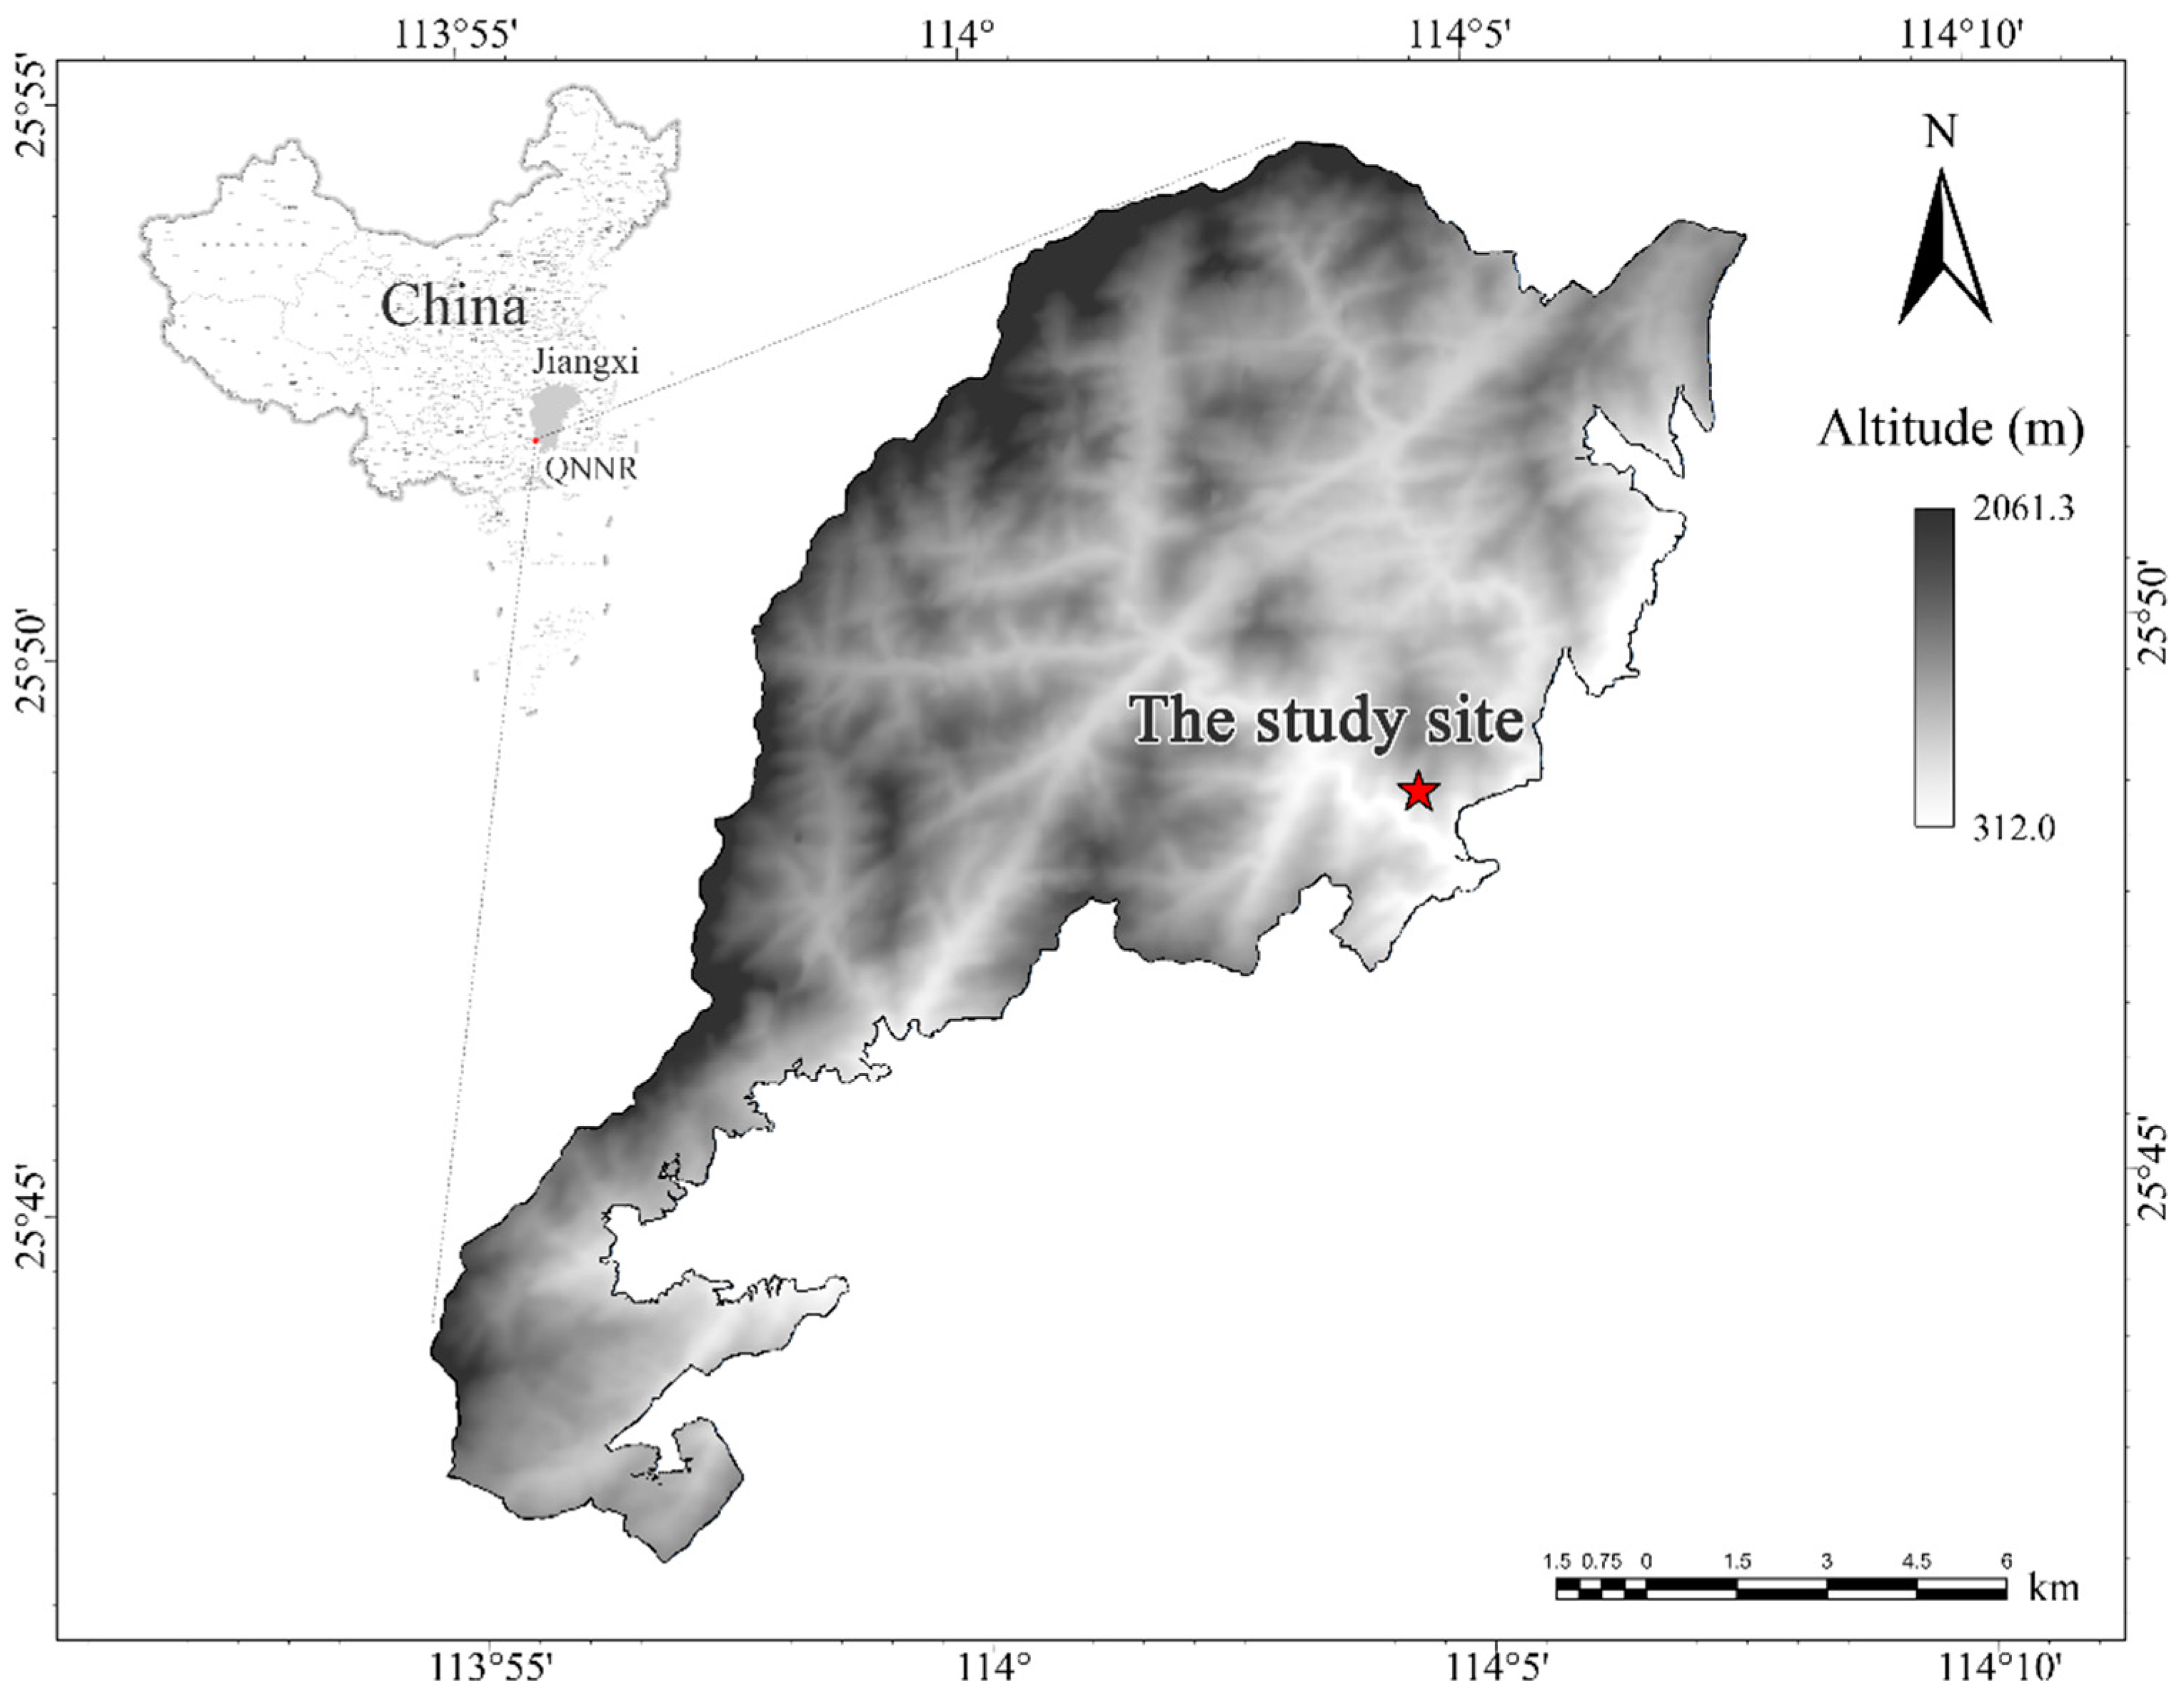
2.2. Study Site
2.3. Survey Methods and Forest Plot Data
2.4. Data Processing
2.4.1. Patch Determination
2.4.2. Patch Characteristics
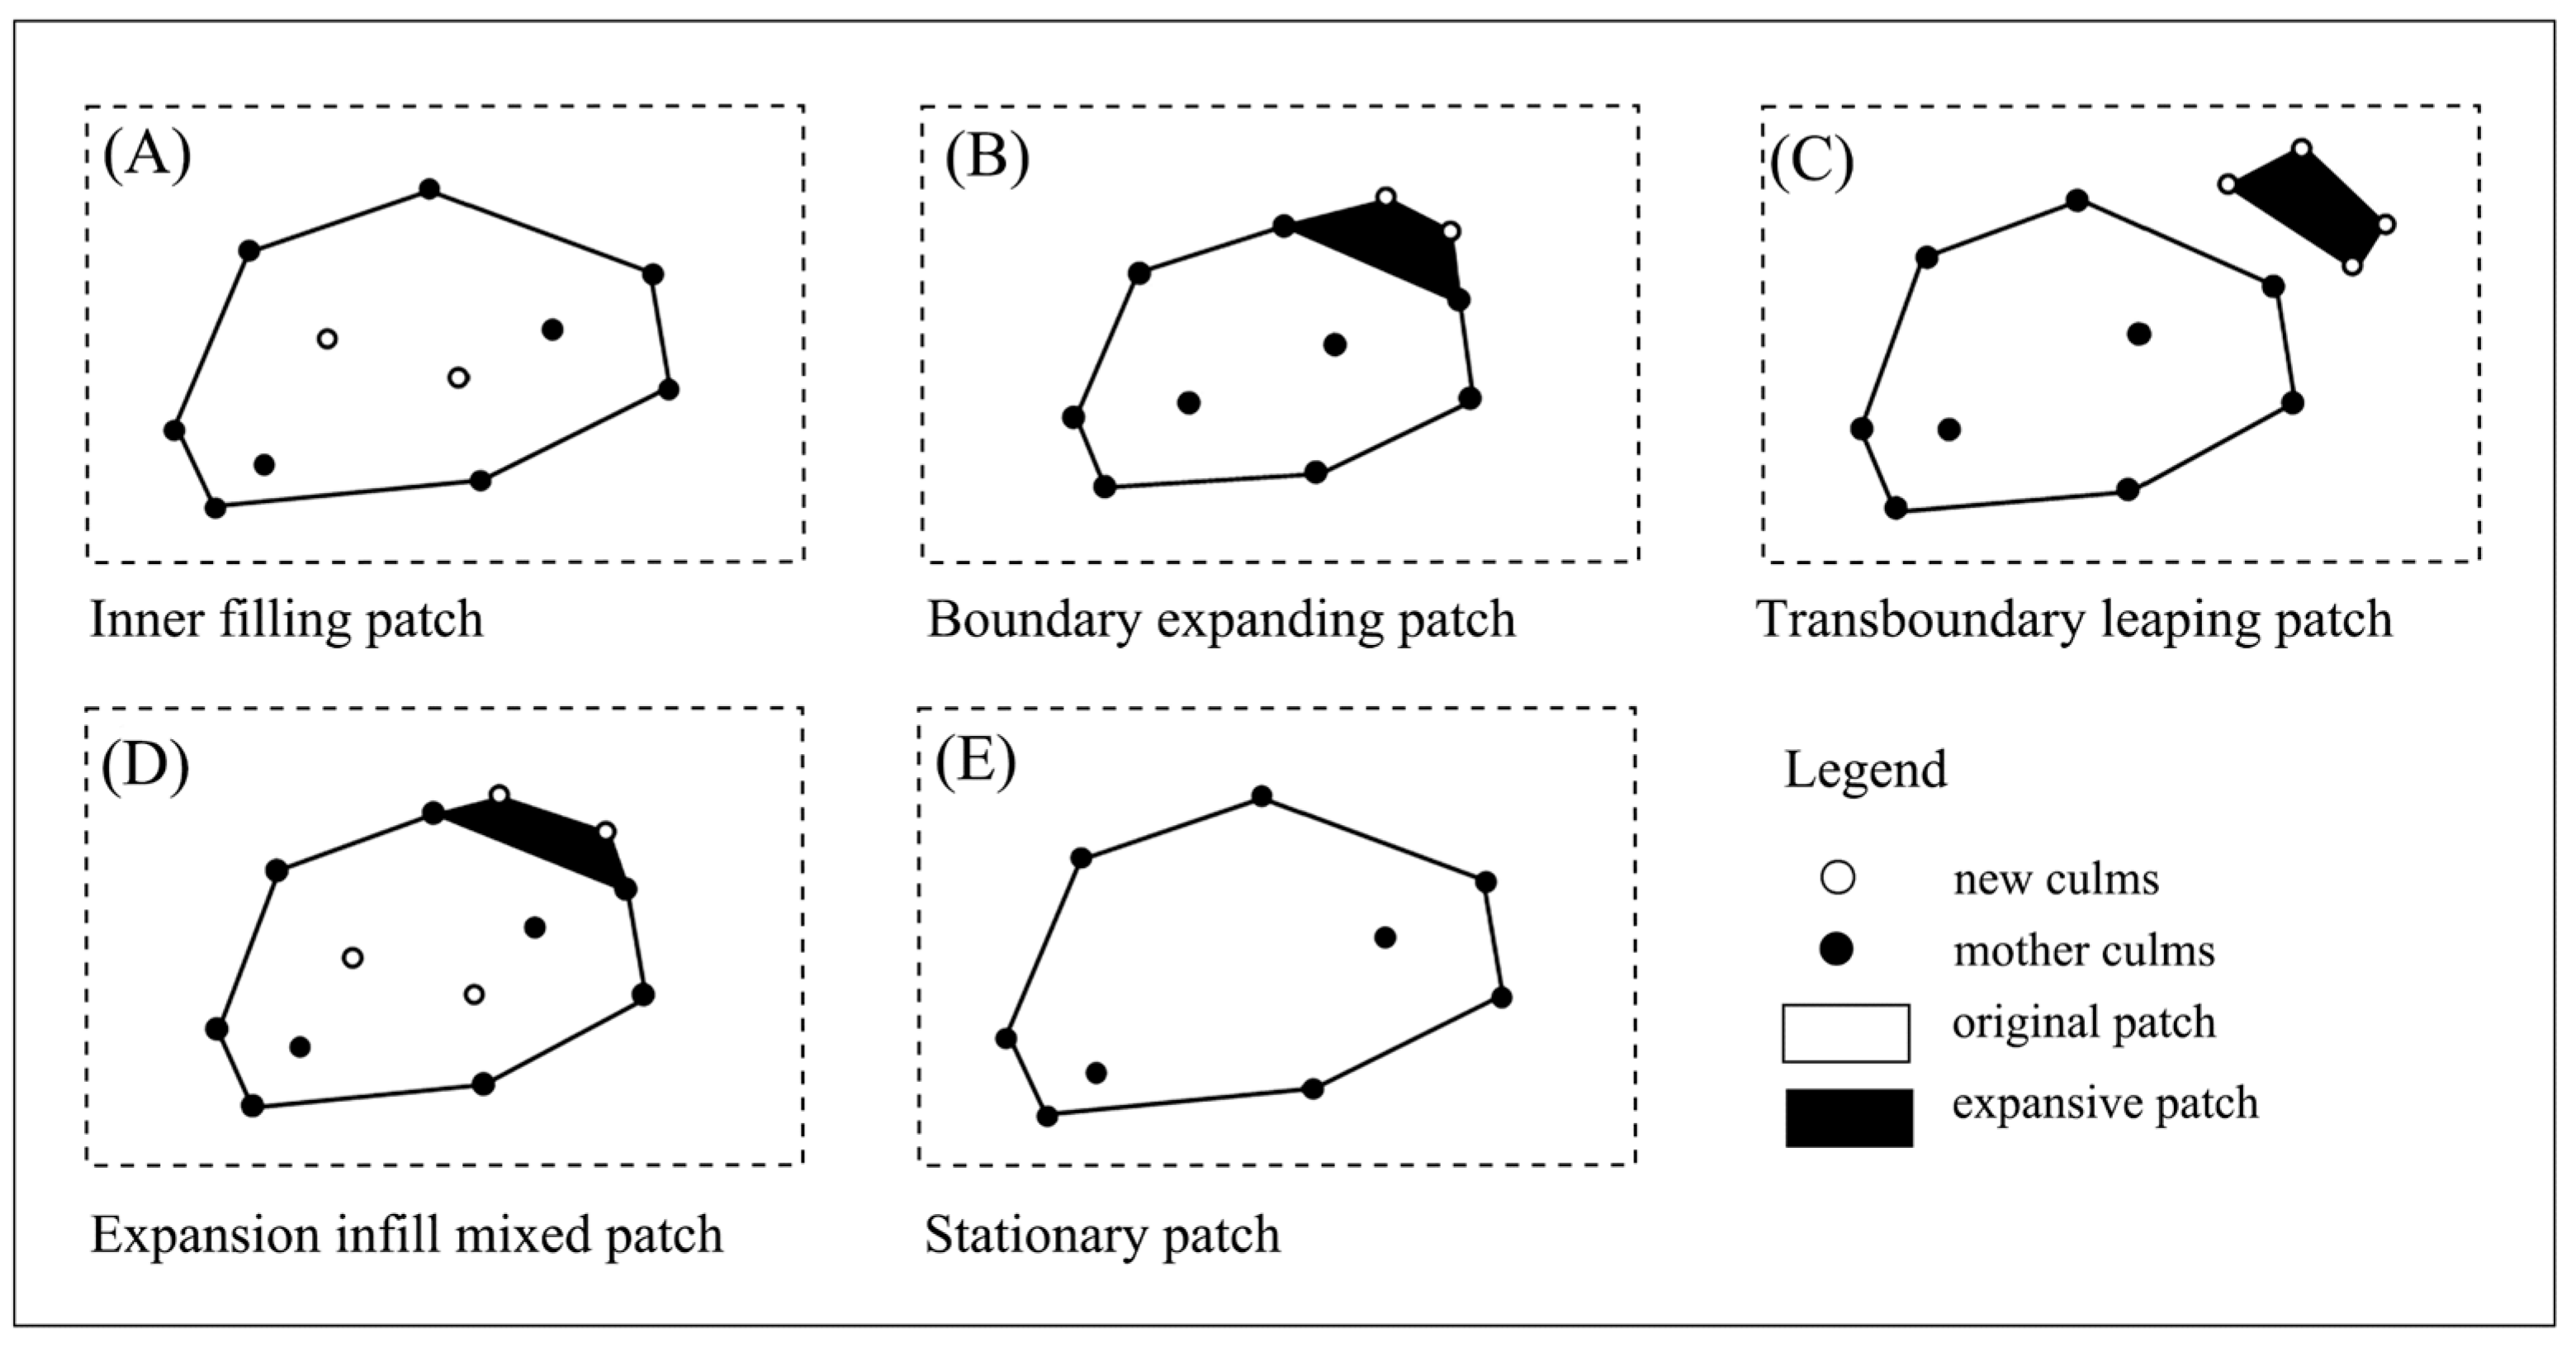
2.4.3. Expansion Patch Types
2.4.4. Expansion Indexes and Expansion Rate Calculations
2.5. Statistical Analysis
3. Results
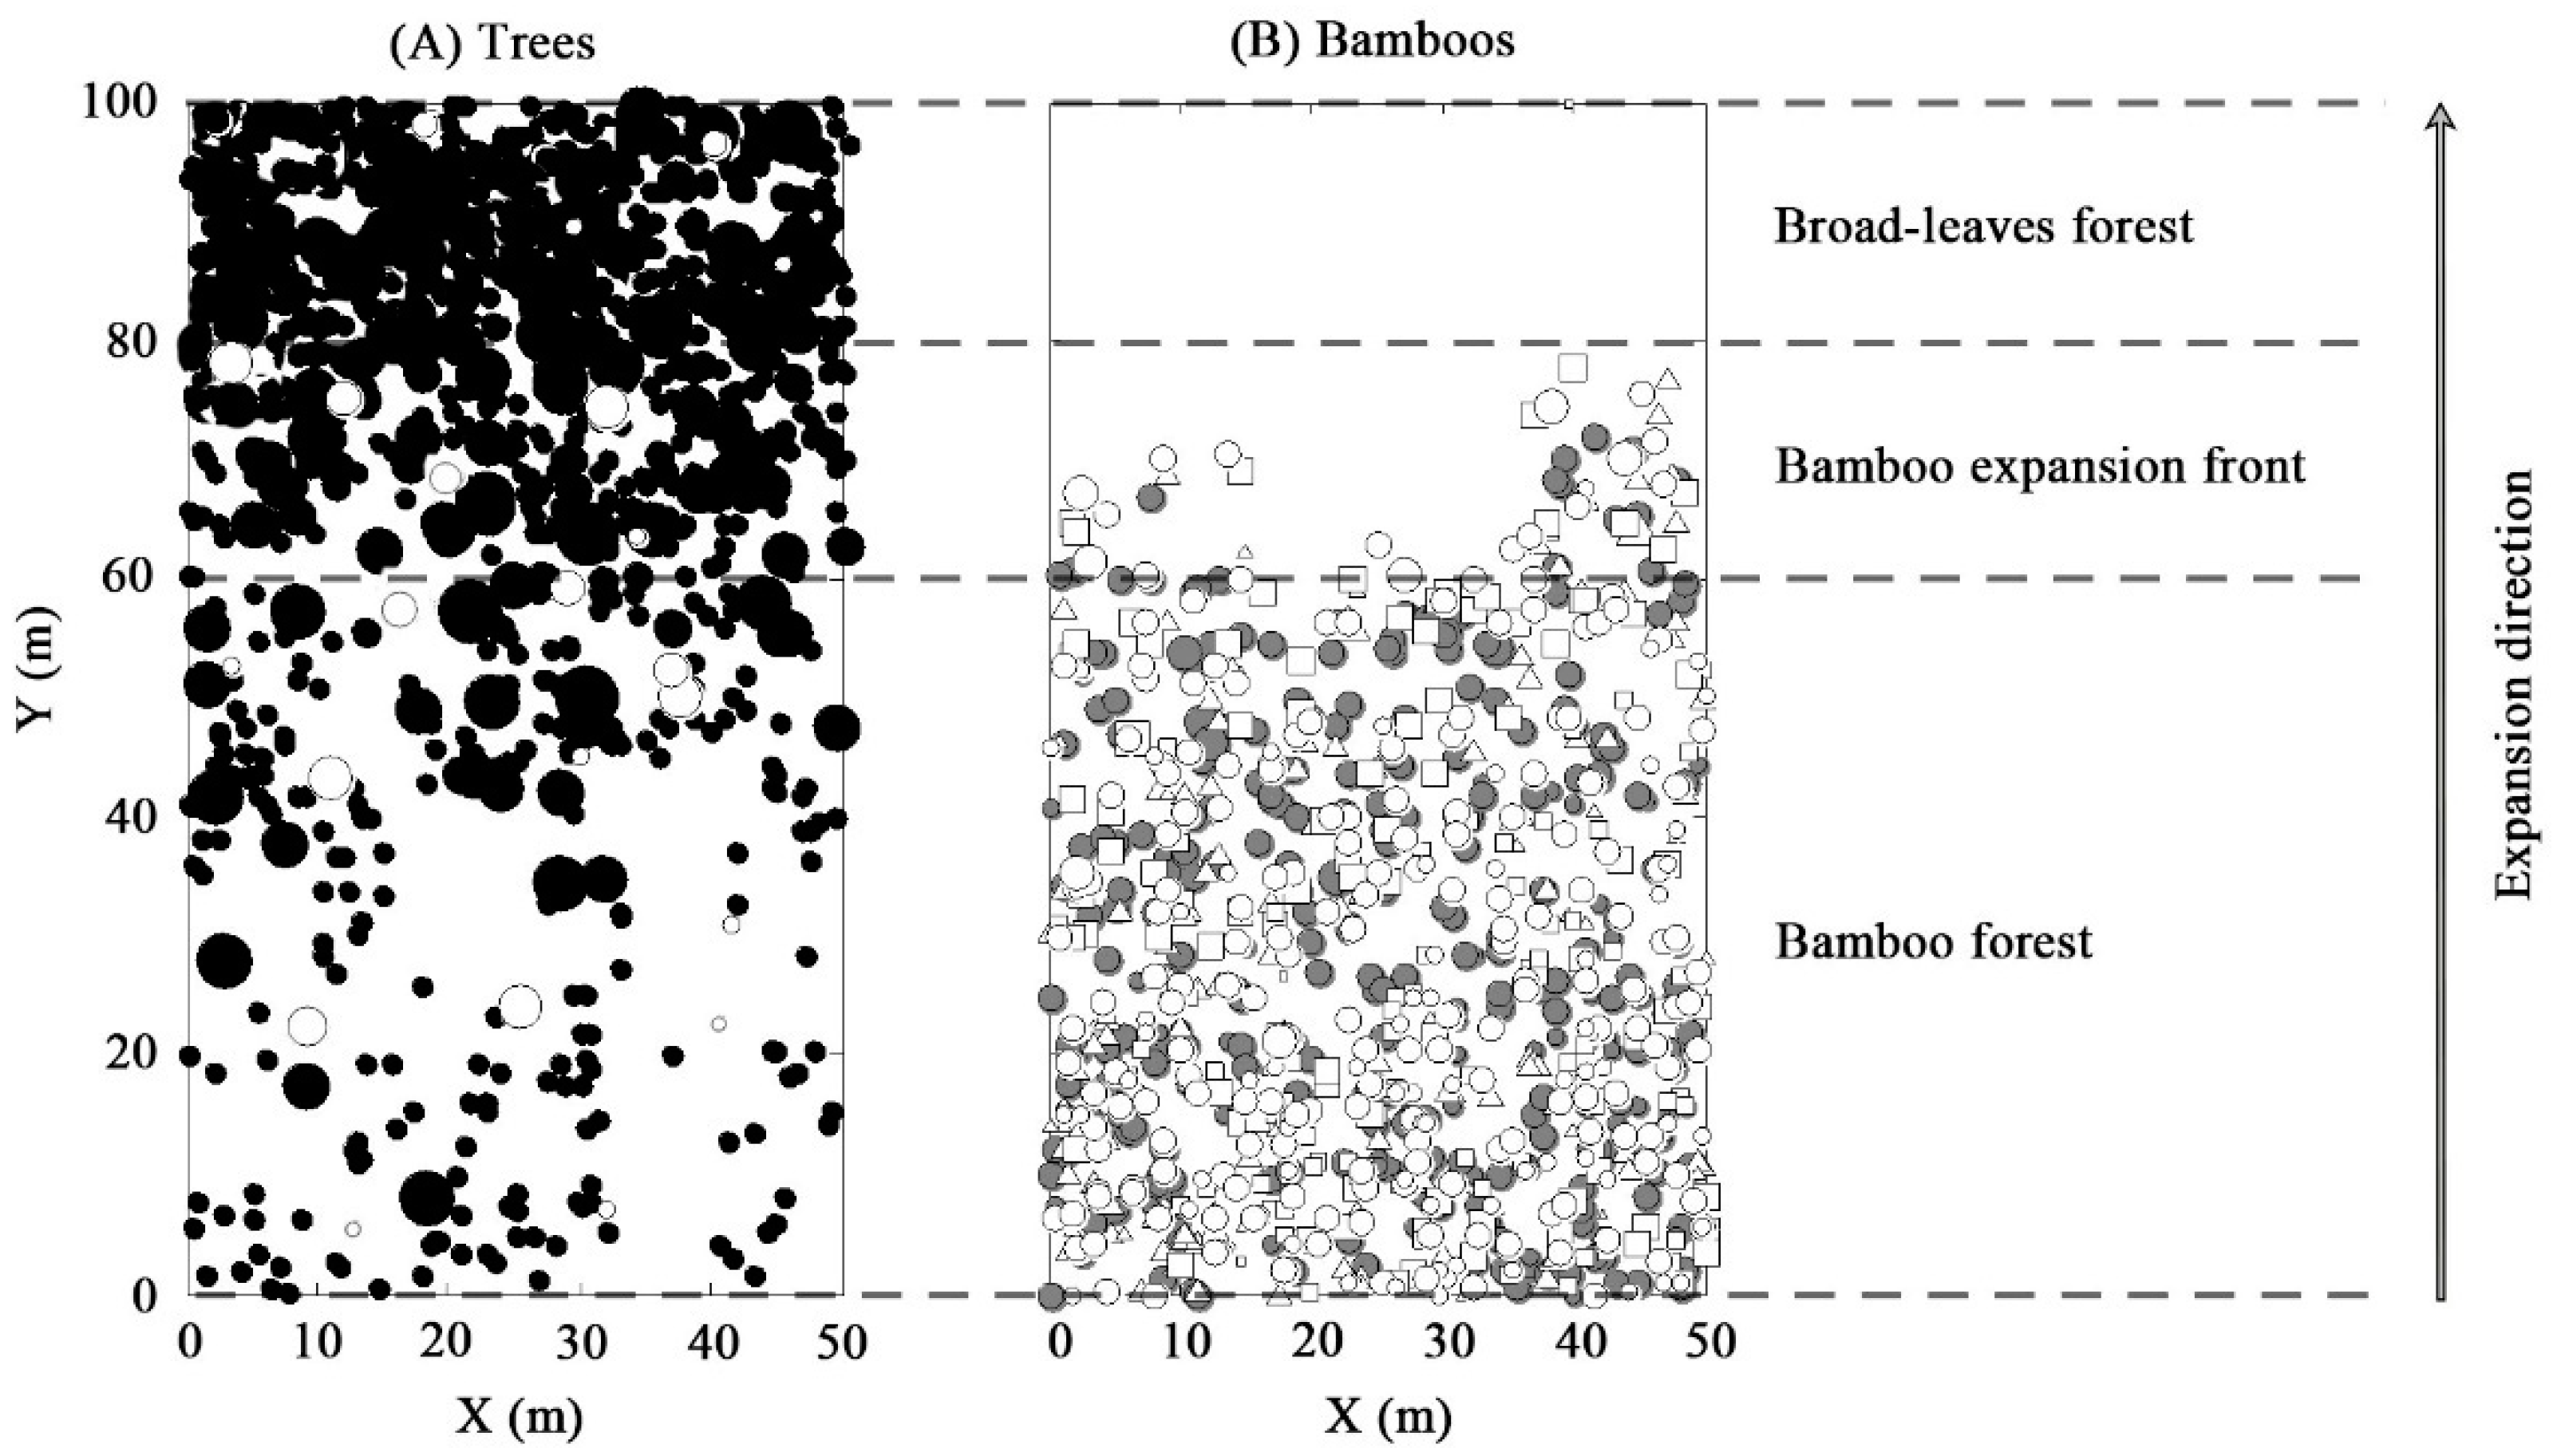
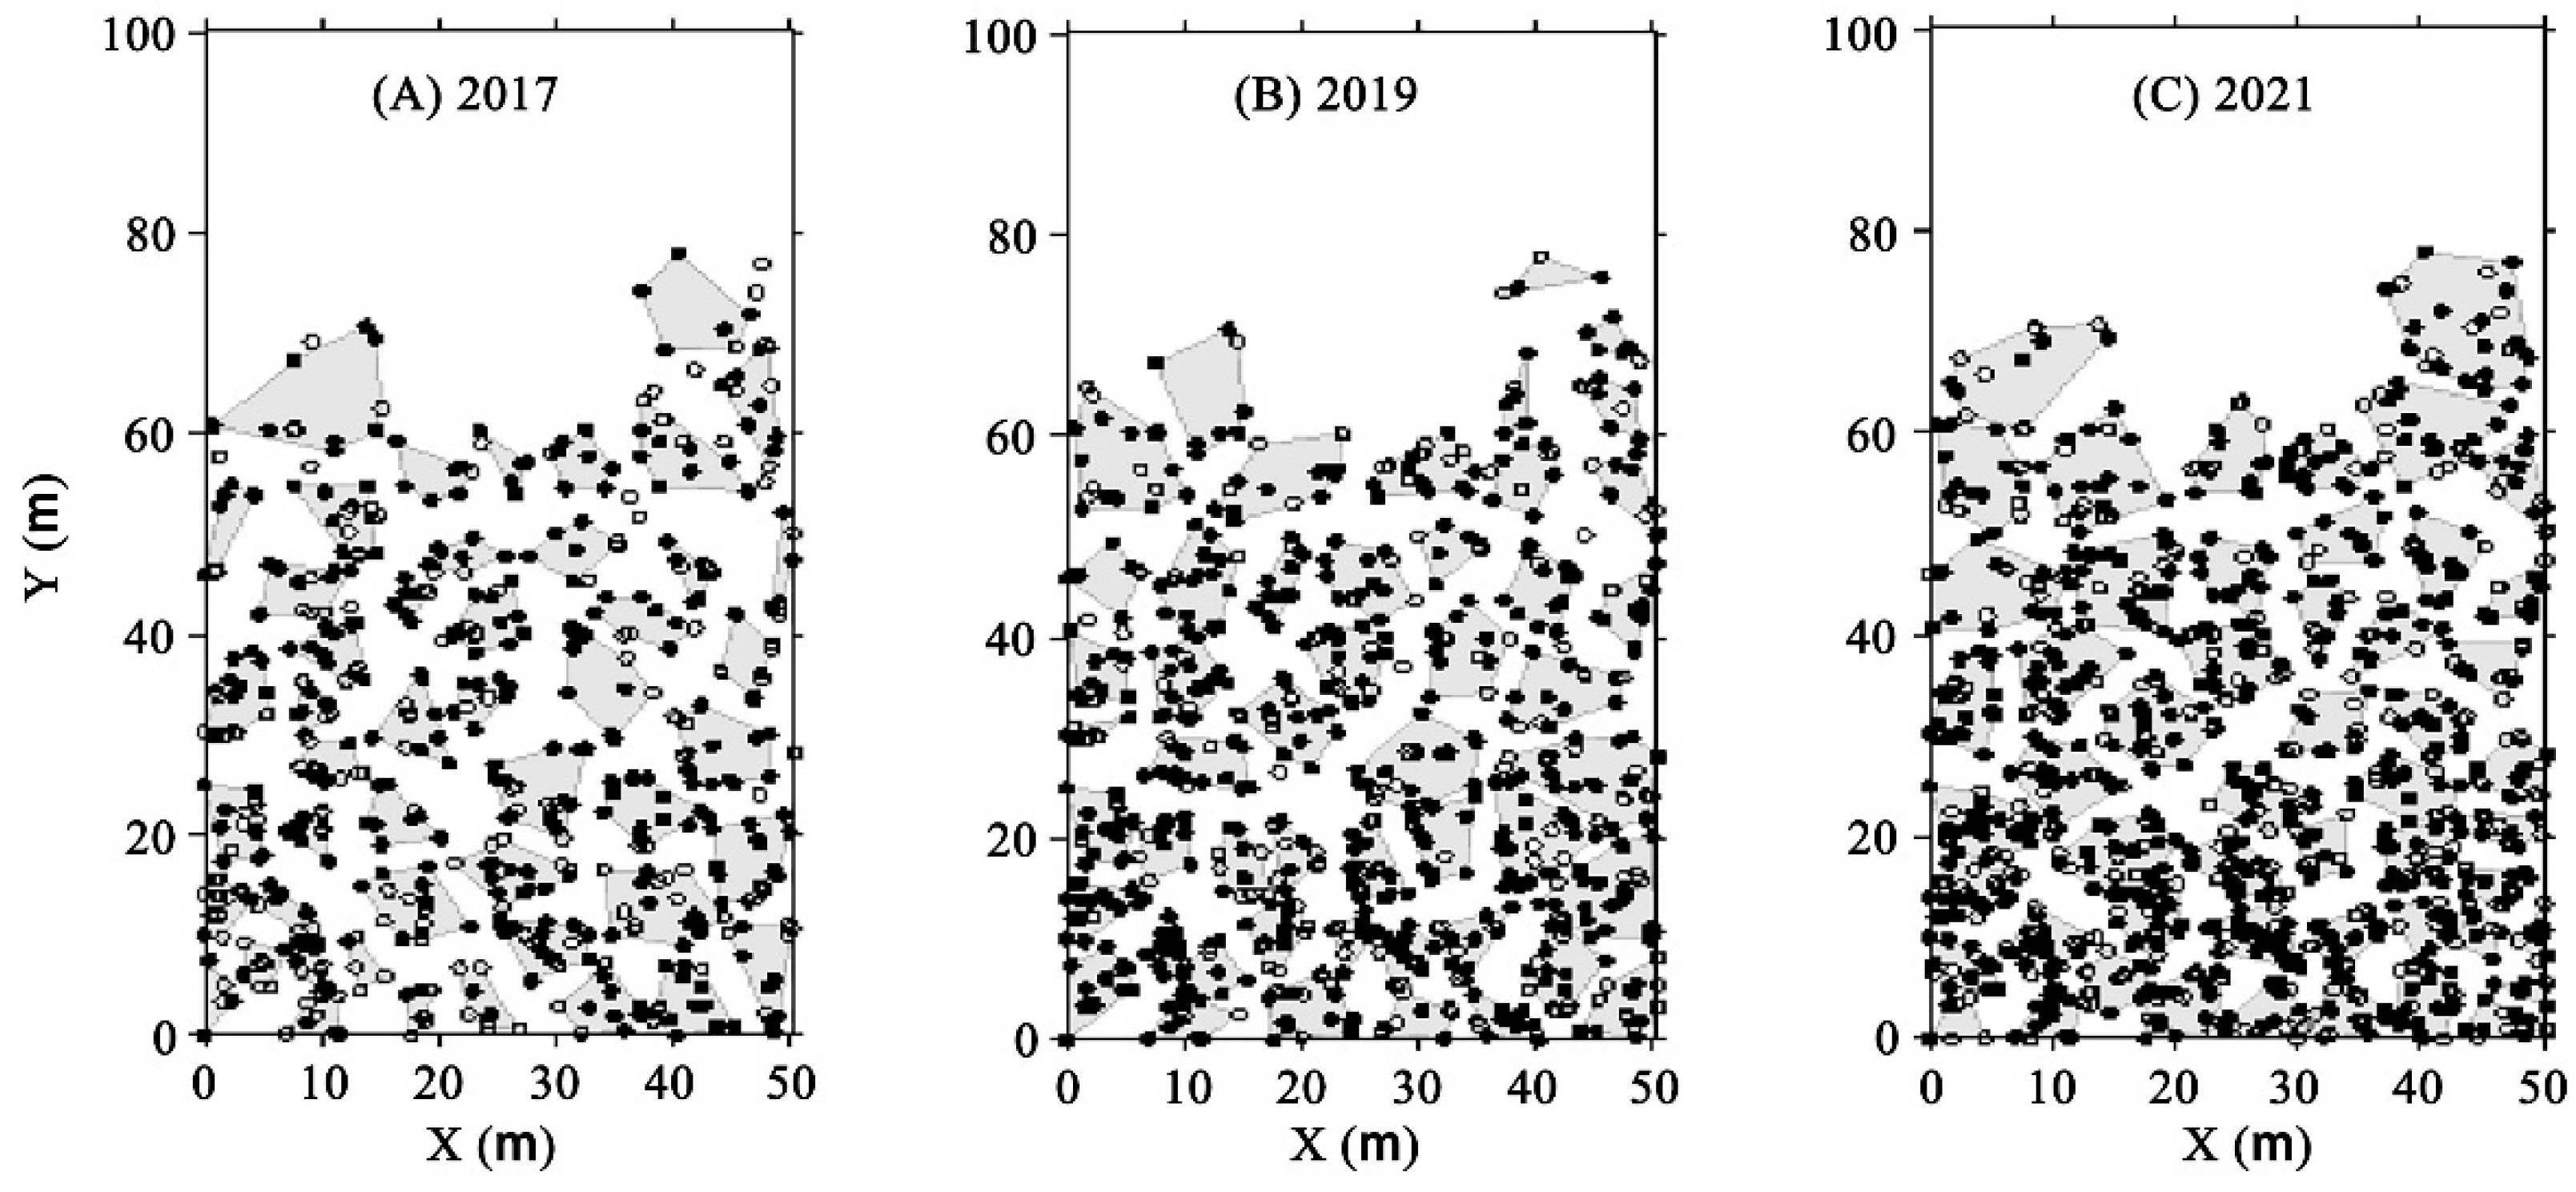
3.1. Spatial Distribution of Trees and Bamboo
3.2. Expansive Patch Parameters
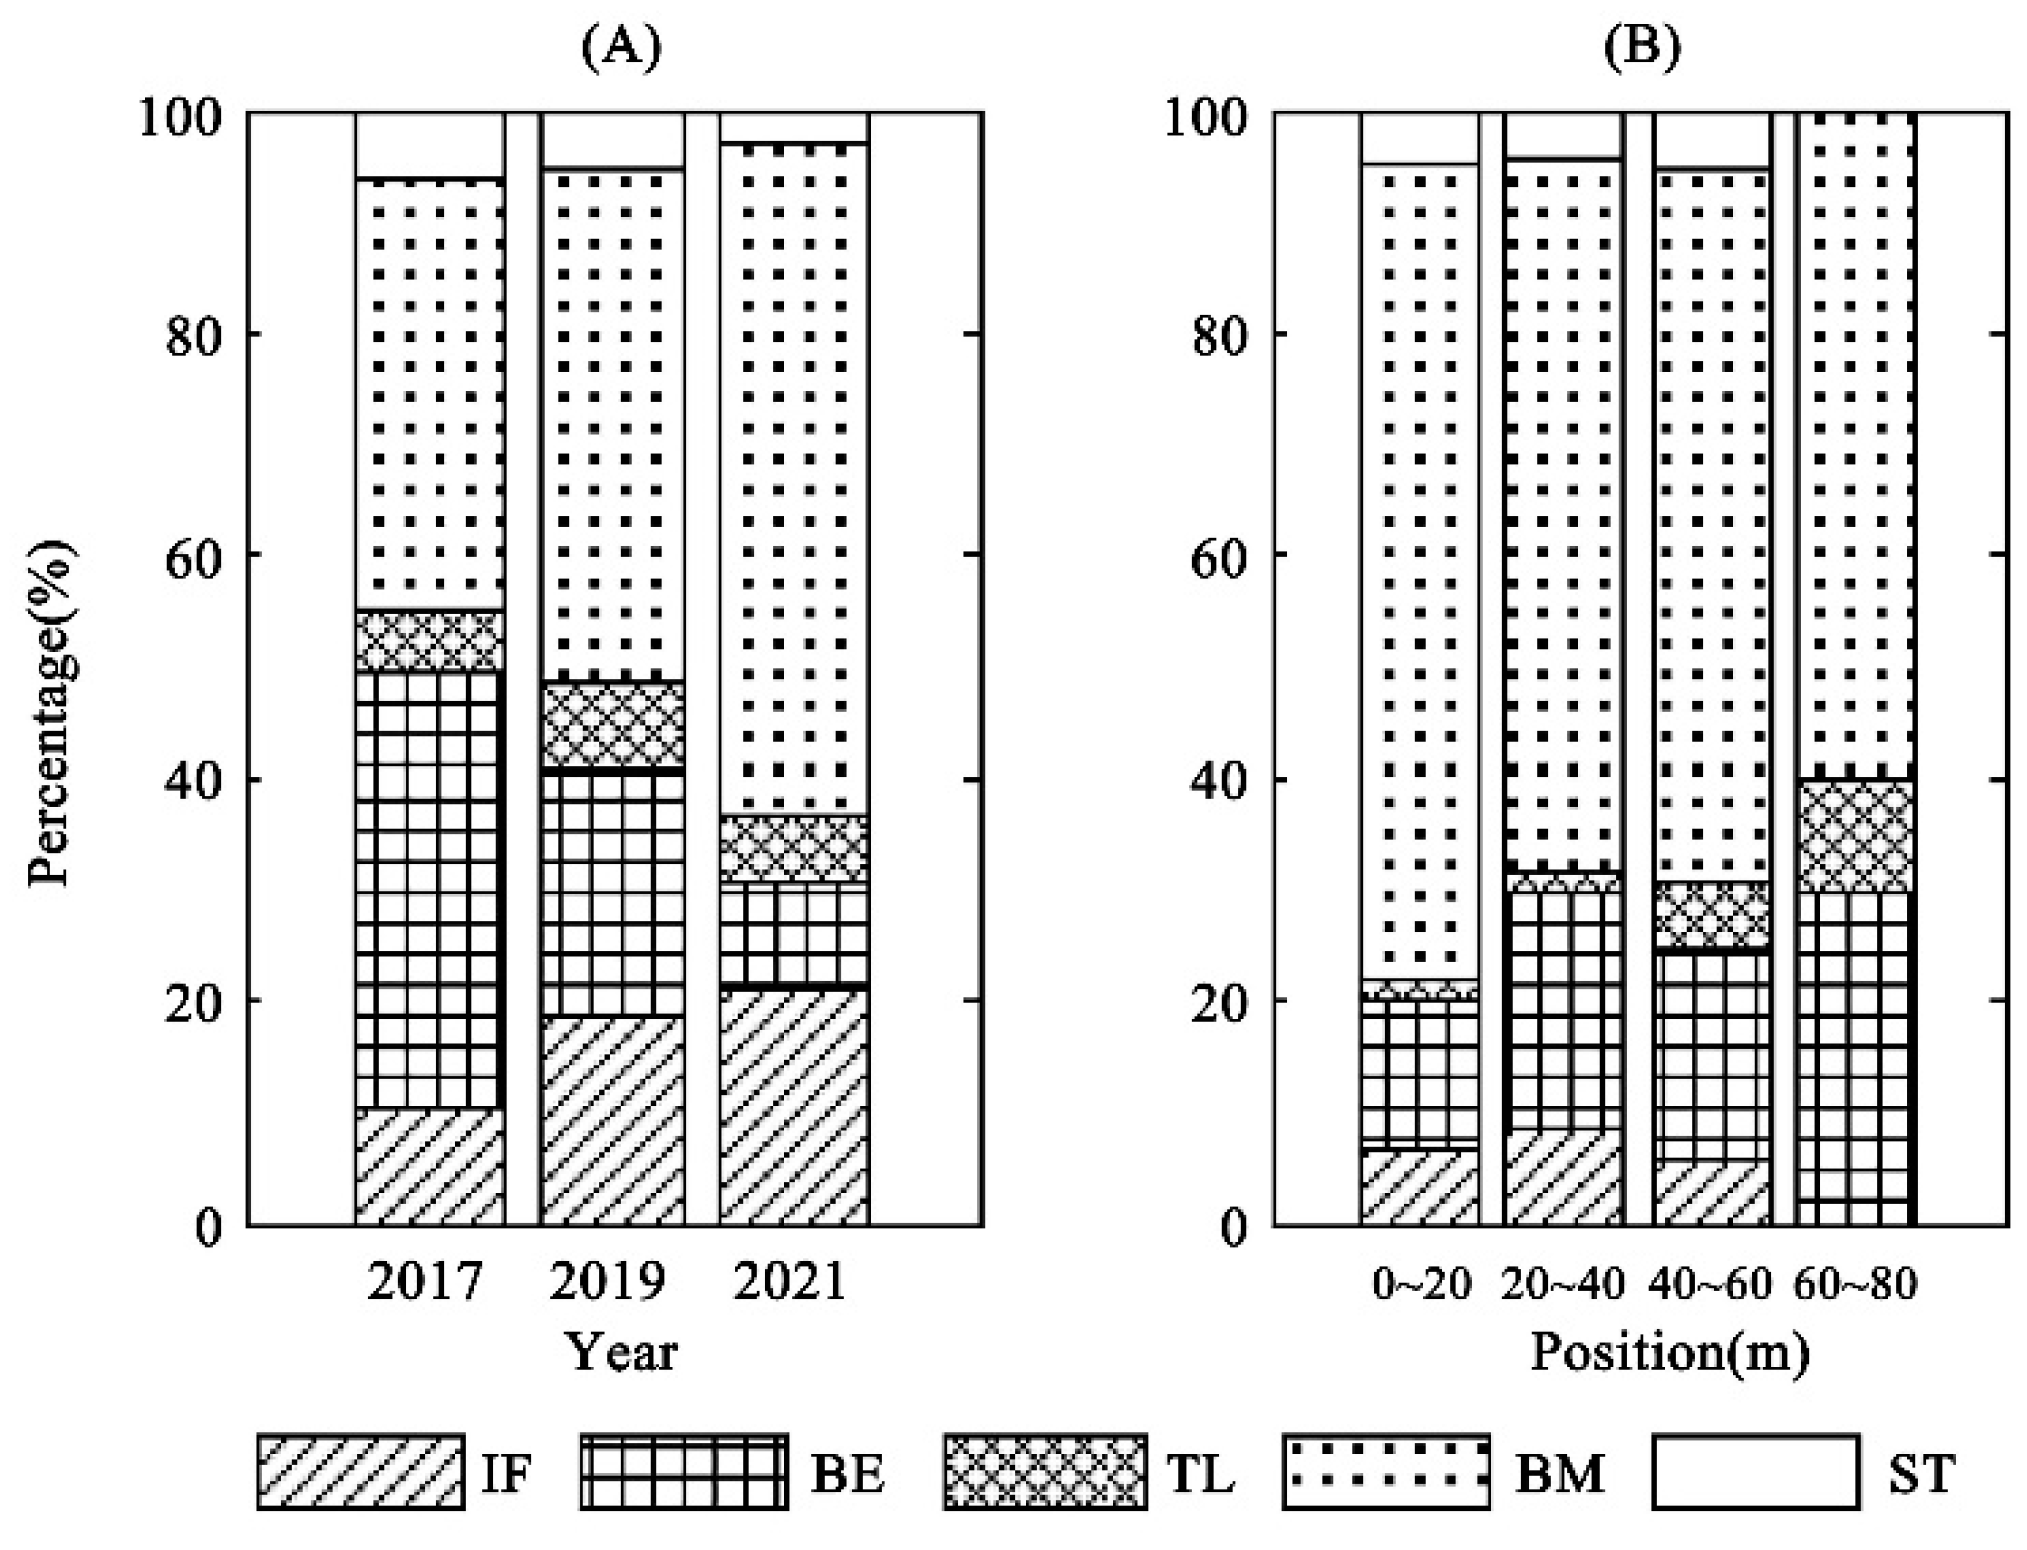
3.3. Changes in Expansion Patch Types
3.4. Expansion Indexes and Expansion Rates
3.5. The Relationship among the Variables for Bamboo Expansion Parameters
4. Discussion
5. Conclusions
Author Contributions
Funding
Data Availability Statement
Acknowledgments
Conflicts of Interest
References
- Zhang, L. Bamboo Expansion Into Adjacent Ecosystems. In Bamboo Expansion: Processes, Impacts, and Management; Springer: Berlin/Heidelberg, Germany, 2023; pp. 19–37. [Google Scholar]
- Bai, S.; Wang, Y.; Conant, R.T.; Zhou, G.; Xu, Y.; Wang, N.; Fang, F.; Chen, J. Can native clonal moso bamboo encroach on adjacent natural forest without human intervention? Sci. Rep. 2016, 6, 31504. [Google Scholar] [CrossRef]
- Lima, R.A.; Rother, D.C.; Muler, A.E.; Lepsch, I.F.; Rodrigues, R.R. Bamboo overabundance alters forest structure and dynamics in the Atlantic Forest hotspot. Biol. Conserv. 2012, 147, 32–39. [Google Scholar] [CrossRef]
- Buziquia, S.T.; Lopes, P.V.F.; Almeida, A.K.; de Almeida, I.K. Impacts of bamboo spreading: A review. Biodivers. Conserv. 2019, 28, 3695–3711. [Google Scholar] [CrossRef]
- Xu, Q.F.; Liang, C.F.; Chen, J.H.; Li, Y.C.; Qin, H.; Fuhrmann, J.J. Rapid bamboo invasion (expansion) and its effects on biodiversity and soil processes. Glob. Ecol. Conserv. 2020, 21, e00787. [Google Scholar] [CrossRef]
- Ying, W.; Jin, J.; Jiang, H.; Zhang, X.; Lu, X.; Chen, X.; Zhang, J. Satellite-based detection of bamboo expansion over the past 30 years in Mount Tianmushan, China. Int. J. Remote Sens. 2016, 37, 2908–2922. [Google Scholar] [CrossRef]
- Chen, X.; Chen, X.; Huang, S.; Fang, D. Impacts of Moso bamboo (Phyllostachys pubescens) invasion on species diversity and aboveground biomass of secondary coniferous and broad-leaved mixed forest. Front. Plant Sci. 2022, 13, 1001785. [Google Scholar] [CrossRef]
- Li, Y.; Feng, P. Analysis of Chinese bamboo resources based on the ninth national forest resources inventory. World Bamboo Ratt. 2019, 17, 45–48. [Google Scholar]
- Zhang, H.; Xue, J. Spatial pattern and competitive relationships of moso bamboo in a native subtropical rainforest community. Forests 2018, 9, 774. [Google Scholar] [CrossRef]
- Ouyang, M.; Tian, D.; Pan, J.; Chen, G.; Su, H.; Yan, Z.; Yang, Q.; Ji, C.; Tang, Z.; Fang, J. Moso bamboo (Phyllostachys edulis) invasion increases forest soil pH in subtropical China. Catena 2022, 215, 106339. [Google Scholar] [CrossRef]
- Shinohara, Y.; Otsuki, K. Comparisons of soil-water content between a Moso bamboo (Phyllostachys pubescens) forest and an evergreen broadleaved forest in western Japan. Plant Species Biol. 2015, 30, 96–103. [Google Scholar] [CrossRef]
- Song, Q.N.; Ouyang, M.; Yang, Q.P.; Lu, H.; Yang, G.Y.; Chen, F.S.; Shi, J.M. Degradation of litter quality and decline of soil nitrogen mineralization after moso bamboo (Phyllostachys pubscens) expansion to neighboring broadleaved forest in subtropical China. Plant Soil 2016, 404, 113–124. [Google Scholar] [CrossRef]
- Cai, X.; Lin, Z.; Penttinen, P.; Li, Y.; Li, Y.; Luo, Y.; Yue, T.; Jiang, P.; Fu, W. Effects of conversion from a natural evergreen broadleaf forest to a Moso bamboo plantation on the soil nutrient pools, microbial biomass and enzyme activities in a subtropical area. For. Ecol. Manag. 2018, 422, 161–171. [Google Scholar] [CrossRef]
- Yang, Q.P.; Yang, G.Y.; Song, Q.N.; Shi, J.M.; Ouyang, M.; Qi, H.Y.; Fang, X.M. Ecological studies on bamboo expansion: Process, consequence and mechanism. Chin. J. Plant Ecol. 2015, 39, 110–124. [Google Scholar]
- Mertens, B.; Hua, L.; Belcher, B.; Ruiz-Pérez, M.; Maoyi, F.; Xiaosheng, Y. Spatial patterns and processes of bamboo expansion in Southern China. Appl. Geogr. 2008, 28, 16–31. [Google Scholar] [CrossRef]
- Suzuki, S.; Nakagoshi, N. Expansion of bamboo forests caused by reduced bamboo-shoot harvest under different natural and artificial conditions. Ecol. Res. 2008, 23, 641–647. [Google Scholar] [CrossRef]
- Song, X.; Peng, C.; Zhou, G.; Gu, H.; Li, Q.; Zhang, C. Dynamic allocation and transfer of non-structural carbohydrates, a possible mechanism for the explosive growth of Moso bamboo (Phyllostachys heterocycla). Sci. Rep. 2016, 6, 25908. [Google Scholar] [CrossRef]
- Zou, G.; Wu, B.; Chen, B.; Yang, Y.; Feng, Y.; Huang, J.; Liu, Y.; Murray, P.J.; Liu, W. What Are the Effects of Moso Bamboo Expansion into Japanese Cedar on Arbuscular Mycorrhizal Fungi: Altering the Community Composition Rather than the Diversity. J. Fungi 2023, 9, 273. [Google Scholar] [CrossRef]
- Xiao, H.; Liu, J.; Li, F. Both alpha and beta diversity of nematode declines in response to moso bamboo expansion in south China. Appl. Soil Ecol. 2023, 183, 104761. [Google Scholar] [CrossRef]
- Okutomi, K.; Shinoda, S.; Fukuda, H. Causal analysis of the invasion of broad-leaved forest by bamboo in Japan. J. Veg. Sci. 1996, 7, 723–728. [Google Scholar] [CrossRef]
- Isagi, Y.; Torii, A. Range Expansion and Its Mechanisms in a Naturalized Bamboo Species, Phyllostachys pubescens, in Japan. J. Sustain. Forest. 1997, 6, 127–141. [Google Scholar] [CrossRef]
- Ding, L.X.; Wang, Z.L.; Zhou, G.M.; Du, Q.Z. Monitoring Phyllostachys pubescens stands expansion in National Nature Reserve of Mount Tianmu by remote sensing. J. Zhejiang A&F Univ. 2006, 23, 297–300. [Google Scholar]
- Xu, Q.F.; Liang, C.F.; Chen, J.H.; Li, Y.C.; Qin, H.; Fuhrmann, J.J. Retracted article: Running bamboo invasion in native and non-native regions worldwide. Biol. Invasions 2017, 19, 3459. [Google Scholar] [CrossRef]
- Lin, Y.T.; Tang, S.L.; Pai, C.W.; Whitman, W.B.; Coleman, D.C.; Chiu, C.Y. Changes in the soil bacterial communities in a cedar plantation invaded by moso bamboo. Microb. Ecol. 2014, 67, 421–429. [Google Scholar] [CrossRef]
- Ouyang, M.; Yang, Q.; Chen, X.; Yang, G.; Fang, X. Effects of the expansion of Phyllostachys edulis on species composition, structure and diversity of the secondary evergreen broad-leaved forests. Biodivers. Sci. 2016, 24, 649–657. [Google Scholar] [CrossRef]
- Liu, X.; Fang, P.; Xiong, Y.; Peng, Q.; Yu, Z.; Luan, F.; Song, Q.; Fang, X.; Yang, Q.; Liu, J. Assessment of the influence of bamboo expansion on Si pools and fluxes in a disturbed subtropical evergreen broadleaved forest. Catena 2022, 213, 106136. [Google Scholar] [CrossRef]
- Liu, J.; Yang, Q.P.; Song, Q.N.; Yu, D.K.; Yang, G.Y.; Qi, H.Y.; Shi, J.M. Strategy of fine root expansion of Phyllostachys pubescens population into evergreen broad-leaved forest. Chin. J. Plant Ecol. 2013, 37, 230. [Google Scholar] [CrossRef]
- Li, R.; Werger, M.J.A.; Kroon, H.D.; During, H.J.; Zhong, Z.C. Interactions Between Shoot Age Structure, Nutrient Availability and Physiological Integration in the Giant Bamboo Phyllostachys pubescens. Plant Biol. 2000, 2, 437–446. [Google Scholar] [CrossRef]
- Yu, F.H.; Dong, M.; Zhang, C.Y. Intraclonal resource sharing and functional specialization of ramets in response to resource heterogeneity in three stoloniferous herbs. Acta Bot. Sin. 2002, 44, 468. [Google Scholar]
- Liu, X.; Siemann, E.; Cui, C.; Liu, Y.; Guo, X.; Zhang, L. Moso bamboo (Phyllostachys edulis) invasion effects on litter, soil and microbial PLFA characteristics depend on sites and invaded forests. Plant Soil 2019, 438, 85–99. [Google Scholar] [CrossRef]
- Pan, J.; Liu, Y.; Niu, J.; Fang, H.; Feng, Y.; Bai, T.; Zhang, M.; Deng, W.; Siemann, E.; Zhang, L. Moso bamboo expansion reduced soil N2O emissions while accelerated fine root litter decomposition: Contrasting non-additive effects. Plant Soil 2022, 1–15. [Google Scholar] [CrossRef]
- Xu, D.W.; Liu, J.F.; He, Z.S.; Zheng, S.Q. Community species diversity after Phyllostachys edulis expansion to Cunninghamia lanceolata forest. J. For. Environ. 2019, 39, 37–41. [Google Scholar]
- Liu, X.M.; Guo, Y.R.; Liu, R.L. The Collection of Scientific Exploration of Jiangxi Qiyunshan Nature Reserve; China Forestry Publishing House: Beijing, China, 2010. [Google Scholar]
- Yi, T.P.; Shi, J.Y.; Ma, L.S.; Wang, H.T.; Yang, L. Iconographia Bambusoidearum Sinicarum; Science Press: Beijing, China, 2008. [Google Scholar]
- Dong, M.; Yu, F.H. Clonal Plant. In Clonal Plant Ecology; Science Press: Beijing, China, 2011; pp. 5–9. [Google Scholar]
- De, Y.D.; Sheng, L.H.; Lei, Y.X.; Jun, L.H.; Min, C.H.; Yun, L.Z.; Hua, T.T. Investigation and analysis of the mammal resources in Qiyunshan Nature Reserve, Jiangxi province. J. Cent. South Univ. For. Technol. 2009, 29, 45–50. [Google Scholar]
- Huang, X.F.; Tu, Y.G.; Zhang, T.; Chen, J.W.; Sun, Z.Y.; Lu, H.J.; Shan, J.H.; Wang, Z.R.; Huang, S.L. Investigation and diversity of birds in winter in Qiyunshan Nature Reserve, Jiangxi Province. Chin. J. Zool. 2008, 43, 86–94. [Google Scholar]
- Chen, Y.L.; Lin, Y.L.; Su, M.S.; Zhang, L.P.; Zhang, Y.; Chen, H.M. Flora of Macrofungal in Qiyun Mountain National Nature Reserve of Jiangxi. J. Fungal Res. 2019, 17, 26–34. [Google Scholar]
- Kazapoe, R.W.; Amuah, E.E.Y.; Dankwa, P.; Ibrahim, K.; Mville, B.N.; Abubakari, S.; Bawa, N. Compositional and source patterns of potentially toxic elements (PTEs) in soils in southwestern Ghana using robust compositional contamination index (RCCI) and k-means cluster analysis. Environ. Chall. 2021, 5, 100248. [Google Scholar] [CrossRef]
- Xu, H.; Croot, P.; Zhang, C. Discovering hidden spatial patterns and their associations with controlling factors for potentially toxic elements in topsoil using hot spot analysis and K-means clustering analysis. Environ. Int. 2021, 151, 106456. [Google Scholar] [CrossRef] [PubMed]
- Zhou, X.; Zhou, Y.; Zhang, X.; Sharma, R.P.; Guan, F.; Fan, S.; Liu, G. Two-level mixed-effects height to crown base model for moso bamboo (Phyllostachys edulis) in Eastern China. Front. Plant Sci. 2023, 14, 1095126. [Google Scholar] [CrossRef]
- Chau, A.L.; Li, X.; Yu, W. Convex and concave hulls for classification with support vector machine. Neurocomputing 2013, 122, 198–209. [Google Scholar] [CrossRef]
- Fei, B. Economic value and research significance of Moso bamboo. In The Moso Bamboo Genome; Springer: Berlin/Heidelberg, Germany, 2021; pp. 1–12. [Google Scholar]
- Liu, W.; Hui, C.; Wang, F.; Wang, M.; Liu, G. Review of the Resources and Utilization of Bamboo in China. In Bamboo-Current and Future Prospects; IntechOpen: London, UK, 2018; pp. 133–142. [Google Scholar]
- Liu, W.; Liao, L.; Liu, Y.; Wang, Q.; Murray, P.J.; Jiang, X.; Zou, G.; Cai, J.; Zhao, X. Effects of Phyllostachys pubescens expansion on underground soil fauna community and soil food web in a Cryptomeria japonica plantation, Lushan Mountain, subtropical China. J. Soils Sediments 2021, 21, 2212–2227. [Google Scholar] [CrossRef]
- Qiu, J.X.; Tang, M.P.; Lou, M.H.; Shen, L.F.; Zou, Y.Q. Analysis of Phyllostachys edulis stand spatial structure and competition based on an improved Hegyi model. Acta Ecol. Sin. 2016, 36, 1058–1065. [Google Scholar]
- Sandhu, H.; Shi, P.; Yang, Q. Intraspecific spatial niche differentiation: Evidence from Phyllostachys edulis. Acta Ecol. Sin. 2013, 33, 287–292. [Google Scholar] [CrossRef]
- Dong, M. Clonal Plant Ecology; Science Press: Beijing, China, 2011. [Google Scholar]
- Pitelka, L.F. Application of the-3/2 power law to clonal herbs. Am. Nat. 1984, 123, 442–449. [Google Scholar] [CrossRef]
- Ye, X.H.; Yu, F.H.; Dong, M. A trade-off between guerrilla and phalanx growth forms in Leymus secalinus under different nutrient supplies. Annals of Botany 2006, 98, 187–191. [Google Scholar] [CrossRef]
- Chen, X.S.; Xie, Y.H.; Deng, Z.M.; Li, F.; Hou, Z.Y. A change from phalanx to guerrilla growth form is an effective strategy to acclimate to sedimentation in a wetland sedge species Carex brevicuspis (Cyperaceae). Flora 2011, 206, 347–350. [Google Scholar] [CrossRef]
- Kitajima, K. Relative importance of photosynthetic traits and allocation patterns as correlates of seedling shade tolerance of 13 tropical trees. Oecologia 1994, 98, 419–428. [Google Scholar] [CrossRef]
- Llambí, L.; Fontaine, M.; Rada, F.; Saugier, B.; Sarmiento, L. Ecophysiology of dominant plant species during old-field succession in a high tropical Andean ecosystem. Arct. Antarct. Alp. Res. 2003, 35, 447–453. [Google Scholar] [CrossRef]
- Zheng, A.; Lv, J. Spatial patterns of bamboo expansion across scales: How does Moso bamboo interact with competing trees? Landsc. Ecol. 2023, 38, 3925–3943. [Google Scholar] [CrossRef]

| Indexes of Patches | 2017 | 2019 | 2021 |
|---|---|---|---|
| Number of patches (ind.) | 48 | 49 | 52 |
| Total area of patches (m2) | 1145.28 | 1600.32 | 1761.24 |
| Area of maximum patches (m2) | 68.82 | 66.24 | 132.81 |
| Mean area of patches (m2) | 23.86 ± 11.58 b | 32.71 ± 17.26 a | 33.87 ± 20.80 a |
| Expansion rates (%) | 15.89 | 18.21 | 4.91 |
| Index of maximum patches (%) | 6.01 | 4.14 | 7.55 |
| Indexes | 2017 | 2019 | 2021 |
|---|---|---|---|
| Perimeter of patches (m) | 19.90 ± 4.50 b | 22.10 ± 6.05 ab | 22.74 ± 5.74 a |
| Culm number per patch (ind./patch) | 10.44 ± 3.12 c | 15.76 ± 5.19 b | 18.17 ± 5.14 a |
| Culm density(ind./m2) | 0.54 ± 0.30 a | 0.63 ± 0.35 a | 0.73 ± 0.79 a |
| Mean expansion distance (m) | 3.89 ± 0.86 a | 3.92 ± 1.02 a | 3.97 ± 0.98 a |
| Shape index (SI) | 1.21 ± 0.14 a | 1.14 ± 0.06 a | 1.21 ± 0.55 a |
| Elongation index (G) | 4.28 ± 0.51 a | 4.05 ± 0.22 a | 4.29 ± 1.96 a |
| Fractal dimension (FD) | 1.05 ± 0.07 a | 1.01 ± 0.05 b | 1.01 ± 0.05 b |
| Type | Position (m) | 2017 | 2019 | 2021 | Average |
|---|---|---|---|---|---|
| Expansion index | 0~20 | −0.18 ± 0.36 Ba | −0.37 ± 0.30 Bb | −0.39 ± 0.20 Bb | −0.32 ± 0.30 B |
| 20~40 | −0.35 ± 0.27 Cb | −0.09 ± 0.31 Aa | −0.43 ± 0.15 Bc | −0.27 ± 0.30 B | |
| 40~60 | −0.35 ± 0.37 Cb | −0.12 ± 0.24 Aa | −0.44 ± 0.12 Bc | −0.30 ± 0.29 B | |
| 60~80 | 0.17 ± 0.23 Aa | −0.12 ± 0.01 Ab | −0.28 ± 0.24 Ac | −0.10 ± 0.26 A | |
| Average | −0.25 ± 0.35 a | −0.21 ± 0.31 a | −0.40 ± 0.17 b | −0.29 ± 0.29 | |
| Expansion rate | 0~20 | 1.44 ± 0.43 Ba | 1.16 ± 0.50 Bab | 0.91 ± 0.33 Bb | 1.15 ± 0.47 B |
| (m/2a) | 20~40 | 1.47 ± 0.97 Ba | 1.64 ± 0.47 ABa | 0.92 ± 0.28 Bb | 1.37 ± 0.70 AB |
| 40~60 | 1.74 ± 0.80 ABa | 1.55 ± 0.56 ABb | 1.13 ± 0.34 ABc | 1.46 ± 0.63 AB | |
| 60~80 | 2.11 ± 2.98 Aa | 2.04 ± 0.47 Aa | 1.64 ± 0.34 Ab | 1.89 ± 1.27 A | |
| Average | 1.55 ± 0.83 a | 1.44 ± 0.55 a | 1.01 ± 0.36 b | 1.32 ± 0.64 |
| Variables | YE | X | Y | TCN | NMCs | NNCs | A | DNCs | TD | EI | MXED |
|---|---|---|---|---|---|---|---|---|---|---|---|
| X | 0.07 | ||||||||||
| Y | −0.01 | 0.04 | |||||||||
| TCN | 0.58 ** | −0.06 | 0.00 | ||||||||
| NMC | 0.56 ** | −0.07 | −0.04 | 0.92 ** | |||||||
| NNC | 0.27 ** | 0.00 | 0.07 | 0.59 ** | 0.23 ** | ||||||
| A | 0.20 * | 0.07 | 0.59 ** | 0.43 ** | 0.36 ** | 0.34 ** | |||||
| DNC | −0.06 | −0.14 | −0.43 ** | −0.19 | −0.36 ** | 0.28 ** | −0.56 ** | ||||
| TD | 0.27 ** | −0.09 | −0.58 ** | 0.06 | 0.25 ** | −0.36 ** | −0.56 ** | 0.25 ** | |||
| EI | −0.21 ** | 0.00 | 0.11 | −0.25 ** | −0.58 ** | 0.59 ** | −0.02 | 0.57 ** | −0.51 ** | ||
| MXED | −0.25 ** | 0.07 | 0.31 ** | −0.20 | −0.40 ** | 0.32 ** | 0.19 * | 0.13 | −0.55 ** | 0.64 ** | |
| MED | −0.35 ** | 0.02 | 0.28 ** | −0.39 ** | −0.49 ** | 0.03 | 0.09 | 0.03 | −0.49 ** | 0.49 ** | 0.81 ** |
Disclaimer/Publisher’s Note: The statements, opinions and data contained in all publications are solely those of the individual author(s) and contributor(s) and not of MDPI and/or the editor(s). MDPI and/or the editor(s) disclaim responsibility for any injury to people or property resulting from any ideas, methods, instructions or products referred to in the content. |
© 2024 by the authors. Licensee MDPI, Basel, Switzerland. This article is an open access article distributed under the terms and conditions of the Creative Commons Attribution (CC BY) license (https://creativecommons.org/licenses/by/4.0/).
Share and Cite
Zeng, X.; Luo, H.; Lu, J.; Zhu, X.; He, Y.; Gong, C.; Ren, Z.; Huang, D.; Song, Q.; Yang, Q. The Process of Patchy Expansion for Bamboo (Phyllostachys edulis) at the Bamboo–Broadleaf Forest Interface: Spreading and Filling in Order. Forests 2024, 15, 438. https://doi.org/10.3390/f15030438
Zeng X, Luo H, Lu J, Zhu X, He Y, Gong C, Ren Z, Huang D, Song Q, Yang Q. The Process of Patchy Expansion for Bamboo (Phyllostachys edulis) at the Bamboo–Broadleaf Forest Interface: Spreading and Filling in Order. Forests. 2024; 15(3):438. https://doi.org/10.3390/f15030438
Chicago/Turabian StyleZeng, Xiaoxia, Huitan Luo, Jian Lu, Xianglong Zhu, Yaoli He, Chao Gong, Zewen Ren, Dongmei Huang, Qingni Song, and Qingpei Yang. 2024. "The Process of Patchy Expansion for Bamboo (Phyllostachys edulis) at the Bamboo–Broadleaf Forest Interface: Spreading and Filling in Order" Forests 15, no. 3: 438. https://doi.org/10.3390/f15030438
APA StyleZeng, X., Luo, H., Lu, J., Zhu, X., He, Y., Gong, C., Ren, Z., Huang, D., Song, Q., & Yang, Q. (2024). The Process of Patchy Expansion for Bamboo (Phyllostachys edulis) at the Bamboo–Broadleaf Forest Interface: Spreading and Filling in Order. Forests, 15(3), 438. https://doi.org/10.3390/f15030438