Article

Comparative Analysis of Water Isotopic Compositions: Evaluating Isotope Analyzer for Soil and Extraction Method for Stem Water

1
Department of Agriculture, Forestry and Bioresources, Seoul National University, Seoul 08826, Republic of Korea
2
Interdisciplinary Program in Agricultural and Forest Meteorology, Seoul National University, Seoul 08826, Republic of Korea
3
Division of Forest Ecology, National Institute of Forest Science, Seoul 02455, Republic of Korea
4
Research Institute of Agriculture and Life Sciences, Seoul National University, Seoul 08826, Republic of Korea
*
Author to whom correspondence should be addressed.
Forests 2024, 15(3), 420; https://doi.org/10.3390/f15030420
Submission received: 4 January 2024 / Revised: 11 February 2024 / Accepted: 21 February 2024 / Published: 22 February 2024
(This article belongs to the Section Forest Ecology and Management)

Abstract

:
Stable isotopes of water (δ2H and δ18O) are reliable tracers for the investigation of plant–soil–water interactions in forest ecosystems. However, variations in isotopic compositions may arise due to differences in analytical instruments and water extraction methods. In this study, we conducted three different experiments to identify isotopic differences caused by analytical and methodological variations. First, we analyzed soil water by using the two most commonly applied methods: isotope ratio mass spectrometry (IRMS) and cavity ring-down spectroscopy (CRDS). Second, we compared the isotopes in xylem water extracted from the stems of nine tree species using cryogenic vacuum distillation (CVD) with different heating times. Third, we compared the compositions in xylem water extracted with three different methods: mechanical squeezing using a pressure chamber (PC), an induction module (IM), and CVD. The differences in isotopic composition between IRMS and CRDS were significant but minimal. Soil properties were not significant factors contributing to differences between the two instruments. For the xylem water extraction with CVD, each of the nine tree species required heating for more than three hours. Significant differences were observed in δ2H among the three extraction methods for xylem water. Xylem water extracted by CVD showed more depleted values compared to those obtained by PC and IM. Our results highlight the importance of considering analytical and methodological variations in stable isotope analysis.

1. Introduction

Water-stable isotopes (δ2H and δ18O) have been widely used as tracers to investigate plant–soil–water interactions [1,2,3,4,5]. Traditionally, isotope ratio mass spectrometry (IRMS) was used to measure the water isotope compositions of soils and plants (e.g., branches, leaves, and roots). The recently introduced isotope ratio infrared spectroscopy (IRIS), unlike IRMS, allows researchers to investigate water dynamics easily because of the direct measurement of the water isotopic composition, without prior chemical equilibration or conversion [3,6,7,8]. IRIS methods such as cavity ring-down spectroscopy (CRDS) have additional advantages such as comparatively low costs, portability, and ease of use [6,7,8]. CRDS has stimulated the application of stable isotope measurements in natural ecosystems due to its comparability with IRMS, especially for water samples that are uncontaminated by organic materials (e.g., partitioned evapotranspiration in forests) [6,8,9]. Despite the rapid increase in research studies using CRDS, it remains unclear whether this is a reliable tool for the investigation of soil water because of the presence of organic compounds such as ethanol and methanol [8,10,11,12,13]. Therefore, it is necessary to compare the performance of IRMS and CRDS to assess whether CRDS can be applied to investigate the isotopic composition of soil water.
In addition to the discrepancies between CRDS and IRMS, water extraction methods for soil and plants are critical for the use of water-stable isotopes for tracer analysis. To investigate plant water sources, ecophysiological studies relying on the isotopic signatures of soil and plant water require extraction methods that do not alter their original values [7,14,15,16,17]. Extraction methods can be categorized as laboratory-based or field-based. Laboratory-based methods include cryogenic vacuum distillation (CVD), centrifugation, mechanical squeezing, direct vapor equilibrium, microwave extraction, and the induction module (IM) [11,14,18,19,20]. The most common field-based extraction methods for soil water use lysimeters with suction cups, suction plates, and capillary wicks because of their low cost, ease of installation, and lack of soil disturbance after installation [21]. In the laboratory, CVD methods have been extensively used to extract water from soil [22,23] and are also commonly used for stem water extraction [24,25,26]. However, CVD has several limitations, partly due to its use of disturbed soil and plant samples and the differences in extraction conditions, which can lead to high variability in isotopic measurements. Moreover, recent studies have revealed that stem water obtained through CVD shows substantial 2H fractionation, potentially complicating interpretations of water uptake patterns in tree species [23,27,28,29]. However, why this deuterium offset in CVD-extracted water is observed is still a subject of debate.
Although CVD is commonly used for stem water, a pressure chamber (PC) and IM could be better alternatives due to their simpler and faster sample processing. Therefore, it is essential to evaluate their accuracy in δ2H and δ18O measurements and their compatibility with CVD. IM measures the isotope compositions of solid samples without additional water extraction processes, as CVD does, and provides values within 10 min. PC, which measures the leaf or stem water potential, can be applied to extract stem water rapidly and easily because xylem water appears within a few minutes. However, it is rarely used to collect xylem water samples and has been compared with other extraction methods. Recently, Zuecco et al. (2022) compared the isotopic compositions (δ18O and δ2H) of stem water extracted with PC and CVD from four plant species: alder, apple, chestnut, and beech [30]. The isotopic differences between the two methods varied depending on the tree species, with beech, especially twigs without bark, showing smaller differences than the other species. The isotopic compositions of water extracted from alder, apple, and chestnut with PC were more enriched in δ2H and δ18O than samples obtained with CVD. Similarly, water extracted using the PC method from eight conifer species (Pinus contorta, Picea engelmannia, Abies laziocarpa, Picea pungens, Abies concolor, Pinus ponderosa, Passiflora edulis, and Juniperus scopulorum) showed more enriched isotope values than those extracted with CVD [25]. However, it is still unclear which stem water extraction method is appropriate for the investigation of plant–soil–water interactions, and there is no conversion equation among the different methods. Therefore, it is necessary to compare the three extraction methods for simple and fast sample processing with guaranteed accuracy in the isotopic composition.
To date, most studies have adopted water-stable isotopes to investigate the water uptake process in forests, without considering the isotopic variations caused by the use of analytical and xylem water extraction methods. In this regard, it is necessary to identify isotopic differences related to the analytical instruments and extraction methods for more accurate data interpretation. Therefore, the objectives of our study were (1) to evaluate the precision of soil water analysis using two common isotope analyzers and (2) to assess three extraction methods mostly used for xylem water. First, we compared the isotopic compositions (δ2H and δ18O) of soil water extracted using suction cups with two different isotopic analyzers (CRDS and IRMS). Second, we compared the isotopic compositions of stem water extracted with CVD depending on the heating time for nine different tree species. Third, we compared the three methods (CVD, PC, and IM) in terms of their ability to extract xylem water.

2. Materials and Methods

2.1. Study Sites and Sample Collection

The study sites were established in a temperate forest on Mt. Baekwoon in the southern region of the Republic of Korea (Figure 1). Mt. Baekwoon is part of a long-term ecological monitoring site in the Seoul National University Forest. Three different vegetation types were selected for study plots based on a previous vegetation survey. The coniferous stand (N 35°02′20.7″ E 127°38′42.4″, 523 masl) was dominated by Pinus densiflora (P. densiflora) and Chamaecyparis obtusa (C. obtusa) with Styrax obassia (S. obassia). The mixed stand (N 35°06′07.7″ E 127°32′02.2″, 690 masl) consisted of P. densiflora, Carpinus laxiflora (C. laxiflora), Quercus mongolica (Q. mongolica), Fraxinus rhynchophylla (F. rhynchophylla), and S. obassia. The broadleaved stand (N 35°06′13.9″ E 127°36′10.0″, 595 masl) comprised C. laxiflora, Quercus serrata (Q. serrata), Quercus acutissima (Q. acutissima), Zelkova serrata (Z. serrata), and S. obassia. Five individual trees per species were selected at each study site. The mean annual temperature was 12.1 °C, and the mean annual precipitation was 1986 mm during the study period (2016–2018).
To compare the differences in soil water isotope composition between CRDS and IRMS, 25 soil water samples were collected at five depths (10, 30, 50, 100, and 120 cm) from five different points in the mixed stand during the spring of 2017 (March to April).
To investigate the heating time for the CVD method, 36 stem samples with a diameter ranging from 6 to 8 mm were collected from nine tree species at the three sites (mixed, coniferous, and broadleaf stands) from July 2016 to October 2018: P. densiflora, C. laxiflora, Q. mongolica, F. rhynchophylla, S. obassia, C. obtusa, Q. serrata, Q. acutissima, and Z. serrata (n = 4 for each).
To compare the water isotope compositions obtained via the stem water extraction method between CVD, PC, and IM, 28 stem samples with diameters ranging from 6 to 8 mm were collected from two different sites (coniferous and mixed stands) between 2016 and 2018. (Table 1). Because the amount of water extracted from one stem was insufficient to obtain three separate samples, several nearby stems from the same trees were sampled for method intercomparison. Stem samples for CVD were collected from 28 stems of P. densiflora (n = 9), C. laxiflora (n = 3), C. obtusa (n = 12), and S. obassia (n = 4). Twelve stem samples were collected for the PC method from P. densiflora (n = 3), C. laxiflora (n = 3), C. obtusa (n = 4), and S. obassia (n = 2). Sixteen stems were selected for IM analysis from P. densiflora (n = 6), C. obtusa (n = 8), and S. obassia (n = 2).

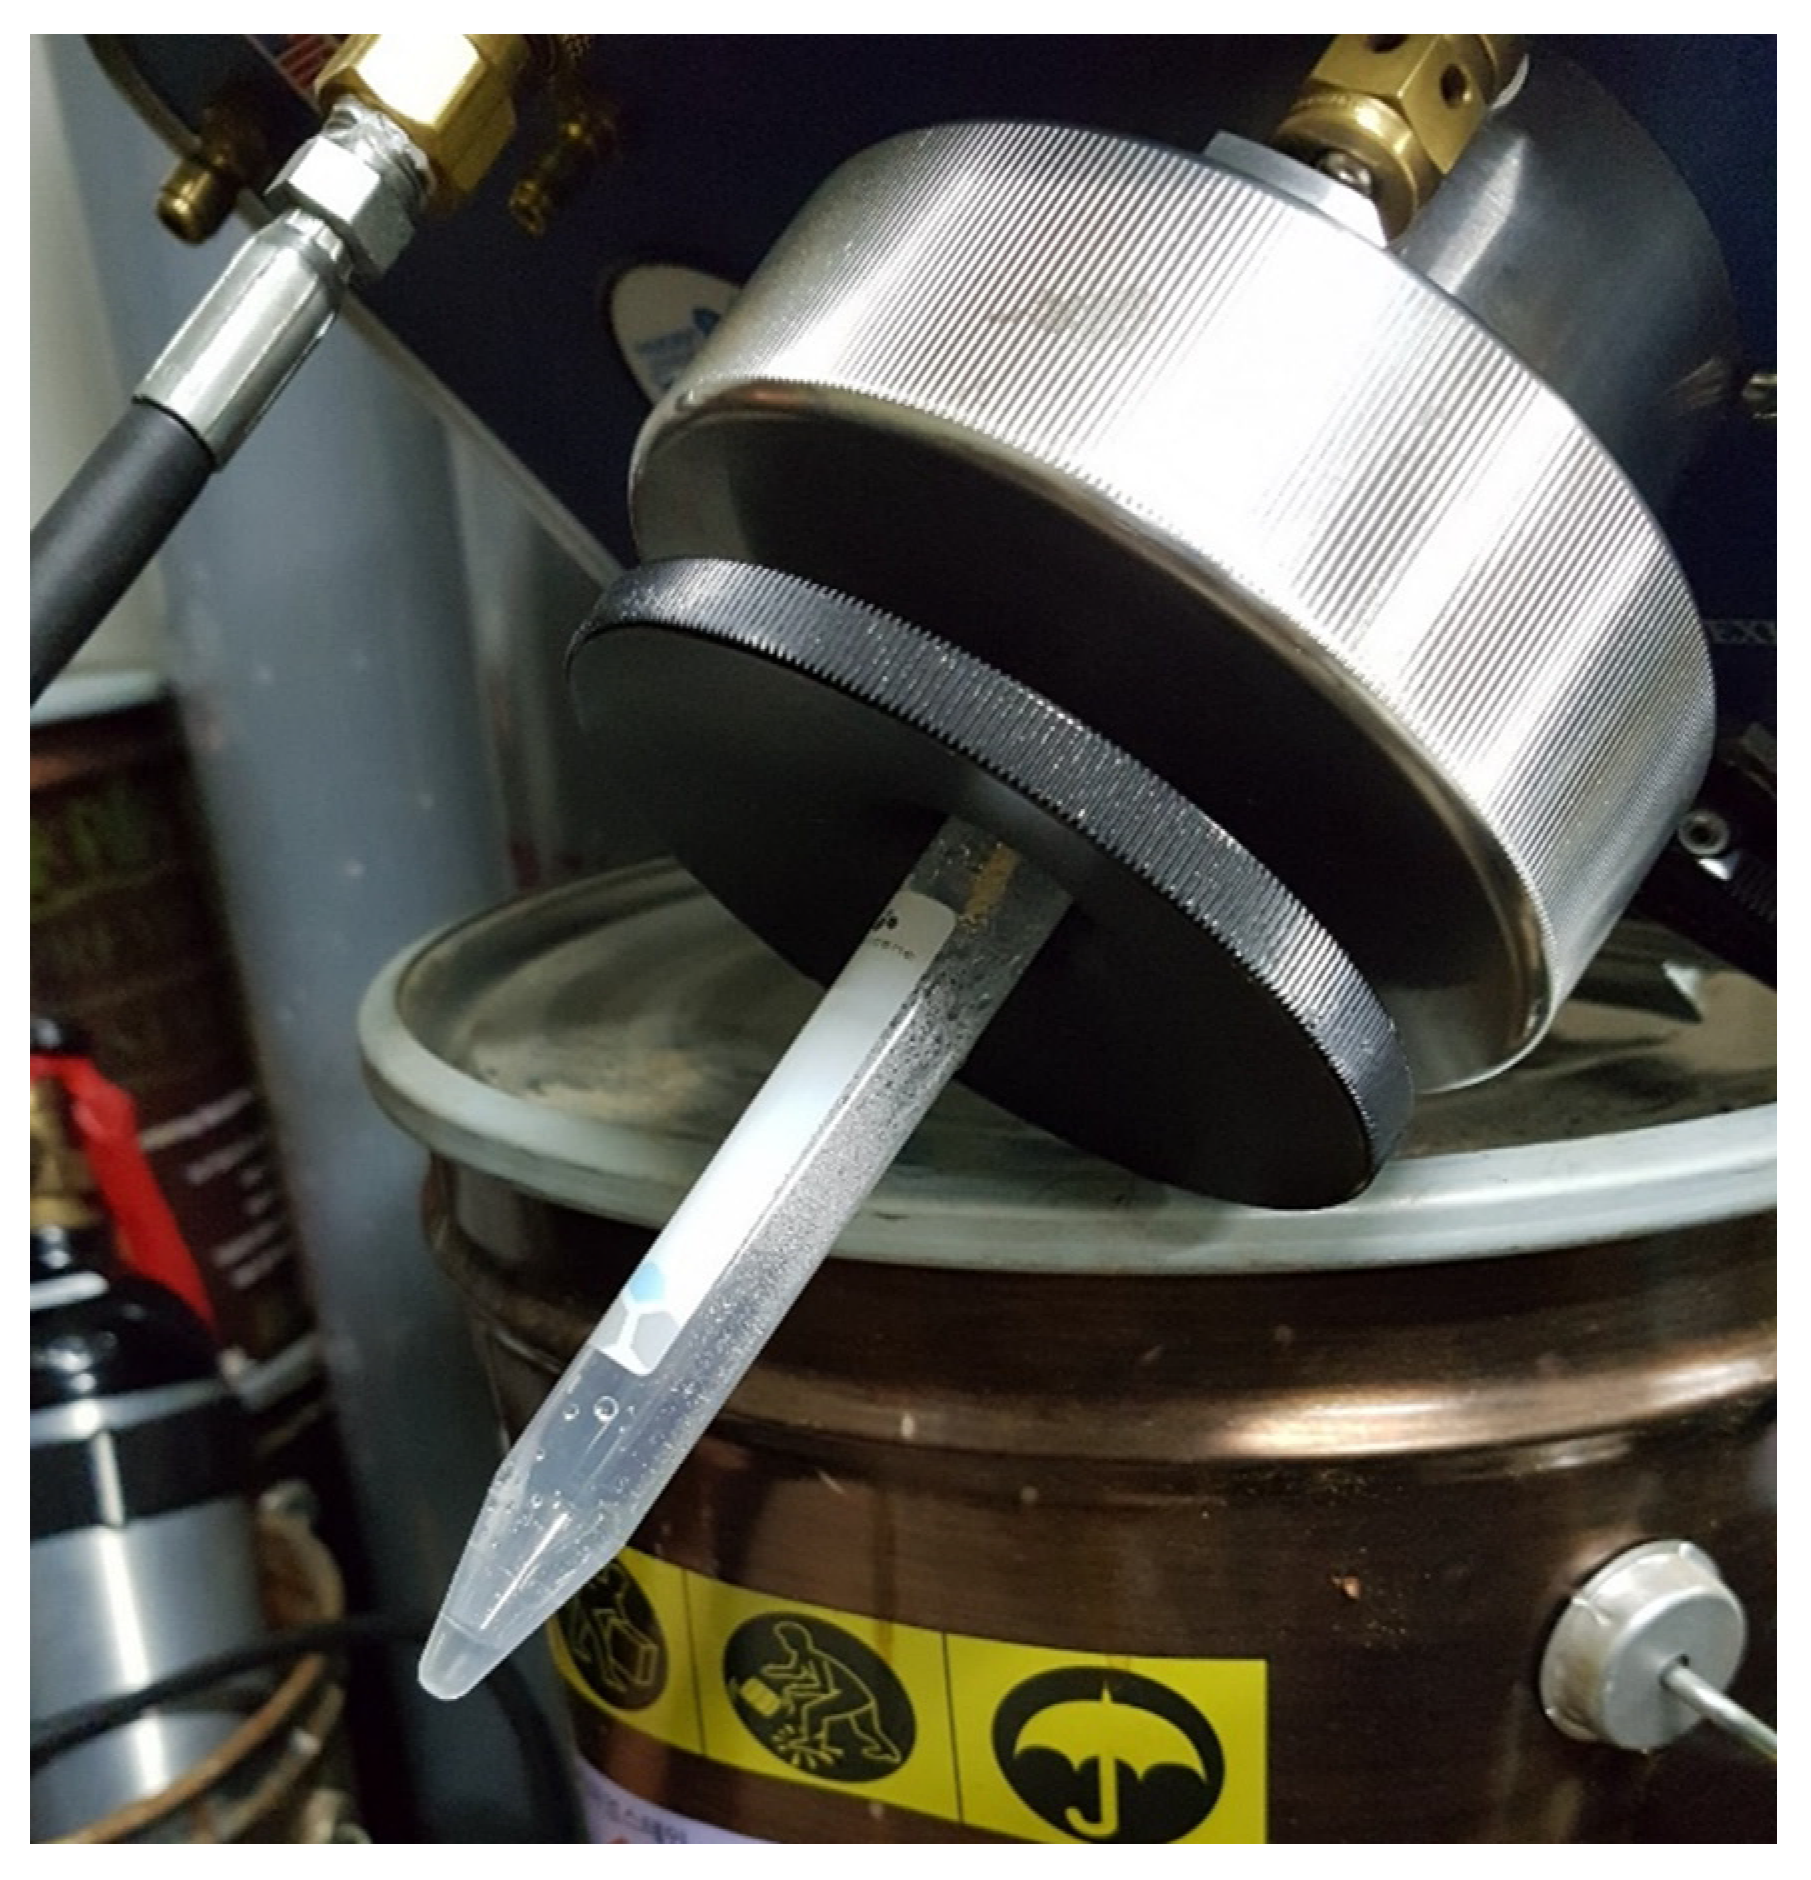
2.2. Soil Water Extraction

Suction cups were installed to extract soil water at five depths (10, 30, 50, 100, and 120 cm) and five different points in the conifer stand in December 2015 (Figure 2). After the soil was dug to 125 cm, suction cups with porous material tips were installed horizontally at each depth. For soil water sampling, polytetrafluoroethylene (PTFE) bottles with two-tube connectors were connected to the suction cups and a vacuum pump with Teflon tubing. Water was extracted from the soil into the suction cups, collected in bottles at pressures of 24–32 mbar, and applied to each suction cup. To collect extracted water, soil water sampling was performed for 1 d and the soil was filtered using 0.45 μm polyvinylidene fluoride (PVDF) syringe filters in the field. The soil water samples were kept in 15 mL conical tubes sealed with parafilm, which were then transported to the laboratory and stored in a refrigerator at 5 °C until isotope analysis.
Twenty-five soil samples were collected at the site for the analysis of soil characteristics. For each soil sample, the particle size distribution was determined according to the method described by Gee et al. (2002) [31]. The total carbon (C) and total nitrogen (N) content were analyzed using a PerkinElmer Series II CHNS/O Elemental Analyzer 2400 (USA). The soil pH was measured by mixing 2.5 g of soil with 5 mL of deionized water using a pH meter (827 pH lab, Metrohm, Swiss) [32]. The effective cation exchange capacity (CEC) was obtained as the sum of exchangeable cations (i.e., Na, K, Ca, Mg, Al, and H) [33]. Taxonomic class information was obtained from the United States Department of Agriculture Natural Resources Conservation Service Web Soil Survey [34]. At this site, the soil texture had three different types depending on the soil depth: loam at 10–50 cm, sandy loam at 100 cm, and sandy clay loam at 120 cm (Table 2). Chemical properties such as total C, total N, and CEC decreased as the soil depth became deeper. The average pH of the soil was slightly acidic, with an average value of 4.91.

2.3. Xylem Water Extraction

Ten twigs were sampled during the daytime from each tree species, cut to be placed in 50 mL conical tubes, capped, and wrapped with parafilm. These stem samples were transported in coolers to the laboratory and stored at −20 °C until water extraction. The water extraction was performed in the laboratory to ensure consistent extraction conditions for method intercomparison. Three methods were selected to compare xylem water extraction: (1) CVD, (2) PC, and (3) IM. Additionally, CVD was used to determine the time required to obtain unfractionated stable isotope values.
(1)
CVD
Stem water samples were extracted using a cryogenic vacuum distillation system, following a methodology adapted from West et al. (2006) [35]. The CVD system was constructed at the Laboratory of Forest Ecophysiology at Seoul National University (Seoul, Republic of Korea) (Figure 3). The extraction system consisted of six distillation units, each consisting of two 50 mL glass round flasks containing stem samples and collected water samples, connected to a vacuum line. Stem samples without bark and phloem tissue were cut into 25–30 mm pieces. The sample holders with 5–10 g of stems were submerged in deionized water and heated to 100 °C to evaporate the liquid water, while the collection tubes were submerged in liquid nitrogen (LN2) to condense the water vapor. To extract xylem water, the main vacuum line was evacuated to a pressure of 0.85 bar using a vacuum pump (VacuPorter, UMS GmbH, München, Germany). Residual water in the extraction system was extracted using a gas torch. The extracted water was filtered with 0.22 μm PVDF syringe filters to eliminate impurities. All the samples were stored in a refrigerator at 5 °C until the isotopic analysis. To determine the heating time required to obtain stable isotope values, xylem water was extracted for 1–4 h, and the isotope values were compared for the nine different tree species. The extraction effectiveness of two species (C. laxiflora and P. densiflora) was 73.0% at 1 h, 84.4% at 2 h, 90.9% at 3 h, and 99.5% at 4 h. The extraction effectiveness of the remaining seven tree species (C. obtusa, S. obassia, Q. mongolica, F. rhynchophylla, Q. serrata, Q. acutissima, and Z. serrata) was 74.3% at 1 h, 85.3% at 2 h, 98.8% at 3 h, and 98.8% at 4 h. The extraction effectiveness was 98.7% in the method intercomparison experiment.
(2)
PC
A portable pressure chamber (Model 1505D; PMS Instrument Company, OR, USA) was used for xylem water extraction (Figure 4). Stems without leaves, bark, and phloem were sealed inside the chamber, and the end of the stem that was cut was exposed to the atmosphere. After connecting the pressure chamber to the gas tank, a three-way control valve was turned to apply pressure, and the metering valve was slowly opened. The xylem water was collected directly in a 15 mL conical tube within 5 min per stem by positioning the pressure chamber upside down. The applied pressure and average water extraction amount were not measured. All the samples were filtered with 0.22 μm PVDF syringe filters and stored in a refrigerator at 5 °C before the isotopic analysis.
(3)
IM
The IM was connected to a CRDS (L2130-i, Picarro, Inc., Santa Clara, CA, USA). Stems without bark and phloem tissue were cut into small pieces and placed directly in a sample holder. The holder was sealed within a 4 mL clear vial (Supelco, Bellefonte, PA, USA) capped with white silicone/Teflon septa. Each prepared sample was quickly loaded into the IM. Sample vials with septa were pierced by a needle from the IM and the temperature of the IM was increased to 180–200 °C to vaporize water from the samples. The vaporized water was directly transferred into the CRDS using a connector for stable isotope analysis, which was performed for 10 min per sample.

2.4. Isotope Analyses

Soil water samples were analyzed using IRMS and CRDS with a high-precision vaporizer module (CRDS–VP) to compare differences in the stable isotopic compositions (δ2H and δ18O). The xylem water samples extracted with CVD and PC were analyzed using CRDS–VP. In addition, stem samples were analyzed for their stable isotopic compositions (δ2H and δ18O) using CRDS–IM.
For all methods, the isotope ratios were expressed per mil (‰) relative to Vienna Standard Mean Ocean Water (VSMOW). The isotopic concentrations were expressed using Equation (1):
δ (‰) = (Rsample/Rstandard − 1) × 1000,
where Rsample and Rstandard are the heavy-to-light isotopic ratios (2H/1H or 18O/16O) for the sample and a known reference (i.e., VSMOW), respectively.
(1)
IRMS
The oxygen and hydrogen isotope ratios of soil water samples were measured with an Optima isotope ratio mass spectrometer (SIRA II, VG Isotech, Middlewich, UK) at the Korea Basic Science Institute. Before instrumental analysis, for oxygen isotopic analysis, approximately 2 mL of each sample was equilibrated with tank CO2 gas at 25 °C. CO2 gas was subsequently extracted and purified cryogenically. For deuterium analysis, metallic chromium was used to produce hydrogen gas by using an automatic online sample preparation system (Euro PyrOH; GV Instruments, Manchester, UK). Standardization was based on distilled water calibration standards referenced to VSMOW2. The analytical precision was ±0.1‰ for δ18O and ±0.5‰ for δ2H.
(2)
CRDS
These measurements were performed with a CRDS instrument (L2130-I, Picarro, Inc.) equipped with a high-precision vaporizer (A0211, Picarro, Inc.) and an autosampler (A0325, Picarro, Inc.) at the Laboratory of Forest Ecophysiology, Seoul National University. All measurements were performed in the air carrier mode with zero air. For the analyses, all water samples were prepared in 2 mL glass vials with screw caps of bonded PTFE–silicone. The autosampler sampled 1.55 μL of water from each vial into the vaporizer with a 10 μL SGE syringe (Trajan Scientific and Medical, Heathwood, VIC, Australia). To preclude memory effects, the initial three injections were discarded from each sample, the final three injections were retained for analysis, and the syringes were rinsed with deionized water between vials. To correct for machine drift over the sample runs, two calibration standards, VSMOW2 and SLAP2 (Standard Light Antarctic Precipitation 2), were measured before the first sample and every 10–15 samples. The analytical precision of this method was ±0.03‰ for δ18O and ±0.41‰ for δ2H. All measurements were performed in air carrier mode to analyze xylem water using an IM. For stabilization, each sample was analyzed 6–8 times. Initial injections were discarded, and the final three injections were selected from each sample. Similar to the CRDS–VP measurements, standardization was based on two calibration standards: VSMOW2 and SLAP2. The accuracy of the IM analysis was ±0.39‰ for δ18O and ±0.94‰ for δ2H.

2.5. Data Analyses

A paired t-test was used to test the differences in the stable isotope ratios between IRMS and CRDS at each soil depth. Before conducting the paired t-test, the Shapiro–Wilk test was conducted to assess the normality of the differences in δ18O and δ2H values between the two sets of observations. Additionally, Pearson’s correlation tests were performed on the relationships between soil characteristics and the differences in the values of each isotope. The effectiveness of the different methods in soil water samples was assessed according to the determination coefficient (R2) of the linear regression between the CRDS and IRMS values and the root-mean-square error (RMSE), calculated as follows:
R M S E = ( C R D S I R M S ) 2 / N
where CRDS and IRMS are the measured δ2H and δ18O values of IRIS and IRMS, respectively, and N is the number of samples. To compare the extraction times for stem water, all the extracted isotopic data of stem water from each species were assessed for a normal distribution and homoscedasticity. Subsequently, either Kruskal–Wallis rank sum tests or analyses of variance with Duncan’s post hoc test were applied to determine differences between groups at p < 0.05. An analysis of covariance was used to determine the differences in the stable isotope ratios between the stem water extraction methods without considering species. All statistical analyses were performed with R version 4.0.5 [36].

3. Results

3.1. Differences in Stable Isotope Ratios between IRMS and CRDS

To compare CRDS’ performance with that of IRMS, the isotope (δ18O and δ2H) plots of the soil water are presented in Figure 5. One of the soil water samples from 120 cm showed large differences in isotope values between CRDS and IRMS (δ18O: 1.1‰, δ2H: 10.8‰); therefore, this extreme outlier was removed from the soil water analysis comparison. Discrepancies between the CRDS–IRMS regression line and the 1:1 line are shown in Figure 5. The δ18O and δ2H values of CRDS correlated with the corresponding isotope values of IRMS, with a high R2 and low RMSE. Both CRDS and IRMS showed values of δ18O and δ2H ranging from −9.0‰ to −5.1‰ and from −60.1‰ to −21.3‰, respectively. The paired t-test indicated significant differences between CRDS and IRMS measurements for δ2H and δ18O (p < 0.001). The average differences between CRDS and IRMS were higher in δ2H than δ18O (0.11‰ for δ18O and 1.97‰ for δ2H). The minimum differences observed were 0.03‰ for δ18O and 0.43‰ for δ2H, while the maximum differences were 0.22‰ for δ18O and 3.14‰ for δ2H.

3.2. Differences in Stable Isotope Ratios among Extraction Times

The extraction time for CVD was determined by comparing the δ18O and δ2H values of the xylem water extracted at 1–4 h. The isotopic values of the extracted water exhibited two different patterns (Figure 6 and Figure 7). In the first pattern, the isotope values consistently increased as the extraction time was extended. Conversely, in the second pattern, the values increased up to 3 h, after which they began to decrease by the fourth hour. To compare the extraction times for stem water, we used either the Kruskal–Wallis rank sum test or analyses of variance (p < 0.05). However, the differences in δ18O and δ2H at different extraction times were not significant for most species. Among the nine tree species, only two angiosperm species (C. laxiflora and Q. mongolica) showed smaller δ18O values at 1 h extraction time than at 3–4 h extraction (p < 0.05). Similarly, the δ2H values of stem water for the two angiosperm species (F. rhynchophylla and Q. mongolica) were lower at 1 h extraction time than at 3–4 h extraction time (p < 0.05). Although there was no significant effect of the extraction time on the stem water isotopic composition, we also considered the extraction efficiency, i.e., when the maximum amount of water had been extracted from the stems. The maximum extraction effectiveness was reached at 3 h for seven tree species (C. obtusa, S. obassia, Q. mongolica, F. rhynchophylla, Q. serrata, Q. acutissima, and Z. serrata) and at 4 h for two species (C. laxiflora and P. densiflora). Based on this result, further analysis was performed by using a 3 h extraction time, with the exception of C. laxiflora and P. densiflora, which required 4 h for extraction.

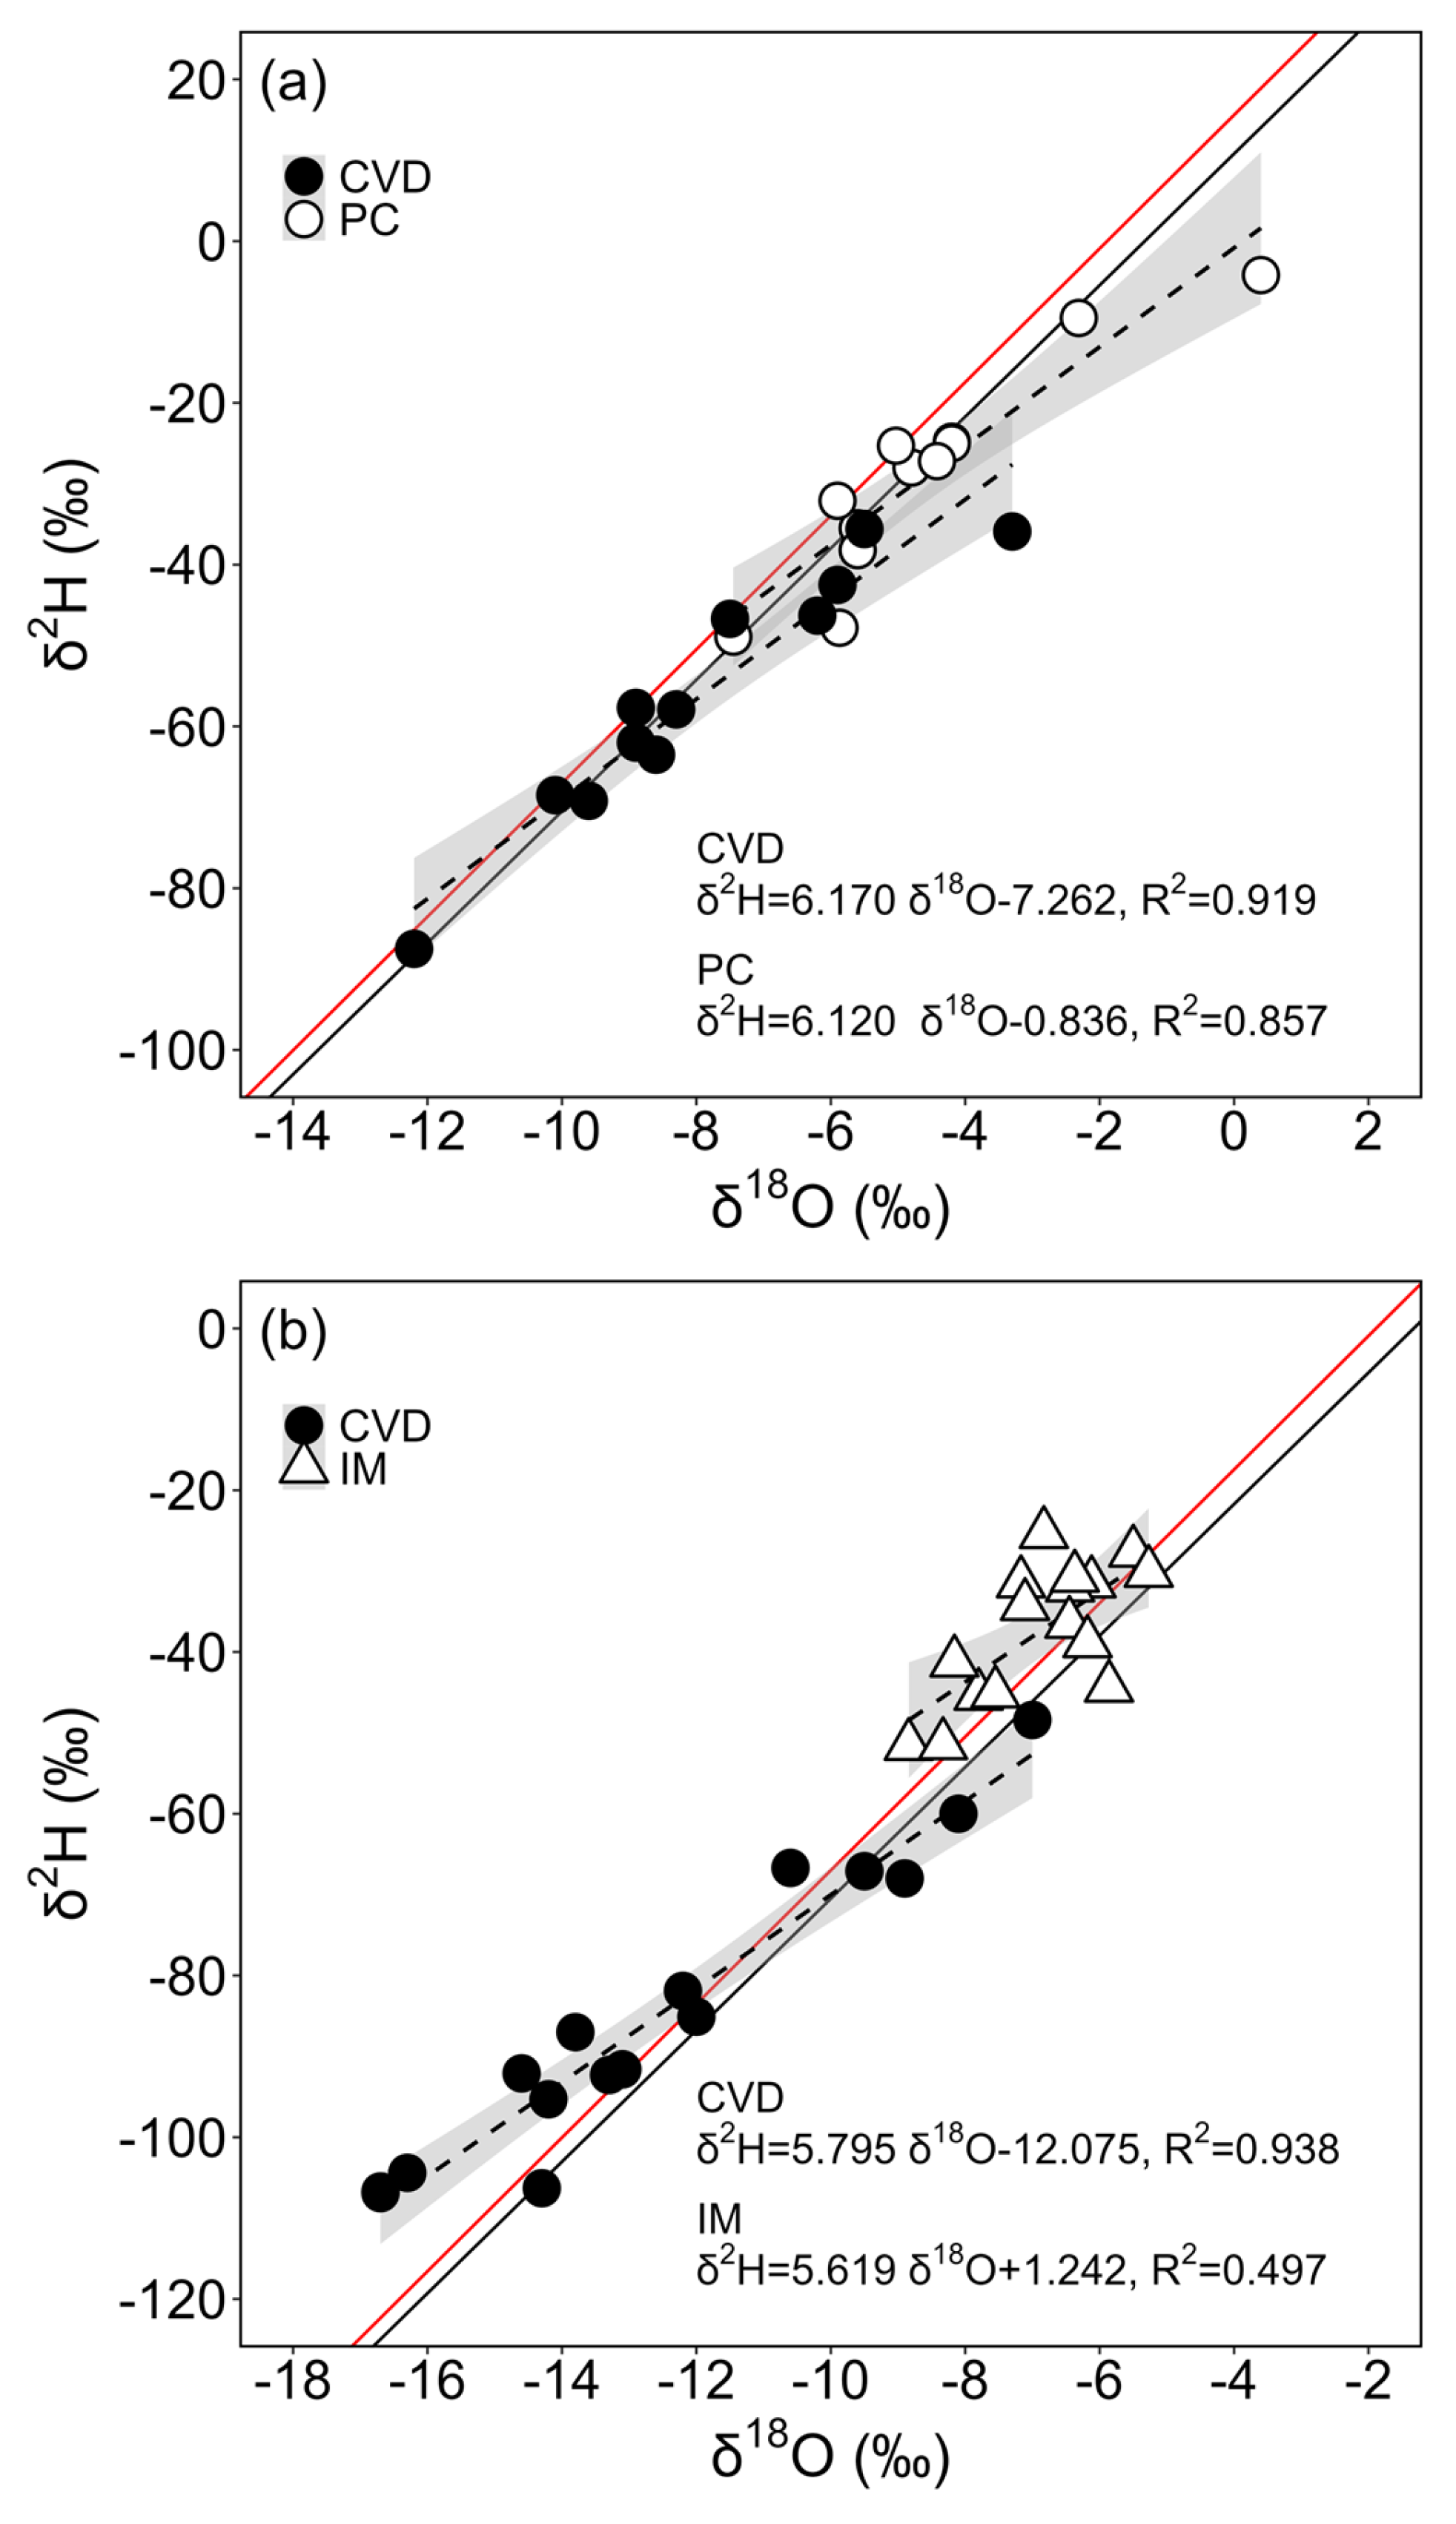
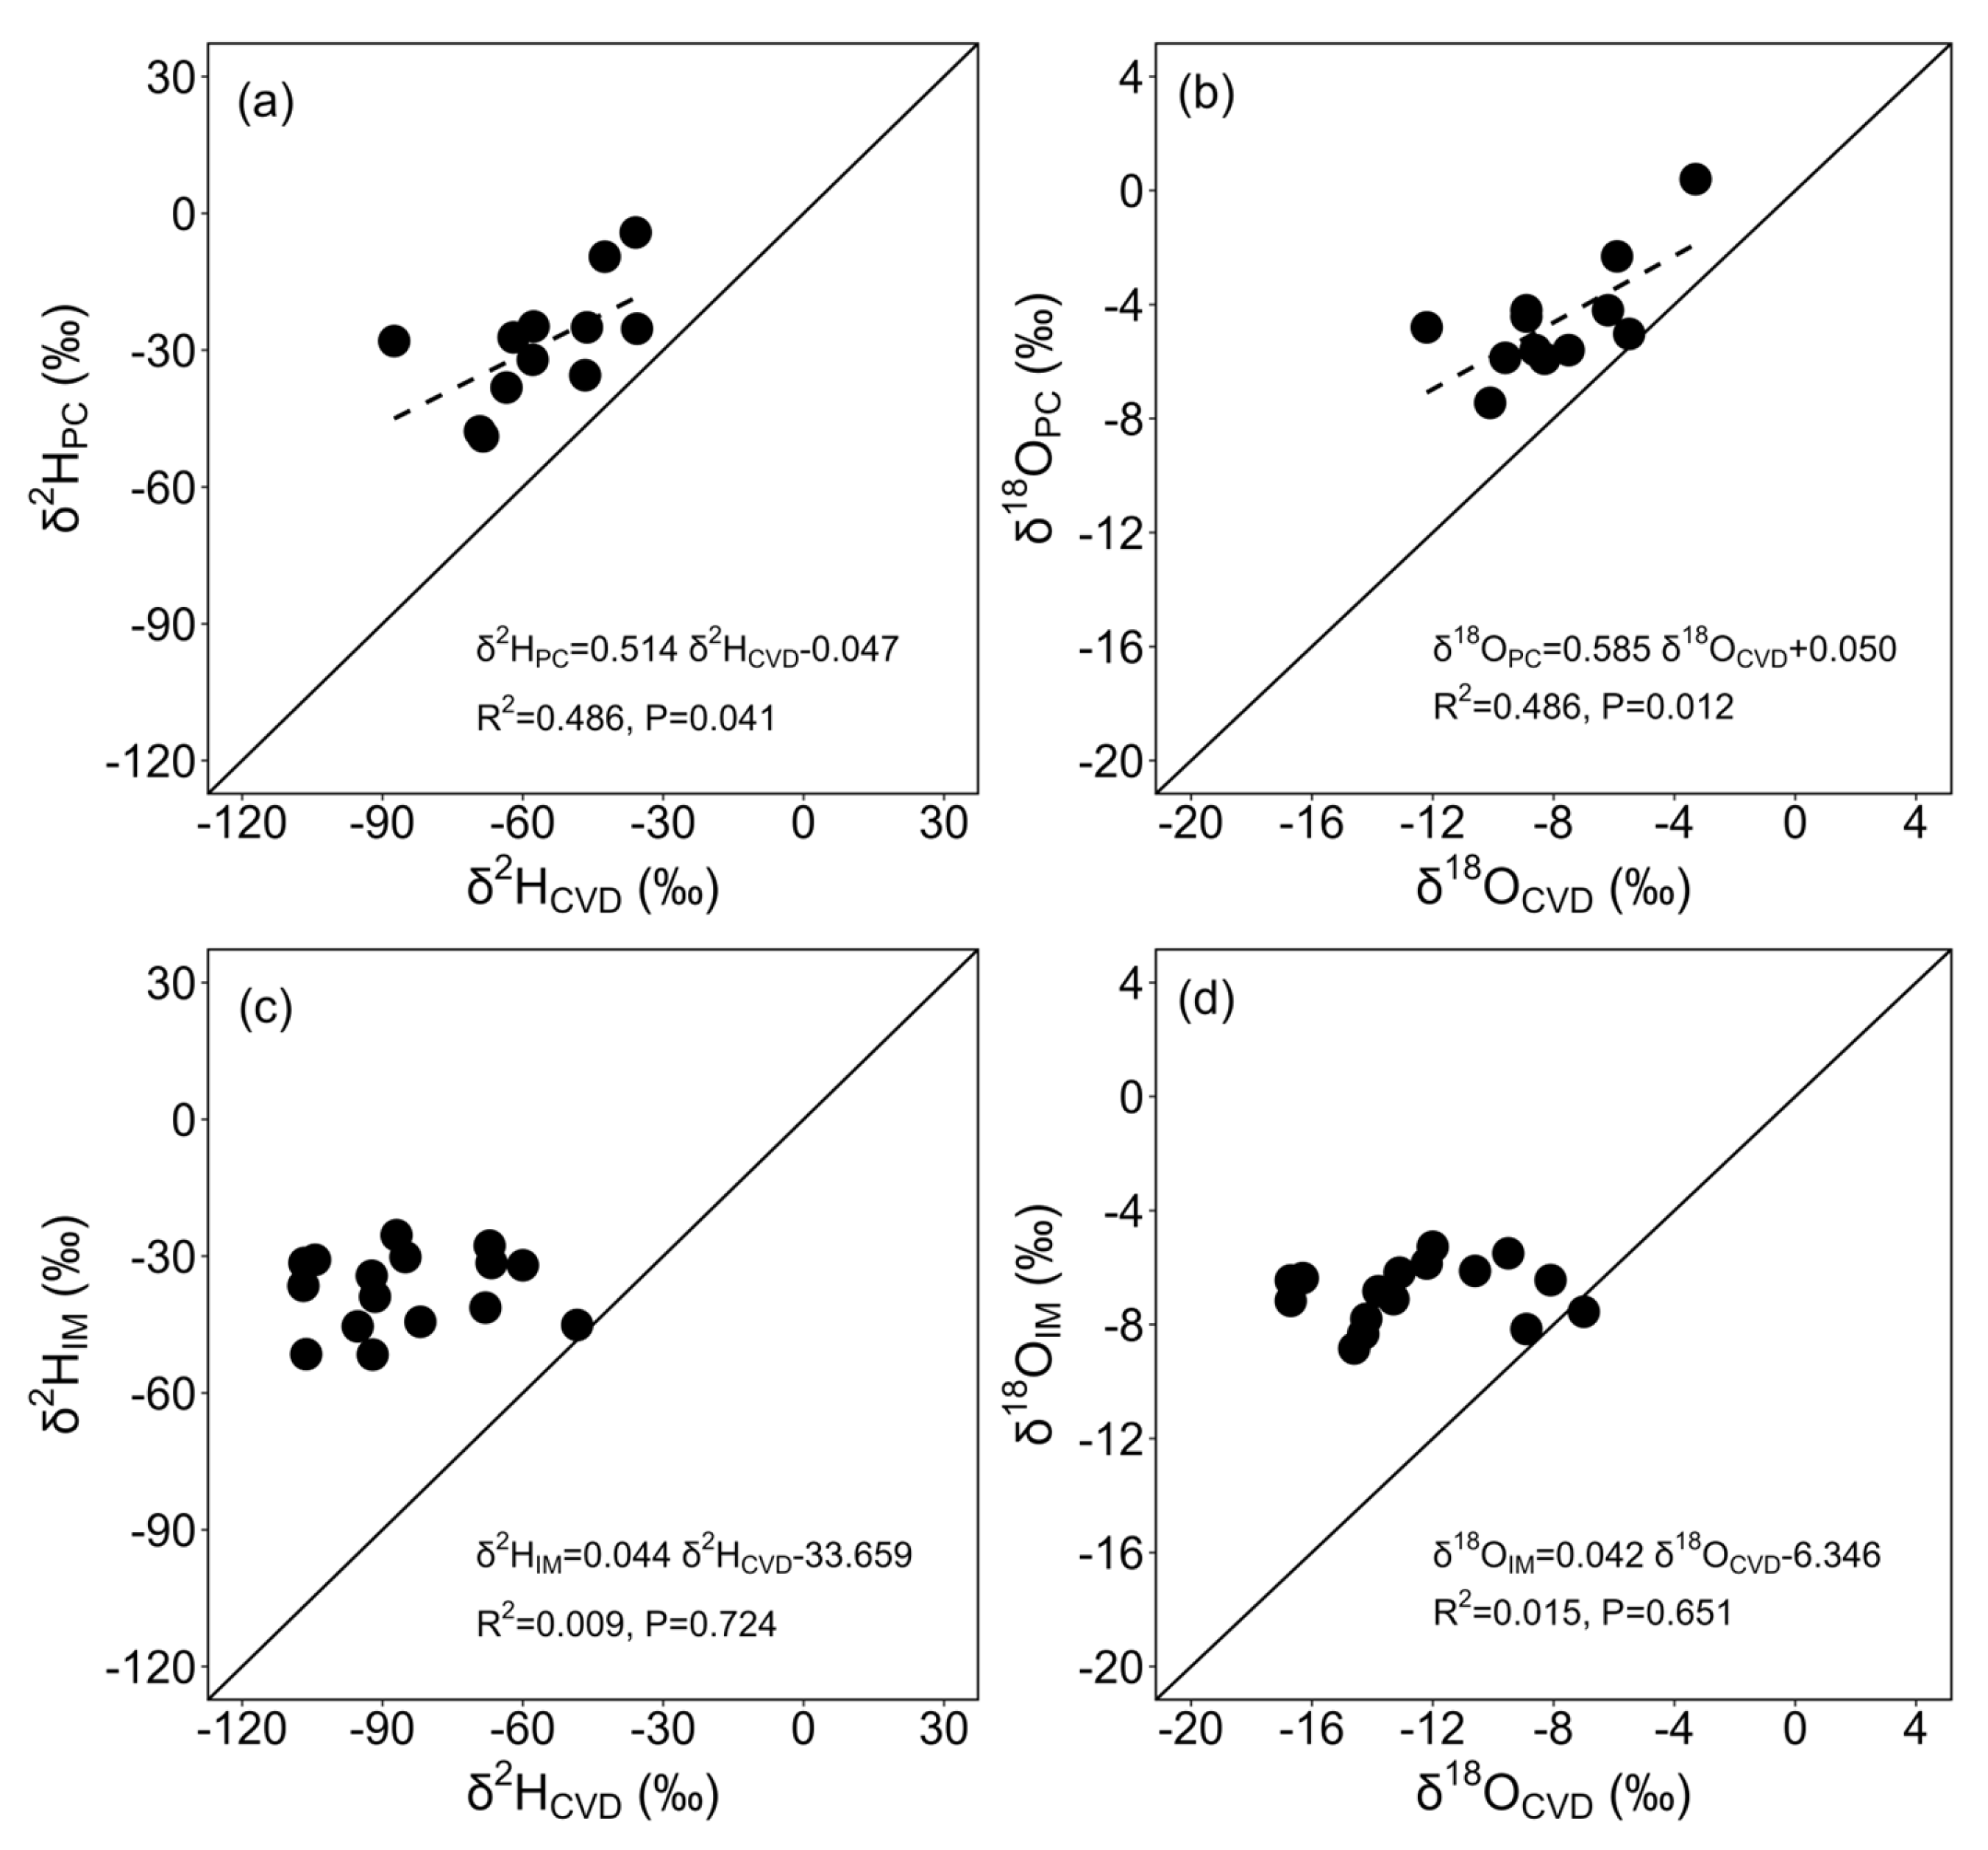
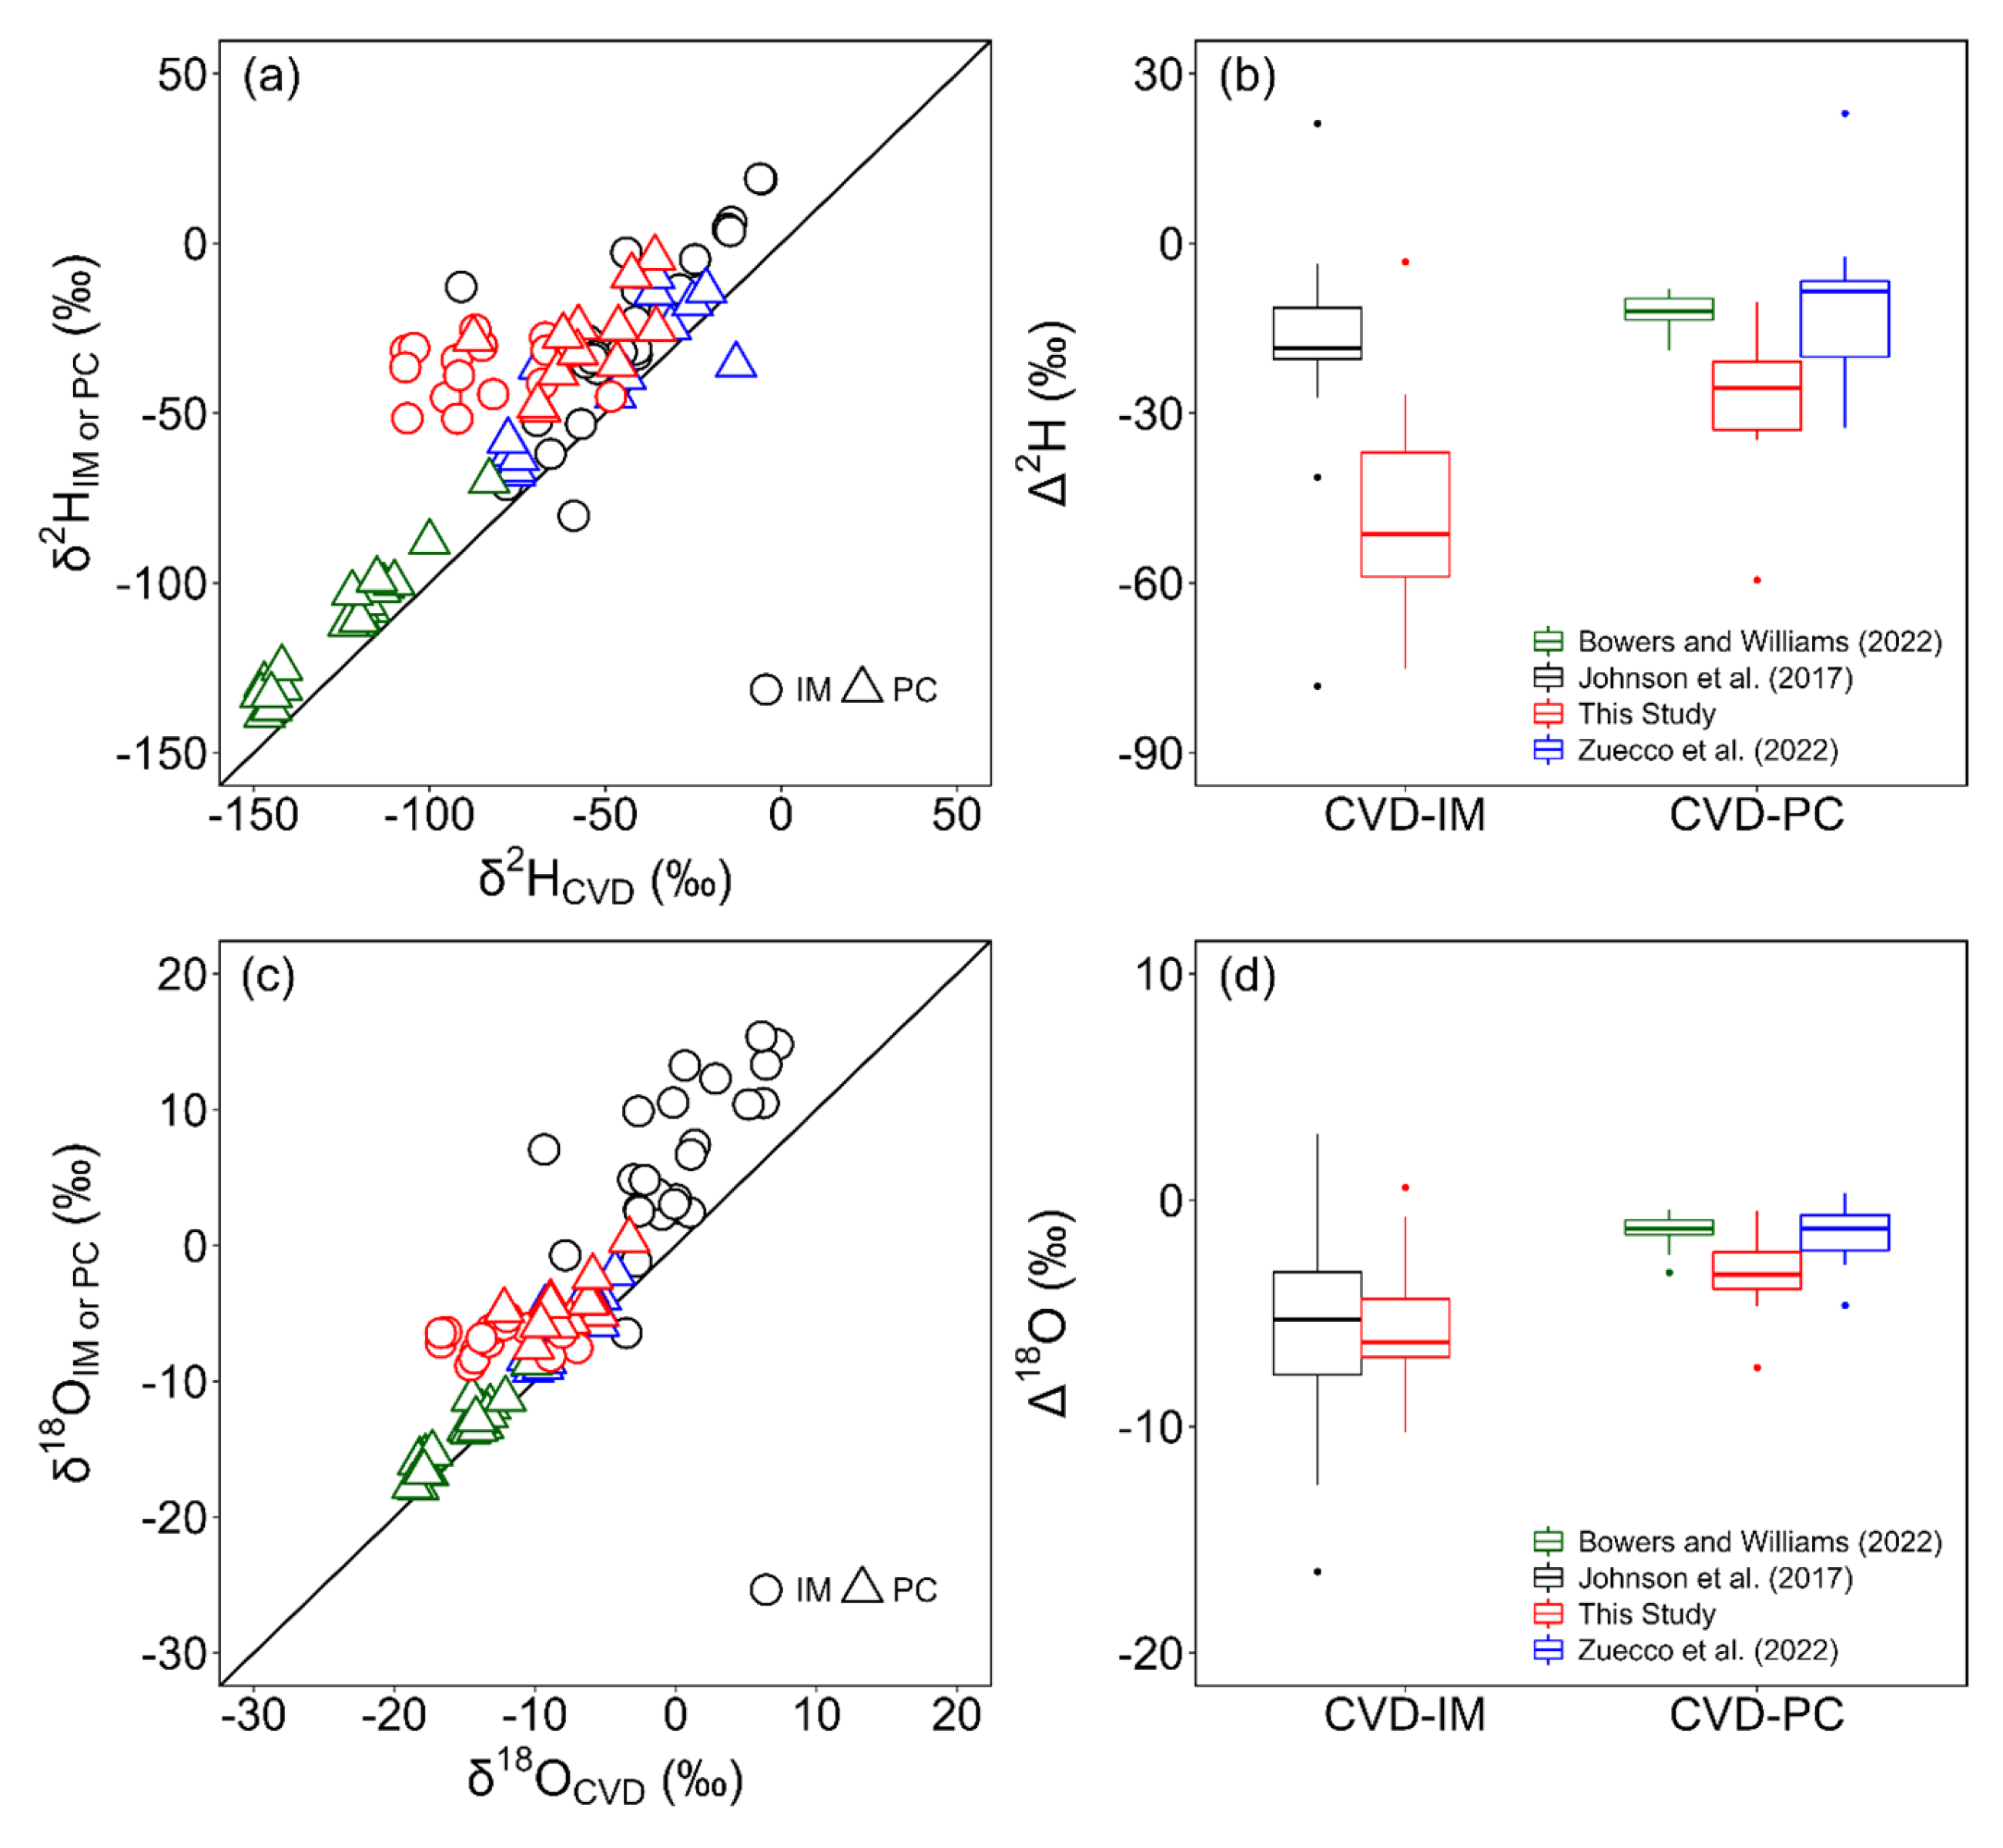
3.3. Differences in Stable Isotope Ratios among Extraction Methods

Figure 8 shows the variability in the δ18O and δ2H values of water extracted using the PC, IM, and CVD methods. There were significant differences among these extraction methods (Figure 8a, p = 0.0139; Figure 8b, p < 0.001). Moreover, the isotope values of PC and IM extraction were more enriched in heavy isotopes than those of CVD; therefore, PC and IM had fewer negative values in δ18O and δ2H compared to the corresponding isotope values of CVD. The isotope values of stem water from CVD ranged from −12.2‰ to −3.3‰ for δ18O and −87.5‰ to −35.6‰ for δ2H, but those from PC ranged from −7.45‰ to 0.4‰ for δ18O and −48.9‰ to −4.2‰ for δ2H. Similarly, the isotope values of CVD ranged from −16.7‰ to −7.0‰ for δ18O and −106.9‰ to −48.4‰ for δ2H, while those from IM ranged from −8.84‰ to −5.27‰ for δ18O and −51.6‰ to −25.4‰ for δ2H.
For the purpose of method intercomparison, a regression analysis was conducted to examine the relationship between δ18O and δ2H in stem samples that were collected at the same time. Figure 9 presents the results of this regression analysis, where the isotopic values obtained through CVD are compared against those obtained via PC in Figure 9a,b and against those obtained through IM in Figure 9c,d. The comparison between CVD and PC revealed a statistically significant correlation for both δ18O and δ2H (δ18O: R2 = 0.4861, p = 0.01173; δ2H: R2 = 0.3557, p = 0.04066). Although the isotopic values of δ2H and δ18O from PC were more enriched compared to those from CVD, the positive correlations indicated a systematic difference between the two methods that could potentially be calibrated. In contrast, the comparison between CVD and IM did not show a significant relationship for either of the isotopes (δ18O: R2 = 0.015, p = 0.6514; δ2H: R2 = 0.0092, p = 0.7237). The high p-values further confirm the lack of a statistically significant linear relationship, suggesting that the measurements from CVD and IM are not compatible.
The average differences in δ2H and δ18O between CVD and IM were larger than the differences between CVD and PC (Figure 10b,d). Moreover, the average differences in δ2H among the extraction methods were larger than those of δ18O. In the case of CVD and PC, the average differences were 27.23‰ for δ2H and 3.33‰ for δ18O. The range of differences varied from 10.03‰ to 59.5‰ for δ2H and 0.47‰ to 7.4‰ for δ18O. In the case of CVD and IM, the average differences were 47.61‰ for δ2H and 5.71‰ for δ18O. The minimum differences observed were –0.55‰ for δ18O and 3.3‰ for δ2H, while the maximum differences were 10.25‰ for δ18O and 75.2‰ for δ2H.

4. Discussion

4.1. Effects of Soil Properties on the Differences between IRMS and CRDS

Many studies have shown that the presence of organic compounds causes significant isotopic differences between IRMS and CRDS measurement [8,12]. In this study, soil water that contained fewer organic compounds was extracted by using suction cups [21,37,38]. However, the water isotopic compositions (δ18O and δ2H) were significantly different between CRDS and IRMS (Figure 5 and Table 3). To investigate the relationship among the isotopic differences according to the two instruments and the soil properties, including carbon and other organic matter, Pearson’s correlation analysis was performed for δ2H and δ18O at five soil depths (10, 30, 50, 100, and 120 cm) (Table 3).
Significant differences in δ2H were observed at 30, 50, and 120 cm (p < 0.05). At a 30 cm depth, positive correlations were found with sand content (0.577), total C (0.762), and total N (0.529), while there was a negative correlation with clay content (−0.793). Similarly, at the 50 cm and 120 cm depths, negative correlations were found with clay content (−0.578 and −0.516, respectively). For δ18O, significant differences were observed at 50 cm and 100 cm (p < 0.05). Significant positive correlations were observed with silt content (0.914), total C (0.867), and total N (0.823) at a 50 cm depth. Negative correlations were observed with sand (−0.779), clay (−0.752), and pH (−0.681). At a 100 cm depth, there were negative correlations with clay content (−0.617) and CEC (−0.501).
Among various factors, clay content was a strong factor that negatively affected the differences, except at the 10 cm depth. However, this relationship was specific to a certain soil depth, and it was not significant when it was applied to all of the soil depths. This suggests that the soil properties may not have been a significant factor contributing to the observed differences between CRDS and IRMS measurements.

4.2. Effects of Extraction Time on Stable Isotope Ratios

During the evaporation of stem water by means of CVD, light isotopic water (16O and 1H) is released earlier than heavy water (18O and 2H) because of the differences in molecular weight. In most studies, the extraction of stem water is continued until the isotope values become consistent. The stable isotope extraction time of stem water varies depending on the CVD system and extraction conditions, such as the heating temperature and vacuum. In previous studies, the extraction time for stem water ranged from 60 to 210 min. The stem water of three tree species (Ailanthus altissima, Pinus edulis, and Juniperus osteosperma) was extracted for 60–75 min at 100 °C and 8 Pa [35], and two crop species (Hordeum vulgare and Triticum aestivum) required 90 min at 90 °C and 0.3 Pa to extract water [19]. Meanwhile, xylem water was extracted from Salix viminalis for 180 min at 90 °C under 3 Pa [15] and T. aestivum for 210 min at 100 °C under 0.1 Pa [12].
The different extraction times could be attributed to differences in the xylem conduit type. The angiosperm A. altissima requires a longer time (75 min) than the two conifer species (P. edulis and J. osteosperma) (60 min) for stem water [35]. This variation in stem extraction time may be due to differences in pore size between the vessels (angiosperms) and tracheids (conifers) [25,35]. However, no correlation between the xylem structure and extraction time was observed in this study for the two coniferous species (P. densiflora and C. obtusa), the two diffuse porous broadleaved species (C. laxiflora and S. obassia), or the five ring-porous broadleaved species (Q. mongolica, F. rhynchophylla, Q. serrata, Q. acutissima, and Z. serrata). In our experiment, the stable isotope values of stem water were the highest after 3 h of extraction (Figure 6 and Figure 7). By considering the extraction efficiency and isotope values, most of the stem samples were selected to extract xylem water for 3 h, except for two species (C. laxiflora and P. densiflora), which were extracted for 4 h.

4.3. Effects of Stem Water Extraction Method on Stable Isotope Ratios

Our results were similar to those of previous studies, suggesting that CVD systems extract water with more depleted isotope values than PC and IM (Figure 8 and Figure 10) [11,25,30]. In the case of PC, stem water from alders, apples, beech, and chestnut was more enriched in δ2H and δ18O compared to that in the case of CVD [30]. Similarly, the PC method yielded more enriched isotope values for eight conifer species (Pinus contorta, Picea engelmannia, Abies laziocarpa, Picea pungens, Abies concolor, Pinus ponderosa, P. edulis, and Juniperus scopulorum) compared to CVD [25]. Furthermore, IM was more enriched in δ2H and δ18O compared to CVD in seven tree species (Larrea tridentata, Prosopis velutina, Acacia constricta, Parkinsonia microphylla, Fouquieria splendens, Ambrosia deltoidea, and Pseudotsuga menziesii) and two cactus species (Opuntia engelmannii and Cylindropuntia versicolor) [11].
The isotopic offsets between CVD and the two other extraction methods were higher for δ2H than δ18O (Figure 10b,d), indicating the occurrence of stronger deuterium fractionation during CVD. One hypothesis for the Δ2H offsets is that isotopic changes take place during the transport of source water through the xylem. Previous research has identified four water pools within stems: sap water, symplastic water, capillary water (apoplastic water), and fiber water [39,40,41]. The stem water extracted by using CVD is the total stem water, including all four stem water pools, because it uses heating with pressure. The stem water from the PC and IM methods is sap and capillary water, which moves through the apoplastic network in the stems [41]. It has been reported that the symplastic uptake of source water into the root xylem can lead to hydrogen isotope fractionation [42,43,44]. Additionally, these isotopic offsets in different water pools can be attributed to variations in residence times [25]. Specifically, the PC method extracts more mobile water from the xylem, providing insights into the most recently acquired water by the tree. Conversely, CVD extracts water that has resided in the stem for an extended period. The inclusion of older water extracted by CVD can result in an isotopic offset of stem water. Therefore, the depleted isotope values in CVD-extracted stem water suggest that CVD extracts the total stem water compared with PC and IM, potentially complicating interpretations of water uptake patterns in various tree species.
Another hypothesis regarding Δ2H offsets is that hydrogen exchange can occur between the hydroxyl groups in plant organics (mostly cellulose) and the surrounding water molecules during CVD extraction. This leads to significant Δ2H offsets, which can be notably accelerated at increased temperatures, resulting in a higher deuterium concentration in cellulose and a depletion in extracted water [44]. To test this hypothesis, researchers conducted a rehydration experiment using CVD, and they observed a positive relationship between the relative water content of stem samples and Δ2H offsets [28,44].
An additional hypothesis for Δ2H offsets involves the potential occurrence of deuterium fractionation during water uptake by roots. This is supported by the observed significant δ2H depletion in stem water extracted with CVD, as compared to the δ2H in source water for plants from diverse habitats. Interestingly, the relationship between the relative water content of stems and Δ2H offsets varied between different habitats (xeric, saline, and mesic) [45]. There was a positive correlation in saline habitats, no correlation in xeric habitats, and a negative correlation in mesic habitats. In addition, Δ2H offsets are influenced by various factors, such as plant organs, species, and original water isotopes in plants [28,45,46]. Wen et al. (2022) conducted spiking tests using tap and enriched water with known isotopic signatures [28]. They revealed a significant linear relationship between the plant water content and Δ2H offsets across all plant organs (root, trunk, and stem) and species (Robinia pseudoacacia and Malus pumila) in both spiking tests (p < 0.01, R2 = 0.88–1.00). Furthermore, all regression lines showed significant differences, except for the trunk of R. pseudoacacia and the stem of M. pumila, in the tap water spiking experiments.
The isotopic composition obtained through IM exhibited variations with the CVD method when compared with that of PC (Figure 9). For the IM method, the stem samples were sliced into 1–2 mm-thick sections, and only a small amount of the sample (approximately 20 mg) was used for the analysis of the isotope composition. Conversely, both PC and CVD used longer stem samples (approximately 10 cm in length) for water extraction. This disparity in sample size likely contributed to the lack of correlation in δ18O and δ2H between IM and CVD. In contrast, PC and CVD, which used longer and more substantial stem samples, were strongly correlated in δ18O and δ2H. This suggests that a larger sample size for PC enabled the more comprehensive and representative extraction of stem water, resulting in better agreement with CVD and more realistic isotopic values. These findings highlight the importance of considering the sample size and processing techniques when comparing isotopic compositions among different extraction methods.

5. Conclusions

We conducted three different experiments to investigate the isotopic variations arising from analytical techniques and water extraction methods. First, our results showed minimal but significant differences between IRMS and CRDS. Soil properties were not significant factors contributing to differences between the two instruments. Second, we determined that an extraction time of 3–4 h was appropriate to obtain unfractionated water from stems using CVD. Third, we observed that water extracted using CVD had depleted δ2H compared to water obtained via PC and IM. Additionally, PC was positively correlated with CVD, while IM showed no significant correlation. Consequently, we recommend the PC method as the preferable choice for the extraction of stem water to investigate water uptake processes in forest ecosystems. In this study, we could not definitively determine whether the Δ2H offsets were a result of fractionation during CVD extraction and/or water uptake by the roots. Nevertheless, the observed hydrogen offset highlights the crucial need to account for isotopic variations attributable to analytical and xylem water extraction methods to ensure the precise interpretation of water uptake processes in forest ecosystems.
Our research highlights the significance of carefully selecting analytical and water extraction methods to guarantee the accuracy and reliability of stable isotope data. It also offers valuable guidance on the optimal method for stem water extraction. These insights will contribute to a better understanding of water cycling processes in ecosystems. Moreover, further research is necessary to investigate the impact of δ2H offsets in stem water on the accurate estimation of plant water sources.

Author Contributions

Conceptualization, H.S.K. and J.J.; methodology, J.J.; software, J.J.; validation, J.J.; formal analysis, J.J.; investigation, J.J.; resources, J.J.; data curation, J.J., H.L., M.L., J.H., S.K. and C.P.; writing—original draft preparation, J.J.; writing—review and editing, J.J. and H.S.K.; visualization, J.J.; supervision, H.S.K.; project administration, H.S.K.; funding acquisition, H.S.K. All authors have read and agreed to the published version of the manuscript.

Funding

This research was funded by the ‘R&D Program for Forest Science Technology (Project No. 2020185D10–2222–AA02)’, provided by the Korea Forest Service (Korea Forestry Promotion Institute).

Data Availability Statement

The raw data supporting the conclusions of this article will be made available by the authors on request.

Acknowledgments

We thank the staff members from the Seoul National University Forest for their assistance in sample collection and for providing access to the field site.

Conflicts of Interest

The authors declare no conflicts of interest.

References

  1. Tetzlaff, D.; Buttle, J.; Carey, S.K.; Kohn, M.J.; Laudon, H.; McNamara, J.P.; Smith, A.; Sprenger, M.; Soulsby, C. Stable isotopes of water reveal differences in plant–soil water relationships across northern environments. Hydrol. Process. 2021, 35, e14023. [Google Scholar] [CrossRef]
  2. Miguez-Macho, G.; Fan, Y. Spatiotemporal origin of soil water taken up by vegetation. Nature 2021, 598, 624–628. [Google Scholar] [CrossRef]
  3. Landgraf, J.; Tetzlaff, D.; Dubbert, M.; Dubbert, D.; Smith, A.; Soulsby, C. Xylem water in riparian willow trees (Salix alba) reveals shallow sources of root water uptake by in situ monitoring of stable water isotopes. Hydrol. Earth Syst. Sci. 2022, 26, 2073–2092. [Google Scholar] [CrossRef]
  4. Dai, J.; Zhang, X.; Wang, L.; Wang, R.; Luo, Z.; He, X.; Rao, Z. Water stable isotope characteristics and water use strategies of co-occurring plants in ecological and economic forests in subtropical monsoon regions. J. Hydrol. 2023, 621, 129565. [Google Scholar] [CrossRef]
  5. Orlowski, N.; Rinderer, M.; Dubbert, M.; Ceperley, N.; Hrachowitz, M.; Gessler, A.; Rothfuss, Y.; Sprenger, M.; Heidbüchel, I.; Kübert, A. Challenges in studying water fluxes within the soil-plant-atmosphere continuum: A tracer-based perspective on pathways to progress. Sci. Total Environ. 2023, 881, 163510. [Google Scholar] [CrossRef]
  6. Brand, W.A.; Geilmann, H.; Crosson, E.R.; Rella, C.W. Cavity ring-down spectroscopy versus high-temperature conversion isotope ratio mass spectrometry; a case study on δ2H and δ18O of pure water samples and alcohol/water mixtures. Rapid Commun. Mass Spectrom. RCM 2009, 23, 1879–1884. [Google Scholar] [CrossRef] [PubMed]
  7. Schmidt, M.; Maseyk, K.; Lett, C.; Biron, P.; Richard, P.; Bariac, T.; Seibt, U. Reducing and correcting for contamination of ecosystem water stable isotopes measured by isotope ratio infrared spectroscopy. Rapid Commun. Mass Spectrom. 2012, 26, 141–153. [Google Scholar] [CrossRef] [PubMed]
  8. Martín-Gómez, P.; Barbeta, A.; Voltas, J.; Peñuelas, J.; Dennis, K.; Palacio, S.; Dawson, T.E.; Ferrio, J.P. Isotope-ratio infrared spectroscopy: A reliable tool for the investigation of plant-water sources? New Phytol. 2015, 207, 914–927. [Google Scholar] [CrossRef] [PubMed]
  9. West, A.G.; Goldsmith, G.R.; Brooks, P.D.; Dawson, T.E. Discrepancies between isotope ratio infrared spectroscopy and isotope ratio mass spectrometry for the stable isotope analysis of plant and soil waters. Rapid Commun. Mass Spectrom. 2010, 24, 1948–1954. [Google Scholar] [CrossRef]
  10. West, A.; Goldsmith, G.; Matimati, I.; Dawson, T. Spectral analysis software improves confidence in plant and soil water stable isotope analyses performed by isotope ratio infrared spectroscopy (IRIS). Rapid Commun. Mass Spectrom. 2011, 25, 2268–2274. [Google Scholar] [CrossRef] [PubMed]
  11. Johnson, J.; Hamann, L.; Dettman, D.; Kim-Hak, D.; Leavitt, S.; Monson, R.; Papuga, S. Performance of induction module cavity ring-down spectroscopy (IM-CRDS) for measuring δ18O and δ2H values of soil, stem, and leaf waters. Rapid Commun. Mass Spectrom. 2017, 31, 547–560. [Google Scholar] [CrossRef]
  12. Millar, C.; Pratt, D.; Schneider, D.J.; McDonnell, J.J. A comparison of extraction systems for plant water stable isotope analysis. Rapid Commun. Mass Spectrom. 2018, 32, 1031–1044. [Google Scholar] [CrossRef] [PubMed]
  13. Millar, C.; Janzen, K.; Nehemy, M.F.; Koehler, G.; Hervé-Fernández, P.; McDonnell, J.J. Organic contamination detection for isotopic analysis of water by laser spectroscopy. Rapid Commun. Mass Spectrom. 2021, 35, e9118. [Google Scholar] [CrossRef]
  14. Orlowski, N.; Breuer, L.; McDonnell, J.J. Critical issues with cryogenic extraction of soil water for stable isotope analysis. Ecohydrology 2016, 9, 1–5. [Google Scholar] [CrossRef]
  15. Newberry, S.; Nelson, D.; Kahmen, A. Cryogenic vacuum artifacts do not affect plant water-uptake studies using stable isotope analysis. Ecohydrology 2017, 10, e1892. [Google Scholar] [CrossRef]
  16. Lazarus, B.E.; Germino, M.J. Methodological considerations regarding online extraction of water from soils for stable isotope determination. Rapid Commun. Mass Spectrom. 2017, 31, 1677–1680. [Google Scholar] [CrossRef]
  17. Millar, C.; Janzen, K.; Nehemy, M.F.; Koehler, G.; Hervé-Fernández, P.; Wang, H.; Orlowski, N.; Barbeta, A.; McDonnell, J.J. On the urgent need for standardization in isotope-based ecohydrological investigations. Hydrol. Process. 2022, 36, e14698. [Google Scholar] [CrossRef]
  18. Goebel, T.S.; Lascano, R.J. System for high throughput water extraction from soil material for stable isotope analysis of water. J. Anal. Sci. Methods Instrum. 2012, 2, 203–207. [Google Scholar] [CrossRef]
  19. Orlowski, N.; Frede, H.-G.; Brüggemann, N.; Breuer, L. Validation and application of a cryogenic vacuum extraction system for soil and plant water extraction for isotope analysis. J. Sens. Sens. Syst. 2013, 2, 179–193. [Google Scholar] [CrossRef]
  20. Munksgaard, N.C.; Cheesman, A.W.; Wurster, C.M.; Cernusak, L.A.; Bird, M.I. Microwave extraction–isotope ratio infrared spectroscopy (ME-IRIS): A novel technique for rapid extraction and in-line analysis of δ18O and δ2H values of water in plants, soils and insects. Rapid Commun. Mass Spectrom. 2014, 28, 2151–2161. [Google Scholar] [CrossRef]
  21. Orlowski, N.; Pratt, D.L.; McDonnell, J.J. Intercomparison of soil pore water extraction methods for stable isotope analysis. Hydrol. Process. 2016, 30, 3434–3449. [Google Scholar] [CrossRef]
  22. Orlowski, N.; Breuer, L.; Angeli, N.; Boeckx, P.; Brumbt, C.; Cook, C.S.; Dubbert, M.; Dyckmans, J.; Gallagher, B.; Gralher, B. Inter-laboratory comparison of cryogenic water extraction systems for stable isotope analysis of soil water. Hydrol. Earth Syst. Sci. 2018, 22, 3619–3637. [Google Scholar] [CrossRef]
  23. Yang, B.; Dossa, G.G.; Hu, Y.H.; Liu, L.L.; Meng, X.J.; Du, Y.Y.; Li, J.Y.; Zhu, X.A.; Zhang, Y.J.; Singh, A.K. Uncorrected soil water isotopes through cryogenic vacuum distillation may lead to a false estimation on plant water sources. Methods Ecol. Evol. 2023, 14, 1443–1456. [Google Scholar] [CrossRef]
  24. Allen, S.T.; Kirchner, J.W. Potential effects of cryogenic extraction biases on plant water source partitioning inferred from xylem-water isotope ratios. Hydrol. Process 2022, 36, e14483. [Google Scholar] [CrossRef]
  25. Bowers, W.H.; Williams, D.G. Isotopic heterogeneity of stem water in conifers is correlated to xylem hydraulic traits and supports multiple residence times. Front. Water 2022, 46, 861590. [Google Scholar] [CrossRef]
  26. He, D.; Wen, M.; Wang, Y.; Du, G.; Zhang, C.; He, H.; Jin, J.; Li, M.; Si, B. Xylem water cryogenic vacuum extraction: Testing correction methods with CaviTron-based apple twig sampling. J. Hydrol. 2023, 621, 129572. [Google Scholar] [CrossRef]
  27. Diao, H.; Schuler, P.; Goldsmith, G.R.; Siegwolf, R.T.; Saurer, M.; Lehmann, M.M. On uncertainties in plant water isotopic composition following extraction by cryogenic vacuum distillation. Hydrol. Earth Syst. Sci. 2022, 26, 5835–5847. [Google Scholar] [CrossRef]
  28. Wen, M.; He, D.; Li, M.; Ren, R.; Jin, J.; Si, B. Causes and factors of cryogenic extraction biases on isotopes of xylem water. Water Resour. Res. 2022, 58, e2022WR032182. [Google Scholar] [CrossRef]
  29. Sobota, M.; Li, K.; Hren, M.; Knighton, J. Evidence for variations in cryogenic extraction deuterium biases of plant xylem water across foundational northeastern US trees. Hydrol. Process. 2024, 38, e15079. [Google Scholar] [CrossRef]
  30. Zuecco, G.; Amin, A.; Frentress, J.; Engel, M.; Marchina, C.; Anfodillo, T.; Borga, M.; Carraro, V.; Scandellari, F.; Tagliavini, M. A comparative study of plant water extraction methods for isotopic analyses: Scholander-type pressure chamber vs. cryogenic vacuum distillation. Hydrol. Earth Syst. Sci. 2022, 26, 3673–3689. [Google Scholar] [CrossRef]
  31. Gee, G.; Or, D. Particle size analysis. In ‘Methods of soil analysis. Part 4. Physical methods’. Soil Sci. Soc. Am. Book Ser. 2002, 5, 255–293. [Google Scholar]
  32. Thomas, G.W. Soil pH and soil acidity. Methods Soil Anal. Part 3 Chem. Methods 1996, 5, 475–490. [Google Scholar]
  33. Sumner, M.E.; Miller, W.P. Cation exchange capacity and exchange coefficients. Methods Soil Anal. Part 3 Chem. Methods 1996, 5, 1201–1229. [Google Scholar]
  34. Soil Survey Staff. Web Soil Survey. United States Department of Agriculture: Retrieved from Natural Resources Conservation Service. 2019. Available online: https://websoilsurvey.sc.egov.usda.gov/ (accessed on 12 December 2017).
  35. West, A.G.; Patrickson, S.J.; Ehleringer, J.R. Water extraction times for plant and soil materials used in stable isotope analysis. Rapid Commun. Mass Spectrom. 2006, 20, 1317–1321. [Google Scholar] [CrossRef] [PubMed]
  36. R Core Team. R: A Language and Environment for Statistical Computing; R Foundation for Statistical Computing: Vienna, Austria, 2021; Available online: https://www.R–project.org/ (accessed on 31 December 2023).
  37. McDonnell, J.J. The two water worlds hypothesis: Ecohydrological separation of water between streams and trees? Wiley Interdiscip. Rev. Water 2014, 1, 323–329. [Google Scholar] [CrossRef]
  38. Sánchez-Murillo, R.; Todini-Zicavo, D.; Poca, M.; Birkel, C.; Esquivel-Hernández, G.; Chavarría, M.M.; Zuecco, G.; Penna, D. Dry season plant water sourcing in contrasting tropical ecosystems of Costa Rica. Ecohydrology 2023, 16, e2541. [Google Scholar] [CrossRef]
  39. Berry, S.L.; Roderick, M.L. Plant–water relations and the fibre saturation point. New Phytol. 2005, 168, 25–37. [Google Scholar] [CrossRef] [PubMed]
  40. Jupa, R.; Plavcová, L.; Gloser, V.; Jansen, S. Linking xylem water storage with anatomical parameters in five temperate tree species. Tree Physiol. 2016, 36, 756–769. [Google Scholar] [CrossRef] [PubMed]
  41. Barbeta, A.; Burlett, R.; Martín-Gómez, P.; Fréjaville, B.; Devert, N.; Wingate, L.; Domec, J.-C.; Ogée, J. Evidence for distinct isotopic compositions of sap and tissue water in tree stems: Consequences for plant water source identification. New Phytol. 2022, 233, 1121–1132. [Google Scholar] [CrossRef]
  42. Ellsworth, P.Z.; Williams, D.G. Hydrogen isotope fractionation during water uptake by woody xerophytes. Plant Soil 2007, 291, 93–107. [Google Scholar] [CrossRef]
  43. Evaristo, J.; McDonnell, J.J.; Clemens, J. Plant source water apportionment using stable isotopes: A comparison of simple linear, two-compartment mixing model approaches. Hydrol. Process. 2017, 31, 3750–3758. [Google Scholar] [CrossRef]
  44. Chen, Y.; Helliker, B.R.; Tang, X.; Li, F.; Zhou, Y.; Song, X. Stem water cryogenic extraction biases estimation in deuterium isotope composition of plant source water. Proc. Natl. Acad. Sci. USA 2020, 117, 33345–33350. [Google Scholar] [CrossRef]
  45. Zhao, Y. An incorrect wetness-based correction method for deuterium offset. Proc. Natl. Acad. Sci. USA 2021, 118, e2026641118. [Google Scholar] [CrossRef] [PubMed]
  46. Barbeta, A.; Gimeno, T.E.; Clavé, L.; Fréjaville, B.; Jones, S.P.; Delvigne, C.; Wingate, L.; Ogée, J. An explanation for the isotopic offset between soil and stem water in a temperate tree species. New Phytol. 2020, 227, 766–779. [Google Scholar] [CrossRef] [PubMed]
Figure 1. Locations of three study sites at Mt. Baekwoon in the southern region of the Republic of Korea: Site 1 is a coniferous stand, Site 2 is a mixed stand, and Site 3 is a broadleaf stand.
Forests 15 00420 g001
Figure 2. (A) Schematic diagram of soil water extraction with suction cup lysimeters. (B) Field installation of suction cup lysimeters at five soil depths. (C) Examples of sampling bottles connected to Teflon tubes for soil water collection.
Forests 15 00420 g002
Figure 3. Schematic diagram of cryogenic vacuum distillation (CVD) system.
Forests 15 00420 g003
Figure 4. Water extraction process of the pressure chamber (PC) method.
Forests 15 00420 g004
Figure 5. The δ18O (a) and δ2H (b) values of the soil water samples extracted with suction cups were measured using cavity ring-down spectroscopy (CRDS) and isotope ratio mass spectrometry (IRMS). The solid lines indicate the 1:1 relationship between CRDS measurements and IRMS. The red solid line indicates the fitted line, and the black dashed line indicates the 95% confidence interval of the linear regression. RMSE, root-mean-square error. Differences in δ18O and δ2H values between the two instruments (c). Box size represents the interquartile range, the horizontal solid black line within the boxes is the median, and the whiskers indicate variability outside the upper and lower quartiles.
Forests 15 00420 g005
Figure 6. Comparisons of xylem water isotope ratio (δ18O) values determined by cryogenic vacuum distillation (CVD) in nine species during various extraction times. Different letters indicate significant differences (p < 0.05).
Forests 15 00420 g006
Figure 7. Comparisons of xylem water isotope ratio (δ2H) values determined by cryogenic vacuum distillation (CVD) in nine species during various extraction times. Different letters indicate significant differences (p < 0.05).
Forests 15 00420 g007
Figure 8. Dual isotope plots for stem water extracted using cryogenic vacuum distillation (CVD) and pressure chamber (PC) (a) and CVD and induction module (IM) (b). The light-gray-shaded area indicates the 95% confidence interval of the linear regression (black dashed lines). The black solid line is the global meteoric water line (GMWL) and the red solid line is the local meteoric water line (LMWL).
Forests 15 00420 g008
Figure 9. The δ2H and δ18O values of the stem water samples extracted using cryogenic vacuum distillation (CVD) and pressure chamber (PC) (a,b) or induction module (IM) (c,d). Solid lines indicate a 1:1 relationship between CVD and IM or PC. Black dashed lines represent the linear regression.
Forests 15 00420 g009
Figure 10. The δ2H (a) and δ18O (c) values of stem water samples from [11,25,30], and this study. Solid lines indicate the 1:1 relationship between cryogenic vacuum distillation (CVD) versus induction module (IM) or pressure chamber (PC). Differences in δ2H (b) and δ18O (d) values between CVD versus IM (CVD–IM) and CVD versus PC (CVD–PC). The box size represents the interquartile range, the horizontal solid black line within the boxes is the median, and the whiskers indicate variability outside the upper and lower quartiles.
Forests 15 00420 g010
Table 1. Information on stem samples collected for comparison of three extraction methods for xylem water.
MethodSpeciesNumber of Samples
PC and CVDP. densiflora3
C. laxiflora3
C. obtusa4
S. obassia2
IM and CVDP. densiflora6
C. obtusa8
S. obassia2
Table 2. Soil physical and chemical characteristics by soil depth (±1 SD).
Soil Depth (cm)Sand (%)Silt (%)Clay (%)Total C (%)Total N (%)pH (H2O)CEC (cmolc kg−1)
1044.8 ± 4.141.9 ± 3.913.2 ± 0.64.8 ± 0.50.36 ± 0.034.54 ± 0.094.28 ± 0.27
3044.7 ± 4.940 ± 4.415.3 ± 1.53.26 ± 0.570.25 ± 0.044.7 ± 0.053.23 ± 0.3
5045.5 ± 4.337.6 ± 6.416.9 ± 3.32.19 ± 0.930.16 ± 0.044.74 ± 0.072.75 ± 0.23
10054.4 ± 15.325.6 ± 9.520 ± 6.30.73 ± 0.470.06 ± 0.035.2 ± 0.342.27 ± 0.51
12051.1 ± 17.226.6 ± 9.422.4 ± 8.50.6 ± 0.30.07 ± 0.025.39 ± 0.042.45 ± 0.5
Table 3. Correlation between differences in each isotope and soil properties by soil depth.
IsotopeSoil Depth (cm)Paired t-TestPearson’s Correlation Coefficient (r)
pSandSiltClayTotal CTotal NpHCEC
δ2H100.060−0.1770.1410.288−0.0830.024−0.3280.731
30<0.0010.577−0.378−0.7930.7620.529−0.196−0.419
50<0.0010.1690.185−0.5780.4090.411−0.2450.011
1000.0620.566−0.431−0.7220.103−0.0590.329−0.696
120<0.050.295−0.032−0.5160.4700.3860.059−0.264
δ18O100.129−0.3760.403−0.025−0.312−0.156−0.0160.609
300.6250.388−0.115−0.949 *0.987 **0.949 *−0.5740.275
50<0.001−0.7790.914 *−0.7520.8670.823−0.6810.498
100<0.050.455−0.322−0.6170.2620.016−0.082−0.501
1200.0530.740−0.574−0.833−0.025−0.162−0.044−0.539
Bold indicates r > 0.5 or r < −0.5, and p-value less than 0.05 and 0.01 is indicated by * and **, respectively.
Disclaimer/Publisher’s Note: The statements, opinions and data contained in all publications are solely those of the individual author(s) and contributor(s) and not of MDPI and/or the editor(s). MDPI and/or the editor(s) disclaim responsibility for any injury to people or property resulting from any ideas, methods, instructions or products referred to in the content.

