Article

Effects of Stand Density, Age, and Drought on the Size–Growth Relationship in Larix principis-rupprechtii Forests

1
College of Forestry, Hebei Agricultural University, Baoding 071000, China
2
State Key Laboratory of Efficient Production of Forest Resources, Key Laboratory of Tree Breeding and Cultivation of State Forestry and Grassland Administration, Research Institute of Forestry, Chinese Academy of Forestry, Beijing 100091, China
*
Author to whom correspondence should be addressed.
Forests 2024, 15(3), 413; https://doi.org/10.3390/f15030413
Submission received: 17 January 2024 / Revised: 18 February 2024 / Accepted: 20 February 2024 / Published: 21 February 2024
(This article belongs to the Section Forest Inventory, Modeling and Remote Sensing)

Abstract

:
The size–growth relationship (SGR) quantifies growth partitioning among different sized trees in a stand and helps to elucidate stand growth dynamics during stand development. SGR strongly correlates with stand density, stand age, and drought severity. This study focused on larch (Larix principis-rupprechtii (Mayr)) forests with different stand ages (17–19 years, 20–29 years, 30–39 years, and 40–46 years) and stand densities (300–1400 trees·ha−1 and 1400–3300 trees·ha−1) as the research subjects. Employing a linear mixed model, we aimed to quantify the effects of stand density, stand age, and drought index on SGR. The results revealed that the Gini coefficient had a significant variation between high-density and low-density larch stands (p < 0.01). Stand age, stand density, and drought index exerted varying degrees of influence on the growth dominance coefficient (GD) and SGR of larch forests. In stands aged less than 39 years, a pronounced growth advantage of large trees over small trees was evident (typically SGR > 1 and GD > 0), indicating a positive growth dominance stage where large trees dominated. Compared to high-density stands, low-density stands exhibited a notably greater positive growth dominance. After 40 years, the growth stage transitioned to a relatively symmetric stage (SGR approximately equal to 1), with a discernible shift towards a reverse growth dominance stage (GD < 0). Compared to stand density and stand age, the drought index had a more influential effect on SGR. As drought severity increased, SGR increased, amplifying the growth advantage of large trees over small ones. The findings underscored the significance of adjusting stand density and optimizing tree size structure to enhance larch resilience against the warming and drying effects.

1. Introduction

Stand structure is an important characteristic of forests, significantly influencing forest productivity and stability [1,2]. During forest succession, trees compete for environmental resources such as light, nutrients, and water. Given their enhanced competitiveness [3,4], larger trees typically gain more resources and nutrients relative to their smaller counterparts. The evaluation of effective resource utilization among trees of different sizes in a forest stand is commonly characterized by the size–growth relationship (SGR) due to its simplicity in measurement [5]. SGR facilitates the quantification of growth partitioning among trees, shedding light on stand growth dynamics and the mechanisms governing competitive interactions during stand development [6,7]. During stand development, SGR generally exhibits three distinct patterns: asymmetric, symmetric, and inversely asymmetric [8]. A symmetric pattern (SGR = 1) indicates proportional growth with tree size, while an asymmetric pattern (SGR > 1) implies that larger trees exhibit higher relative growth rates than small ones. Conversely, an inversely asymmetric pattern (SGR < 1) denotes a scenario where the relative growth rate of small trees surpasses that of large trees. The intensity of competition between trees of different sizes undergoes changes during stand development [3], consequently influencing SGR patterns.
From the early to the advanced stages of stand development, SGR may pass through symmetric, asymmetric, and inversely asymmetric stages [9], or transition directly from asymmetric to symmetric [10]. However, in managed Pinus resinosa stands, SGR consistently demonstrates a symmetric pattern throughout stand development [11]. The temporal variability in SGR patterns may be related to the shade tolerance of tree species and stand density [12]. Binklyd et al. [13] propose that SGR pattern depends on stand age, stand density, and tree size variability. In addition to age and density, an increasing body of research indicates that SGR responds differently to climate change during the growth process [14,15,16]. During drought years, tree growth rate decreases significantly, altering the relationship between tree size and growth [5]. Looney et al. [7] observed a decrease in SGR associated with drought, while Trouvé [17] believes that SGR increases during climatic drought. A higher SGR suggests a rapid growth of large trees, leading to an increase in size inequality within the stand [6]; conversely, a lower SGR indicates relief in growth pressure on small trees, leading to a reduction in size inequality [11].
Similar to SGR, the growth dominance coefficient (GD) serves as a valuable metric for quantifying the relationship between tree size and growth [4]. It reflects the relative contribution of tree groups of different sizes to the overall stand growth. When the contribution of large trees surpasses that of small trees, the stand exhibits strong positive growth dominance. Conversely, if small trees play a more significant role in stand growth, the stand exhibits negative growth dominance. Throughout stand development, the growth dominance pattern can generally be divided into four stages: neutral growth dominance (GD = 0), positive growth dominance (GD > 0), a stage characterized by trees with similar relative dominance (GD = 0), and a stage of reverse growth dominance where smaller trees contribute more to growth (GD < 0) [1,18]. Some studies have shown that shift in growth dominance is associated with stand density and is influenced by tree competition interactions [19], resource availability, and other factors [20,21]. The GD has been widely used to assess the effect of stand age and density on stand growth [4,22]. Together, SGR and GD provide a comprehensive understanding of the intricate relationship between tree size and growth [23].
Larch (Larix principis-rupprechtii Mayr) is one of the main timber cultivation species in China, renowned for its rapid growth, adaptability, and versatile applications [24]. Despite these attributes, larch forests face challenges related to suboptimal quality, leading to lower productivity and stability, thereby hindering the realization of the forests’ multifunctional benefits [25]. Previous studies have suggested that the growth of larch forests is mainly influenced by factors such as neighboring competition, stand age, and site conditions [24,25]. Additionally, drought has differential effects on the growth of large and small larch trees [26], with younger stands experiencing more significant impacts from drought events [17,27]. However, few studies have explored larch growth dynamics and the mechanisms of competitive action based on drought intensity, tree size, and growth relationships. To address these gaps, this study aims to clarify the response mechanism of tree size and growth relationships in larch forests under different drought conditions, stand ages, and stand densities based on SGR and GD indices. The study seeks answers to the following three questions: (1) How do patterns of stand size–growth relationships change with increasing stand age in larch forests? (2) How does stand density impact stand differentiation, and how does it affect stand size–growth relationships? (3) How does drought affect tree size–growth relationships?

2. Materials and Methods
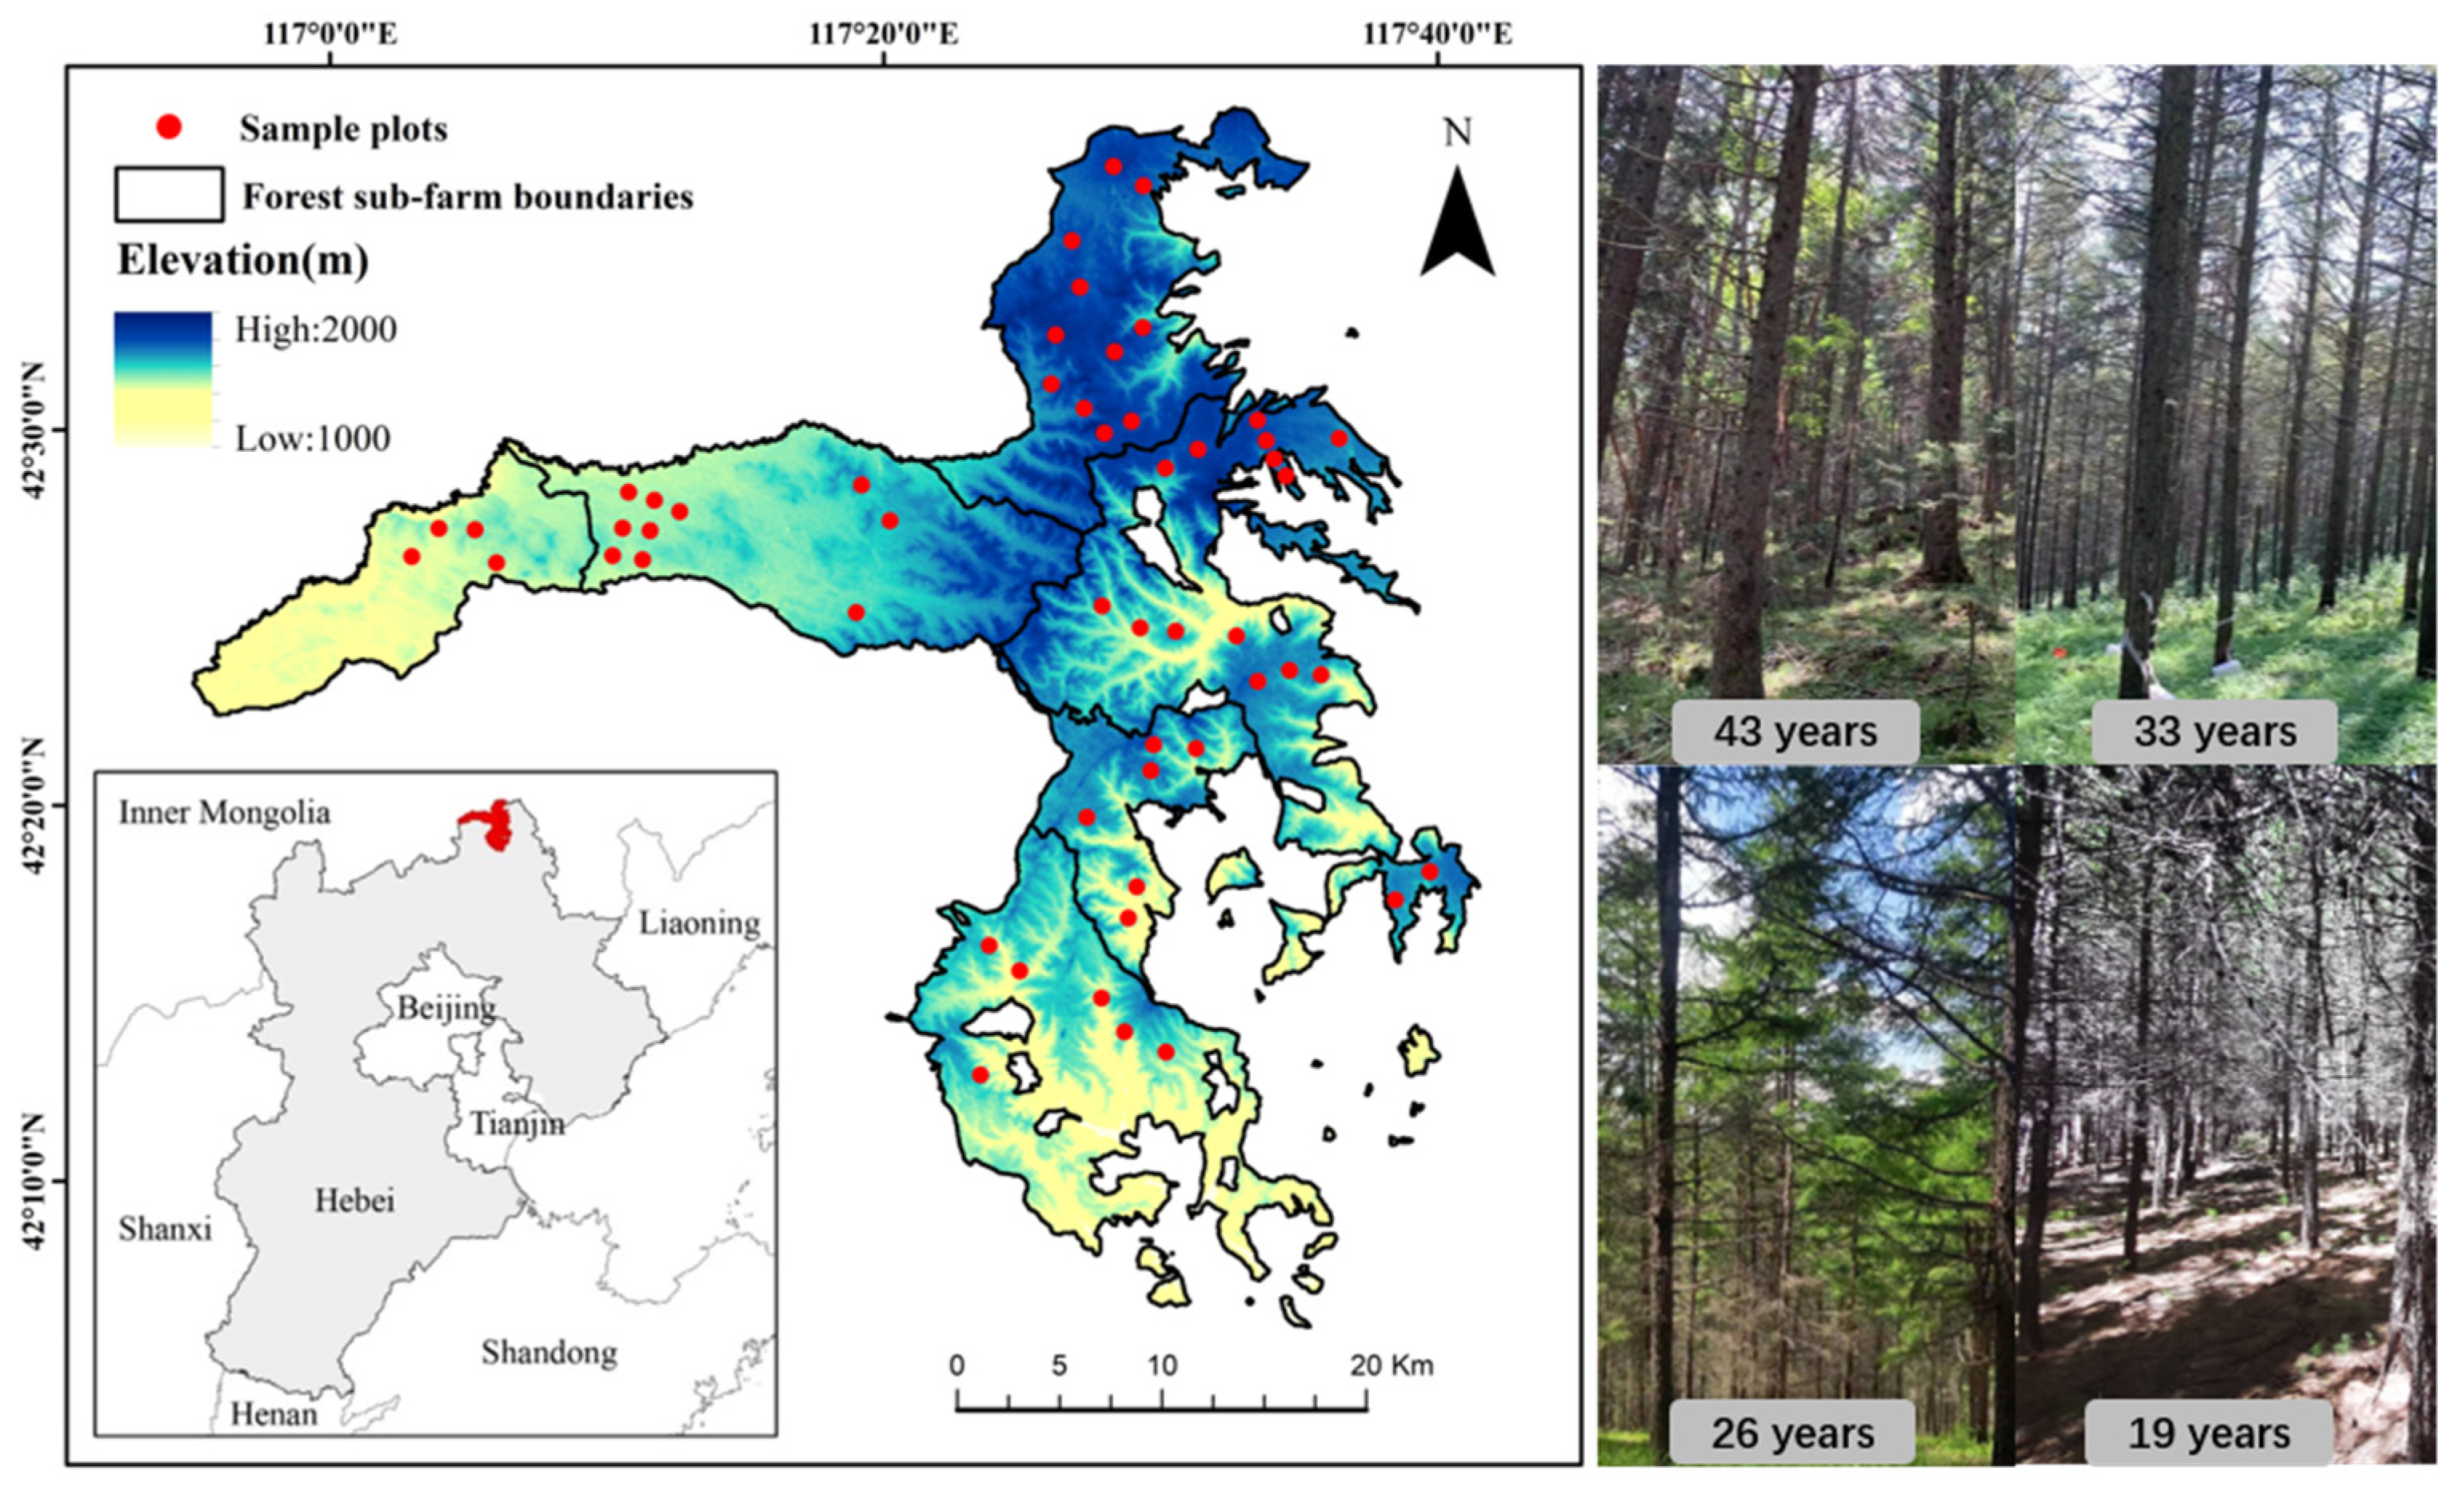
2.1. Study Area

The study area is located in the Saihanba Mechanical Forest Farm in the northern part of Chengde City, Hebei Province, China (116°53′–117°31′ E, 42°22′–42°31′ N). The topography of the region is characterized by hills and plateaus, with elevations ranging from 1010 m to 1940 m. The prevailing climate is a cold temperate continental monsoon climate. The average annual temperature is −1.40 °C, with extreme maximum and minimum temperatures recorded at 33.4 °C and −43.3 °C, respectively. The average annual precipitation is 460 mm and the evaporation is 1230 mm [28]. The predominant soil type is dark grey forest soil. Tree species in the study area include larch, Pinus sylvestris L. var. mongholica Litv., Betula platyphylla Suk., Picea asperata Mast., etc., with larch as the dominant tree species. The SI of larch in the study area ranges from 6.5 m to 13.0 m (base age: 20 years) [28].

2.2. Data Collection

2.2.1. Study Plots and Sample Trees

In July to September from 2019 to 2022, using a stratified random sampling survey method, we conducted field surveys in pure larch forests with different stand ages (17–19, 20–29, 30–39, and 40–46 years) and stand densities (300–1400 trees·ha−1 and 1400–3300 trees·ha−1). A total of 55 plots were established in the study area (Figure 1). The plot size was 20 m × 30 m. All trees with a diameter at breast height (DBH) greater than 5 cm within the sample plots were measured and recorded. The survey indicators included species name, DBH, tree height, crown width, and the relative coordinates of the trees. We measured the DBH using a breast gauge, tree height using a height meter, crown width using a steel ruler, and the relative coordinates of the trees using a rangefinder. For tree core sampling, at least one sample tree per diameter class was selected from the survey plots. Using an increment border, two cores were drilled in each sample tree, oriented in the eastern and northern directions. A total of 832 core samples were collected. Subsequently, the core samples underwent a series of procedures, including drying, fixing, and polishing. Cross dating was performed, and annual ring widths were measured using the WinDENDRO image analysis system 2022b (Regent Instruments Inc., Quebec, QC, Canada) [29] with an accuracy of 0.001 mm. The sequence of annual ring widths was examined using the COFECHA 3.0 program (The University of Arizona, Tucson, AZ, USA) [30]. The basic details of the sample plots are summarized in Table 1.

2.2.2. Climate

To assess the effect of drought on SGR, climatic data were generated using the latitude, longitude, and elevation of the sample plots through ClimateAP v3.10 software (University of British Columbia, Vancouver, BC, Canada) [31]. The ClimateAP software [31] uses bilinear interpolation and local elevation adjustment approaches to downscale and generate scale-free, high-precision climate datasets for random points in the Asia-Pacific region. Recognizing the substantial influence of precipitation and temperature during the growing season (June to August) on the tree growth [32], we focused on mean annual precipitation (MAP) and mean annual temperature (MAT) for this period. Subsequently, these were used to calculate the mean annual hygrothermal index (AHM) as an indicator of drought [33,34]. The formula for AHM is as follows:
A H M = ( M A T + 10 ) / ( M A P 1000 )
The AHM values in the study area ranged between 19.8 and 27.9.

2.3. Statistical Analysis

2.3.1. Calculation of Size Inequality

The Gini coefficient (GI) was used to measure the size distribution of trees [35]. GI, ranging between [0, 1], reflects the uniformity of tree size distribution in a stand. A GI close to 0 suggests an absolutely uniform size distribution, where all trees are precisely equal in size. Conversely, a GI nearing 1 indicates a high degree of variability in tree size. Compared to other indicators, basal area has obvious advantages in practicality and accuracy [36]. In this study, basal area was employed to calculate the GI [18], and the calculation was performed using the following formula:
G I = 2 i = 1 n i B A i n i = 1 n B A i n + 1 n
where n represents the number of trees in the sample plot; B A i represents the ith tree basal area in the sample plot.

2.3.2. Calculation of Productivity

Forest growth was expressed using basal area increment (BAI). BAI for each sample tree was calculated using the formula [37]:
B A I = π × R t i 2 R t 0 2 t i t 0
where BAI represents the average basal area increment (cm2·year−1) between t i and t 0 ; R t i and R t 0 are the radii at t i and t 0 , respectively.
Stand level productivity was calculated by estimating the weighted BAI of all trees using the DBHc/DBHss in the sample plot. The DBHc was the square of the diameter of the object tree. The DBHss was the mean square of diameters of all trees in the stand.

2.3.3. Calculation of the Size–Growth Relationship

SGR is the slope of the linear regression between the proportional stand growth and proportional tree size [38]. Basal area at height 1.30 m and basal area increment were used as measures of tree size and growth [14], and a center log-ratio transformation was applied to both growth and size in order to ensure that the intercept was equal to 0 [39]. A value of SGR = 1 indicates that tree growth is proportional to size and that size growth is perfectly symmetric; SGR > 1 indicates that size is asymmetric and that the growth rate of a large tree is too high; SGR < 1 indicates that the growth rate of a large tree is too low; and SGR ≈ 0 indicates that tree growth is absolutely equal regardless of size.

2.3.4. Calculation of Growth Dominance Coefficient

As defined by West [40], the growth dominance coefficient (GD) is calculated by subtracting the area under the growth dominance curve from the area under the 1:1 line. The growth dominance curve is plotted with relative cumulative relative basal area on the x-axis and cumulative relative basal area growth on the y-axis. The GD values range from −1 to 1. GD = 0 indicates that a proportional contribution of tree growth to total stand growth based on size; GD < 0 indicates that smaller trees contribute more to stand growth than to stand basal area (above the 1:1 line), while GD > 0 suggests that larger trees contribute disproportionally more to stand growth (below the 1:1 line). The GD was calculated using the following formula:
G D = 1 i = 1 n s i s i 1 φ i + φ i 1
where i is the order of the trees in each stand; s i and s i 1   are the cumulative proportional basal area of tree i and tree i − 1; φ i and φ i 1 are the cumulative proportional basal area increment of tree i and tree i − 1.

2.3.5. Construction of the Linear Mixed Model

To quantify the impacts of stand age, stand density, and drought severity on SGR, we developed models specifically for SGR. Recognizing the influence of sample plot variations on SGR, we added sample plots as a random effect to the model to eliminate variability arising from differences in sample plots. A linear mixed effects model was constructed using the lme4 package [41] in R 4.1.3 software (R Foundation for Statistical Computing, Vienna, Austria) [42]. The null hypothesis model was initially formulated as a linear mixed model with SGR as the dependent variable, stand density as the independent variable, and sample plots as a random effect. Subsequently, interaction terms involving stand age, drought indicator, and stand age and stand density were progressively introduced into the model as independent variables (Table 2). Evaluation metrics, including Coefficient of Determination (R2), Akaike Information Criterion (AIC), Bayesian Information Criterion (BIC), and Mean Absolute Error (MAE), were calculated to select the optimal model.
One-way ANOVA with the least significant difference (LSD) test was used to analyze the significant differences in GI, SGR, and GD among stand ages and stand densities. Linear regression was used to analyze the relationship between SGR and GD. All analyses were performed using R 4.1.3 [42].

3. Results

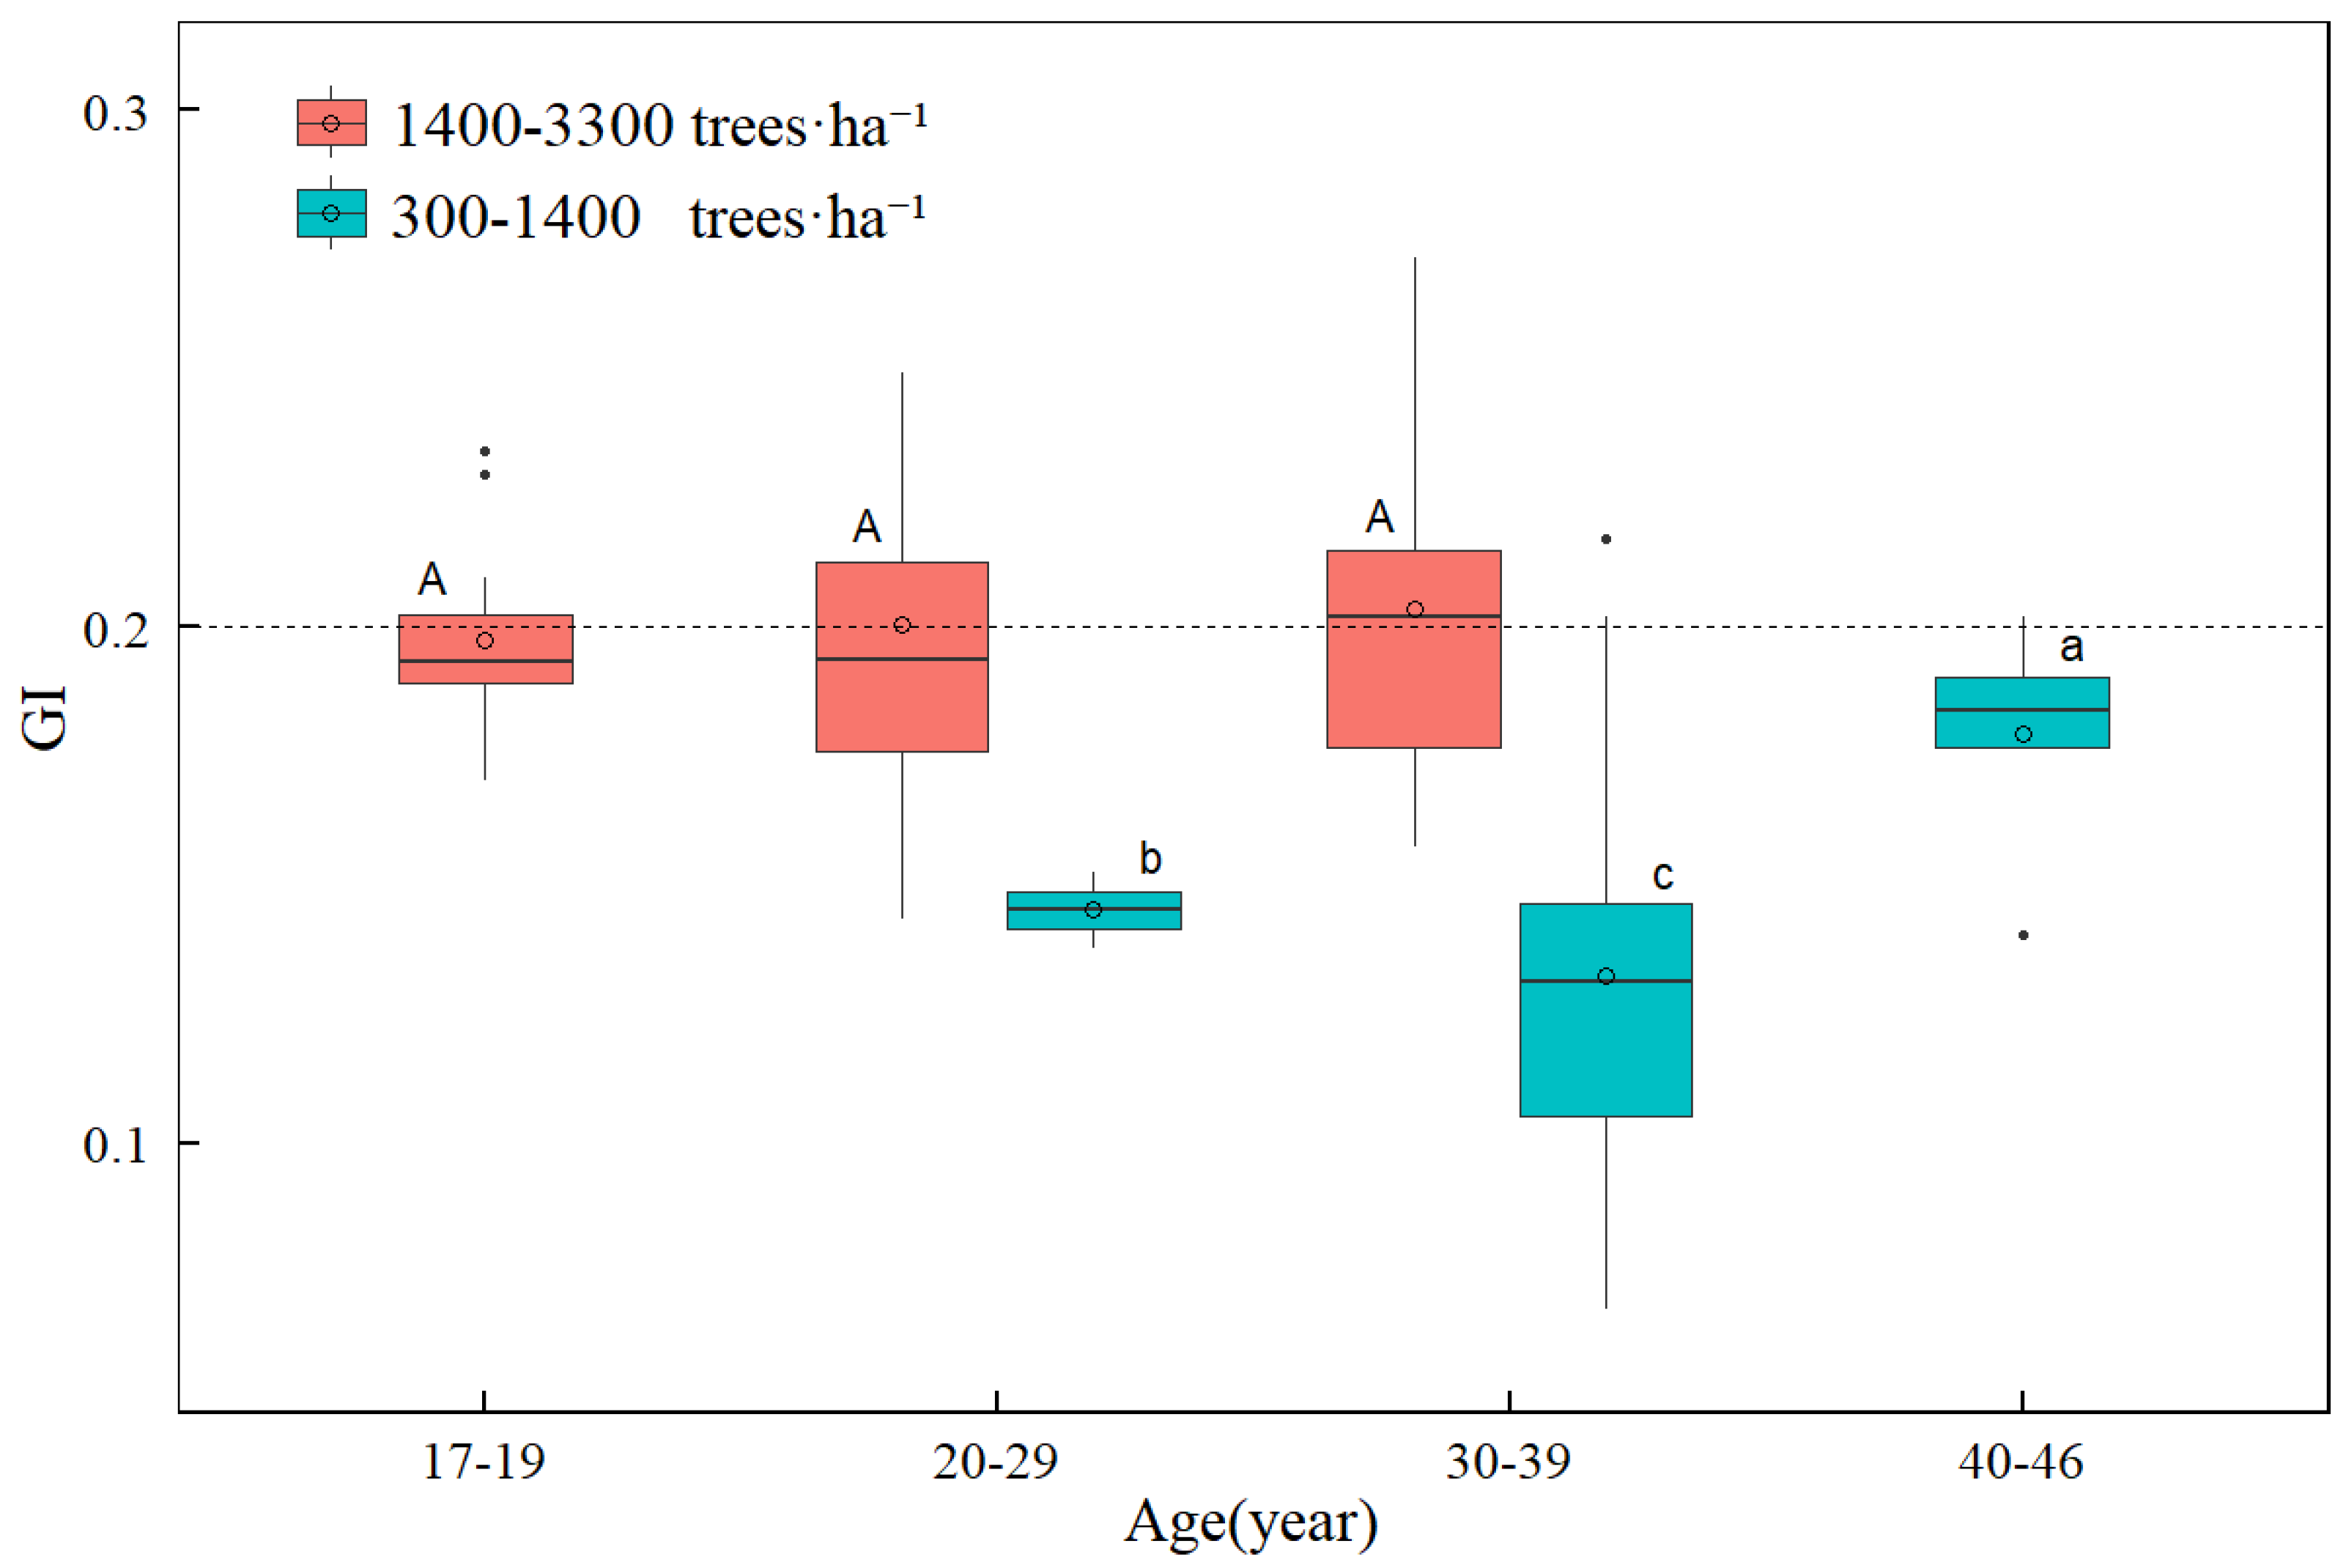
3.1. Change in Size Inequality with Tree Age and Stand Density

Stand density exhibited a significant impact on GI (p < 0.01), which tended to increase with stand density (Figure 2). In high-density stands (1400–3300 trees·ha−1), GI demonstrated minimal variation with age. Conversely, in low-density stands (300–1400 trees·ha−1), GI showed a significant increasing trend after 40 years of stand age. Notably, in high-density stands, which usually had higher GI, greater size inequality was observed compared to low-density stands of the same age class.

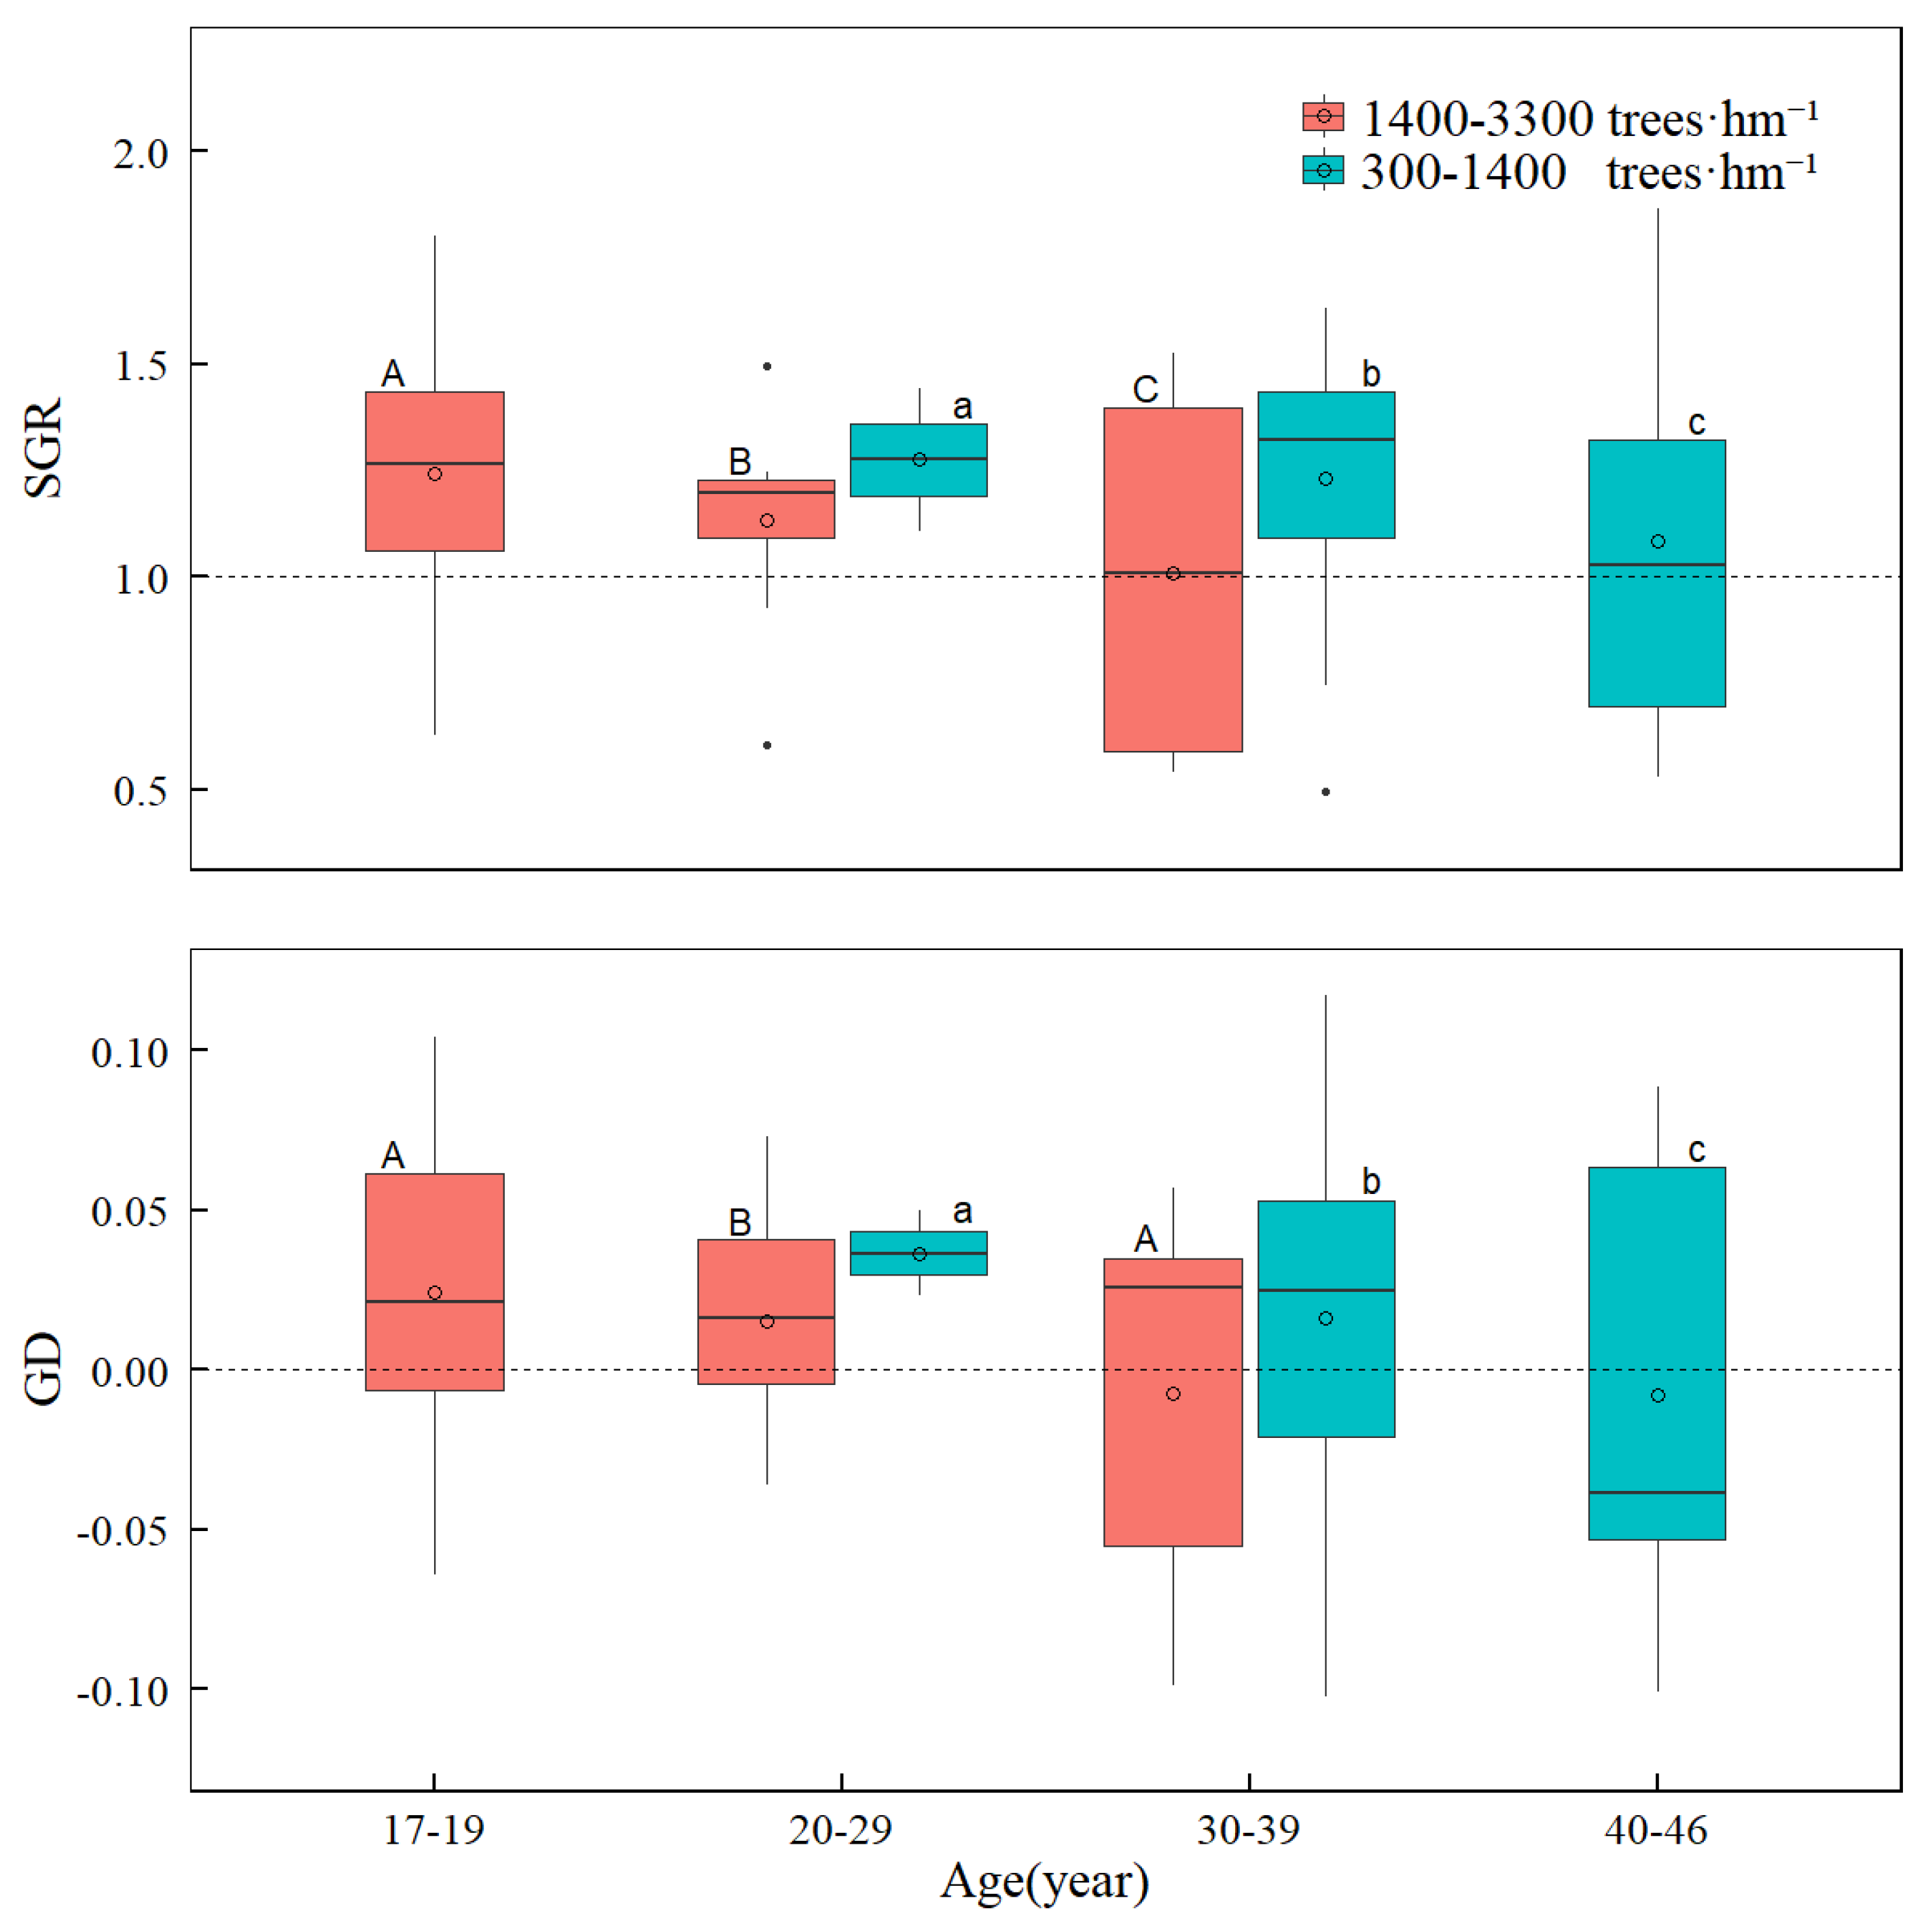
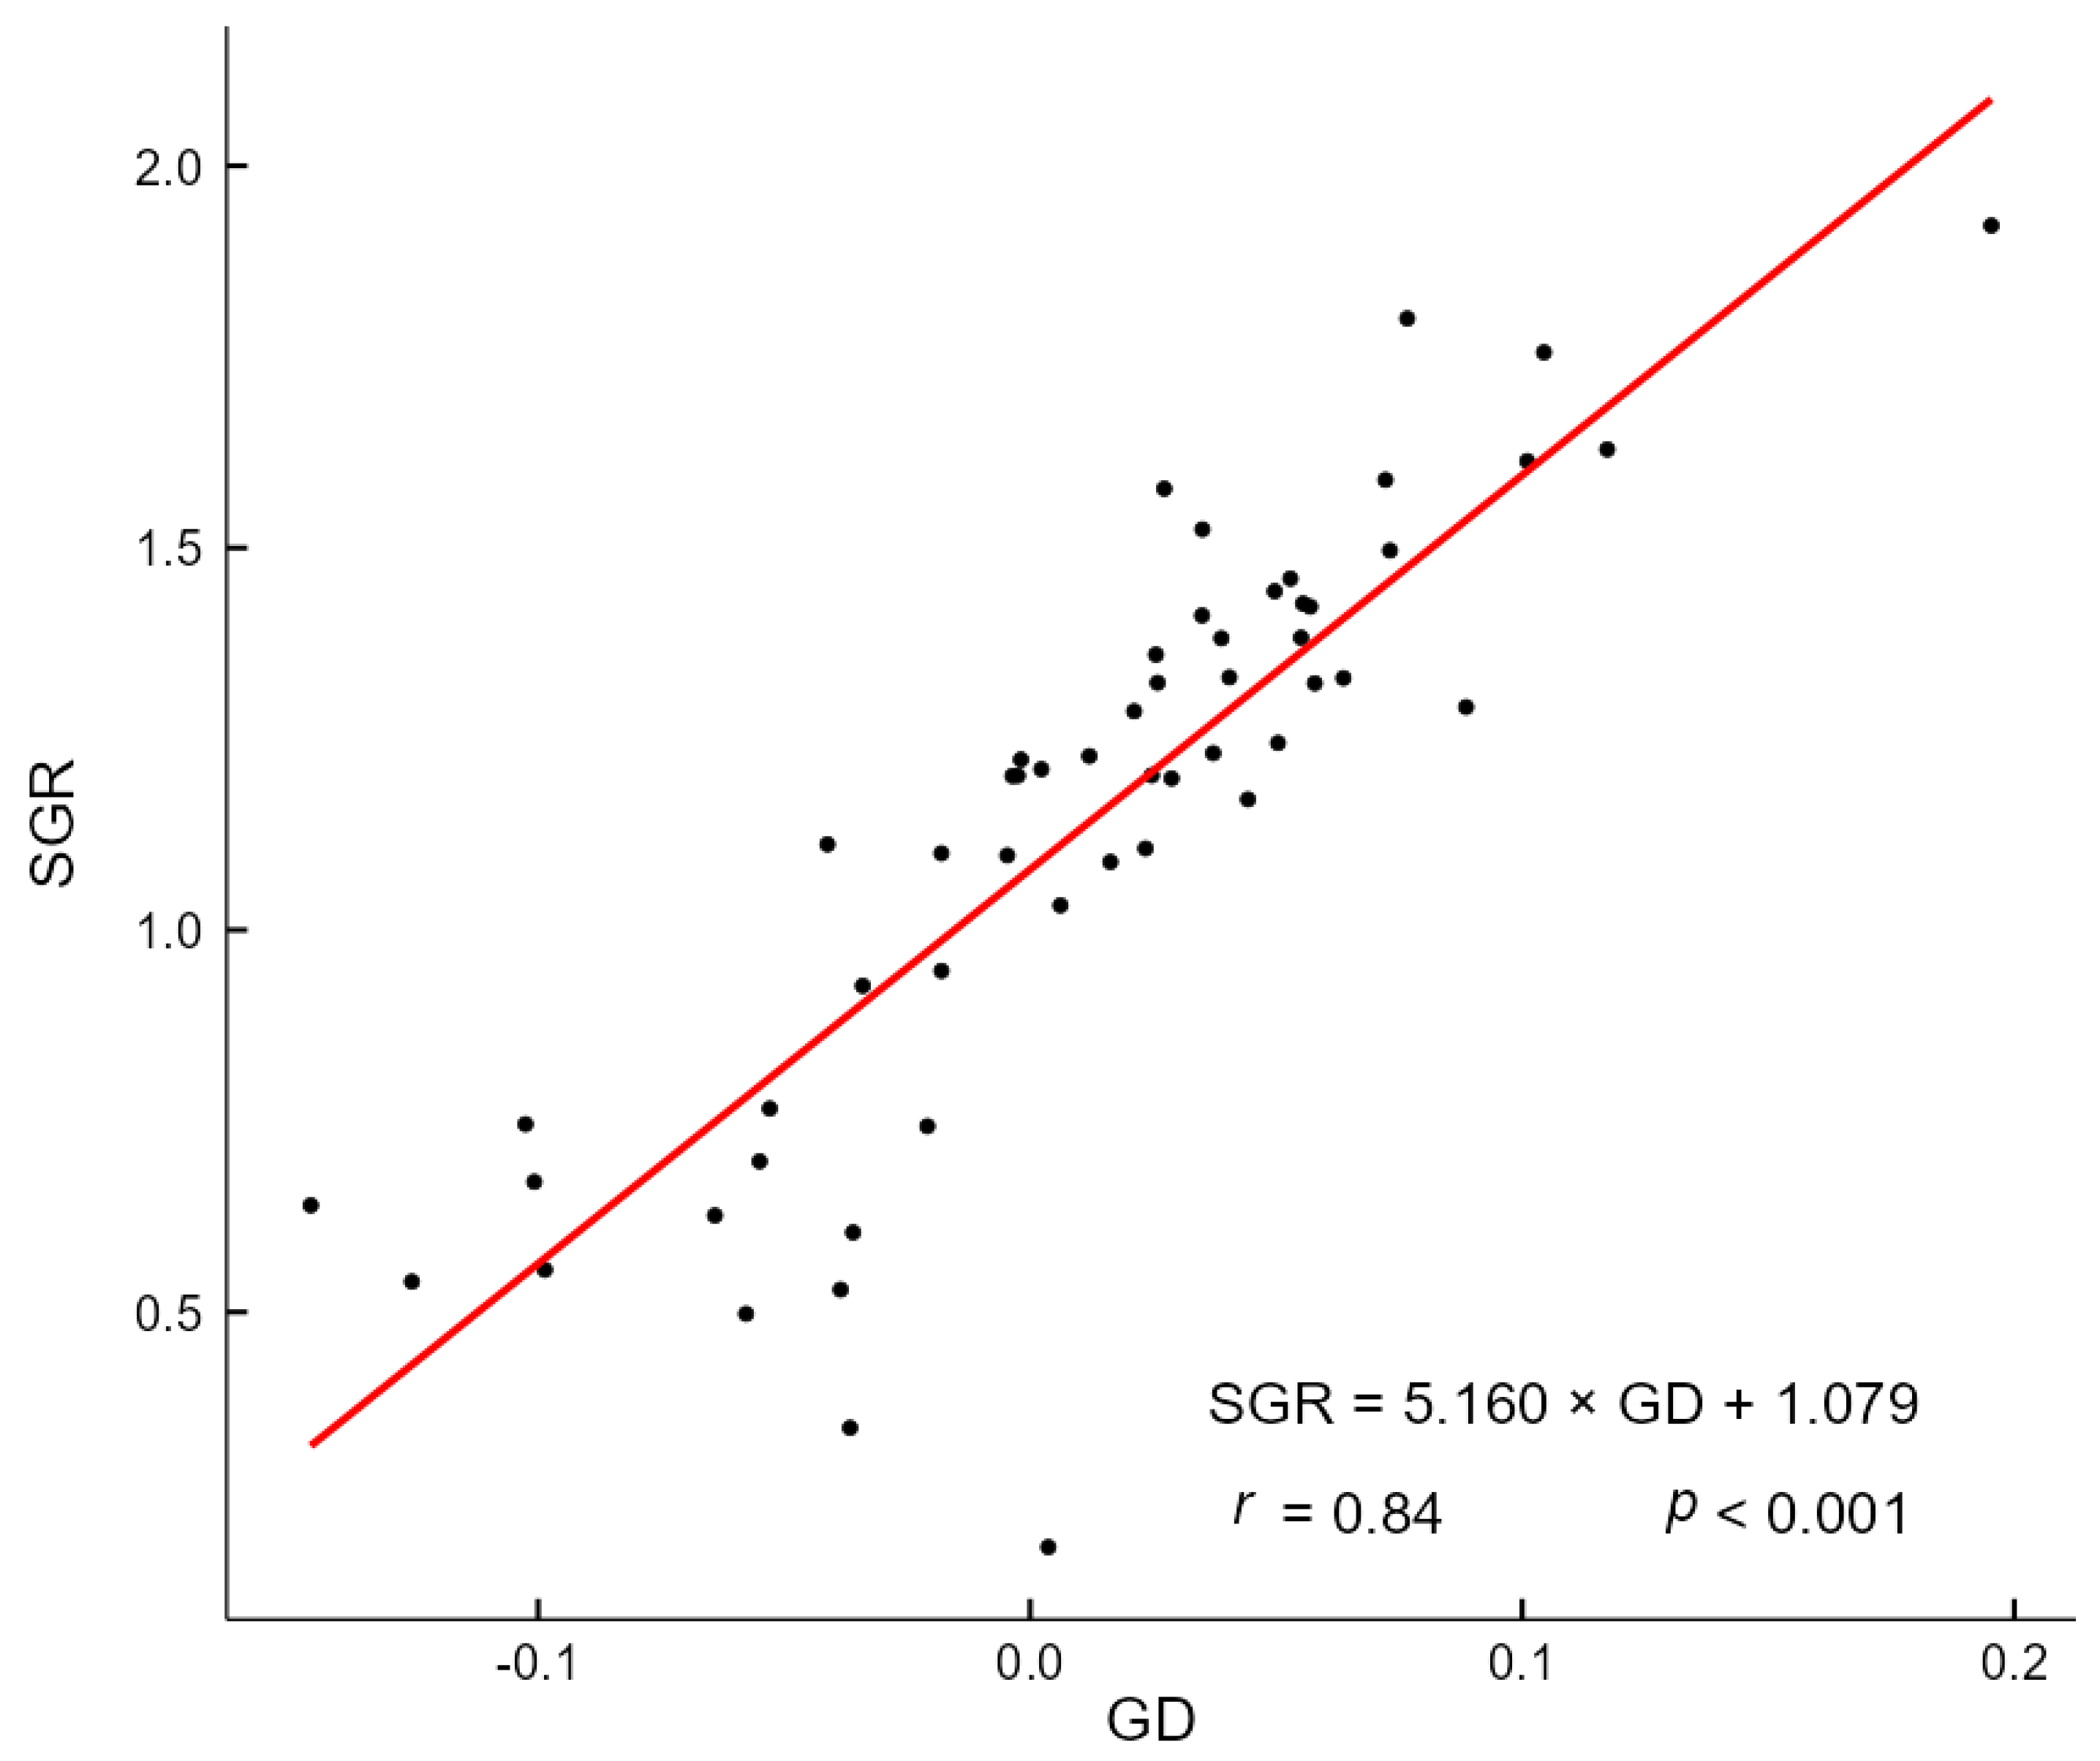
3.2. Change in SGR and GD with Tree Age and Stand Density

In stands aged 39 years or less, SGR was significantly greater than 1, indicating asymmetric growth characterized by the dominance of large trees (Figure 3). At the same stand age, SGR was always higher in low-density stands than in high-density stands. The decline in SGR was significant with age across different density classes. In stands aged >40 years, SGR transitioned from greater than 1 to less than 1, signifying a shift from asymmetric to symmetric competition in growth dominance. In low-density stands, SGR was consistently greater than 1, whereas in higher-density stands, SGR tended to decrease with age until approaching 1.
In stands less than 39 years, GD showed values greater than 0, indicating asymmetric growth characterized by the dominance of large trees. GD in low-density stands showed a decreasing trend with age. Conversely, GD in high-density stands showed a slightly increasing trend with age. GD in low-density stands was higher than that in high-density stands in stands aged 20–29 years.
A notable correlation between SGR and GD was observed (r = 0.729) (Figure 4). The trends in SGR and GD demonstrated strong similarity, reinforcing the connection between these two parameters.

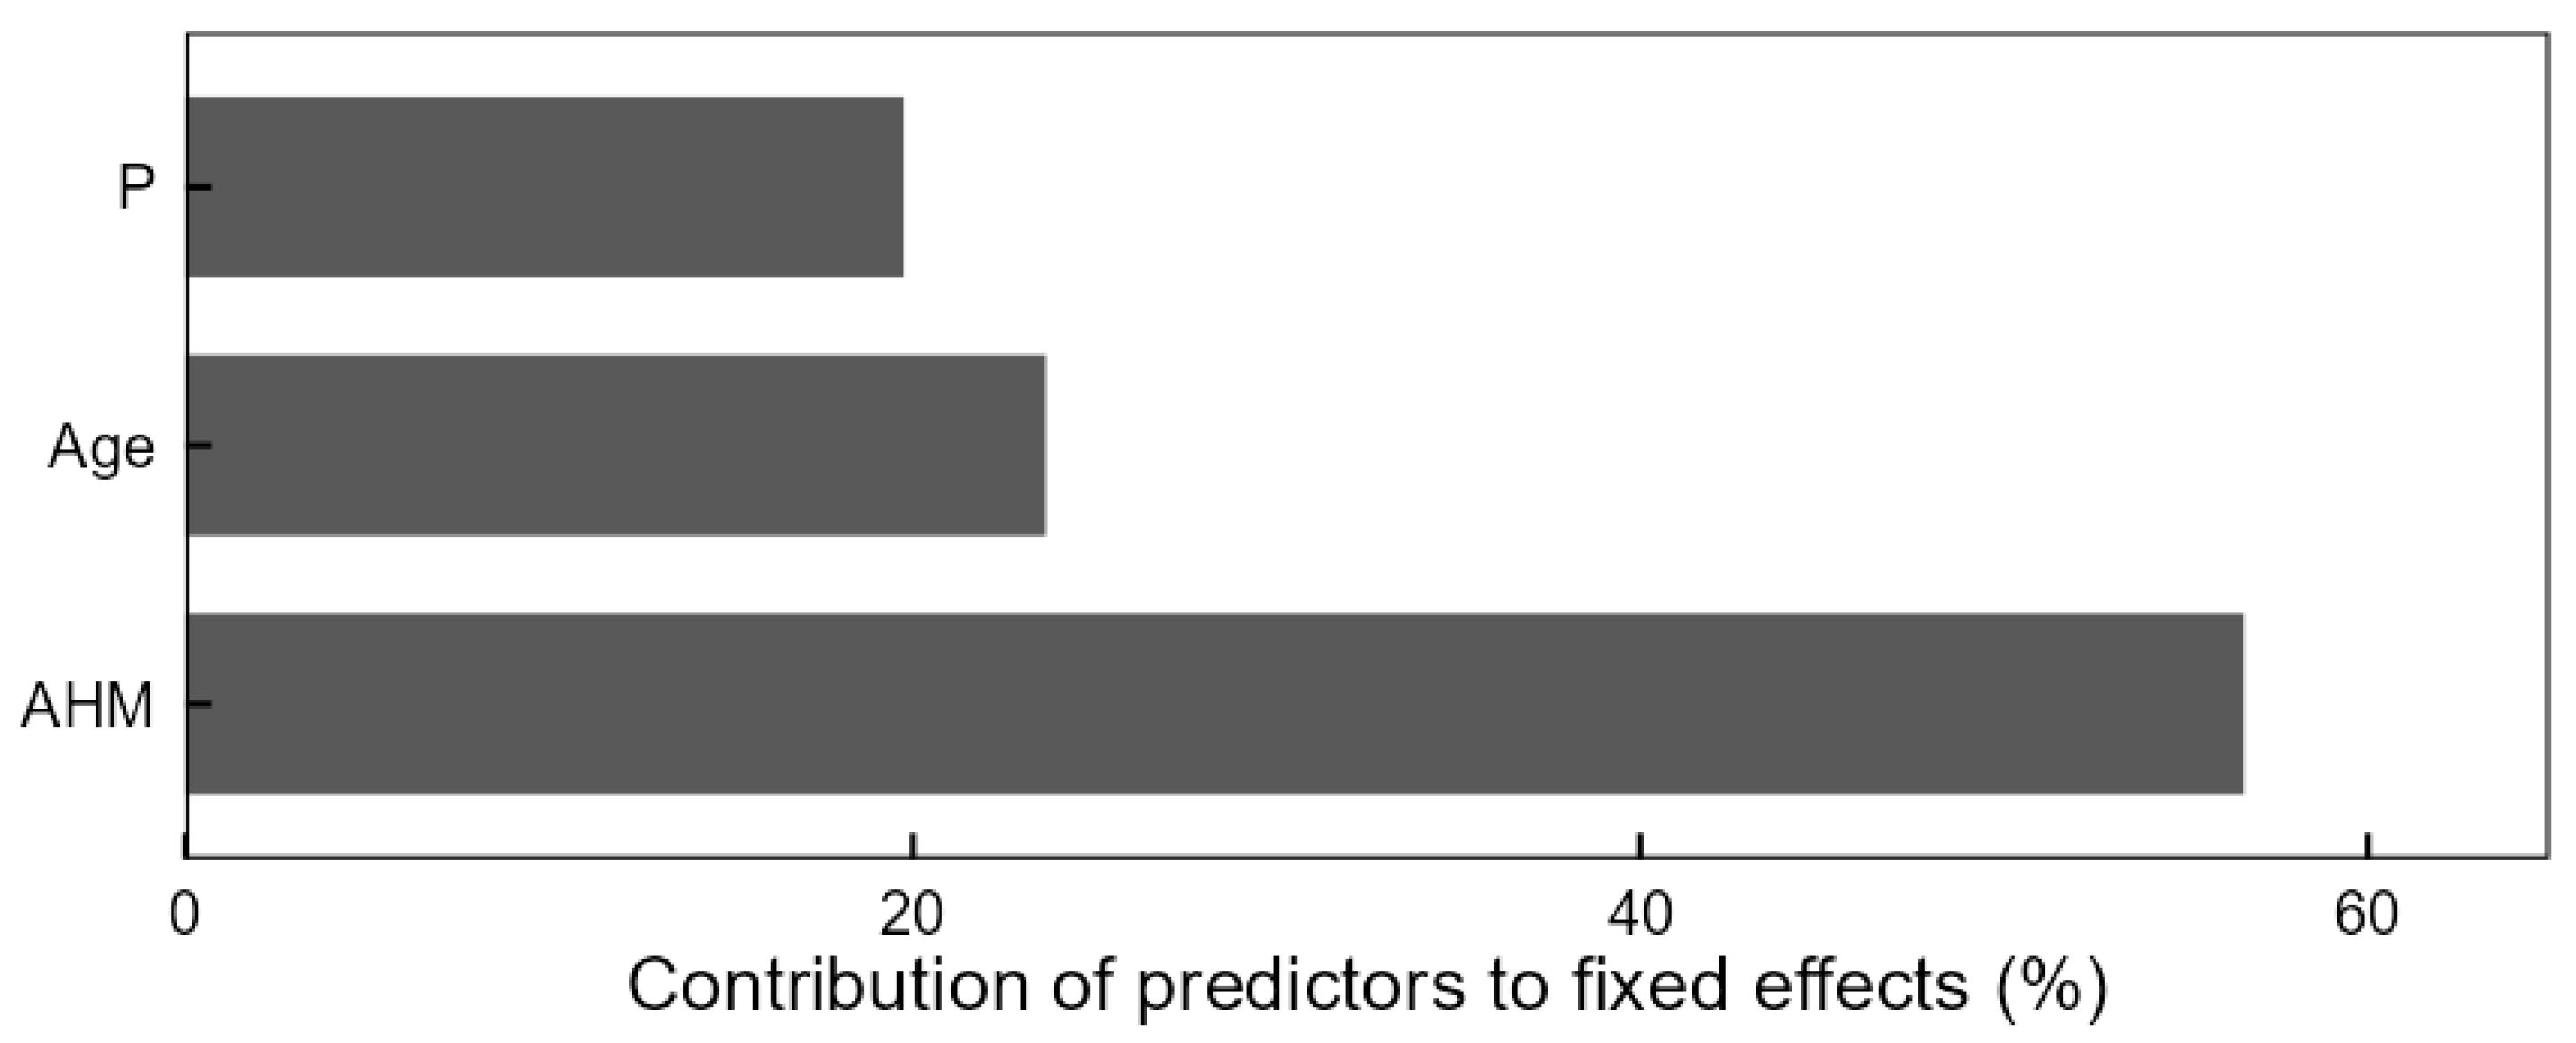
3.3. The Impact of Drought on Size–Growth Relationship

The values of R2, AIC, BIC, and MAE of the model SGR4 were 0.47, 69.52, 79.56, and 0.21, respectively, indicating more accurate predictions than other models, especially the null model (Table 3). The results of the mixed effects model showed that the drought indicator (AHM) was significantly and positively correlated with SGR (p < 0.01). AHM played a predominant role in explaining SGR, accounting for over 56% of the model’s explanatory power, surpassing the contributions of stand density (20%) and stand age (24%) (Figure 5).

4. Discussion

4.1. Effects of Stand Age and Stand Density on Size Inequality

The main reasons for the variation in individual growth within a stand are the differences in their efficiency in acquiring and utilizing growth resources, as well as differences in the supply capacity of habitats in terms of light, soil moisture, and nutrients [36,43]. These discrepancies result in the variability of tree sizes within a stand [44], exerting a significant influence on stand competition dynamics [36]. Stand structural heterogeneity, as measured by the Gini coefficient, is strongly associated with stand density [6]. In stands characterized by low density and a stand age below 40 years, the trend of the GI with age was not obvious. This is attributed to the more abundant growing space, mitigating differences in resource utilization and stand growth. However, as tree individuals continue to grow, intraspecific competition increases, leading to increased tree size differentiation in the stand [45]. Consistent with this, Looney et al. [46] found that GI increased with stand age in unthinned Pinus resinosa forests, suggesting that this phenomenon is more pronounced in older forests.
The impact of stand density on GI was more significant compared to stand age. Our study indicated that GI was significantly higher in high-density stands than in low-density stands. The same pattern in GI was found in other plantations [47,48,49]. As stand density increased, the differentiation between individuals became more significant before canopy close occurred. The ongoing growth led to intense intraspecific competition within the stand, resulting in increased size inequality [50].
It is crucial to acknowledge that the impact of stand density on the GI is a complex process influenced by multiple factors. Metsaranta’s study [9] revealed that the GI initially increased slightly and then gradually decreased with rising mortality rates. Furthermore, varying planting densities and management approaches also played a role in influencing the Gini coefficient. In populations with high tree densities, Gini increased at a faster rate, while in populations with low densities, the increase was slower [51].

4.2. Effects of Stand Age and Stand Density on Size–Growth Relationship

Competition for light is considered to be the main competitive process in stands, and its asymmetric competition is an important mechanism influencing tree size differentiation [18,52]. This study’s results showed a general decreasing trend in SGR, changing with stand age from SGR > 1 to SGR ≈ 1. The above result implied that the growth dominance shifted from asymmetric competition to relatively symmetric competition [53]. This is consistent with the study of Looney et al. [7] on size–growth relationships in western US forests. The large SGR in young and middle-aged forests may be due to the dominance of access to light resources by large trees [54] or the dominance of access to other resources by a strong underground root system [55]. In the later phase of stand development, as the productivity of large trees declines, SGR decreases, leading to a decrease in the proportional contribution of larger tree growth relative to the total stand growth. Size-symmetric-SGR or inverse size-asymmetric-SGR is due to accelerated growth of non-dominant trees [13] or declining importance of light competition [56]. Additionally, smaller trees in the stand undergo natural thinning and regeneration mortality due to intraspecific competition within the stand. This, coupled with a slowdown in the growth of large trees, results in a gradual shift in growth dominance towards the average tree [9]. However, a comprehensive understanding required long-term monitoring of individual tree growth. Our study also revealed a lower SGR in the high-density stand compared to the low-density stand, with an early emergence of an SGR < 1 pattern. This suggested that within the limited growth space of the high-density stand, the growth rates of large trees started diminishing when they reached a certain size.
This study’s findings on GD showed that the relative contribution of large trees to stand growth was higher than that of small trees at ages 17–46 years. The GD during this period was greater than 0, indicating that larger trees possessed a superior ability to capture resources, thus inhibiting the growth of smaller trees. In pure larch forest stands, as the stand progressed into the maturity stage, the growth of large trees slowed down, and the GD exhibited a decreasing trend. This pattern was consistent with the findings of Qu et al. [57], who observed a similar change in growth dominance with age in an unthinned Cunninghamia lanceolata (Lamb.) forest. It was also found that the differences in GD between planting densities were not significant [57]. Similarly, Looney et al. [24] found that in high-density stands, large trees exhibited significant growth dominance (GD > 0) due to abundant growth space and resources, when the stand age was small. As the stand developed and competition increased, strong competition from larger trees drove disproportionate growth, creating an environment conducive to positive growth dominance [22,57,58]. In low-density stands, when the stand age exceeded 40 years, GD < 0, suggesting that small trees contributed more than their proportional growth to the stand. Furthermore, the results from both SGR and GD support Binkley’s four-stage hypothesis of stand growth and development, providing a robust verification of the proposed model.

4.3. Effects of Drought on Size–Growth Relationship

The relationship between tree size and growth is influenced by moisture factors [59,60]. Drought conditions contribute to a reduction in the growth rate of forest trees, with variations in the water trapping capacity among trees of different sizes [61]. Drought intensifies competition among trees due to limited resource availability [62]. Compared to small trees, larger trees characterized by a wider canopy and deeper and denser root prospection may intercept and access a disproportionate fraction of water resources [63]. Therefore, there is a clear growth superiority in large compared to small trees during drought periods [64]. Our study showed that the drought indicator (AHM) was significantly and positively correlated with SGR. Larch plantations exhibited an asymmetric competition pattern in tree size and growth under drought conditions. As drought stress was alleviated, the relationship between tree size and growth gradually shifted from an asymmetric to a symmetric pattern. Similar findings were found in other studies. Bose et al. [65] found a significant positive correlation between soil water-holding capacity and dominance coefficient. Small trees tend to experience more severe stress than larger trees during drought [66]. Trouvé et al. [17] observed that during summer soil moisture deficit, stand growth decelerated due to asymmetric competition for water resources. This effect is particularly evident in suppressed trees, where large trees contribute more than their proportional growth to the stand, leading to an increased GD. Overall, drought limits resource availability by intensifying competition among individuals, consequently impacting SGR in larch plantations.

5. Conclusions

In this study, we examined tree size inequality, SGR, and GD across various stand ages and stand densities to elucidate growth partitioning and stand growth dynamics during stand development. Our analysis revealed that the GI exhibited a gradual increase over stand ages. Particularly noteworthy was the significantly higher GI observed in stands with higher densities compared to those with lower densities, with a clear differentiation in tree size in the stand. Furthermore, our study demonstrated a general trend of decreasing SGR and GD with increasing stand age. The transition in SGR in larch forests was evident, shifting from an asymmetric to a symmetric pattern, ultimately trending towards an inversely asymmetric stage. These findings emphasize the importance of adjusting stand density and optimizing tree size structure to enhance larch resilience against warming and drying effects.

Author Contributions

Conceptualization, J.L. and Z.Z.; methodology, software, visualization, J.L., D.C. and X.Y.; investigation, data curation, Z.Z., N.F. and Y.W.; writing—original draft preparation, J.L.; writing—review and editing, Z.Z.; All authors have read and agreed to the published version of the manuscript.

Funding

This research was funded by the Fundamental Research Funds for the Central Non-profit Research Institution of CAF, grant number CAFYBB2022ZB001, the National Natural Science Foundation of China, grant number 32071759, the Hebei Province Forest and Grass Science and Technology Demonstration Project, grant number TG [2022]018, and the Hebei Province Key R & D Program of China, grant number 22326803D.

Data Availability Statement

The data presented in this study are available on request from the corresponding author.

Acknowledgments

The authors thank everyone who helped with the field survey and the anonymous reviewers for their valuable comments.

Conflicts of Interest

The authors declare no conflicts of interest.

References

  1. Binkley, D.; Stape, J.L.; Ryan, M.G.; Barnard, H.R.; Fownes, J. Age-related decline in forest ecosystem growth: An individual-tree, stand-structure hypothesis. Ecosystems 2002, 5, 58–67. [Google Scholar] [CrossRef]
  2. Schall, P.; Schulze, E.-D.; Fischer, M.; Ayasse, M.; Ammer, C. Relations between forest management, stand structure and productivity across different types of Central European forests. Basic Appl. Ecol. 2018, 32, 39–52. [Google Scholar] [CrossRef]
  3. Fernández-Tschieder, E.; Binkley, D. Linking competition with growth dominance and production ecology. For. Ecol. Manag. 2018, 414, 99–107. [Google Scholar] [CrossRef]
  4. Binkley, D. A hypothesis about the interaction of tree dominance and stand production through stand development. For. Ecol. Manag. 2004, 190, 265–271. [Google Scholar] [CrossRef]
  5. Pretzsch, H.; Dieler, J. The dependency of the size-growth relationship of Norway spruce (Picea abies L. Karst.) and European beech (Fagus sylvatica L.) in forest stands on long-term site conditions, drought events, and ozone stress. Trees 2011, 25, 355–369. [Google Scholar] [CrossRef]
  6. Forrester, D.I. Linking forest growth with stand structure: Tree size inequality, tree growth or resource partitioning and the asymmetry of competition. For. Ecol. Manag. 2019, 447, 139–157. [Google Scholar] [CrossRef]
  7. Looney, C.E.; D’Amato, A.W.; Jovan, S. Investigating linkages between the size-growth relationship and drought, nitrogen deposition, and structural complexity in western US Forests. For. Ecol. Manag. 2021, 497, 119494. [Google Scholar] [CrossRef]
  8. Pretzsch, H.; Biber, P. Size-symmetric versus size-asymmetric competition and growth partitioning among trees in forest stands along an ecological gradient in central Europe. Can. J. For. Res. 2010, 40, 370–384. [Google Scholar] [CrossRef]
  9. Metsaranta, J.M. Influence of past mortality and measurement thresholds on tree-ring inferred trends in tree distribution and size-growth relationships at a Populus tremuloides stand in the Northwest Territories, Canada. For. Ecol. Manag. 2020, 466, 118138. [Google Scholar] [CrossRef]
  10. Hitsuma, G.; Himmapan, W.; Yagihashi, T.; Miyamoto, K.; Vacharangkura, T. Effects of tree density and size symmetry of competition on diameter growth in the early stages of growth in planted teak (Tectona grandis) trees in northern Thailand. J. For. Res. 2021, 26, 321–327. [Google Scholar] [CrossRef]
  11. Bradford, J.B.; D’Amato, A.W.; Palik, B.J.; Fraver, S. A new method for evaluating forest thinning: Growth dominance in managed Pinus resinosa stands. Can. J. For. Res. 2010, 40, 843–849. [Google Scholar] [CrossRef]
  12. Pothier, D. Relationships between patterns of stand growth dominance and tree competition mode for species of various shade tolerances. For. Ecol. Manag. 2017, 406, 155–162. [Google Scholar] [CrossRef]
  13. Binkley, D.; Kashian, D.M.; Boyden, S.; Kaye, M.W.; Bradford, J.B.; Arthur, M.A.; Fornwalt, P.J.; Ryan, M.G. Patterns of growth dominance in forests of the Rocky Mountains, USA. For. Ecol. Manag. 2006, 236, 193–201. [Google Scholar] [CrossRef]
  14. Castagneri, D.; Nola, P.; Cherubini, P.; Motta, R. Temporal variability of size-growth relationships in a Norway spruce forest: The influences of stand structure, logging, and climate. Can. J. For. Res. 2012, 42, 550–560. [Google Scholar] [CrossRef]
  15. Pérez-de-Lis, G.; García-González, I.; Rozas, V.; Arévalo, J.R. Effects of thinning intensity on radial growth patterns and temperature sensitivity in Pinus canariensis afforestations on Tenerife Island, Spain. Ann. For. Sci. 2011, 68, 1093. [Google Scholar] [CrossRef]
  16. Turski, M.; Kwasna, H.; Beker, C.; Jaszczak, R.; Kazmierczak, K.; Najgrakowski, T.; Borzyszkowski, W. The influence of age and crown position on growth efficiency along a Scots pine chronosequence. iForest—Biogeosc. For. 2019, 12, 474–479. [Google Scholar] [CrossRef]
  17. Trouvé, R.; Bontemps, J.-D.; Collet, C.; Seynave, I.; Lebourgeois, F. Growth partitioning in forest stands is affected by stand density and summer drought in sessile oak and Douglas-fir. For. Ecol. Manag. 2014, 334, 358–368. [Google Scholar] [CrossRef]
  18. Bourdier, T.; Cordonnier, T.; Kunstler, G.; Piedallu, C.; Lagarrigues, G.; Courbaud, B. Tree size inequality reduces forest productivity: An analysis combining inventory data for ten european species and a light competition model. PLoS ONE 2016, 11, e0151852. [Google Scholar] [CrossRef]
  19. Del Río, M.; Condés, S.; Pretzsch, H. Analyzing size-symmetric vs. size-asymmetric and intra- vs. inter-specific competition in beech (Fagus sylvatica L.) mixed stands. For. Ecol. Manag. 2014, 325, 90–98. [Google Scholar] [CrossRef]
  20. Giuggiola, A.; Ogee, J.; Rigling, A.; Gessler, A.; Bugmann, H.; Treydte, K. Improvement of water and light availability after thinning at a xeric site: Which matters more? A dual isotope approach. New Phytol. 2016, 210, 108–121. [Google Scholar] [CrossRef] [PubMed]
  21. Park, J.; Kim, T.; Moon, M.; Cho, S.; Ryu, D.; Seok Kim, H. Effects of thinning intensities on tree water use, growth, and resultant water use efficiency of 50-year-old Pinus koraiensis forest over four years. For. Ecol. Manag. 2018, 408, 121–128. [Google Scholar] [CrossRef]
  22. Keyser, T.L. Patterns of growth dominance in thinned yellow-poplar stands in the southern Appalachian Mountains, USA. Can. J. For. Res. 2012, 42, 406–412. [Google Scholar] [CrossRef]
  23. Liang, R.T.; Xie, Y.H.; Sun, Y.Y.; Wang, B.Y.; Ding, Z.D. Temporal changes in size inequality and stand growth partitioning between tree sizes under various thinning intensities in subtropical Cunninghamia lanceolata plantations. For. Ecol. Manag. 2023, 547, 121363. [Google Scholar] [CrossRef]
  24. Looney, C.E.; Zhang, J.W. Site quality and intensive early stand management practices affect growth dominance, structural complexity, and tree growth in ponderosa pine plantations. For. Ecol. Manag. 2022, 519, 120318. [Google Scholar] [CrossRef]
  25. Zhang, J.; Liu, Q.; Wang, D.Z.; Zhang, Z.D. Soil microbial community, soil quality, and productivity along a chronosequence of Larix principis-rupprechtii forests. Plants 2023, 12, 2913. [Google Scholar] [CrossRef] [PubMed]
  26. Pretzsch, H.; del Río, M.; Grote, R.; Klemmt, H.-J.; Ordóñez, C.; Oviedo, F.B. Tracing drought effects from the tree to the stand growth in temperate and Mediterranean forests: Insights and consequences for forest ecology and management. Eur. J. For. Res. 2022, 141, 727–751. [Google Scholar] [CrossRef]
  27. Au, T.F.; Maxwell, J.T.; Robeson, S.M.; Li, J.B.; Siani, S.M.O.; Novick, K.A.; Dannenberg, M.P.; Phillips, R.P.; Li, T.; Chen, Z.J.; et al. Younger trees in the upper canopy are more sensitive but also more resilient to drought. Nat. Clim. Chang. 2022, 12, 1168–1174. [Google Scholar] [CrossRef]
  28. Li, W.B.; Lv, Z.G.; Zhang, Z.D.; Huang, X.R. Predicting productivity and spatial distribution of Larix principis-rupprechtii plantation. J. Nat. Resour. 2019, 34, 1365–1375. [Google Scholar] [CrossRef]
  29. He, H. Measurement of Tree-Ring Width with WinDENDRO and Crossdating Methods. J. Chongqing Norm. Univ. Nat. Sci. Ed. 2005, 22, 6. [Google Scholar] [CrossRef]
  30. Grissino-Mayer, H.D. Evaluating Crossdating Accuracy: A Manual and Tutorial for the Computer Program COFECHA. Tree-Ring Res. 2001, 57, 205–221. [Google Scholar]
  31. Wang, T.L.; Wang, G.Y.; Innes, J.L.; Seely, B.; Chen, B.Z. ClimateAP: An application for dynamic local downscaling of historical and future climate data in Asia Pacific. Front. Agric. Sci. Eng. 2017, 4, 448–458. [Google Scholar] [CrossRef]
  32. Zhang, X.; Liu, X.; Manzanedo, R.D.; D’Orangeville, L.; Lv, P.; Wang, C.; Xu, C.; Hou, M.; Huang, X.; Rademacher, T. High risk of growth cessation of planted larch under extreme drought. Environ. Res. Lett. 2021, 16, 014040. [Google Scholar] [CrossRef]
  33. Lv, Z.G.; Li, W.B.; Huang, X.R.; Zhang, Z.D. Predicting suitable distribution area of three dominant tree species under climate change scenarios in Hebei Province. Sci. Silvae. Sin. 2019, 55, 13–21. [Google Scholar] [CrossRef]
  34. Lan, J.; Lei, X.D.; He, X.; Gao, W.Q.; Li, Y.T. Multi-functionality of natural mixed broad-leaved forests and driving forces in Jilin Province. Acta Ecol. Sin. 2021, 41, 5128–5141. [Google Scholar] [CrossRef]
  35. Weiner, J.; Solbrig, O.T. The meaning and measurement of size hierarchies in plant populations. Oecologia 1984, 61, 334–336. [Google Scholar] [CrossRef]
  36. Cordonnier, T.; Kunstler, G. The Gini index brings asymmetric competition to light. Perspect. Plant Ecol. Evol. Syst. 2015, 17, 107–115. [Google Scholar] [CrossRef]
  37. Dong, X.T.; Zhang, J.; Zhang, Z.D.; Huang, X.R. Effects of tree species interaction, stand density, and tree size on the productivity of Larix principis-rupprechtii. Chin. J. Appl. Ecol. 2022, 32, 2722–2728. [Google Scholar] [CrossRef]
  38. Metsaranta, J.M.; Lieffers, V.J. Patterns of inter-annual variation in the size asymmetry of growth in Pinus banksiana. Oecologia 2010, 163, 737–745. [Google Scholar] [CrossRef] [PubMed]
  39. Dolezal, J.; Ishii, H.; Vetrova, V.; Sumida, A.; Hara, T. Tree growth and competition in a Betula platyphylla-Larix cajanderi Post-fire Forest in Central Kamchatka. Ann. Bot. 2004, 94, 333–343. [Google Scholar] [CrossRef] [PubMed]
  40. West, P.W. Calculation of a growth dominance statistic for forest stands. For. Sci. 2014, 60, 1021–1023. [Google Scholar] [CrossRef]
  41. Bates, D.; Mächler, M.; Bolker, B.; Walker, S. Fitting linear mixed-effects models using lme4. J. Stat. Softw. 2015, 67, 1–48. [Google Scholar] [CrossRef]
  42. R Core Team. R: A Language and Environment for Statistical Computing; R Foundation for Statistical Computing: Vienna, Austria, 2020; Available online: https://www.r-project.org (accessed on 1 October 2022).
  43. Yang, G.J.; Hu, H.F.; Sun, H.G.; Zhang, J.G.; Duan, A.G. The influences of stand age, planting density and self-thinning on relationship between size inequality and periodic annual increment in chinese Fir (Cunninghamia lanceolata) plantations. Sci. Silvae. Sin. 2019, 55, 126–136. [Google Scholar] [CrossRef]
  44. Vorster, A.G.; Evangelista, P.H.; Stovall, A.E.L.; Ex, S. Variability and uncertainty in forest biomass estimates from the tree to landscape scale: The role of allometric equations. Carbon Balance Manag. 2020, 15, 8. [Google Scholar] [CrossRef] [PubMed]
  45. Boyden, S.; Binkley, D.; Stape, J.L. Competition among Eucalyptus trees depends on genetic variation and resource supply. Ecology 2008, 89, 2850–2859. [Google Scholar] [CrossRef]
  46. Looney, C.E.; D’Amato, A.W.; Palik, B.J.; Fraver, S.; Kastendick, D.N. Size-growth relationship, tree spatial patterns, and tree-tree competition influence tree growth and stand complexity in a 160-year red pine chronosequence. For. Ecol. Manag. 2018, 424, 85–94. [Google Scholar] [CrossRef]
  47. Zhang, Y.; Chen, H.Y.H. Individual size inequality links forest diversity and above-ground biomass. J. Ecol. 2015, 103, 1245–1252. [Google Scholar] [CrossRef]
  48. Zhao, D.H.; Bullock, B.P.; Montes, C.R.; Wang, M.L. Production, tree size inequality and growth dominance in loblolly pine plantations under different silvicultural management regimes. For. Ecol. Manag. 2022, 526, 120594. [Google Scholar] [CrossRef]
  49. Soares, A.A.V.; Leite, H.G.; Souza, A.L.; Silva, S.R.; Lourenço, H.M.; Forrester, D.I. Increasing stand structural heterogeneity reduces productivity in Brazilian Eucalyptus monoclonal stands. For. Ecol. Manag. 2016, 373, 26–32. [Google Scholar] [CrossRef]
  50. Fronhofer, E.A.; Govaert, L.; O’Connor, M.I.; Schreiber, S.J.; Altermatt, F. The shape of density dependence and the relationship between population growth, intraspecific competition and equilibrium population density. Oikos 2024, 2024, e09824. [Google Scholar] [CrossRef]
  51. Zhang, J.; Zhao, J.M.; Cheng, R.M.; Ge, Z.X.; Zhang, Z.D. Effects of neighborhood competition and stand structure on the productivity of pure and mixed Larix principis-rupprechtii forests. Forests 2022, 13, 1318. [Google Scholar] [CrossRef]
  52. Del Río, M.; Bravo-Oviedo, A.; Ruiz-Peinado, R.; Condés, S. Tree allometry variation in response to intra- and inter-specific competitions. Trees 2019, 33, 121–138. [Google Scholar] [CrossRef]
  53. Geng, Y.; Yue, Q.; Zhang, C.; Zhao, X.; von Gadow, K. Dynamics and drivers of aboveground biomass accumulation during recovery from selective harvesting in an uneven-aged forest. Eur. J. For. Res. 2021, 140, 1163–1178. [Google Scholar] [CrossRef]
  54. Baret, M.; Pepin, S.; Ward, C.; Pothier, D. Long-term changes in stand growth dominance as related to resource acquisition and utilization in the boreal forest. For. Ecol. Manag. 2017, 400, 408–416. [Google Scholar] [CrossRef]
  55. Binkley, D.; Kashian, D.M. Tree-Level patterns of lodgepole pine growth and leaf area in yellowstone national park: Explaining anomalous patterns of growth dominance within stands. Ecosystems 2015, 18, 251–259. [Google Scholar] [CrossRef]
  56. Pretzsch, H.; Bravo-Oviedo, A.; Hilmers, T.; Ruiz-Peinado, R.; Coll, L.; Löf, M.; Ahmed, S.; Aldea, J.; Ammer, C.; Avdagić, A.; et al. With increasing site quality asymmetric competition and mortality reduces Scots pine (Pinus sylvestris L.) stand structuring across Europe. For. Ecol. Manag. 2022, 520, 120365. [Google Scholar] [CrossRef]
  57. Britwum Acquah, S.; Marshall, P.L.; Eskelson, B.N.I.; Moss, I.; Barbeito, I. Changes in size inequality and growth dominance in thinned and unthinned uneven-aged interior Douglas-fir dominated stands. For. Ecol. Manag. 2022, 524, 120517. [Google Scholar] [CrossRef]
  58. Qu, Y.; Wang, H.; Dean, T.J.; Zhang, J.; Zhang, X. Growth dominance and growth efficiency in response to thinning treatments in Chinese fir plantations with long-term spacing trials. For. Ecol. Manag. 2022, 521, 120438. [Google Scholar] [CrossRef]
  59. Pretzsch, H.; Schütze, G.; Biber, P. Drought can favour the growth of small in relation to tall trees in mature stands of Norway spruce and European beech. For. Ecosyst. 2018, 5, 20. [Google Scholar] [CrossRef]
  60. Harvey, J.E.; Smiljanić, M.; Scharnweber, T.; Buras, A.; Cedro, A.; Cruz-García, R.; Drobyshev, I.; Janecka, K.; Jansons, Ā.; Kaczka, R.; et al. Tree growth influenced by warming winter climate and summer moisture availability in northern temperate forests. Glob. Chang. Biol. 2020, 26, 2505–2518. [Google Scholar] [CrossRef] [PubMed]
  61. McGregor, I.R.; Helcoski, R.; Kunert, N.; Tepley, A.J.; Gonzalez-Akre, E.B.; Herrmann, V.; Zailaa, J.; Stovall, A.E.L.; Bourg, N.A.; McShea, W.J.; et al. Tree height and leaf drought tolerance traits shape growth responses across droughts in a temperate broadleaf forest. New Phytol. 2021, 231, 601–616. [Google Scholar] [CrossRef] [PubMed]
  62. Gleason, K.E.; Bradford, J.B.; D’Amato, A.W.; Fraver, S.; Palik, B.J.; Battaglia, M.A. Forest density intensifies the importance of snowpack to growth in water-limited pine forests. Ecol. Appl. 2021, 31, e02211. [Google Scholar] [CrossRef] [PubMed]
  63. Gebhardt, T.; Häberle, K.-H.; Matyssek, R.; Schulz, C.; Ammer, C. The more, the better? Water relations of Norway spruce stands after progressive thinning. Agric. For. Meteorol. 2014, 197, 235–243. [Google Scholar] [CrossRef]
  64. Schmied, G.; Pretzsch, H.; Ambs, D.; Uhl, E.; Schmucker, J.; Fäth, J.; Biber, P.; Hoffmann, Y.-D.; Šeho, M.; Mellert, K.H.; et al. Rapid beech decline under recurrent drought stress: Individual neighborhood structure and soil properties matter. For. Ecol. Manag. 2023, 545, 121305. [Google Scholar] [CrossRef]
  65. Bose, A.K.; Rohner, B.; Bottero, A.; Ferretti, M.; Forrester, D.I. Did the 2018 megadrought change the partitioning of growth between tree sizes and species? A Swiss case-study. Plant Biol. 2022, 24, 1146–1156. [Google Scholar] [CrossRef] [PubMed]
  66. Zang, C.; Pretzsch, H.; Rothe, A. Size-dependent responses to summer drought in Scots pine, Norway spruce and common oak. Trees 2012, 26, 557–569. [Google Scholar] [CrossRef]
Figure 1. The geographical location of study areas and sample plots.
Forests 15 00413 g001
Figure 2. Changes in Gini coefficient (GI) with stand age and stand density. The symbol “.” and “..” in figure indicate outliers. Uppercase letters above the box indicate significant differences among different age groups in high-density stands (p < 0.05). Lowercase letters above the box indicate significant differences among different age groups in low-density stands (p < 0.05).
Forests 15 00413 g002
Figure 3. Changes in size–growth relationship (SGR) and growth dominance coefficient (GD) with stand age and stand density. The symbol “.” in figure indicates outliers. Uppercase letters above the box indicate significant differences among different age groups in high-density stands (p < 0.05). Lowercase letters above the box indicate significant differences among different age groups in low-density stands (p < 0.05).
Forests 15 00413 g003
Figure 4. The relationship between size–growth relationship (SGR) and growth dominance coefficient (GD).
Forests 15 00413 g004
Figure 5. The explanation proportion of stand density (P), stand age (Age), and drought indicator (AHM) to the total fixed effects of SGR4 model, which were quantified by the variance partition.
Forests 15 00413 g005
Table 1. Basic conditions of the sampling plots.
Stand Age (Year)Density (Trees·ha−1)Number of PlotsMean DBH (Min–Max) (cm)Mean Height (Min–Max) (m)Mean BAI (cm2·year−1)Crown Width (m)
17–1922701311.82 (9.21–14.54)10.86 (6.47–16.08)7.630.7–1.9
20–2920491312.58 (9.07–18.66)10.66 (7.38–19.85)8.480.9–2.6
30–3910342320.51 (15.88–26.38)15.49 (7.89–23.06)10.320.9–3.0
40–46785623.93 (21.77–26.49)20.47 (16.67–24.20)8.991.0–3.3
Table 2. List of different hypothesis models evaluated for size–growth relationship (SGR).
ResponseHypothesisResponse Varies as a Function of:
SGRSGR0Null model (P)
SGRSGR1Null model, Age
SGRSGR2Null model, Age, P × Age
SGRSGR3Null model, AHM
SGRSGR4Null model, Age, AHM
SGRSGR5Null model, Age, P × Age, AHM
The independent variable in the null model is P. P: stand density; Age: stand age; AHM: drought indicator. The same applies below.
Table 3. SGR model coefficients and evaluation indicators.
ModelPAgeAHMR2AICBICMAE
SGR0−0.003 0.4070.8382.870.23
SGR40.3000.3280.558 *0.4769.5279.560.21
P: stand density; AHM: the mean annual hygrothermal index; R2: Coefficient of Determination; AIC: Akaike Information Criterion; BIC: Bayesian Information Criterion; MAE: Mean Absolute Error. The symbol * indicates that this independent variable has a significant effect on the dependent variable (p < 0.05).
Disclaimer/Publisher’s Note: The statements, opinions and data contained in all publications are solely those of the individual author(s) and contributor(s) and not of MDPI and/or the editor(s). MDPI and/or the editor(s) disclaim responsibility for any injury to people or property resulting from any ideas, methods, instructions or products referred to in the content.

