Abstract
Rapid and accurate classification of urban tree species is crucial for the protection and management of urban ecology. However, tree species classification remains a great challenge because of the high spatial heterogeneity and biodiversity. Addressing this challenge, in this study, unmanned aerial vehicle (UAV)-based high-resolution RGB imagery and LiDAR data were utilized to extract seven types of features, including RGB spectral features, texture features, vegetation indexes, HSV spectral features, HSV texture features, height feature, and intensity feature. Seven experiments involving different feature combinations were conducted to classify 10 dominant tree species in urban areas with a Random Forest classifier. Additionally, Plurality Filling was applied to further enhance the accuracy of the results as a post-processing method. The aim was to explore the potential of UAV-based RGB imagery and LiDAR data for tree species classification in urban areas, as well as evaluate the effectiveness of the post-processing method. The results indicated that, compared to using RGB imagery alone, the integrated LiDAR and RGB data could improve the overall accuracy and the Kappa coefficient by 18.49% and 0.22, respectively. Notably, among the features based on RGB, the HSV and its texture features contribute most to the improvement of accuracy. The overall accuracy and Kappa coefficient of the optimal feature combination could achieve 73.74% and 0.70 with the Random Forest classifier, respectively. Additionally, the Plurality Filling method could increase the overall accuracy by 11.76%, which could reach 85.5%. The results of this study confirm the effectiveness of RGB imagery and LiDAR data for urban tree species classification. Consequently, these results could provide a valuable reference for the precise classification of tree species using UAV remote sensing data in urban areas.
1. Introduction
With the rapid advancement of urbanization, there have been an increasing number of environmental challenges, such as air pollution, loss of green spaces, and the urban heat-island effect [1]. As an essential component of the urban ecosystem, urban forests could play a crucial importance in regulating temperature, improving air quality, and managing urban ecosystems [2,3]. However, the function depends on the spatial distribution and variety of urban trees. Therefore, the precise classification of tree species is essential for sustainable development of cities [4,5].
The traditional methods for tree species classification are primarily manual, often labor-intensive, inefficient, and influenced by subjective factors [6,7]. Satellite remote sensing imagery, such as Landsat and SPOT, has become a valuable data source for large-scale tree surveys due to its advantages in providing comprehensive coverage and short revisit periods [8,9,10]. However, there are also limitations in the classification of tree species, such as low resolution, difficulty in capturing fine features, and a lack of crucial three-dimensional data [11,12]. These limitations are not unique to urban areas but are particularly pronounced in such settings with complex spatial patterns.
As a valuable alternative to traditional satellite remote sensing with low- to medium-resolution, unmanned aerial vehicle (UAV)-based remote sensing has been utilized in various fields. They could acquire remote sensing imagery with a higher spatial resolution which could get detailed information about complex urban areas [13,14]. In addition, the rapid development of UAV platforms and sensors has enabled the collection of multiple remote sensing data in the same area quickly. The integration of data from various sources allows for a comprehensive characterization of urban trees across multiple dimensions [11,15,16]. Qin et al. [17] used UAV-based LiDAR, hyperspectral and ultra-high-resolution RGB data to classify 18 tree species in subtropical broadleaf forests. The results revealed that the fusion of multi-source data increases the classification accuracy, with an overall accuracy of 91.8%. Similarly, Wu et al. [18] combined airborne hyperspectral data and LiDAR data to classify seven tree species in a forest field in Guangxi Province, achieving the highest overall accuracy of 94.68%.
UAV-based RGB data offers distinct advantages in fine tree species classification with higher precision requirements, due to its advantages in low acquisition cost, ease of operation, and high image resolution accurate to decimeter or even centimeter-level precision. Compared with other datasets, these attributes make it highly suitable for extensive surveys of urban tree species on a larger scale [19,20,21]. However, it is important to recognize that RGB imagery has limited spectral information. To maximize the utilization of RGB imagery for urban tree species classification, a comprehensive exploration of their potential features is essential. In a study conducted by Wang et al. [22], various information was extracted from UAV-based RGB imagery to classify four tree species in forest parks in Xi’an City. This information included spectral data, vegetation morphology parameters, texture details, and vegetation indices. The results exhibited a classification accuracy of 91.3% for urban forests. In a previous study by Feng et al. [23], six second-order texture features were computed based on UAV visible light imagery. These features, created with distinct window sizes and designed to minimize correlation, substantially enhanced the accuracy of tree species classification. In summary, the utilization of UAV-based RGB imagery demonstrates significant potential for precise and efficient urban tree species classification.
The intricate and heterogeneous nature of urban environments poses a challenge for any single data source to fully capture the complex reality. RGB imagery has inherent limitations in capturing detailed vertical structural information. Consequently, relying only on RGB imagery might not accurately represent the minor variations in different canopy levels and heights [24]. In addressing the limitations posed by traditional RGB imagery, LiDAR technology emerges as a pivotal solution, offering detailed three-dimensional (3D) surface data. It captures intricate vertical details and enriches our understanding of urban environments [25,26,27,28]. The fusion of two-dimensional (2D) and 3D information, as achieved through the integration of LiDAR and RGB imagery, proves to be invaluable for the fine classification of tree species [17,18,29,30]. Deng et al. [31] achieved the highest classification accuracy of 90.8% by combining airborne laser scanning data with RGB imagery. Ke et al. [32] employed an object-oriented approach, integrating LiDAR data with QuickBird multispectral images, resulting in a remarkable classification accuracy of 91.6%, which surpassed the accuracy of individual datasets by 20%. Moreover, You et al. [33] delved into single tree parameter acquisition using UAV-acquired LiDAR data and high-resolution RGB images. Their findings indicated that structural parameters extracted from the combination of these two data types exhibited the highest accuracy levels. However, previous studies related to tree species classification mainly involved multispectral data from satellites or airborne platforms [34,35]. There have been limited studies that integrated UAV-based LiDAR and RGB imagery for tree species classification [36,37,38].
Conventional methods for tree species classification primarily consist of pixel-based classification and object-based classification [39]. Pixel-based classification methods rely on the spectral information within images, enabling them to discern subtle variations within the imagery [40,41]. Object-based classification methods merge neighboring image elements into larger objects for classification, enhancing their ability to capture spatial structures and contextual information in images [6,18,42]. However, when it comes to urban environments, both pixel-based classification methods and object-based classification methods face specific challenges. In the case of pixel-based classification methods, processing urban imagery can sometimes result in noticeable salt-and-pepper effects [22,43]. In addition, object-based classification methods struggle to accurately identify and extract individual trees as objects in densely forested urban areas. Therefore, current scientific investigations are mainly on tree species classification in plantation forests, and few concentrate on the tree species in complex urban areas. Therefore, to solve the above problems, this paper proposed the Plurality Filling method to combine the advantages of pixel-based classification and object-based methods to improve the accuracy of image classification results.
In this study, seven distinct features of urban tree canopies were extracted from RGB imagery and LiDAR data collected by UAV. Various experiments were applied using the Random Forest classifier, followed by post-processing through the Plurality Filling method. The specific objectives of this research were as follows: (1) to assess the integrated application of UAV-based RGB imagery and LiDAR data for urban tree species classification; (2) to identify the optimal combination of features suitable for classifying urban tree species and assess the impact of different features on the accuracy of tree species classification; (3) to validate the effectiveness of the filling method in enhancing classification accuracy.
2. Materials and Methods
2.1. Study Area
The study area is located in Jinan, Shandong Province in eastern China. The climate is typical warm-temperature continental monsoon climate, with an average annual temperature of 14.6 °C and an annual precipitation of 696.5 mm. In this study, the Qianfoshan Campus of Shandong Normal University and its surrounding areas were chosen as the data collection site (117°2′9″ E, 36°39′6″ N), covering a total area of 51 ha. The location of the study area is shown in Figure 1.
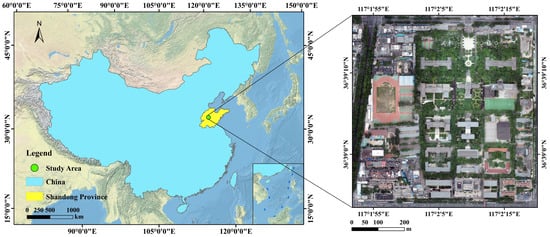
Figure 1.
The location of the study area.
The tree species found in the study area are primarily deciduous trees, including Platanus orientalis (PO), Styphnolobium japonicum (SJ), Gingo biloba (GB), Acer truncatum (AT), Populus przewalskii (PP), Malus spectabilis (MS), and Juglans regia (JR). Additionally, there are also evergreen trees such as Cedrus deodara (CD), Juniperus chinensis (JC), and Pinus bungeana (PB). These tree species are intermingled and densely distributed, resulting in a high canopy density in the study area. In this study, 10 dominant tree species were selected as experimental subjects. Figure 2 displays the digital images and LiDAR point cloud cross-sections of these tree species.
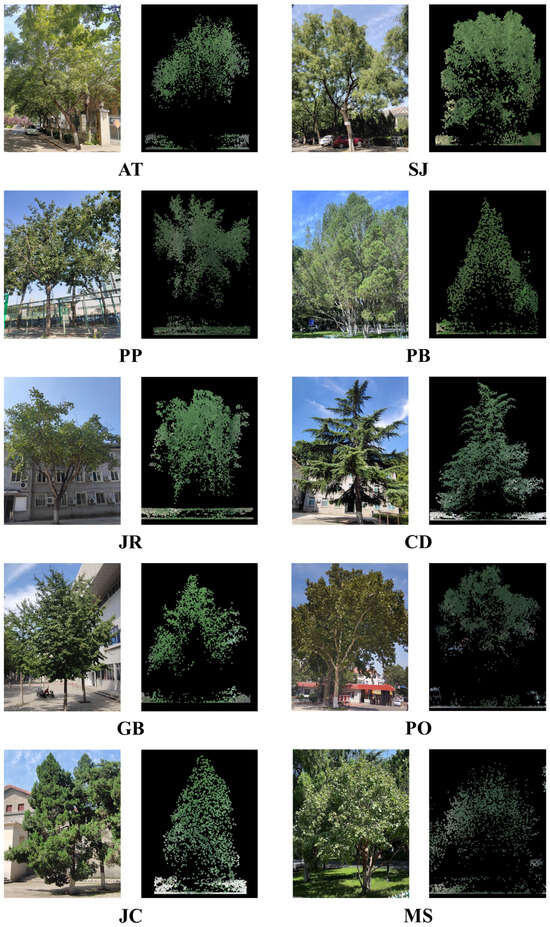
Figure 2.
Digital image and cross-section of LiDAR point cloud of dominant tree species.
2.2. Dataset
The data acquisition utilized the DJI M600Pro UAV, a six-rotor aircraft, as the designated flight platform. This enabled the capture of high-resolution RGB imagery and LiDAR point cloud data on 6 July 2022. To minimize the impact of shadows on RGB imagery, the acquisition was scheduled between 10:00 and 15:00, on a clear, cloudless day with minimal wind speed. Before collecting data, careful route planning was essential. The flight paths were configured with a 50 m spacing between strips, an optimal flight altitude of 120 m, and a consistent flight speed of 8 m per second. RGB imagery was obtained using the 4/3 CMOS Hasselblad camera mounted on the UAV, offering a spatial resolution of 0.1 m and covering three essential bands: red, green, and blue.
The SZT-R250 system was used with the same platform to collect the point cloud data. The LiDAR system includes a laser scanner, a global navigation satellite system (GNSS) antenna, and an inertial measurement unit (IMU), which can obtain real-time point cloud position data. The final LiDAR data have a measurement accuracy of less than 5 cm and a point cloud density of more than 120 pts/m2 (over the forested area). Initial point cloud data contained noise points, which were removed through a denoising process. Subsequently, ground points were separated using the Improved Progressive TIN Densification (IPTD) method [44]. To eliminate the influence of terrain relief on the height information, each point’s elevation value was normalized by subtracting the nearest ground point’s elevation. The resulting normalized point cloud data was used to generate a normalized Digital Surface Model (nDSM) with 0.3 m resolution, achieved through inverse distance weight interpolation. Finally, to ensure data consistency for subsequent analysis, the nDSM data were resampled to match the resolution of the RGB imagery. In comparison to directly generating an nDSM with 0.1 m resolution, such data could contribute to mitigating noise in LiDAR data, resulting in more stable height information.
Field data were collected in July 2022. With the support of a handheld Real-Time Kinematic (RTK) measuring system, the precise location of trees was gathered, accompanied by detailed records of their respective species. The selection of trees for measurement was randomized and evenly distributed across the study area. Manual delineation of samples was also conducted based on the acquired point information. Table 1 provides a comprehensive overview of the sample quantities, ensuring a detailed and representative dataset for our analysis.

Table 1.
Sample size of tree species (pixel size is 0.1 m × 0.1 m).
2.3. Methods
In this study, warm-temperate urban tree species are classified based on UAV RGB imagery and UAV LiDAR data. The main steps include (1) 2D space extraction of urban trees, (2) feature extraction, (3) tree species classification and filling post-processing, and (4) classification accuracy assessment. The specific technical route is shown in Figure 3.
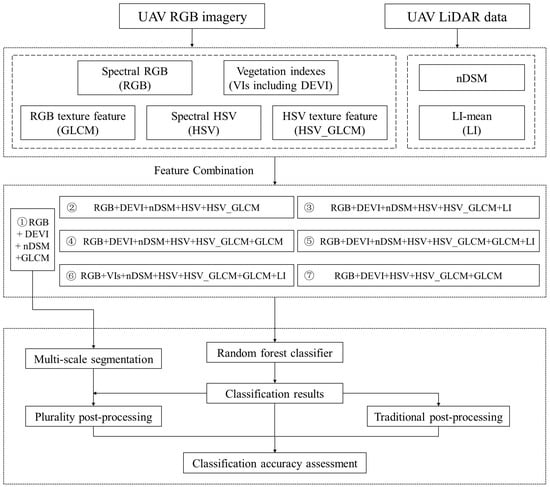
Figure 3.
Technology flowchart for feature extraction, feature combination, classification, and evaluation of UAV data. Here, DEVI: Differences Enhance Vegetation Index; GLCM: Gray Level Co-occurrence Matrix; HSV_GLCM: Gray Level Co-occurrence Matrix extracted based on HSV; LI: LiDAR Intensity; VIs: Vegetation Indexes.
2.3.1. Two-Dimensional Space Extraction of Urban Trees
In urban environments, tree classification is difficult due to the effect of buildings and vehicles. To solve this problem, we implemented a strategy where the 2D spatial extent of trees was extracted before tree species classification (Figure 4). Trees were processed individually before feature extraction and classification. This proactive approach significantly reduced computational complexity, enhancing overall classification efficiency [45]. Specifically, UAV-based RGB imagery was utilized to compute the Difference Exponential Vegetation Index (DEVI). By employing the bimodal histogram thresholding method on the DEVI, the study area’s vegetation was effectively distinguished from non-vegetation. Subsequently, utilizing the nDSM data, the vegetated area was partitioned into sections below and above 2 m. Regions below 2 m were identified as non-forest, while those above 2 m were categorized as forest. These rules above extracted trees accurately which could establish a robust foundation for subsequent feature extraction and classification.
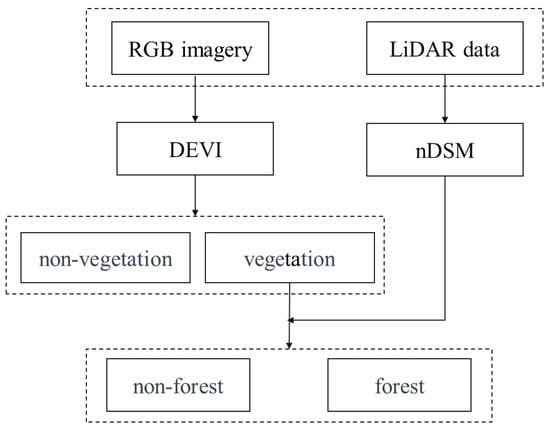
Figure 4.
Two-dimensional spatial extraction process of urban trees.
2.3.2. Feature Extraction
RGB imagery only has three bands. The limited richness of spectral information has limited the in-depth analysis. To overcome this, we employed established vegetation indices derived from vegetation’s distinct responses to different wavelengths. These indices are combinations of linear or non-linear calculations between bands, capturing various vegetation characteristics [46].
In this study, we calculated and utilized seven widely recognized vegetation indices from RGB data, significantly enhancing spectral diversity. The formulas of these indices are detailed in Table 2. Additionally, to enrich the spectral information, Hue, Saturation, and Value (HSV) color model, a concept pioneered by Smith, was also introduced [47]. The vegetation indexes and HSV transformation have significantly amplified spectral information of RGB imagery which could provide a nuanced perspective crucial for detailed analysis and accurate classification.

Table 2.
Visible light vegetation indexes.
Texture features play a crucial role in analyzing the grayscale distribution pattern of an image. When classifying tree species, incorporating texture features is extremely beneficial as it enables precise differentiation among different tree types. One widely used method for extracting texture features is the Gray Level Co-occurrence Matrix (GLCM), which captures the relationship between gray levels of neighboring pixels [55]. This matrix comprises eight parameters: mean, variance, homogeneity, heterogeneity, information entropy, angular second-order moments, contrast, and correlation. However, when working with the original three bands of RGB imagery, correlations between them can interfere with texture feature extraction. Therefore, the first band of principal component analysis is selected to calculate the GLCM parameters. This approach reduces computational complexity while preserving crucial information.
Moreover, to explore the influence of HSV color components on classification outcomes, this study obtained additional texture features by extracting the grayscale co-occurrence matrix based on HSV color components.
Compared with RGB imagery, the advantage of LiDAR data could offer detailed information about height and three-dimensional structural characteristics. In the study area, the dense cover of tree canopies obstructs laser pulses, making it challenging to obtain high-quality LiDAR point cloud data. This obstacle significantly hinders the extraction of height and intensity percentile data. Consequently, we opted to focus on two key parameters: nDSM data and mean intensity. By utilizing these features, we explored the effectiveness of using RGB and LiDAR data for tree species classification in regions characterized by dense vegetation, particularly considering the limited availability of LiDAR features. The raster data features extracted from LiDAR point cloud data lay the foundation for subsequent feature combination, providing crucial data and feature basis for our research.
The importance of nDSM data is its ability to provide detailed precise height information of trees which could characterize the vertical distribution information of urban trees. This information could help us in tree species classification with various tree heights. Figure 5 provides the differences in tree heights among different tree species provided by nDSM within the study area. Additionally, nDSM is calculated by subtracting the Digital Surface Model (DSM) from the Digital Elevation Model (DEM) using the following formula:
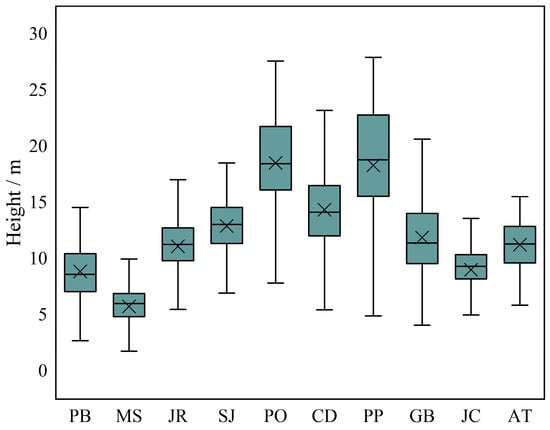
Figure 5.
The boxplot of tree heights among different tree species.
The LiDAR intensity data reflects the degree to which the laser beam is reflected on the target surface. This feature provides insights into the reflective properties of the surface, including its roughness, material, and structure. It is closely associated with characteristics such as the leaf structure and density of trees. By calculating the mean intensity from all laser points within a pixel unit, valuable mean intensity data are obtained. Utilizing this mean intensity information aids in discerning differences between tree species based on their leaf structures. This approach facilitates the precise classification of various tree species by capturing their distinct leaf characteristics. The classes of all features involved in this study and their corresponding number of bands are shown in Table 3.

Table 3.
List of features used in this study.
2.3.3. Multi-Resolution Segmentation Algorithm
This study utilized the eCognition multi-resolution segmentation algorithm for image segmentation. This algorithm operates as a bottom-up approach, segmenting the image across various scales to ensure minimal heterogeneity within regions. By identifying and extracting areas with similar features, it achieves precise and accurate segmentation results. Within the multi-resolution segmentation algorithm, three pivotal parameters play a crucial role: Scale Parameter, Shape, and Compactness. The Scale Parameter governs the spatial scale range considered during segmentation, while the Shape parameter influences the regularity of segmented region shapes. Additionally, the Compactness parameter regulates the compactness of segmented regions. Notably, the method excels in comprehensively considering texture information of pixels, rendering it particularly effective for intricate images or regions characterized by multiple textures.
The forest density in the study area is excessively high, making it challenging to delineate clear canopy boundaries. To address this issue and ensure the integrity of segmented objects, our study implemented the multi-resolution segmentation technique, deliberately leading to an over-segmentation of trees within the study area. This intentional over-segmentation provided a nuanced understanding of the intricate tree structures. The application of the multi-resolution segmentation algorithm is actually aimed at providing a basis for subsequent post-classification processing tasks.
2.3.4. Tree Species Classification
In this study, the Random Forest classifier was adopted for urban tree species classification due to its effectiveness and versatility in pixel-based classification. Random Forest is an integrated learning methodology rooted in decision tree construction principles. It is composed of multiple decision trees, each autonomously assessing input samples. By voting or averaging, the outcomes of these individual trees were amalgamated to yield the definitive classification result [56]. In tree species classification, Random Forest leverages the diversity of features and the synergy of integrated decision-making. This strategic advantage enables the accurate differentiation of distinct tree species, leading to precise and reliable classification outcomes [15,16,57,58].
In order to explore the importance of different features in tree classification, this study devised seven distinct classification experiments grounded in the previously extracted features. As highlighted by Qin et al. [17], the incorporation of multi-dimensional features proves pivotal in ensuring precision in tree species classification. Experiment 1, serving as the foundational feature combination, includes the three bands of RGB imagery, the DEVI used for vegetation masking, the GLCM providing texture features, and the nDSM providing height features. Based on Experiment 1, various features were introduced or replaced, resulting in six additional experiments. Experiment 7, purposely excluding LiDAR data, was designed to assess the impact of LiDAR data inclusion on the classification of urban tree species.
2.3.5. Post-Classification Processing
The high-resolution RGB imagery could capture minute surface details and variations which could offer abundant information for classification. However, in pixel-based classification, it often leads to a severe salt-and-pepper effect. To overcome the potential noise and minor discontinuities associated with pixel-based classification, this study introduced the Plurality Filling method. The fundamental concept was to integrate pixel-based classification results with an object-based classification approach. This method assigns object labels based on the predominant pixel type within the object, effectively enhancing classification accuracy as a post-processing step. Specifically, the predominant image element type within the object is identified, serving as the object label. This innovative approach mitigates the challenges associated with pixel-based classification and contributes to the refinement of classification results. The formula is as follows:
where, Oi represents the ith object, Cj represents the jth category, P (Oi, Cj) is the proportion of pixels belonging to category Cj in object Oi, and L(Oi) represents the label assigned to object Oi.
The results from pixel-based classification were employed to fill the over-segmented objects obtained earlier. The category with the highest proportion of pixels within each object was assigned as the object’s label, ensuring precise identification. This approach guaranteed that each object received an accurate classification. The schematic representation of this innovative Plurality Filling method is visually depicted in Figure 6, demonstrating the approach adopted to mitigate salt-and-pepper noise.
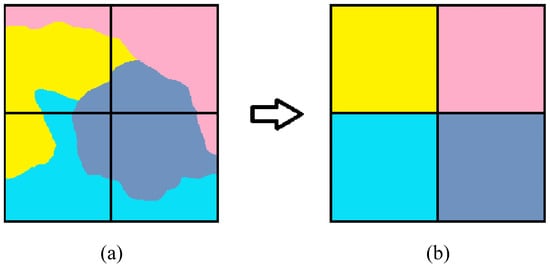
Figure 6.
Schematic diagram of the Plurality Filling method. (a) Original image before filling; (b) Populated image after filling. The square grid in the figure represents the segmented object, and different colors represent the classification results of different types of cells.
In traditional post-processing methods for eliminating salt-and-pepper noise in images, the window sliding method stands out as the most commonly used approach. This method employs a technique akin to convolution filtering, where a fixed-size window slides across the image. The pixel category predominating within the window (having the highest pixel count) is then used to replace the category of the center pixel. This method serves as a universal post-processing technique applicable to various classifications.
2.3.6. Accuracy Evaluation
In this study, the precision of classification outcomes is assessed at the pixel level through the computation of a confusion matrix. This matrix is utilized to derive essential metrics including producer’s accuracy (PA), user’s accuracy (UA), the overall accuracy (OA), and the Kappa coefficient. These metrics play a vital role in precisely quantifying the accuracy and reliability of the classification results. The calculation formulas for these metrics are as follows:
where Xii is the total number of tree species correctly classified as category i in the validation sample; Xi is the total number of category i in the validation sample, i.e., the total number of true class species in the validation sample; Xi+ is the total number of test samples of the species of category i, i.e., the total number of samples classified into category i in the classification results; N is the total number of validation samples; and n is the number of tree species types.
3. Results
3.1. The Influence of Different Features on the Classification Results
Table 4 compares the results of classifying 10 tree species using the Random Forest classifier with different combinations of features. There are significant variations in the classification performance among experiments with different feature combinations. Experiment 1, the basic combination, achieved an overall accuracy of 59.75% and a Kappa coefficient of 0.54. Compared to Experiment 1, Experiment 2 replaced RGB texture features with texture features from the HSV color component, resulting in an increase of 11.33% in overall accuracy and a 0.13 improvement in the Kappa coefficient. In comparison to Experiment 2, Experiment 4 experienced a slight decrease in overall accuracy by 0.37% with the addition of RGB texture features. Building upon Experiment 2, Experiment 3 incorporated the LiDAR intensity feature. It led to a 3% increase in overall accuracy and a 0.04 improvement in the Kappa coefficient, achieving the highest classification accuracy (OA = 74.08%, Kappa = 0.71). Similarly, Experiment 5, compared to Experiment 4, showed a 3.03% increase in overall accuracy and a 0.03 improvement in the Kappa coefficient with the addition of LiDAR intensity features. Experiment 6, utilizing all the features extracted in this study, achieved an overall accuracy of 73.78% and a Kappa coefficient of 0.70. Experiment 7, utilizing only RGB data features, attained the lowest classification accuracy (OA = 55.25%, Kappa = 0.49). The detailed accuracy differences of these experiments are presented in Table 4, illustrating substantial variations in classification performance based on different feature combinations.

Table 4.
Comparison of classification accuracy of different experiments.
The accuracy of the 10 tree species under different experimental scenarios is illustrated in Figure 7. Significant variations exist in the classification accuracy among different species in various experiments. Among all tree species, PB and PO exhibited the highest accuracy, achieving over 90% accuracy in most experiments. GB, on the other hand, demonstrated the lowest accuracy, with producer accuracy fluctuating around 30% and user accuracy reaching approximately 40%. For most tree species, the trends in changes of both producer and user accuracy before and after adding different features are consistent with the overall accuracy trends. Specifically, the accuracy of PB and JC increased by 20% after adding HSV color components and their texture features. Compared to Experiment 2 and Experiment 4, CD showed significant improvements in both producer and user accuracy in Experiment 3 and Experiment 5. Notably, there was an increase of almost 15% in producer accuracy, attributed to the integration of intensity information. In contrast to other species, MS achieved the highest producer accuracy of 79.60% in Experiment 1, but its accuracy decreased after adding additional features.
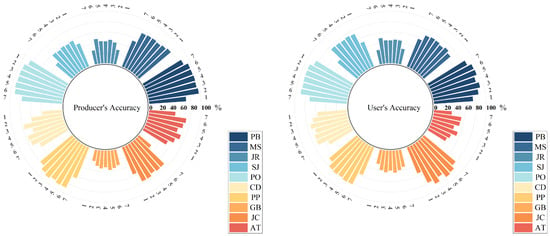
Figure 7.
Producer accuracy and user accuracy of each tree species in different experiments.
3.2. The Influence of Plurality Filling Method on Classification Results
To apply Plurality Filling as a post-processing step for classification, it is crucial to obtain segmented tree results at first. This study utilized the multi-resolution segmentation algorithm for image segmentation. Several experiments were conducted with different segmentation scales, shape factors, and compactness factors. Figure 8 illustrates the results in the topical study area under various segmentation experiments. In this study, the final adopted experiment utilized a segmentation scale of 30, a shape factor of 0.4, and a compactness factor of 0.5. This outcome ensures the purity of objects through the method of over-segmentation applied to the image. This over-segmentation method guarantees the integrity of individual objects and lays the foundation for the subsequent Plurality Filling process.
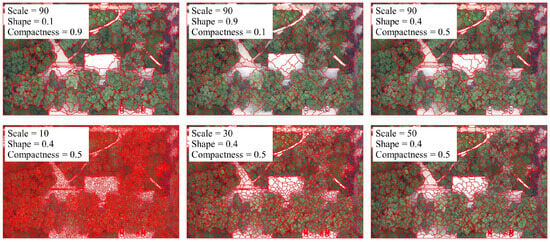
Figure 8.
Schematic diagram of multi-resolution segmentation results in part of the study area.
Table 5 illustrates the classification accuracy after applying Plurality Filling in the post-processing stage. It is evident from the table that the post-processing operation based on the Plurality Filling method significantly improved the classification accuracy of the results. Across various experiments, the overall accuracy of different experiments increased by 10.27% to 19.08%, and the Kappa coefficient improved by 0.12 to 0.22. Remarkably, the most substantial improvement occurred in Experiment 1 and Experiment 7, which initially had the lowest accuracy. Notably, the overall accuracy of Experiment 1 increased from 59.75% to 78.83%, and the Kappa coefficient rose from 0.54 to 0.76 after post-processing. All experiments exhibited an increase in classification accuracy after Plurality post-processing. In comparison, the accuracy improvement for other experiments that already achieved higher accuracy was limited, resulting in a reduced gap between the classification accuracies after post-processing. The experiment achieving the highest accuracy in the original classification results was Experiment 6, which incorporated multiple vegetation indices. However, after post-processing, Experiment 5, utilizing only a single vegetation index, attained the highest accuracy with an overall accuracy of 85.50% and a Kappa coefficient of 0.84. This underscores the effectiveness of post-processing, specifically the use of the Plurality Filling method, in refining classification outcomes, even when employing a simplified approach with just one vegetation index. To further validate the efficacy of Plurality Filling post-processing in enhancing classification accuracy, this study conducted traditional post-processing on the experimental results for comparative analysis.

Table 5.
Comparison of accuracy of different post-processing methods.
The traditional window sliding post-processing operation was applied to the original classification results using a 5 × 5 window size, and the resulting accuracies are presented in Table 5. In comparison to Plurality Filling post-processing, traditional post-processing exhibited a limited enhancement in classification accuracy. Following traditional post-processing, the overall accuracy across different experiments increased by only 5.40% to 11.43%, with the Kappa coefficient improving by 0.06 to 0.13. Like Plurality post-processing, Experiment 5 achieved the highest accuracy after traditional post-processing (OA = 79.89%, Kappa = 0.77).
Therefore, Experiment 5 was ultimately selected as the optimal solution due to its low feature count and high classification accuracy. Figure 9 shows the Plurality post-processed result of Experiment 5, which is characterized by the highest accuracy and is adopted as the final tree species map.
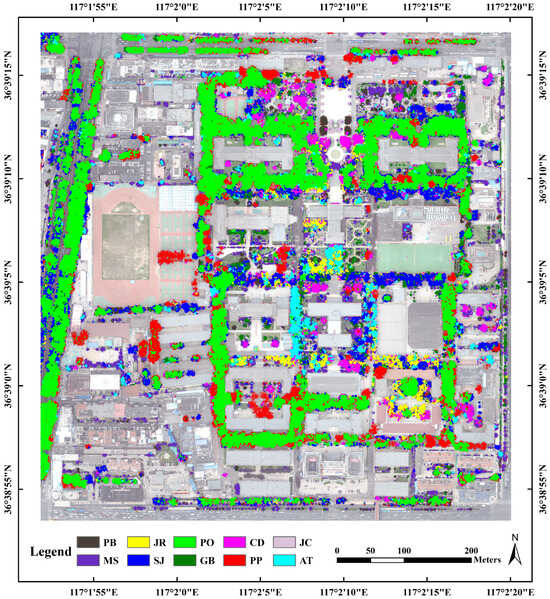
Figure 9.
The tree species map was obtained by the optimal scheme after Plurality post-processing.
The confusion matrix for the optimal scheme (Experiment 5), is illustrated in Figure 10. In terms of the original classification results, PB, PO, and PP exhibited the best classification performance, while major misclassifications occurred for JR, SJ, and GB. Overall, after applying both post-processing methods, there was a notable improvement in the classification accuracy of each tree species. Comparatively, the enhancement in classification accuracy was more significant with Plurality post-processing. In cases where GB was misclassified as AT, traditional post-processing failed to reduce misclassification and, in fact, worsened the issue. Plurality post-processing, on the other hand, reduced the misclassification rate from 0.25 to 0.03. Similarly, for instances where MS was misclassified as CD, traditional post-processing showed no improvement, whereas Plurality post-processing decreased the misclassification rate from 0.19 to 0.09. While it is important to note that Plurality post-processing generally significantly improved classification accuracy, it did not correct all instances of misclassification. For instance, in the classification of JR, although Plurality post-processing increased overall accuracy, there was an increase in misclassifying JR as SJ.

Figure 10.
Confusion matrix. (a) original result of the optimal scheme; (b) post-window sliding result of the optimal scheme; (c) plurality post-processing result of the optimal scheme.
The most significant difference in accuracy before and after post-processing is observed in Experiment 1, while Experiment 5 stands out as the optimal solution that balances efficiency and accuracy. Figure 11 provides a detailed comparison of the classification results for Experiment 1 and Experiment 5. The visible distinctions in the images clearly illustrate that Plurality Filling post-processing significantly reduces noise in the images, significantly diminishing the salt-and-pepper effect in the classification results. The post-processed outcomes exhibit a visually superior effect compared to the original results. In comparison to Experiment 5, the original classification result of Experiment 1 displayed an obvious presence of noise. Post-processing narrowed the gap between the results of the two experiments, yet the post-processed outcome of Experiment 5 remained superior to that of Experiment 1.
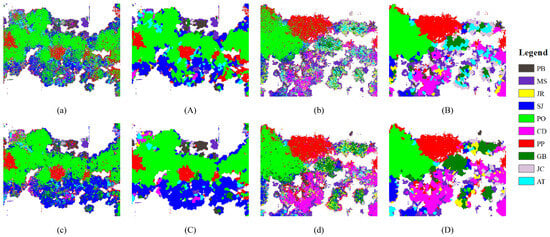
Figure 11.
Details of classification results before and after post-processing. (a,b) are the results of Experiment 1; (A,B) are the post-processing results of Experiment 1; (c,d) are the results of Experiment 5; (C,D) are the post-processing results of Experiment 5.
3.3. The Influence of Different Resolutions on Classification Results
We conducted resampling on the combinations of the Experiment 5 using the nearest neighbor method, resulting in resolutions of 0.1 m, 0.2 m, 0.3 m, 0.4 m, 0.5 m, 1 m, and 2 m. Each combination was input in the Random Forest classifier. The accuracy results are presented in Table 6. The overall accuracy of the original classification results decreases with a reduction in resolution. When the resolution decreased from 0.1 m to 0.2 m, the overall accuracy dropped by 1.75%, and the Kappa coefficient decreased by 0.02. However, the combination classification accuracy for resolutions of 0.2 m, 0.3 m, and 0.4 m is relatively consistent, with an average overall accuracy reduction of 0.57% for every 0.1 m decrease in resolution. Notably, a significant change in accuracy occurs when the resolution drops to 0.5 m. After Plurality post-processing, the overall accuracy for different resolutions increased on average by 12.30%, and the Kappa coefficient increased by an average of 0.14. Post-processing narrowed the classification accuracy gap between different resolution combinations.

Table 6.
Comparison of the accuracy of the optimal scheme with different resolutions.
3.4. The Influence of Different Seasons on Classification Results
To assess the seasonal impact on classification results, this study also acquired UAV-based RGB and LiDAR data for the study area on 24 October 2022. Using the same experimental setup for feature extraction, the classification results for each experiment were compared with those from July. The results are summarized in Table 7.

Table 7.
Comparison of accuracy of different post-processing methods in October.
Overall, the classification accuracy in October was lower than that of in July across different experiments. On average, all experiments exhibited a decrease in overall accuracy of 4.80%, and the Kappa coefficient decreased by 0.05. However, the overall change trend of accuracy after adding features was generally the same as July. The most significant difference occurred in the comparison between Experiment 6 and Experiment 5. After adding numerous vegetation indices, the overall accuracy of July increased by only 0.04%, while it increased by 3.07% in October which indicated that the impact of vegetation indices on tree species classification was greater in October than that in July. When considering the optimal feature combinations across different seasons, Experiment 6 which utilized all features achieved the highest classification accuracy in October (OA = 70.41%, Kappa = 0.66), and Experiment 3 attained the highest accuracy in July (OA = 74.08%, Kappa = 0.71). The difference between Experiment 6 and Experiment 3 is that Experiment 6 has added vegetation indices and texture features for the classification. Additionally, the Plurality post-processing method could significantly improve the accuracy of October’s classification results, with an average overall accuracy increase of 17.32% and a Kappa coefficient increase of 0.19. Comparatively, the efficacy of the method in enhancing accuracy appears notably superior in October when contrasted with its performance in July.
4. Discussion
Based on the RGB imagery and LiDAR data acquired by UAV in July, this study compared the impact of different feature combinations on urban tree species classification. The comparison revealed that the HSV color component and its texture features had a significantly positive effect on classification performance. The utilization of the HSV color component and its texture features increased the overall accuracy and Kappa coefficient by 11.33% and 0.13, respectively. The optimal feature combination experiment included almost all features, indicating that the addition of diverse features generally had a positive impact on accuracy improvement [22]. However, the addition of excessive texture features and vegetation indices led to information redundancy, limiting the improvement in accuracy. Meanwhile, using RGB data alone, the overall classification accuracy is relatively low which is only 55.25%. This suggests that single RGB data are insufficient for the classification of urban tree species. However, the fused RGB and LiDAR features have increased the overall accuracy by 18.49% which is consistent with the results of many studies [17,59]. For example, Li et al. [38] have used an improved algorithm to conduct individual tree species identification based on UAV RGB imagery and LiDAR data. And the results have proved that the combination of RGB and LiDAR data is much more suitable for tree species classification.
The proposed Plurality Filling method for post-processing has significantly improved the classification accuracy of urban tree species. After the post-processing operation, the overall accuracy of all experiments has increased by approximately 10% to 20%. This confirms the effectiveness of the Plurality Filling post-processing in improving classification accuracy. In order to better demonstrate its effectiveness, the conventional window sliding post-processing operation was also conducted which has improved the overall accuracy by an average of 6% across different experiments. In contrast, the proposed Plurality Filling post-processing method in this study has shown more excellent performance. The window sliding method involves sliding a fixed-size window across the image to reduce the salt-and-pepper effect. Typically, this method often yields favorable results. However, the high spatial heterogeneity of urban environments poses a challenge to the effectiveness of this method. In comparison, by assigning values to over-segmented objects, the Plurality Filling post-processing method could optimize irregular objects in complex environments which is much more suitable for tree species classification in urban environments. Therefore, the Plurality Filling post-processing method used in this study exhibits its clear advantages over the window sliding method, particularly in urban landscapes with high spatial heterogeneity.
The RGB-LiDAR fusion data and the Plurality Filling post-processing method have verified their excellent performance in improving the overall accuracy of urban tree species classification, especially in the areas with high canopy density urban trees. To validate their performances, comparative experiments in October were also conducted. The results revealed that the trend of overall accuracy variations was roughly similar in both July and October. The utilization of only RGB data yielded the lowest classification accuracy (OA = 47.70%, Kappa = 0.40). However, the incorporation of LiDAR features has increased the overall accuracy by 19.64%, with a Kappa coefficient improvement of 0.23. Consistent with the results in July, this confirms the effectiveness of integrating UAV-based RGB and LiDAR data in urban tree species classification. The primary distinction between the two months was the significantly higher improvement in accuracy for October when additional vegetation indices were added. Possible reasons may be the larger color variations exhibited by trees during the fall which make the vegetation indexes much more effective [60]. In contrast, trees are in their most vigorous state in July which could reduce the effectiveness of vegetation indices. Therefore, the addition of redundant vegetation indices in July could lead to redundant information. To verify this, violin plots were drawn based on the different performances of various tree species in the three bands of RGB data and seven vegetation indices for both month. Violin plots for two months are illustrated in Figure 12 and Figure 13, revealing that the vegetation indexes have a broader distribution range in October. Furthermore, the median difference in the boxplots of each tree species was greater in October than in July which has further emphasized the larger growth state variations among tree species during the fall.
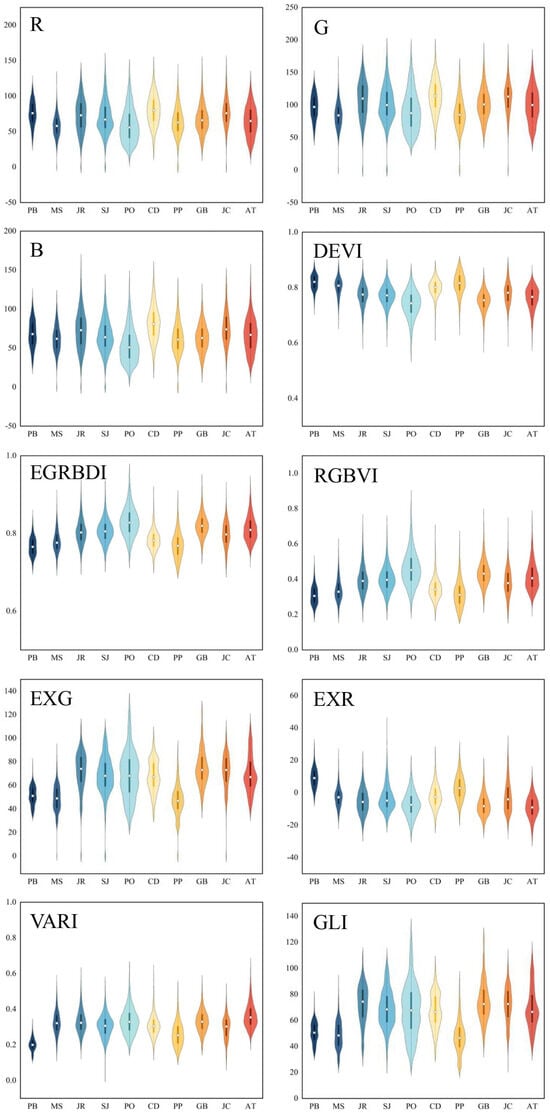
Figure 12.
Violin plots of 10 tree species on RGB and vegetation index in July.
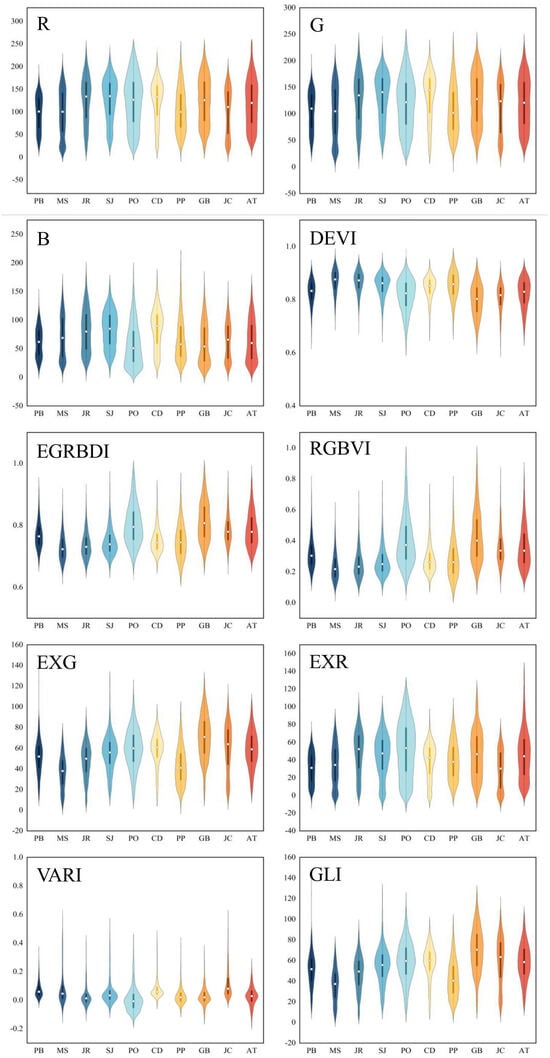
Figure 13.
Violin plots of 10 tree species on RGB and vegetation index in October.
This study has investigated the excellent performance of fused UAV-based RGB and LiDAR data in urban tree species classification. Yet, there are also some limitations. Various features were extracted from RGB data, but the features extracted from LiDAR were limited. Only one height feature and one intensity feature were extracted, failing to fully utilize the advantages of LiDAR data in three dimensions. Instead, LiDAR data was treated as a supplementary data source to RGB data. Guo et al. [25] extracted six diversity-related features from LiDAR data to describe forest biodiversity patterns. Listopad et al. [61] utilized LiDAR elevation data to create new indices characterizing the complexity of forest stand structures. Indeed, we had previously attempted to extract height percentile data and intensity percentile data from LiDAR point clouds. However, due to issues with data quality, a significant number of invalid values were encountered. It is also important to note that Random Forest is unable to compute a classification with databases presenting no data for classification features. In the future, there is a need for in-depth exploration of LiDAR features using higher-quality LiDAR data to fully utilize the advantages in three dimensions. Furthermore, this study only employed the Random Forest classifier for urban tree species classification. In the future, the deep learning method would be explored in the potential performance of RGB and LiDAR data in urban tree species classification.
5. Conclusions
This study was explored the effective performance of fused UAV-based RGB and LiDAR data in urban tree species classification, especially in areas with high canopy density. By exploring the optimal features and proposing the Plurality Filling method, a fine tree species classification with high overall accuracy was acquired. The research could offer a cost-effective and high-accuracy solution for urban tree species classification. And the main conclusions are as follows:
- (1)
- The fusion of RGB and LiDAR data is very effective in improving the overall accuracy of urban tree species classification with high canopy density. Compared with RGB data alone, the fused data have improved the overall accuracy from 55.25% to 73.74% in July, and from 47.70% to 67.34% in October;
- (2)
- Among the features extracted from RGB imagery, the HSV color components and their texture features notably influence classification accuracy. Their utilization in July and October resulted in an overall accuracy improvement of 11.33% and 4.33%, respectively. The optimal combination in July includes all features except redundant vegetation indices, while that in October includes all features;
- (3)
- The proposed Plurality Filling method has shown its excellent performance in improving overall accuracy and eliminating the salt-and-pepper effect. In this study, the proposed method has improved overall accuracy and Kappa coefficient of optimal combination by 11.76% and 0.14, respectively (OA = 85.50%, Kappa = 0.84).
Author Contributions
Conceptualization, J.W., Q.M. and X.Y.; methodology, J.W.; validation, J.W. and Q.M.; formal analysis, J.W.; investigation, Q.M.; resources, Q.M.; data curation, P.D., X.M., C.L. and C.H.; writing—original draft preparation, J.W. and Q.M.; writing—review and editing, J.W., Q.M., P.D. and X.M.; supervision, X.Y.; funding acquisition, Q.M. All authors have read and agreed to the published version of the manuscript.
Funding
This work was funded by the National Natural Science Foundation of China (No. 42101337) and the Shandong Provincial Natural Science Foundation (Nos. ZR2020QD019, ZR2020MD019).
Data Availability Statement
The datasets presented in this article are not readily available due to privacy concerns.
Conflicts of Interest
The authors declare no conflicts of interest. The funders had no role in the design of the study; in the collection, analyses, or interpretation of data; in the writing of the manuscript; or in the decision to publish the results.
References
- Guo, W.; Chen, L.; Fan, Y.; Liu, M.; Jiang, F. Effect of ambient air quality on subjective well-being among Chinese working adults. J. Clean. Prod. 2021, 296, 126509. [Google Scholar] [CrossRef]
- Nyelele, C.; Kroll, C.N.; Nowak, D.J. Present and future ecosystem services of trees in the Bronx, NY. Urban For. Urban Green. 2019, 42, 10–20. [Google Scholar] [CrossRef]
- Li, D.; Liao, W.; Rigden, A.J.; Liu, X.; Wang, D.; Malyshev, S.; Shevliakova, E. Urban heat island: Aerodynamics or imperviousness? Sci. Adv. 2019, 5, eaau4299. [Google Scholar] [CrossRef] [PubMed]
- Roy, S.; Byrne, J.; Pickering, C. A systematic quantitative review of urban tree benefits, costs, and assessment methods across cities in different climatic zones. Urban For. Urban Green. 2012, 11, 351–363. [Google Scholar] [CrossRef]
- Wang, Y.; Huang, H.; Yang, G.; Chen, W. Ecosystem Service Function Supply–Demand Evaluation of Urban Functional Green Space Based on Multi-Source Data Fusion. Remote Sens. 2023, 15, 118. [Google Scholar] [CrossRef]
- Cao, J.; Leng, W.; Liu, K.; Liu, L.; He, Z.; Zhu, Y. Object-Based Mangrove Species Classification Using Unmanned Aerial Vehicle Hyperspectral Images and Digital Surface Models. Remote Sens. 2018, 10, 89. [Google Scholar] [CrossRef]
- Kwon, R.; Ryu, Y.; Yang, T.; Zhong, Z.; Im, J. Merging multiple sensing platforms and deep learning empowers individual tree mapping and species detection at the city scale. ISPRS J. Photogramm. Remote Sens. 2023, 206, 201–221. [Google Scholar] [CrossRef]
- Fassnacht, F.E.; Latifi, H.; Stereńczak, K.; Modzelewska, A.; Lefsky, M.; Waser, L.T.; Straub, C.; Ghosh, A. Review of studies on tree species classification from remotely sensed data. Remote Sens. Environ. 2016, 186, 64–87. [Google Scholar] [CrossRef]
- Masek, J.G.; Hayes, D.J.; Joseph Hughes, M.; Healey, S.P.; Turner, D.P. The role of remote sensing in process-scaling studies of managed forest ecosystems. For. Ecol. Manag. 2015, 355, 109–123. [Google Scholar] [CrossRef]
- Hermosilla, T.; Bastyr, A.; Coops, N.C.; White, J.C.; Wulder, M.A. Mapping the presence and distribution of tree species in Canada?s forested ecosystems. Remote Sens. Environ. 2022, 282, 113276. [Google Scholar] [CrossRef]
- Li, Q.; Hu, B.; Shang, J.; Li, H. Fusion Approaches to Individual Tree Species Classification Using Multisource Remote Sensing Data. Forests 2023, 14, 1392. [Google Scholar] [CrossRef]
- Giri, C.; Ochieng, E.; Tieszen, L.L.; Zhu, Z.; Singh, A.; Loveland, T.; Masek, J.; Duke, N. Status and distribution of mangrove forests of the world using earth observation satellite data. Glob. Ecol. Biogeogr. 2011, 20, 154–159. [Google Scholar] [CrossRef]
- Ye, Z.; Wei, J.; Lin, Y.; Guo, Q.; Zhang, J.; Zhang, H.; Deng, H.; Yang, K. Extraction of Olive Crown Based on UAV Visible Images and the U2-Net Deep Learning Model. Remote Sens. 2022, 14, 1523. [Google Scholar] [CrossRef]
- Dainelli, R.; Toscano, P.; Di Gennaro, S.F.; Matese, A. Recent Advances in Unmanned Aerial Vehicle Forest Remote Sensing—A Systematic Review. Part I: A General Framework. Forests 2021, 12, 327. [Google Scholar] [CrossRef]
- Wu, F.; Ren, Y.; Wang, X. Application of Multi-Source Data for Mapping Plantation Based on Random Forest Algorithm in North China. Remote Sens. 2022, 14, 4946. [Google Scholar] [CrossRef]
- Sivanandam, P.; Lucieer, A. Tree Detection and Species Classification in a Mixed Species Forest Using Unoccupied Aircraft System (UAS) RGB and Multispectral Imagery. Remote Sens. 2022, 14, 4963. [Google Scholar] [CrossRef]
- Qin, H.; Zhou, W.; Yao, Y.; Wang, W. Individual tree segmentation and tree species classification in subtropical broadleaf forests using UAV-based LiDAR, hyperspectral, and ultrahigh-resolution RGB data. Remote Sens. Environ. 2022, 280, 113143. [Google Scholar] [CrossRef]
- Wu, Y.; Zhang, X. Object-Based Tree Species Classification Using Airborne Hyperspectral Images and LiDAR Data. Forests 2020, 11, 32. [Google Scholar] [CrossRef]
- Diez, Y.; Kentsch, S.; Fukuda, M.; Caceres, M.L.L.; Moritake, K.; Cabezas, M. Deep Learning in Forestry Using UAV-Acquired RGB Data: A Practical Review. Remote Sens. 2021, 13, 2837. [Google Scholar] [CrossRef]
- Schiefer, F.; Kattenborn, T.; Frick, A.; Frey, J.; Schall, P.; Koch, B.; Schmidtlein, S. Mapping forest tree species in high resolution UAV-based RGB-imagery by means of convolutional neural networks. ISPRS J. Photogramm. Remote Sens. 2020, 170, 205–215. [Google Scholar] [CrossRef]
- Zhang, C.; Xia, K.; Feng, H.; Yang, Y.; Du, X. Tree species classification using deep learning and RGB optical images obtained by an unmanned aerial vehicle. J. For. Res. 2021, 32, 1879–1888. [Google Scholar] [CrossRef]
- Wang, X.; Wang, Y.; Zhou, C.; Yin, L.; Feng, X. Urban forest monitoring based on multiple features at the single tree scale by UAV. Urban For. Urban Green. 2021, 58, 126958. [Google Scholar] [CrossRef]
- Feng, Q.; Liu, J.; Gong, J. UAV Remote Sensing for Urban Vegetation Mapping Using Random Forest and Texture Analysis. Remote Sens. 2015, 7, 1074–1094. [Google Scholar] [CrossRef]
- Xu, C.; Morgenroth, J.; Manley, B. Integrating Data from Discrete Return Airborne LiDAR and Optical Sensors to Enhance the Accuracy of Forest Description: A Review. Curr. For. Rep. 2015, 1, 206–219. [Google Scholar] [CrossRef]
- Guo, X.; Coops, N.C.; Tompalski, P.; Nielsen, S.E.; Bater, C.W.; John Stadt, J. Regional mapping of vegetation structure for biodiversity monitoring using airborne lidar data. Ecol. Inform. 2017, 38, 50–61. [Google Scholar] [CrossRef]
- Cao, L.; Liu, H.; Fu, X.; Zhang, Z.; Shen, X.; Ruan, H. Comparison of UAV LiDAR and Digital Aerial Photogrammetry Point Clouds for Estimating Forest Structural Attributes in Subtropical Planted Forests. Forests 2019, 10, 145. [Google Scholar] [CrossRef]
- Hastings, J.H.; Ollinger, S.V.; Ouimette, A.P.; Sanders-DeMott, R.; Palace, M.W.; Ducey, M.J.; Sullivan, F.B.; Basler, D.; Orwig, D.A. Tree Species Traits Determine the Success of LiDAR-Based Crown Mapping in a Mixed Temperate Forest. Remote Sens. 2020, 12, 309. [Google Scholar] [CrossRef]
- Singh, K.K.; Chen, G.; McCarter, J.B.; Meentemeyer, R.K. Effects of LiDAR point density and landscape context on estimates of urban forest biomass. ISPRS J. Photogramm. Remote Sens. 2015, 101, 310–322. [Google Scholar] [CrossRef]
- Dalponte, M.; Bruzzone, L.; Gianelle, D. Tree species classification in the Southern Alps based on the fusion of very high geometrical resolution multispectral/hyperspectral images and LiDAR data. Remote Sens. Environ. 2012, 123, 258–270. [Google Scholar] [CrossRef]
- Li, Q.; Wong, F.K.K.; Fung, T. Mapping multi-layered mangroves from multispectral, hyperspectral, and LiDAR data. Remote Sens. Environ. 2021, 258, 112403. [Google Scholar] [CrossRef]
- Deng, S.; Katoh, M.; Yu, X.; Hyyppä, J.; Gao, T. Comparison of Tree Species Classifications at the Individual Tree Level by Combining ALS Data and RGB Images Using Different Algorithms. Remote Sens. 2016, 8, 1034. [Google Scholar] [CrossRef]
- Ke, Y.; Quackenbush, L.J.; Im, J. Synergistic use of QuickBird multispectral imagery and LIDAR data for object-based forest species classification. Remote Sens. Environ. 2010, 114, 1141–1154. [Google Scholar] [CrossRef]
- You, H.; Tang, X.; You, Q.; Liu, Y.; Chen, J.; Wang, F. Study on the Differences between the Extraction Results of the Structural Parameters of Individual Trees for Different Tree Species Based on UAV LiDAR and High-Resolution RGB Images. Drones 2023, 7, 317. [Google Scholar] [CrossRef]
- Sankey, T.; Donager, J.; McVay, J.; Sankey, J.B. UAV lidar and hyperspectral fusion for forest monitoring in the southwestern USA. Remote Sens. Environ. 2017, 195, 30–43. [Google Scholar] [CrossRef]
- Zahidi, I.; Yusuf, B.; Hamedianfar, A.; Shafri, H.Z.M.; Mohamed, T.A. Object-based classification of QuickBird image and low point density LIDAR for tropical trees and shrubs mapping. Eur. J. Remote Sens. 2015, 48, 423–446. [Google Scholar] [CrossRef]
- Li, L.; Mu, X.; Chianucci, F.; Qi, J.; Jiang, J.; Zhou, J.; Chen, L.; Huang, H.; Yan, G.; Liu, S. Ultrahigh-resolution boreal forest canopy mapping: Combining UAV imagery and photogrammetric point clouds in a deep-learning-based approach. Int. J. Appl. Earth Obs. Geoinf. 2022, 107, 102686. [Google Scholar] [CrossRef]
- Lee, E.; Baek, W.; Jung, H. Mapping Tree Species Using CNN from Bi-Seasonal High-Resolution Drone Optic and LiDAR Data. Remote Sens. 2023, 15, 2140. [Google Scholar] [CrossRef]
- Li, Y.; Chai, G.; Wang, Y.; Lei, L.; Zhang, X. ACE R-CNN: An Attention Complementary and Edge Detection-Based Instance Segmentation Algorithm for Individual Tree Species Identification Using UAV RGB Images and LiDAR Data. Remote Sens. 2022, 14, 3035. [Google Scholar] [CrossRef]
- Wang, D.; Wan, B.; Qiu, P.; Su, Y.; Guo, Q.; Wu, X. Artificial Mangrove Species Mapping Using Pléiades-1: An Evaluation of Pixel-Based and Object-Based Classifications with Selected Machine Learning Algorithms. Remote Sens. 2018, 10, 294. [Google Scholar] [CrossRef]
- Zhang, K.; Hu, B. Individual Urban Tree Species Classification Using Very High Spatial Resolution Airborne Multi-Spectral Imagery Using Longitudinal Profiles. Remote Sens. 2012, 4, 1741–1757. [Google Scholar] [CrossRef]
- Wang, X.; Yang, N.; Liu, E.; Gu, W.; Zhang, J.; Zhao, S.; Sun, G.; Wang, J. Tree Species Classification Based on Self-Supervised Learning with Multisource Remote Sensing Images. Appl. Sci. 2023, 13, 1928. [Google Scholar] [CrossRef]
- Varin, M.; Chalghaf, B.; Joanisse, G. Object-Based Approach Using Very High Spatial Resolution 16-Band WorldView-3 and LiDAR Data for Tree Species Classification in a Broadleaf Forest in Quebec, Canada. Remote Sens. 2020, 12, 3092. [Google Scholar] [CrossRef]
- Pei, H.; Owari, T.; Tsuyuki, S.; Zhong, Y. Application of a Novel Multiscale Global Graph Convolutional Neural Network to Improve the Accuracy of Forest Type Classification Using Aerial Photographs. Remote Sens. 2023, 15, 1001. [Google Scholar] [CrossRef]
- Zhao, X.; Guo, Q.; Su, Y.; Xue, B. Improved progressive TIN densification filtering algorithm for airborne LiDAR data in forested areas. ISPRS J. Photogramm. Remote Sens. 2016, 117, 79–91. [Google Scholar] [CrossRef]
- Agapiou, A. Vegetation Extraction Using Visible-Bands from Openly Licensed Unmanned Aerial Vehicle Imagery. Drones 2020, 4, 27. [Google Scholar] [CrossRef]
- Bannari, A.; Morin, D.; Bonn, F.; Huete, A.R. A review of vegetation indices. Remote Sens. Rev. 1995, 13, 95–120. [Google Scholar] [CrossRef]
- Smith, A.R. Color gamut transform pairs. ACM Siggraph Comput. Graph. 1978, 12, 12–19. [Google Scholar] [CrossRef]
- Zhou, T.; Hu, Z.; Han, J.; Zhang, H. Green vegetation extraction based on visible light image of UAV (in Chinese). China Environ. Sci. 2021, 41, 2380–2390. [Google Scholar] [CrossRef]
- Bendig, J.; Yu, K.; Aasen, H.; Bolten, A.; Bennertz, S.; Broscheit, J.; Gnyp, M.L.; Bareth, G. Combining UAV-based plant height from crop surface models, visible, and near infrared vegetation indices for biomass monitoring in barley. Int. J. Appl. Earth Obs. Geoinf. 2015, 39, 79–87. [Google Scholar] [CrossRef]
- Gao, Y.; Lin, Y.; Wen, X.; Jian, W.; Gong, Y. Vegetation information recognition in visible band based on UAV images (in Chinese). Trans. Chin. Soc. Agric. Eng. 2020, 36, 178–189. [Google Scholar] [CrossRef]
- Louhaichi, M.; Borman, M.M.; Johnson, D.E. Spatially Located Platform and Aerial Photography for Documentation of Grazing Impacts on Wheat. Geocarto Int. 2001, 16, 65–70. [Google Scholar] [CrossRef]
- Woebbecke, D.M.; Meyer, G.E.; Von Bargen, K.; Mortensen, D.A. Color indices for weed identification under various soil, residue, and lighting conditions. Trans. ASAE 1994, 38, 259–269. [Google Scholar] [CrossRef]
- Meyer, G.E.; Hindman, T.W.; Laksmi, K. Machine vision detection parameters for plant species identification. In Precision Agriculture and Biological Quality, Proceedings of Photonics East (ISAM, VVDC, IEMB), Boston, MA, USA, 1–6 November 1999; SPIE: Bellingham WA, USA, 1999; Volume 3543, pp. 327–335. [Google Scholar]
- Gitelson, A.A.; Stark, R.; Grits, U.; Rundquist, D.; Kaufman, Y.; Derry, D. Vegetation and soil lines in visible spectral space: A concept and technique for remote estimation of vegetation fraction. Int. J. Remote Sens. 2002, 23, 2537–2562. [Google Scholar] [CrossRef]
- Haralick, R.M.; Shanmugam, K.; Dinstein, I.H. Textural features for image classification. IEEE Trans. Syst. Man Cybern. 1973, SMC-3, 610–621. [Google Scholar] [CrossRef]
- Belgiu, M.; Drăguţ, L. Random forest in remote sensing: A review of applications and future directions. ISPRS J. Photogramm. Remote Sens. 2016, 114, 24–31. [Google Scholar] [CrossRef]
- Liu, L.; Coops, N.C.; Aven, N.W.; Pang, Y. Mapping urban tree species using integrated airborne hyperspectral and LiDAR remote sensing data. Remote Sens. Environ. 2017, 200, 170–182. [Google Scholar] [CrossRef]
- Shi, Y.; Skidmore, A.K.; Wang, T.; Holzwarth, S.; Heiden, U.; Pinnel, N.; Zhu, X.; Heurich, M. Tree species classification using plant functional traits from LiDAR and hyperspectral data. Int. J. Appl. Earth Obs. Geoinf. 2018, 73, 207–219. [Google Scholar] [CrossRef]
- Liu, K.; Wang, A.; Zhang, S.; Zhu, Z.; Bi, Y.; Wang, Y.; Du, X. Tree species diversity mapping using UAS-based digital aerial photogrammetry point clouds and multispectral imageries in a subtropical forest invaded by moso bamboo (Phyllostachys edulis). Int. J. Appl. Earth Obs. Geoinf. 2021, 104, 102587. [Google Scholar] [CrossRef]
- Pu, R.; Landry, S.; Yu, Q. Assessing the potential of multi-seasonal high resolution Pléiades satellite imagery for mapping urban tree species. Int. J. Appl. Earth Obs. Geoinf. 2018, 71, 144–158. [Google Scholar] [CrossRef]
- Listopad, C.M.C.S.; Masters, R.E.; Drake, J.; Weishampel, J.; Branquinho, C. Structural diversity indices based on airborne LiDAR as ecological indicators for managing highly dynamic landscapes. Ecol. Indic. 2015, 57, 268–279. [Google Scholar] [CrossRef]
Disclaimer/Publisher’s Note: The statements, opinions and data contained in all publications are solely those of the individual author(s) and contributor(s) and not of MDPI and/or the editor(s). MDPI and/or the editor(s) disclaim responsibility for any injury to people or property resulting from any ideas, methods, instructions or products referred to in the content. |
© 2024 by the authors. Licensee MDPI, Basel, Switzerland. This article is an open access article distributed under the terms and conditions of the Creative Commons Attribution (CC BY) license (https://creativecommons.org/licenses/by/4.0/).