1. Introduction
The past decade witnessed a noticeable increase in the frequency of forest fires, causing considerable losses. According to the European Fire Center, fires from 2011 to 2018 covered areas over 25 hectares, and the total burned areas amounted to 103,000 hectares out of 525,000 hectares [
1]. In recent decades, forest fires have increased dramatically as a result of climate changes and other human factors, which have led to significant environmental and socioeconomic losses. Therefore, forest restoration is indispensable for preserving the ecological integrity of forests. From a sustainability perspective, it is necessary to restore forests after fires [
1,
2].
Restoration is an interdisciplinary field of science that requires practice, including diverse perspectives, which is important for ensuring effective environmental monitoring and restoration on a large scale. Therefore, it is essential to provide a protocol for stakeholders involved in post-fire forest restoration. This protocol aims to generate extensive data to determine regional reference values and improve restoration efforts, outputs, and associated benefits [
3]. Additionally, the criteria for restoration and the establishment of a comprehensive evaluation protocol extend beyond the perspective of a single actor (e.g., individual, industry, sector, or organization). Instead, multiple stakeholders are involved in the restoration process [
4,
5]. The restoration protocol should also be based on a comprehensive understanding of the impacts of wildfires on forest ecosystems by integrating environmental, social, and economic factors to support the restoration of burnt forests and suggest enhanced restoration strategies as well as tried-and-true adaptive value approaches in fire-prone populations [
2,
6]. Moreover, utilizing spatial support systems involves integrating data layers and evaluating the impacts of different methods in ways that objectively inform decision-making. This proves highly beneficial for decision-makers and analysts who are not experts in inference systems and geographic data.
Spatial Decision Support Systems are integrated information systems with contemporary structural functions designed to help in the prevention and suppression of forest fires [
7]. These systems are represented by suitability class maps that provide critical information for various decision-making levels. Monitoring and assistance with landscape restoration enables the analysis of landscape restructuring and provides information on crucial restoration phases [
8]. This not only reduces fire risks but also increases the region’s resilience to climate change, strengthens local value chains, and creates a network of local producers for capacity building, exchanges, and fundraising [
9].
Upon examining previous studies in post-fire forest restoration, it becomes evident that the findings highlight three main research gaps. The first gap is that many of these studies focused on a single aspect or criterion, indicating the inadequacy or incapacity of strategies or reforestation plans designed within a coherent framework to fulfill requirements or objectives in the medium or long term [
2,
10]. In more detail, the majority of previous studies concentrated on measuring and assessing vegetation cover from a strictly agricultural standpoint, with few studies addressing environmental restoration and considering the social and economic elements of forest regeneration following fires. The second research gap is the lack of studies analyzing the extent to which spatial support systems support forest management by combining more than one scientific model, as well as the connections between different types of problems and how they are addressed. The third gap pertains to the geographic diversity of the previous post-fire restoration studies, which predominantly concentrated on specific areas and regions. Additionally, most of these earlier studies can be deemed site-specific, as the proposed findings, protocols, and frameworks for post-fire forest restoration did not prove universally applicable across different locations.
Navigating the complexities of post-fire restoration requires a comprehensive understanding of ecological, social, and economic factors. This is where Comprehensive Criteria and Indicators (CCI) play a pivotal role. CCIs offer a structured framework for assessing and monitoring the various aspects of forest ecosystems, guiding decision-makers towards informed and sustainable restoration strategies [
4].
Integrating CCIs into Spatial Decision Support Systems (SDSS) amplifies their efficacy by leveraging spatial data and analytical tools. SDSS platforms provide a dynamic environment for synthesizing diverse data sources, modeling scenarios, and visualizing outcomes. By embedding CCIs within SDSS, stakeholders gain access to real-time insights and interactive capabilities crucial for effective decision-making in post-fire restoration efforts [
11].
The significance of integrating CCIs into SDSS lies in its ability to address the multifaceted challenges inherent in post-fire landscapes. Beyond ecological considerations, such as biodiversity conservation and soil regeneration, CCIs encompass social and economic dimensions, fostering inclusive and holistic restoration approaches. By aligning restoration actions with predetermined criteria and indicators, stakeholders can prioritize interventions, allocate resources efficiently, and mitigate potential conflicts arising from competing interests [
5,
12].
The objectives of integrating CCIs into SDSS extend beyond the immediate post-fire response to long-term sustainability and resilience. By establishing a systematic framework for evaluating restoration progress against predefined benchmarks, this integration fosters adaptive management practices. Furthermore, SDSS facilitates stakeholder engagement and collaboration by providing accessible platforms for data sharing, analysis, and decision support, enhancing transparency and accountability in restoration processes.
In essence, the integration of Comprehensive Criteria and Indicators into Spatial Decision Support Systems represents a paradigm shift in post-fire forest restoration. It empowers stakeholders with the tools and insights needed to navigate complex trade-offs, optimize resource allocation, and foster resilient ecosystems capable of withstanding future disturbances. As the frequency and intensity of wildfires continue to escalate in a changing climate, leveraging the synergy between CCIs and SDSS becomes increasingly indispensable for building sustainable landscapes and safeguarding ecosystem services for future generations.
Based on this rationale, this study focused on analyzing forest restoration after fires from a comprehensive perspective, including various criteria, indicators, models/techniques. Cultural/spiritual aspects, political/legal aspects, and infrastructure and services aspects are among the varied criteria explored in this investigation [
2]. Addressing these diverse criteria in investigating post-fire forest restoration in this study aims not only to acknowledge their relevance in managing forests under normal conditions but also to underscore their importance in the aftermath of fires. This emphasis is particularly crucial in developing countries where forest restoration often occurs in rudimentary and marginal ways, posing challenges for effective recovery and exacerbating degradation. Additionally, this study employs mixed methods and techniques, bridging a methodological gap in prior research by integrating the Analytical Hierarchy Process (AHP) and Decision-Making Trial and Evaluation Laboratory (DEMATEL) methods. These two methods were incorporated into a Spatial Decision Support System (SDSS) [
13]. Finally, to fill the graphical gap, Syrian forests are considered the primary case study in this research.
The primary objective of this study is to provide a comprehensive and current overview of the latest developments in post-fire forest restoration criteria integrated into regional decision-making processes, employing multi-criteria analysis tools such as the Analytical Hierarchy Process (AHP) and Decision-Making Trial and Evaluation Laboratory (DEMATEL). The outcomes of these tools are visually represented in maps and tables, presenting the most restorable places followed by the least recoverable ones. This prioritization is established through a comprehensive framework that encompasses six criteria: economic, environmental, social, infrastructural and educational, cultural and esthetic, and managerial and legal. This holistic approach assists decision-makers in effectively and sustainably restoring forests after fires, enhancing the overall comprehensiveness, utility, and sustainability of the study outcomes. It also facilitates time and cost savings since the decision-making process is integrated into national frameworks or regional/long-term planning development tracks based on a broad and objective scientific background. The primary questions addressed in this study include: Do comprehensive criteria mitigate hesitation, confusion, and bias among stakeholders and decision-makers during post-wildfire recovery efforts? Can the location maps of the most suitable areas for wildfire recovery indicators, as presented in this publication, be employed for long-term decision-making?
2. Materials and Methods
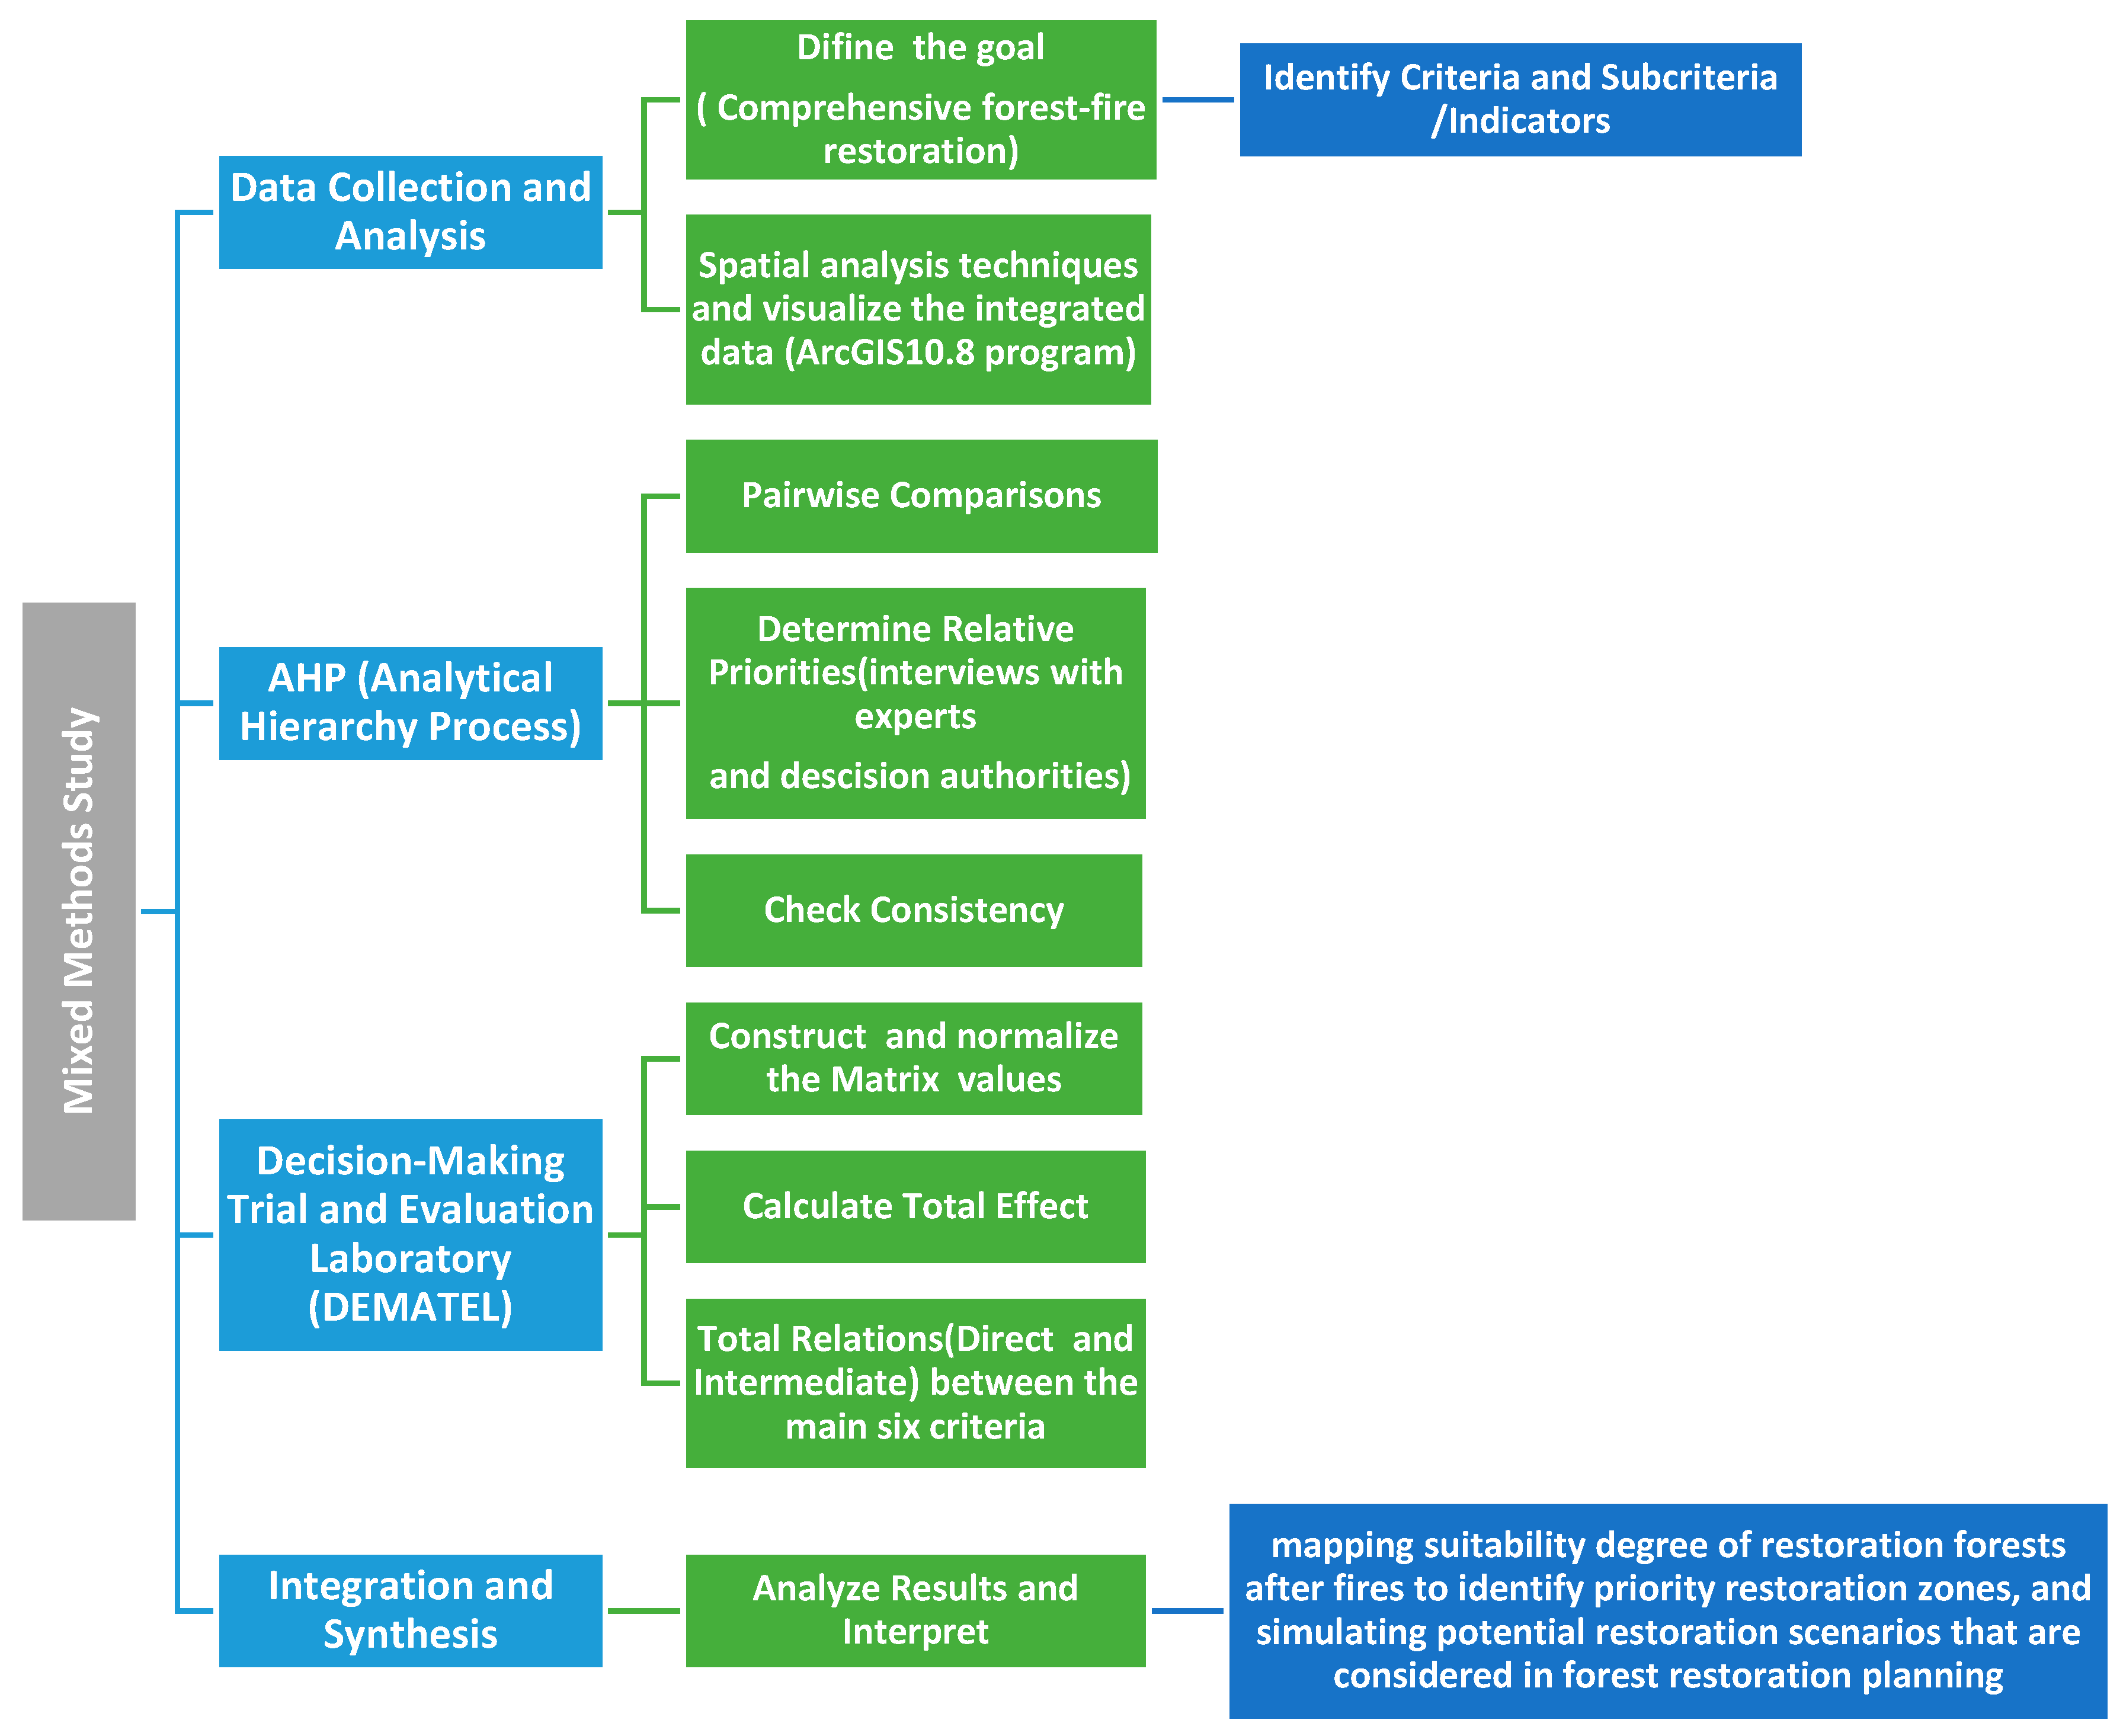
As previously mentioned, this study will employ mixed techniques, specifically the Analytical Hierarchy Process (AHP) and Decision-Making Trial and Evaluation Laboratory (DEMATEL) methods. Additionally, the study will center on Syrian forests as a case study. It is noteworthy that this research marks the inaugural investigation in Syria focusing on forest restoration after fires. In the Syrian context, this study delivers an easy-to-understand integrated framework, mitigating potential pitfalls that decision-makers may encounter when navigating complex multi-criteria decisions. The
Figure 1 presents an overview of the methodology.
It is worth mentioning that this study applied several methods to check the consistency and mitigate biases in the data. For example, data triangulation, where integrating multiple sources of local data can help mitigate biases inherent in individual datasets. By cross-referencing information from different sources and Syrian facilities, inconsistencies and biases can be identified and addressed. Additionally, external validation for documentation, where validating the accuracy of the data through external sources or similar case studies and neighborhood countries processes, can help confirm its reliability and identify any potential biases. This can involve comparing data against ground-truth observations, historical records, or expert assessments. Finally, expert judgment and decision-takers and stakeholders in the field provide valuable insights and feedback on the reliability and potential biases that are present in the data and help ensure biases are identified and addressed before decisions are made based on the data to validate the data and identify potential biases. By implementing these mechanisms for consistency checks and bias mitigation, researchers enhance the reliability and validity of their data and analyses, thereby improving the likelihood of making unbiased decisions on the ground in forest fire restoration efforts.
2.1. Study Area
The study area is located on the eastern slope of the Syrian coastal mountains, overseeing the Al-Ghab plain, about 50 km long. This slope features significant topographical variations, rising from 180 m above sea level to the highest peak, Nabi Matta, at 1560 m, covering a horizontal distance of 10 km. The climate in this region is characterized as moderate and humid Mediterranean. The rainy season extends from October through the end of May, with peak rainfall occurring when the annual precipitation reaches 1000 mm in December.
Within and outside the site, there are many forest villages where residents used different forest resources for a long time, forming a model for the interrelationship between forest and local communities within extensive areas, such as the selected region [
14]. The area of burnt forests within the selected area is about 4718 hectares, constituting 12% of the total area until September 2020—one year after the catastrophic forest fire in September 2019.
A section of Al-Ghab Plain, delineated by a yellow border, is considered the main study area or a practical model for testing the criteria for forest restoration after fire. The outcomes of this analysis are then generalized to the entire Al-Ghab Plain. The delineation of the appropriate area for each criterion is determined separately for the six specified criteria for restoration. Consequently, the results inform the optimal decision-making process for forest restoration in Al-Ghab Plain, the region most significantly affected by fires within the Syrian forests.
Figure 2 illustrates the outlined case study area.
2.2. Research Method
This study utilized two main analytical models: Analytical Hierarchy Process (AHP) and Decision-Making Trial and Evaluation Laboratory (DEMATEL). AHP is a mathematical method for analyzing complex decisions using both quantitative information and qualitative data based on the experience and intuition of the decision-makers. This method involves brainstorming to evaluate information gathered from the literature, workplace observations, and video footage [
14,
15]. Additionally, the AHP method was utilized to assess and determine the most appropriate alternatives for forest restoration strategies, considering the Syrian context. These alternatives include Forest Restoration Techniques, Integrated Forest Fire Decision-Making, Forest Fire Investment Planning System, and Suitable and Subsequent Treatments.
Recognizing the limitation of AHP in appreciating interrelationships between criteria, the study incorporated another supported technique—Decision-Making Trial and Evaluation Laboratory (DEMATEL). DEMATEL is used to statistically extract the interrelationship and correlation between the problem’s criteria. Utilizing a causal graph to illustrate the contextual links between the criteria and a threshold value aiding decision-makers in discerning criteria effectively mitigates major and minor impacts, enhancing resource performance in the long run for informed decision-making regarding challenges. Additionally, DEMATEL gives a cause-and-effect chain, employing expert judgment to more effectively comprehend the interactions between variables and identify which components are more significant [
16].
The aforementioned analytical models, AHP and DEMATEL, were integrated with Spatial Decision Support Systems (SDSS) to address problems [
17], mitigate fire risks [
18,
19], and determine the aspects and values of the forest environment being restored. This integration aims to explore the potential social, political, and environmental impacts, whether tangible or intangible [
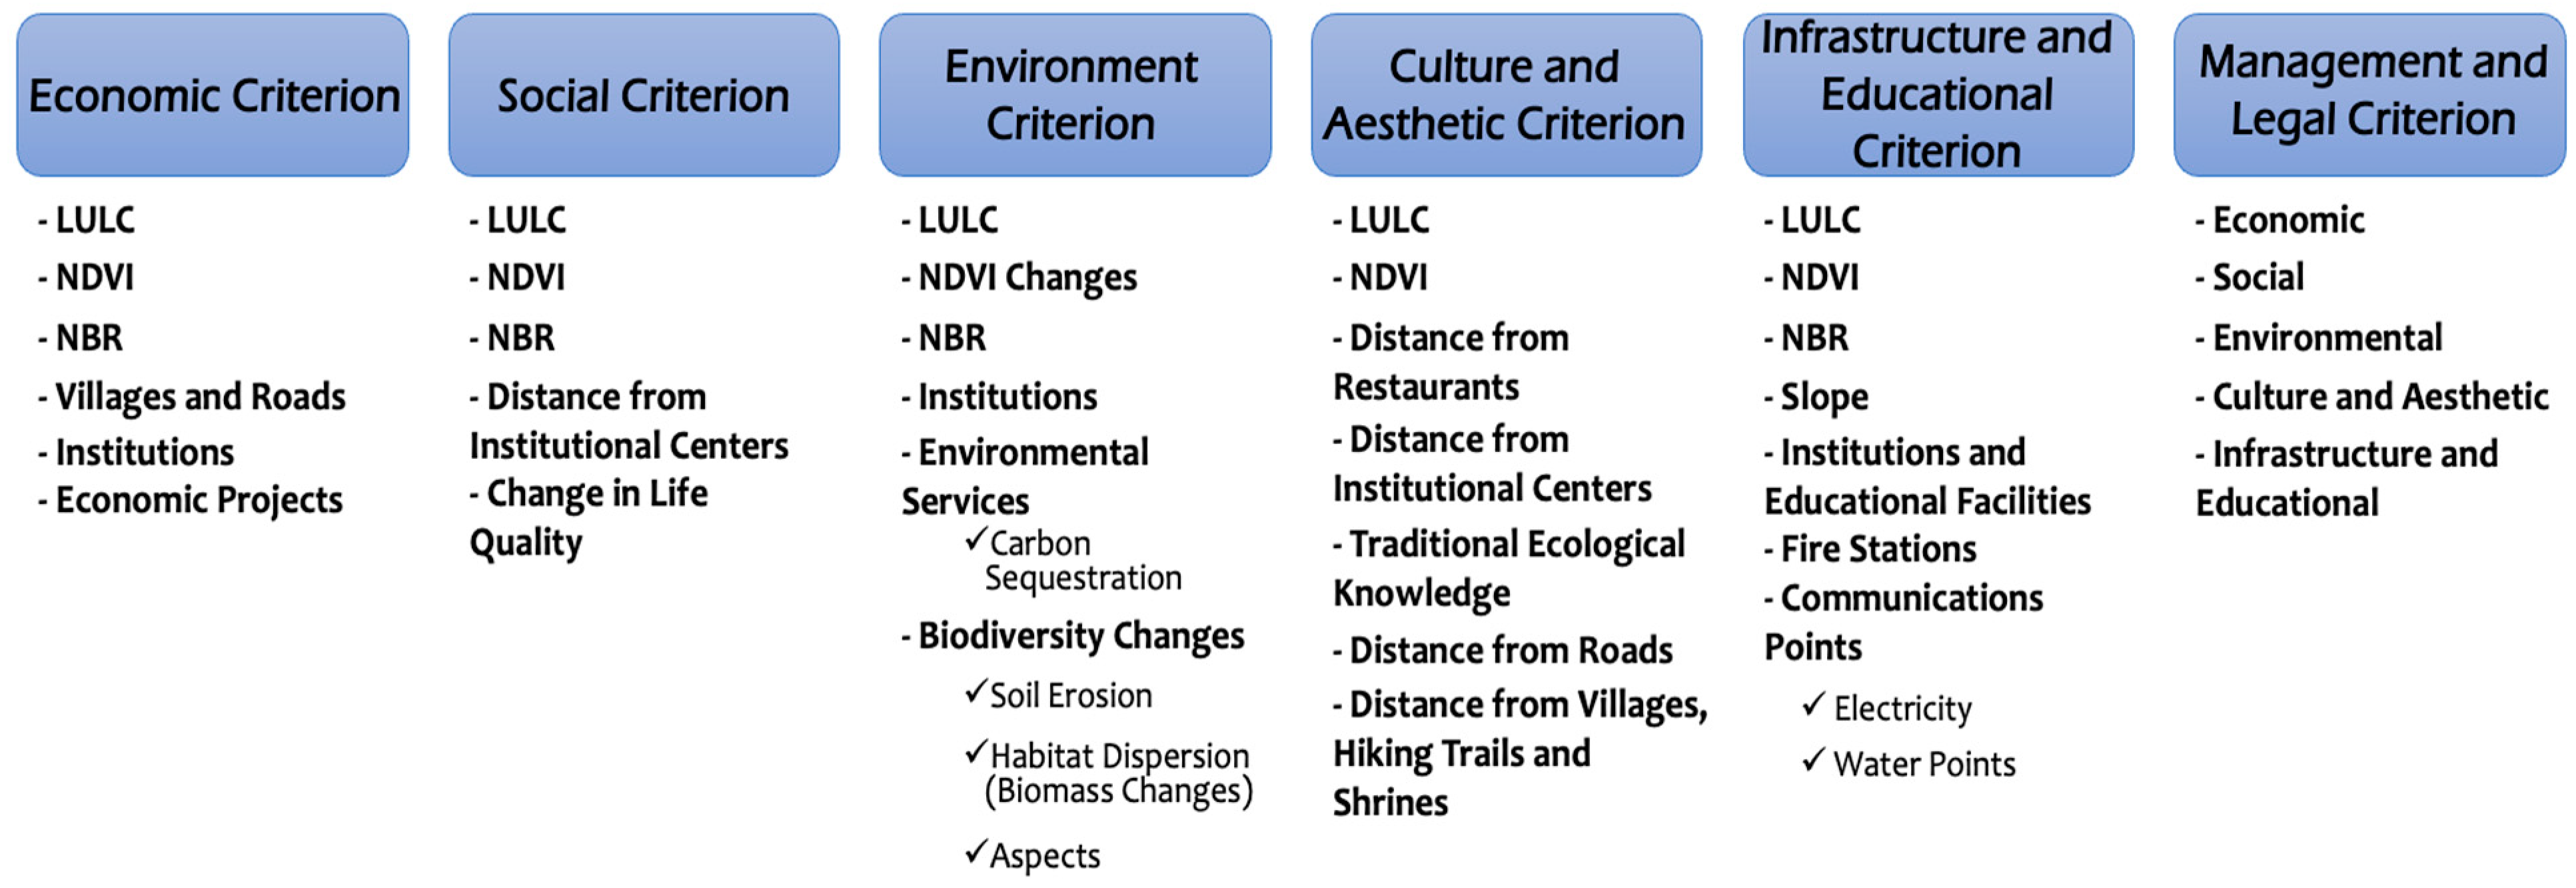
20]. In pursuit of meeting consistency requirements, locally generated questions were incorporated to assign weights to each criterion. Consequently, six primary criteria and twenty-five sub-criteria or indicators (economic, social, environmental, administrative, legal, cultural, esthetic, infrastructure, and education) were established, as illustrated in
Table 1 below. These criteria were meticulously selected based on the Syrian context, with the input of 21 local experts in the field of post-fire forest restoration, encompassing academics, forest engineers, owners, and decision-makers.
Technical Methodological Stages
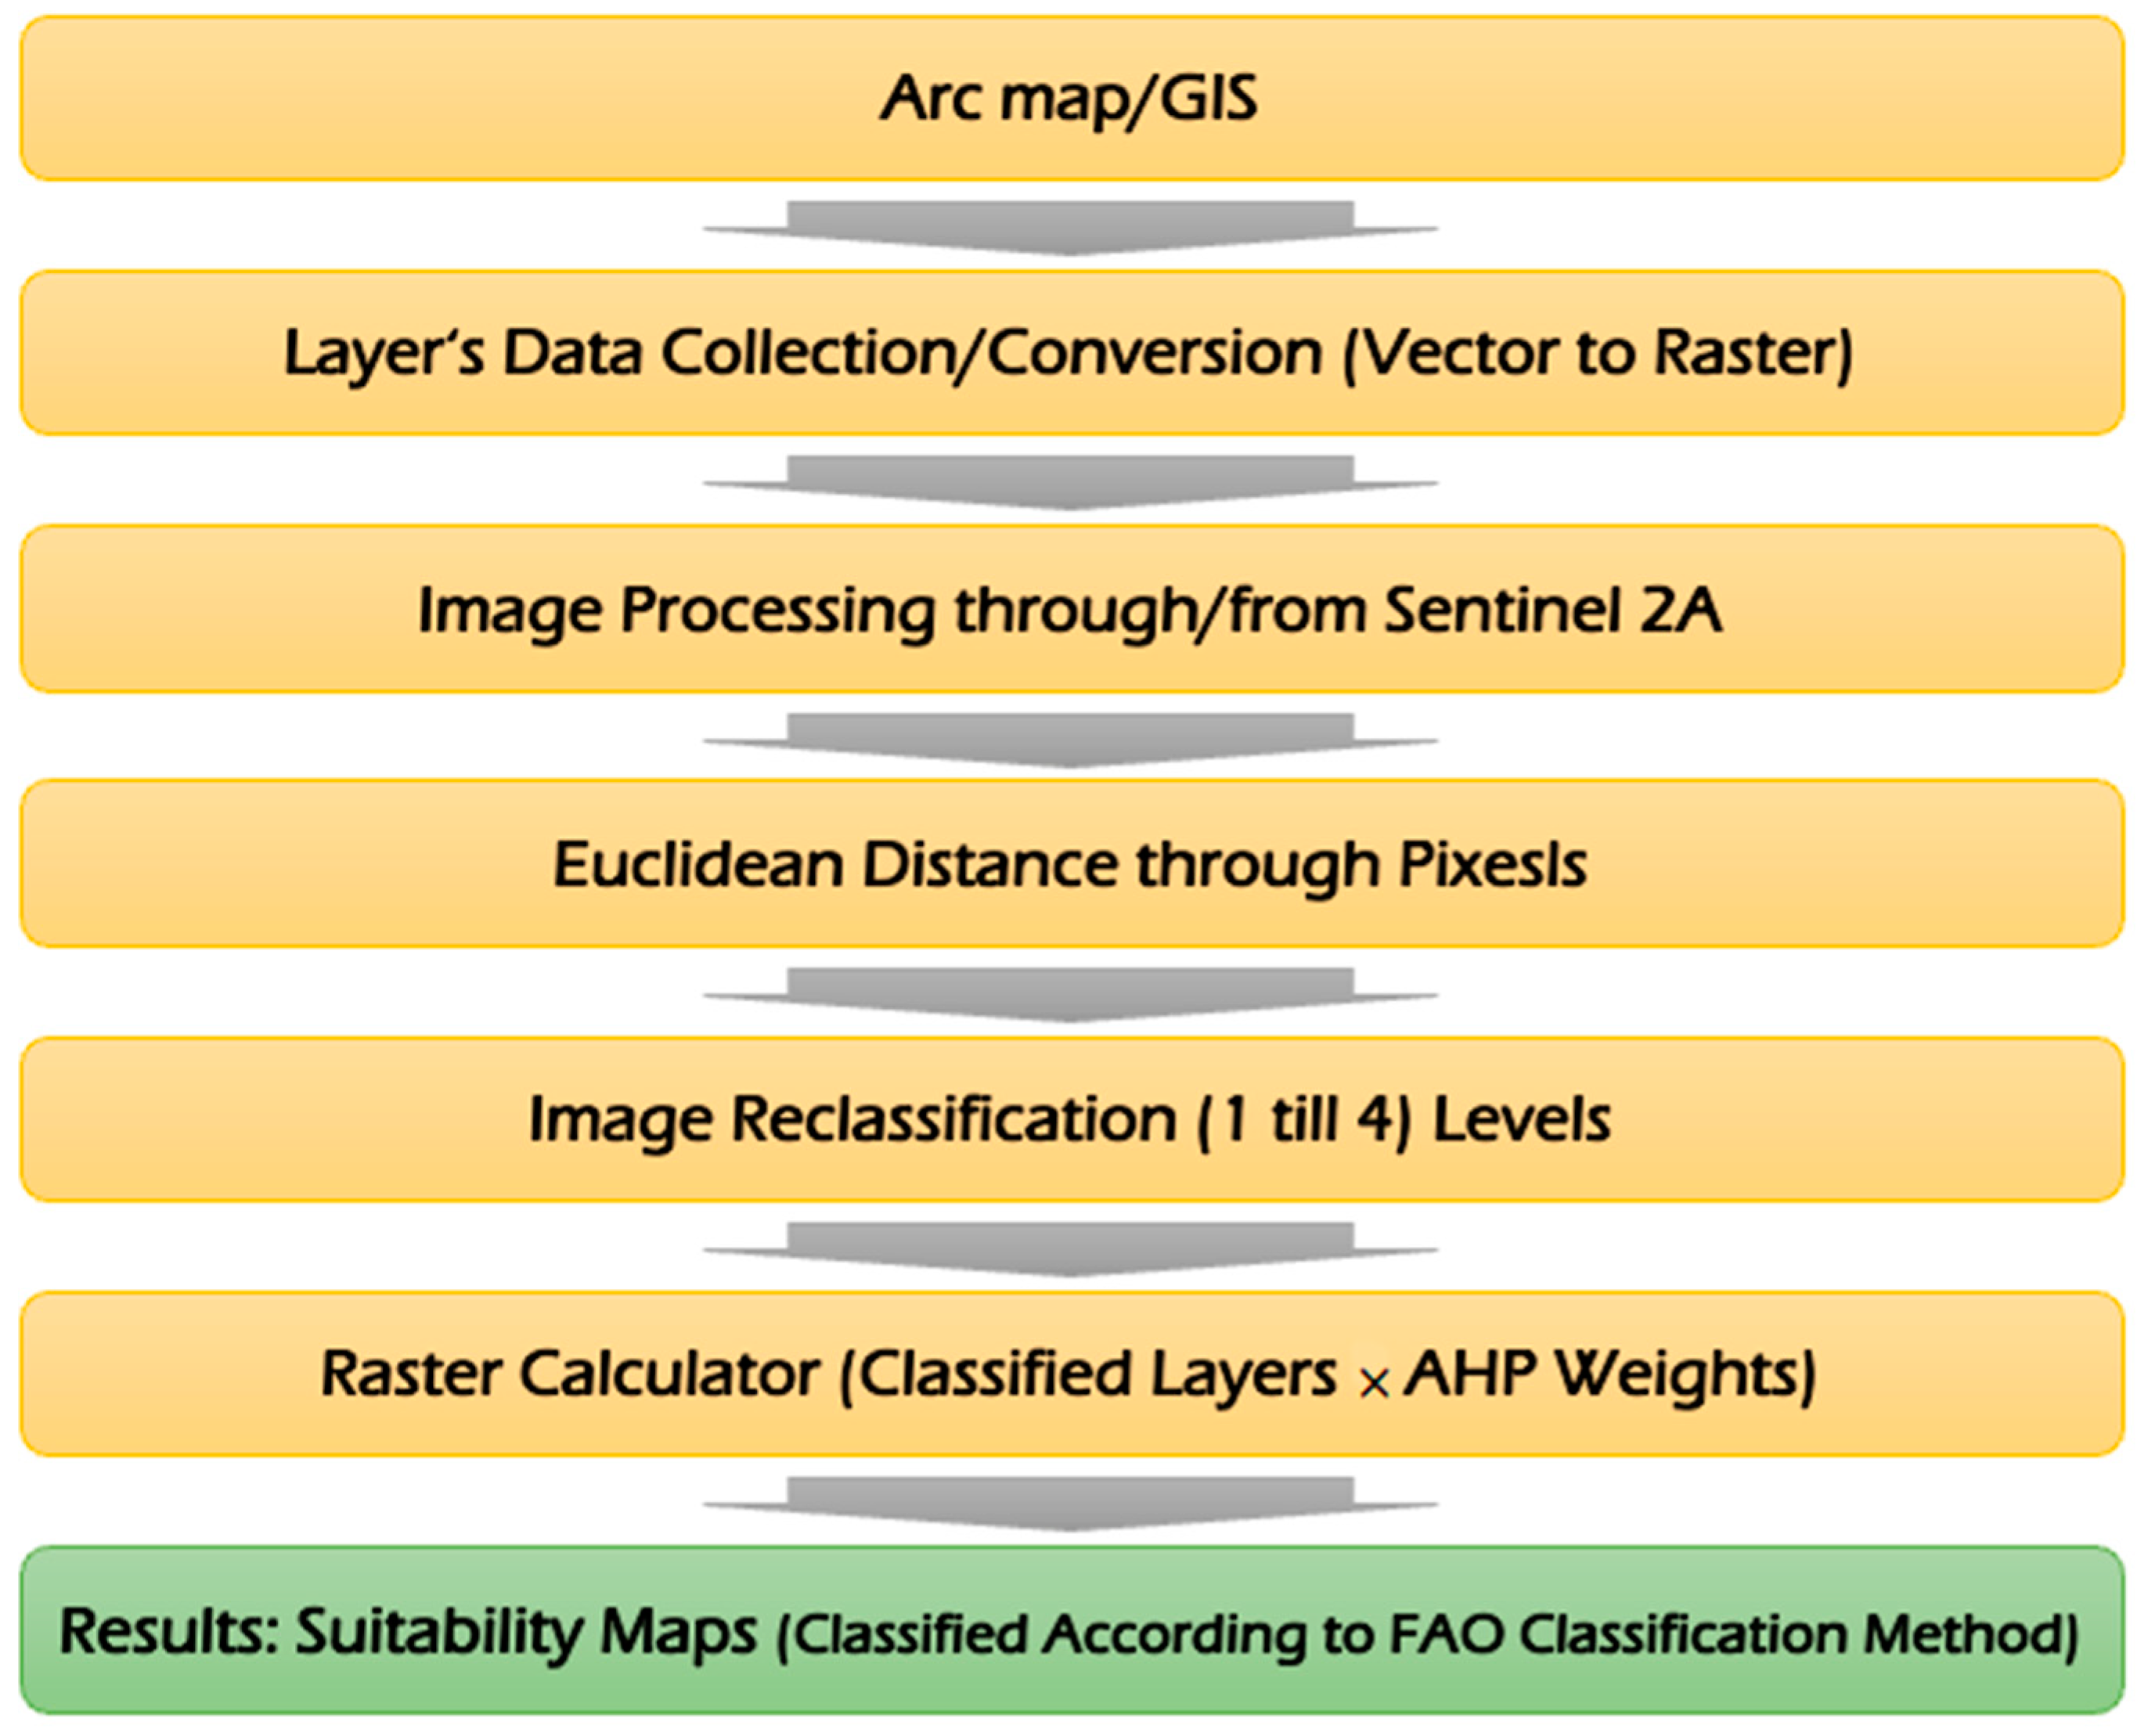
This study’s research methodology unfolds in four primary stages. In the initial stage, the focus lies on utilizing ArcGIS (Spatial Analysis Tools Dialog) to extract the standard map of the study area, categorizing it based on specific requirements. The process commences by downloading Sentinel 2A satellite images both before the wildfire on 18 September 2019 and after the severe fire on 17 September 2020. The creation of the ground suitability (LS) layer involves using a Raster calculator, amalgamating elements based on four degrees. Subsequently, the layers are integrated, categories are reclassified according to degrees, and all indicators are combined and multiplied by the AHP values for each criterion using spatial analysis tools in ArcGIS. This yields a map for each criterion, culminating in the final map that combines delta NBR 2019–2023 and NDVI values. The changes in vegetation cover are monitored, considering grasses, trees, and forests, allowing for the calculation of area and mapping in the year of the fire, a year after the fire, and the current status. The categories are further divided into severe, medium, and light, facilitating the assessment of habitat scattering, resilience degree, natural regeneration, and the most affected villages. Reclassification is then performed to obtain images in a standardized format and classification, determining the degree by color and multiplying it by AHP values to generate the final map, along with adhering to the color gradient. NDVI = (NIR − Red)/(NIR + Red) − ∆ NDVI = Prefire NDVI − Postfire NDVI.
The common layers selected include a settlement map produced using Sentinel 2 satellite imagery and verified with Google Earth. A Land Use/Land Cover Changes (LU/LC) map is created from the 2021 multi-spectral data sets collected from USGS remote sensing data set resources, with a Kappa coefficient of 0.35–0.50. The maximum likelihood classifier is employed for parametric classification, dividing the map into categories such as dense forest, degraded forest, grassland, farmland, open land, and rock. This classification aligns with the Land Cover Classification System (LCCS) developed by the Food and Agriculture Organization of the United Nations (FAO) [
21]. The following
Figure 3 summarizes the previously explained technical process of using ArcGIS in this study, while details of the input data, sources, and processing method platforms can be found in
Table A1 in
Appendix A.
The second stage involves determining the final map based on valid criteria through two approaches: (a) weights of sub-criteria are established using expert opinions and interviews, and (b) weights of decision problems and criteria are determined utilizing an AHP model. The AHP model assigns weights to each layer on a scale from 1 to 9, reflecting the matrix of pairwise comparisons [
18,
19]. The Consistency Index (CI) is obtained during this stage by calculating the maximum eigenvalue (λmax) for each matrix. The stability index (CI) is then compared with the random index (RI), with an acceptable upper limit of 10% [
22,
23]. Decision reconsideration is necessary if the CI exceeds 10% [
17,
24]. The following equation describes the calculation of Consistency Index (CI):
Inconsistencies prompt a review of comparisons or a check of initial values in the pairwise comparison matrix [
25]. The arithmetic values of each alternative for every criterion are included in a single matrix, applying the computed priority and summing the values for the final result. Simultaneously, the AHP method is employed to select the best alternative, achieving restoration aspects. Collaboration with local experts aids in categorizing forest restoration choices, assessing criterion importance, and making decisions based on desired goals [
26]. This includes creating maps for each criterion and general target, examining result sensitivity, and determining priority in risk management areas for informed decision-making [
3,
4].
The third stage focuses on integrating the Decision-Making Trial and Evaluation Laboratory (DEMATEL) with AHP to analyze relationships among the six criteria. The Consistency Ratio (CR) is employed to generate essential map layers in geographic information systems, resulting in individual maps for each of the six criteria selected. These maps include various layers such as topography, slope, roads, urban centers, villages, and services. Sub-layers are assigned values from 0 to 10 for the final output map, producing a comprehensive suitable map [
20,
27]. Pairwise comparisons are conducted to determine the differentials between the criteria based on their importance in the decision-making process. The value of each cell in one column (the criterion value) is divided by the final sum, creating a normal pairwise comparison matrix. The weight of each criterion is divided by the sum of the results, providing an average value. Consistency is calculated by multiplying the criterion value by its weight. The optimal choice is the one with the highest value (priority) for each criterion and the overall objective [
28,
29]. Decision-making is facilitated by examining result sensitivity and prioritizing risk management areas on the maps [
30,
31].
The fourth and final stage focuses on preparing criteria and their indicator layers to produce spatial maps, creating a suitable map for each criterion, and combining them to obtain the final composite map. The prioritization of areas for restoration, based on environmental, social, economic, cultural, infrastructural, and administrative criteria, is subject to changes depending on the precision introduced by additional criteria that clarify the analysis and objective weighting [
32,
33]. During the re-classification process, all criterion maps are categorized into four levels: (N) not suitable, (S3–S2) marginally suitable, (S1) very suitable/suitable with values ranging from 1 to 4. Each criterion is individually analyzed for suitability based on the criteria outlined by the Food and Agriculture Organization (FAO). Subsequently, all layers are classified according to a predefined table, and four composite layers are generated through a weighted linear overlay analysis using weights derived from the pairwise comparison matrix [
34,
35]. These layers identify areas prioritized for restoration based on environmental, social, economic, cultural, infrastructural, and administrative considerations. Furthermore, weight values are assigned to each sub-criterion to compute the final suitability map for prioritizing regeneration regions. This enables the practical execution of rehabilitation through a multipurpose landscape planning approach, highlighting its significance in the selection of priorities. The restoration suitability analysis follows a structured process involving the development of return criteria, acquisition of GIS datasets for each criterion, construction of suitability maps, visualization of a suitability analysis model, and planning of prospective return locations [
36]. Leveraging a multi-criteria technique, various criteria maps are analyzed to generate a suitability map for each criterion, which is then integrated to produce the final suitability rating. The selection of areas for restoration, based on environmental, social, economic, cultural, infrastructural, and governance characteristics, may yield varied results contingent upon the precision introduced through additional criteria [
37]. The following
Figure 4 presents the various criteria and their indicators prepared for use in ArcGIS for the six criteria (economic, social, environmental, cultural and esthetic, infrastructural, and managerial).
3. Results
The results of this study can be summarized into three core main finding groups: AHP results (for the six main criteria and for the four alternatives), the results of SDSS (based on the DEMATEL model), and GIS (spatial suitability maps). These findings are presented as follows.
3.1. Analytical Hierarchy Process (AHP) Results
3.1.1. Based on the Six Criteria
Table 2 and
Table 3 below present the standard and normalized pairwise comparison matrices for the six core criteria of post-fire forest restoration used in this study (e.g., economic, social, environmental, cultural and esthetic, infrastructural, and managerial).
According to these results (criteria weights),
Figure 5. illustrates the ranking of criteria based on their importance for restoration after the forest fire in the Syrian study area. The order of the six criteria is as follows: economic (36%), social (24%), management and legal (20%), environment (10%), culture and esthetic (6%), and infrastructure and educational (4%). Notably, the most crucial sub-criteria within the economic criterion is economic evaluation, representing 17.63% of the total percentage for the economic criterion. Conversely, the sub-criteria with the least contribution to the infrastructure and educational criterion is the number of institutions participating in the restoration, accounting for only 0.29% of the total percentage.
Additionally, by applying the Consistency Index (CI), where λmax = 6.350, the obtained results show a Consistency Index (CI) of 0.07. The Consistency Ratio (CR) is then calculated as CI/RI = 0.07/1.24 = 0.0564, which is less than 0.10. This ratio value indicates the reasonability of the criteria assumed in the measurements to be factored into the decision-making process using the Analytical Hierarchy Process (AHP).
3.1.2. Based on the Alternatives for Forest Restoration Strategies
The Analytical Hierarchy Process (AHP) is also used to rank the four main alternatives for forest restoration strategies: Forest Restoration Techniques, Integrated Forest Fire Decision-Making, Forest Fire Investment Planning System, and Suitable and Subsequent Treatments.
Table 4 below presents the results of the pairwise comparison matrix between these alternatives, as well as the score of the Consistency Index (CI) (0.044) and Consistency Ratio (CR) (0.049).
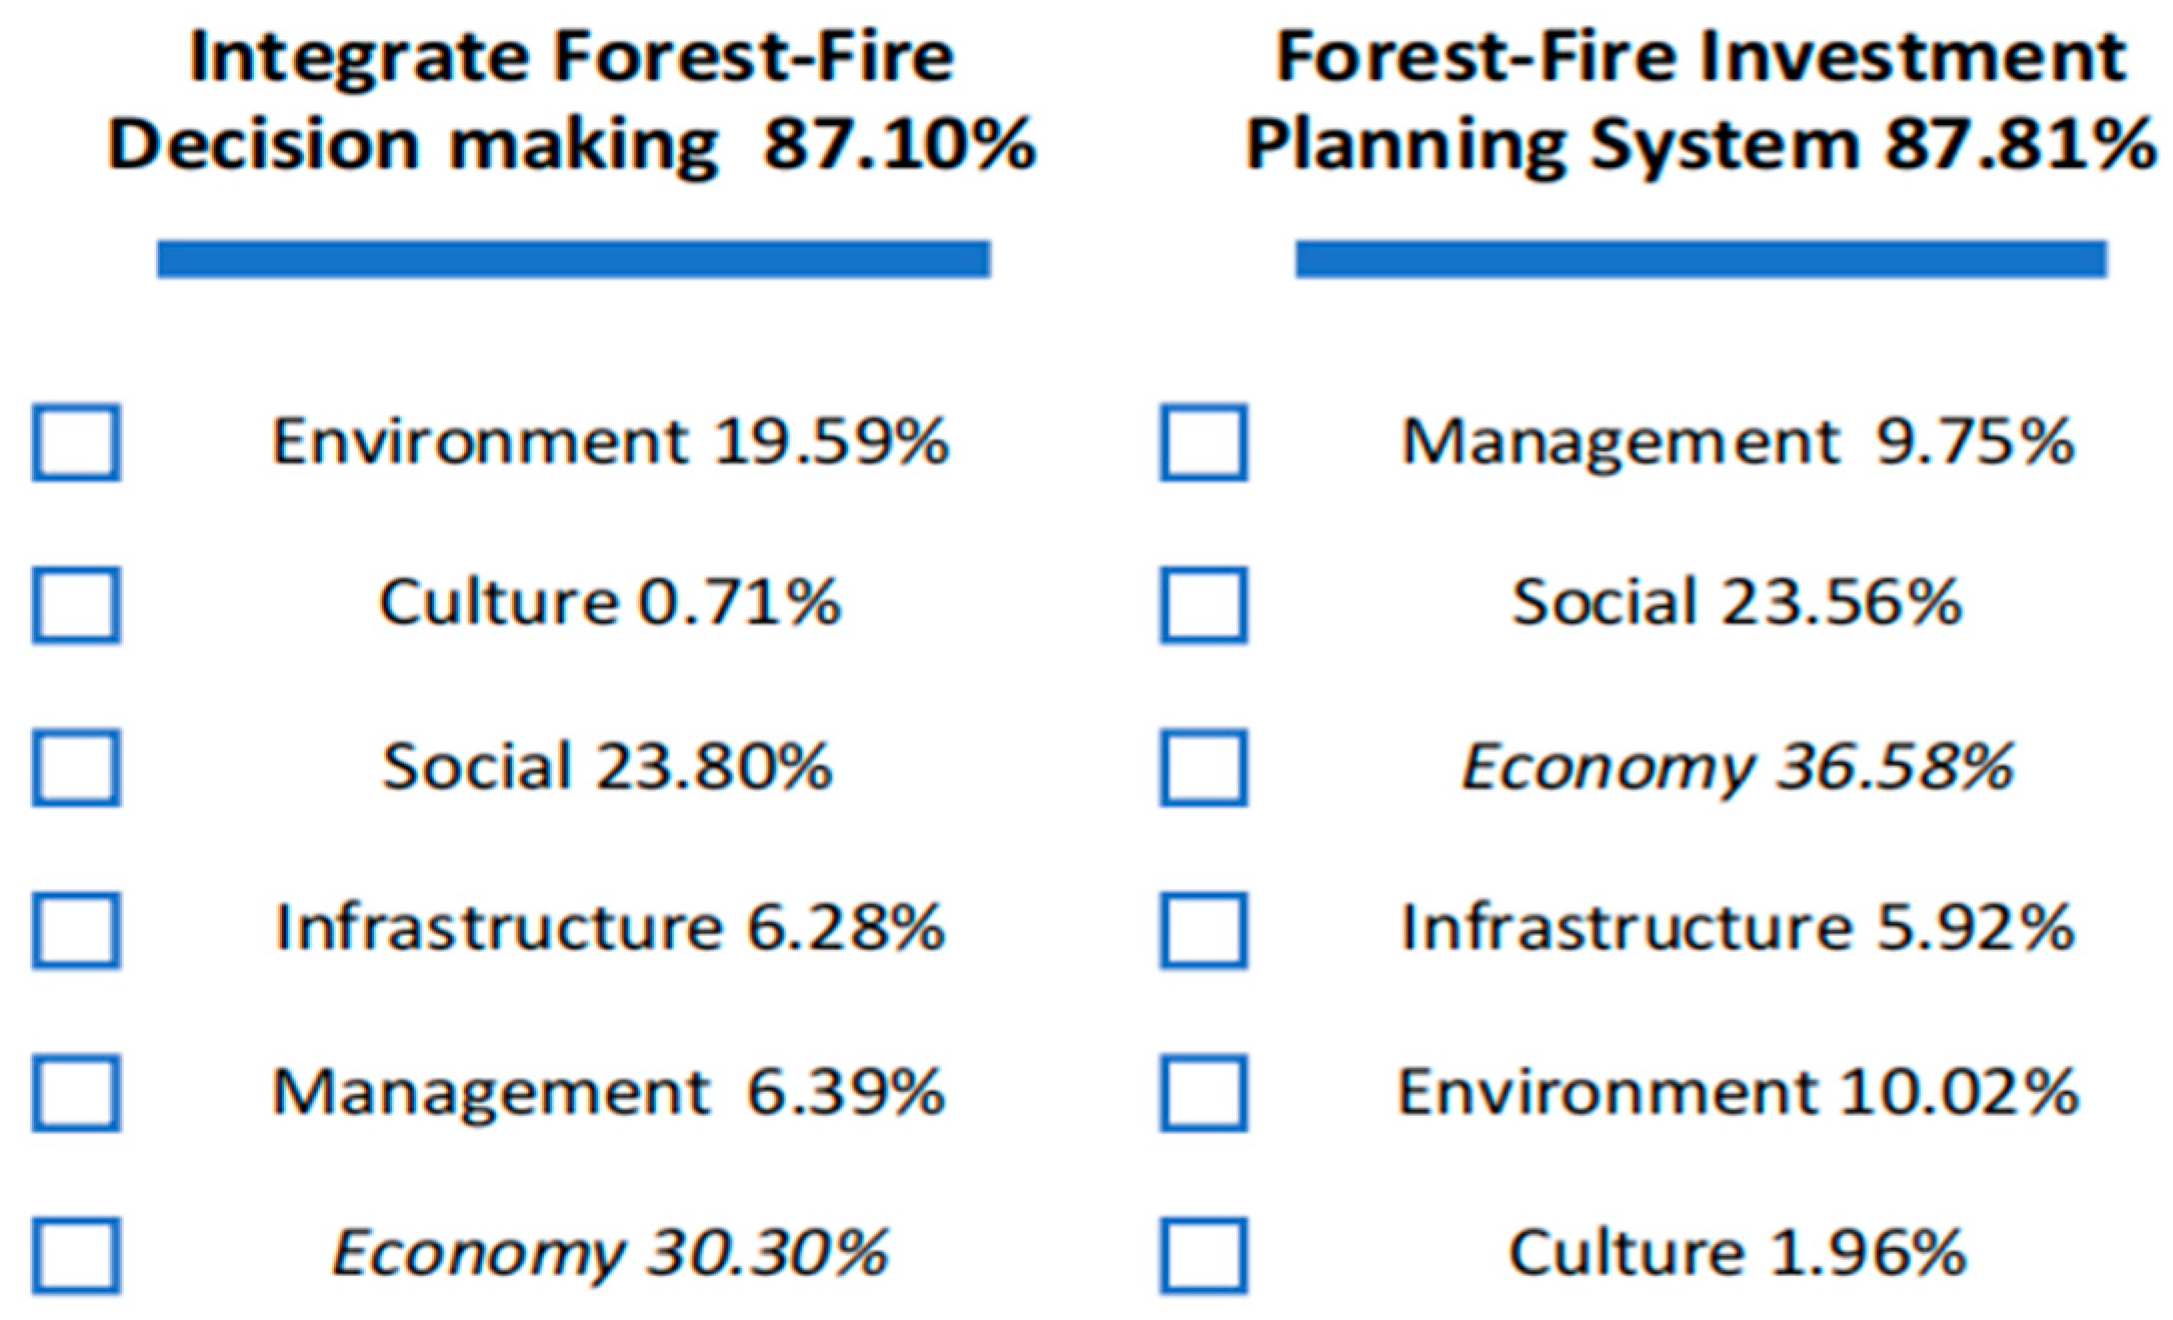
Table 5 below presents the final ranking of these previously mentioned alternatives, where the Integrated Forest Fire Decision-Making securing the top position, followed by the Forest Fire Investment Planning System, Forest Restoration Techniques, and Suitable and Subsequent Treatments, respectively.
In comparing the first two alternative strategies on the list, namely Forest Fire Decision-Making and Forest Fire Investment Planning System, using the AHP method with each of the six criteria individually, it was revealed that the third alternative strategy, Forest Fire Investment Planning System, held greater significance among the four alternatives. Notably, the minimal difference of 0.71% between the second and third alternative strategies underscores the precision of the AHP method as a reliable tool in aiding decision-making for the restoration of Syrian forests post-fire. The breakdown of the percentage contribution of each of the six criteria to the top two alternative strategies is presented in
Figure 6. In the context of forest fire restoration, where decisions may have significant ecological, social, and economic implications, even a small percentage of false data can lead to suboptimal outcomes. However, it is challenging to specify an exact percentage threshold of false data that renders the system irrelevant, as this can vary depending on the specific context and the criticality of the data in question.
3.2. Spatial Decision Support Systems (SDSS) and Decision-Making Trial and Evaluation Laboratory (DEMATEL) Results
The relationship between cause-and-effect criteria can be translated into a comprehensible structural model, enhancing the understanding of a specific problem and facilitating the identification of solutions [
35]. The following equation is used:
where
xij denotes the degree to which the respondent believes factor
i influences factor
j, and
H represents the number of respondents.
Table 6 below presents the results of a pairwise comparison matrix between the main six criteria.
Managers were surveyed to provide responses, and a questionnaire was received containing a pairwise comparison matrix aggregated through the weighted geometric mean method of individual ratings. Each item in matrix
D ranges between zero and one, and the computation of
D is performed by
D = A × S, where
According to
Table 7, the alternatives are ranked using the AHP method, and the decision maker’s preferences are C3 > C2 > C1. The direct and indirect influence of the criterion T =
D(1 −
D) − 1. Furthermore, the order of criteria is C2 > C4 > C3. This criterion order is utilized in the subsequent evaluation process. Values close to 0 are deemed acceptable, obviating the need to repeat the evaluation process for the management plans. Analyzing the performance of all alternatives related to the defined criteria suggests that different alternatives yield optimal results for different criteria [
38,
39,
40].
The decision-maker is required to establish a threshold value, denoted as alpha (0.9542), to filter out insignificant effects. Only effects surpassing this threshold value are selected and represented in the relationship plot. The threshold value is determined by averaging the components in the T Matrix, as illustrated in
Figure 7 [
15].
Figure 7 reveals that no criteria are influenced by the infrastructure criterion (C5). Instead, the economic criterion affects several criteria. Similarly, the cultural criterion impacts only the economic and social criteria, both of which, in turn, influence all restoration criteria. An increase in the social criterion has a causative effect on the rest of the restoration criteria. The environmental criterion serves as the sole causal factor for three criteria: economic, social, and administrative. The administrative criterion, on the other hand, is causative for all restoration criteria. Lastly, the cultural and esthetic criterion only influences the economic criterion, while the infrastructural criterion has no effect on the other criteria. This indicates that emphasizing the applicability of the recall, as the other criteria in the causative group can easily influence them, will automatically lead the other four criteria to primarily focus on the criteria of the impact group. The graph depicts linear and direct relationships between the criteria contributing to recovery. It is a result derived from extensive stages, such as meetings between decision-makers and researchers, the distribution of questionnaires to a significant segment of the scientific community in Syria, and the use of Excel tables to represent these standards. Additionally, it incorporates insights from research that acknowledged some shortcomings after implementation several years later.
3.3. Utlizing Geographic Information System (GIS) Result in Spatial Suitability Maps
The key outcome of this section is the presentation of suitability maps, classified into the main six investigated criteria and their sub-criteria as follows:
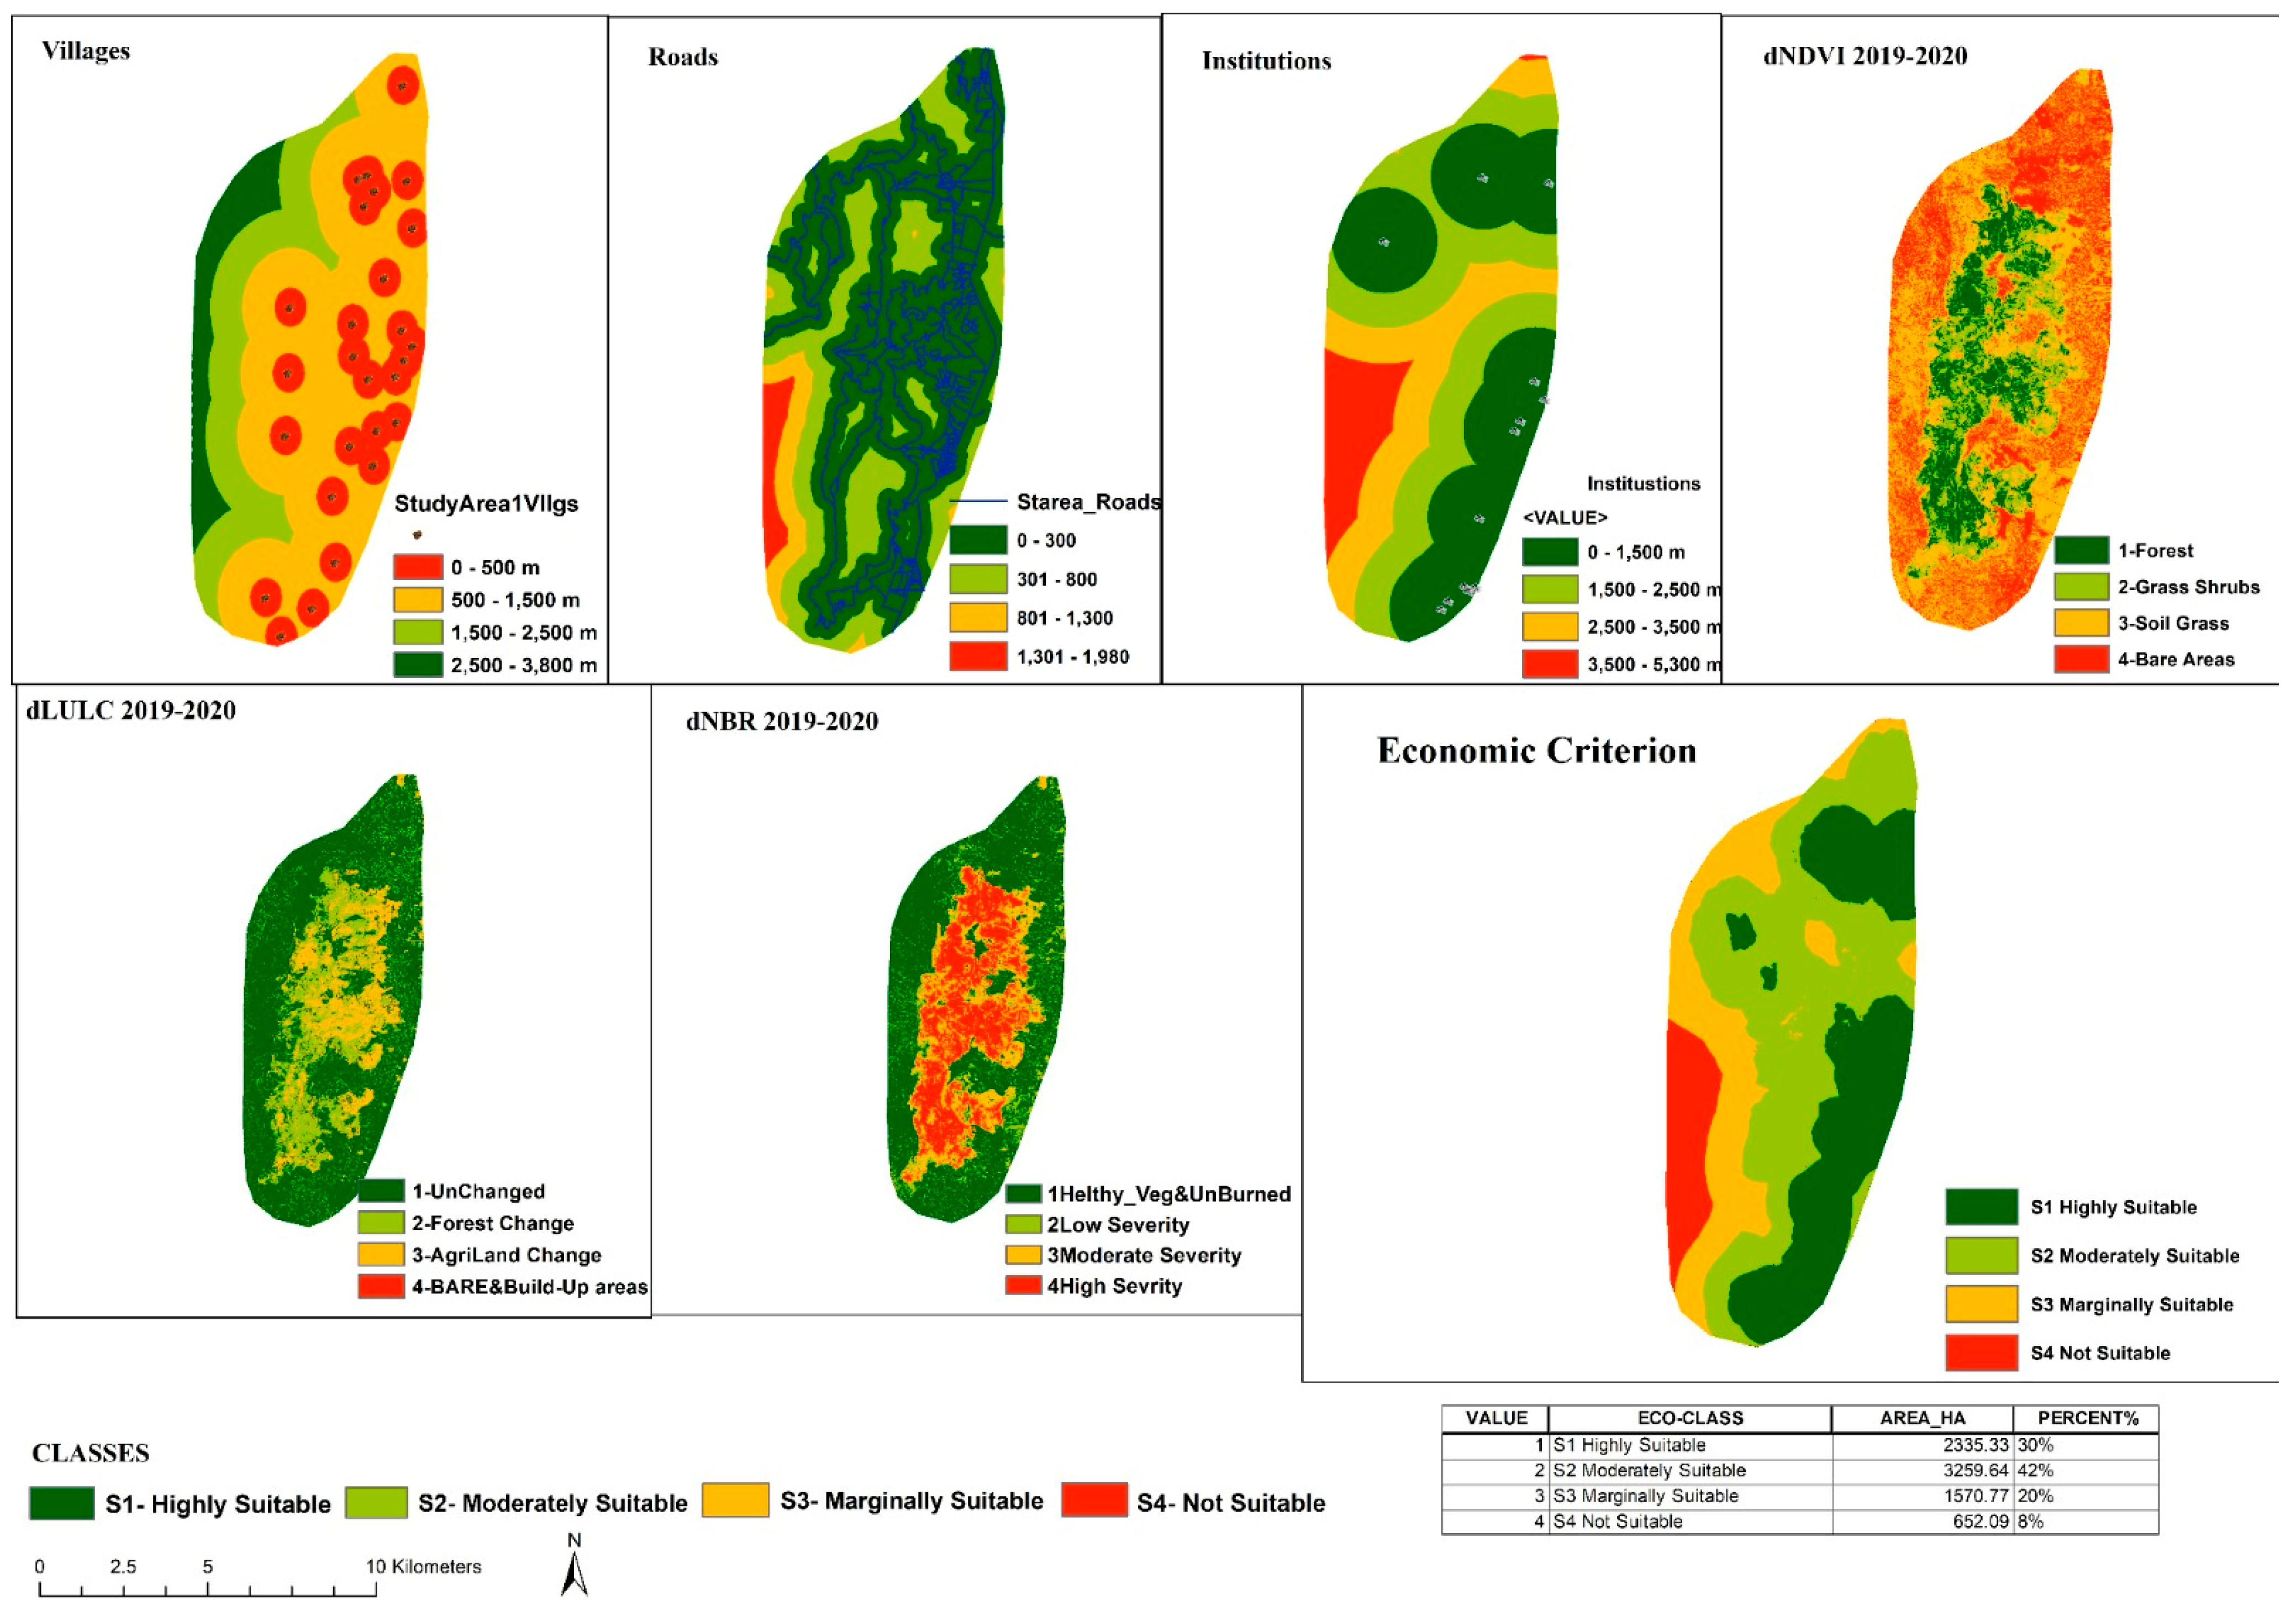
3.3.1. Economic Criterion
The maps depicted in
Figure 8. represent the criteria specified for the economic criterion were collected between 2019 and 2020, one year after the fire, and encompass the following aspects: (1) evaluating changes in land uses and coverage, combined with fire intensity, to determine the average economic loss in both wood and non-wood products in forests or private agricultural lands resulting from the fire; (2) calculating the average amount of fuel or wood; (3) estimating the damage to residences and the number of properties in small villages within the research region, along with their proximity to roads; and (4) assessing the government’s presence at administrative points and connected community assistance centers, as well as its willingness to fund restoration efforts by determining the expenses incurred in restoration thus far.
These results show that 8% is not suitable for restoration; this percentage represents the economic loss for the Syrian government and the residents, while, on average, 31% have the economic capital needed for restoration (human resources plus raw resources such as coal). This capital is indicative of policymakers finding a way to fund the restoration’s initial steps or at least the maximum benefit that can be achieved locally.
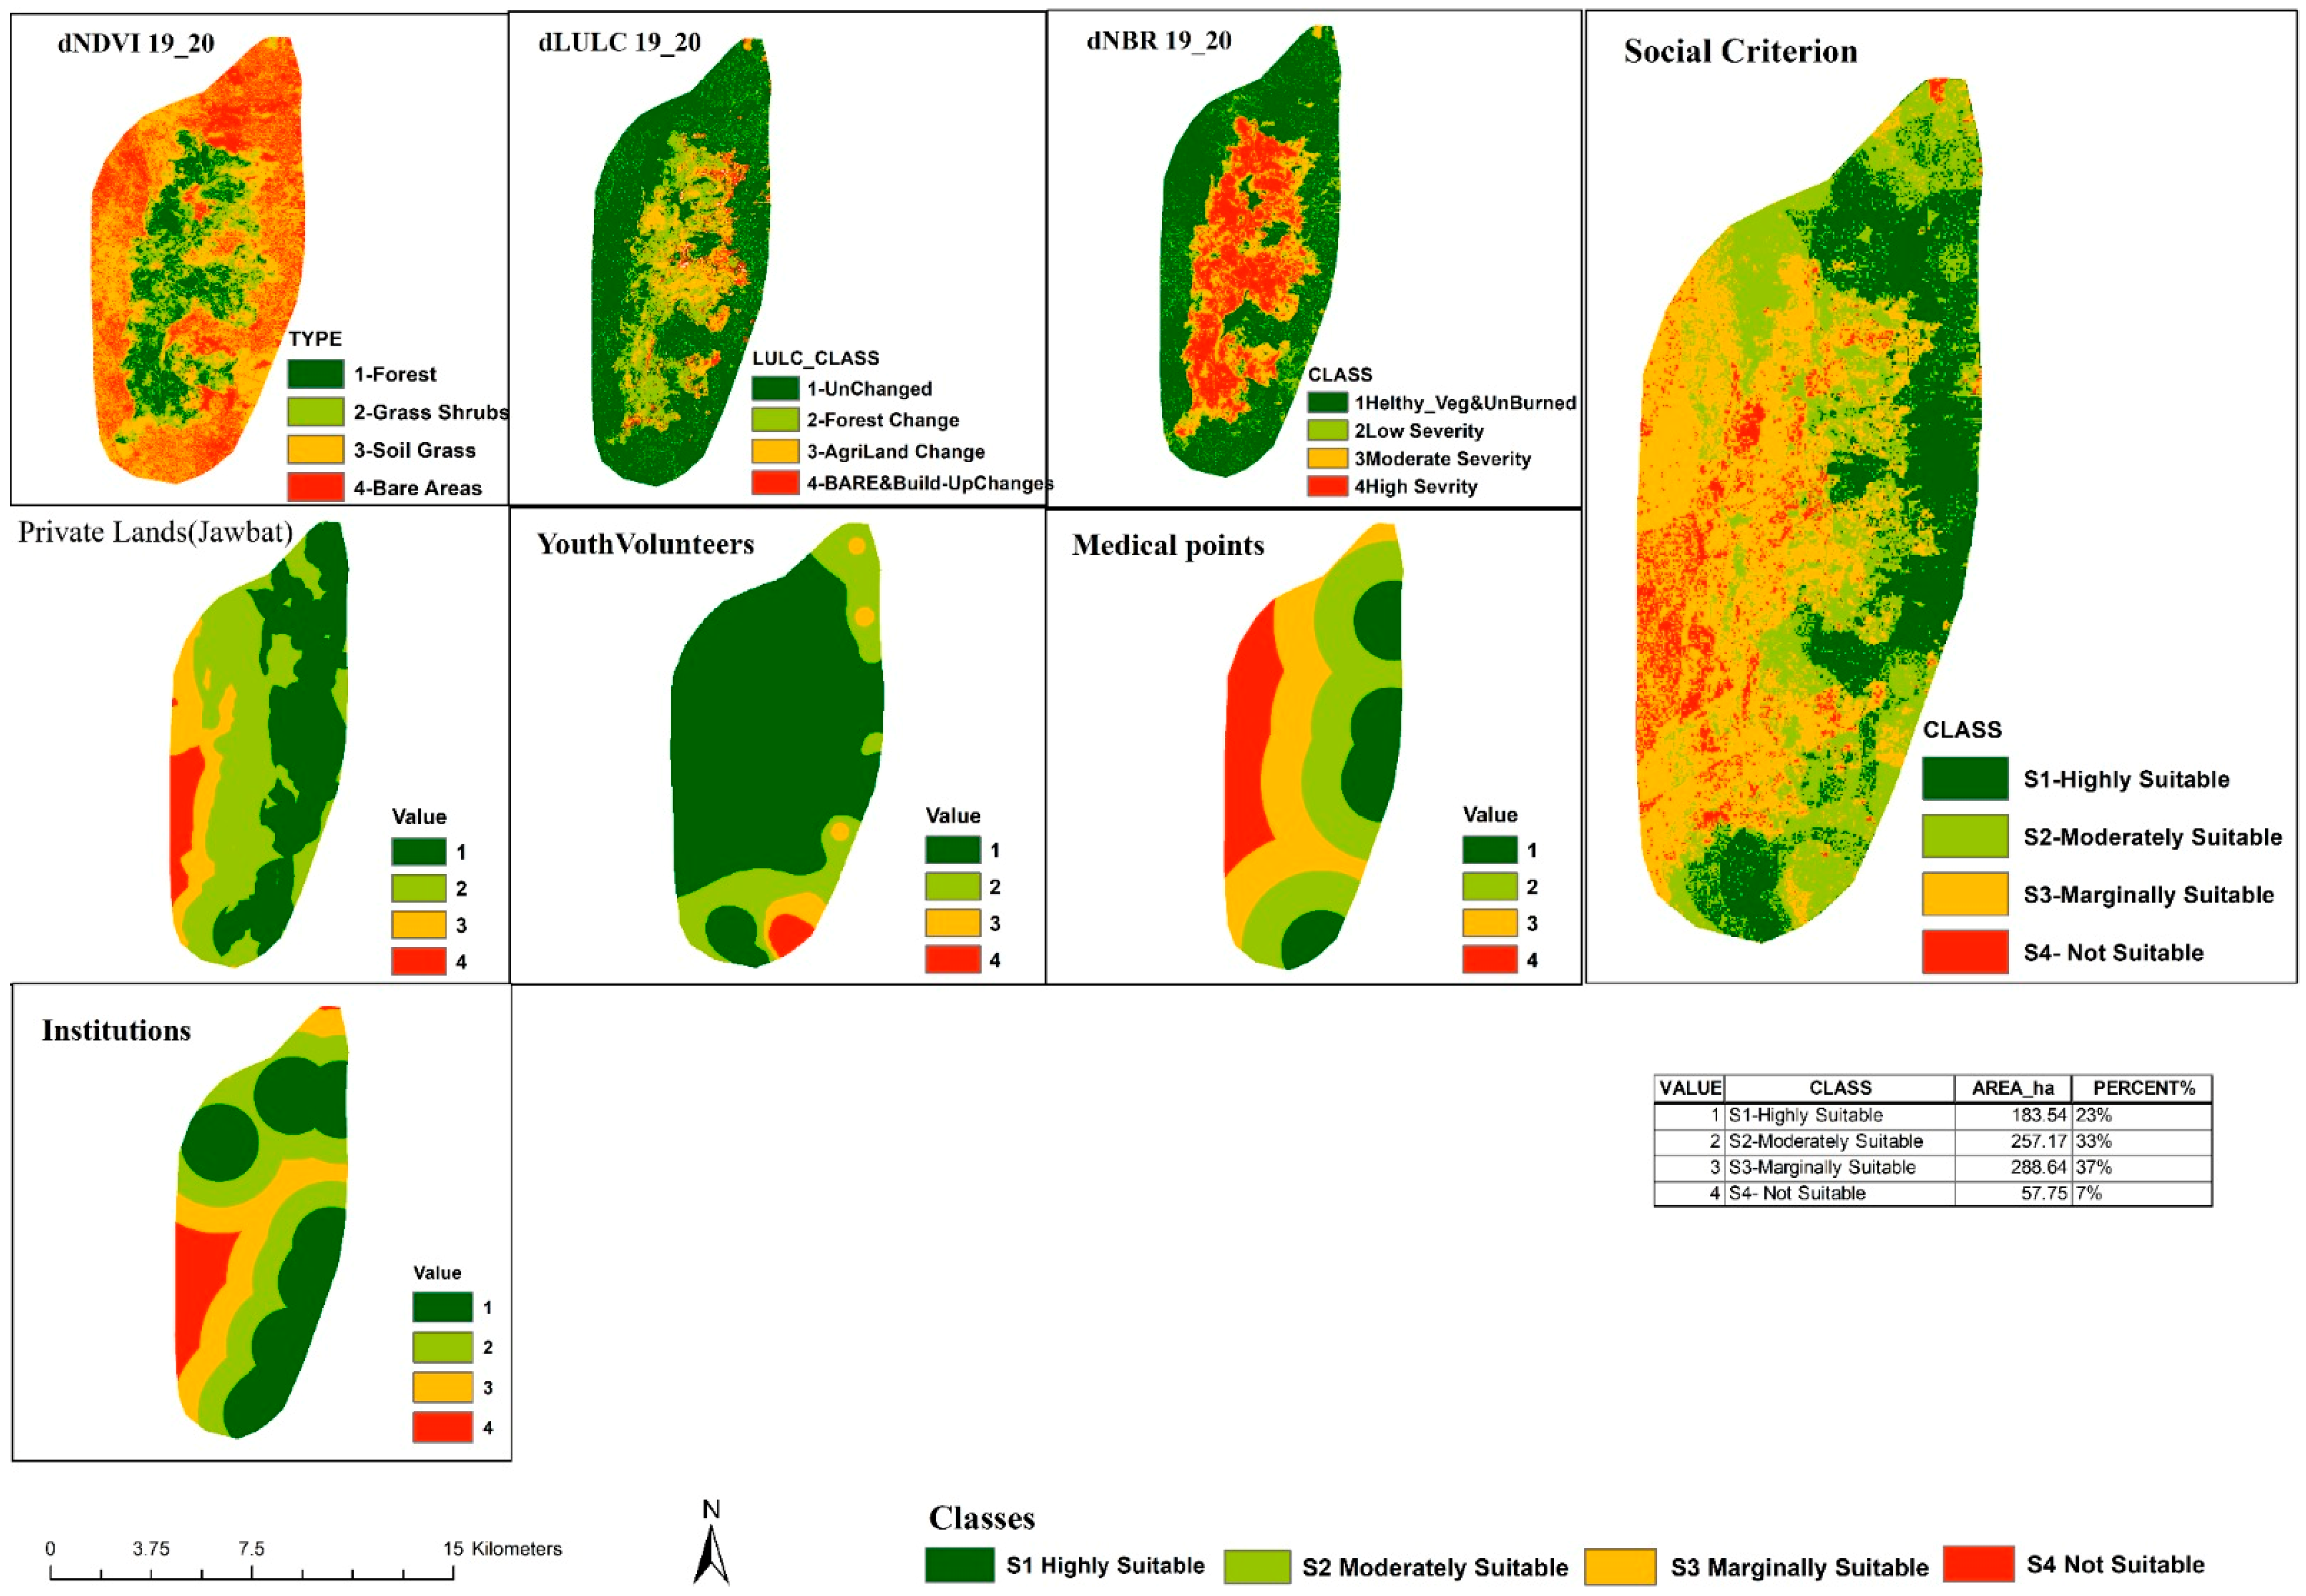
3.3.2. Social Criterion
The population of the Al-Ghab Plain region, as per the 2014 census, was approximately 575,000 people [
38,
39], with the working-age population (18–20 years old) constituting nearly 60%, totaling 345,000 workers. Of these, 163,635 workers are engaged in agricultural activities, making up approximately 47.43% of the workforce [
28]. The suitability analysis method involves five major phases: (1) selecting restoration criteria, (2) compiling available datasets for each criterion, (3) generating condition maps for each criterion, (4) establishing a suitability analysis model, and (5) identifying appropriate restoration locations. It encompasses social criterion eligibility criteria that define the quality of life, (6) changes in land use and coverage, and their combination with fire intensity to reflect the extent of ecological security, natural damage, and habitat.
Figure 9 show that the youth community and volunteer involvement have the highest effects on restoration and play a main role in aiding adaptive management. However, there are high rates of poverty in these locales. This assures the possibility of social commitments that indicate, on average, a 30% forest restoration.
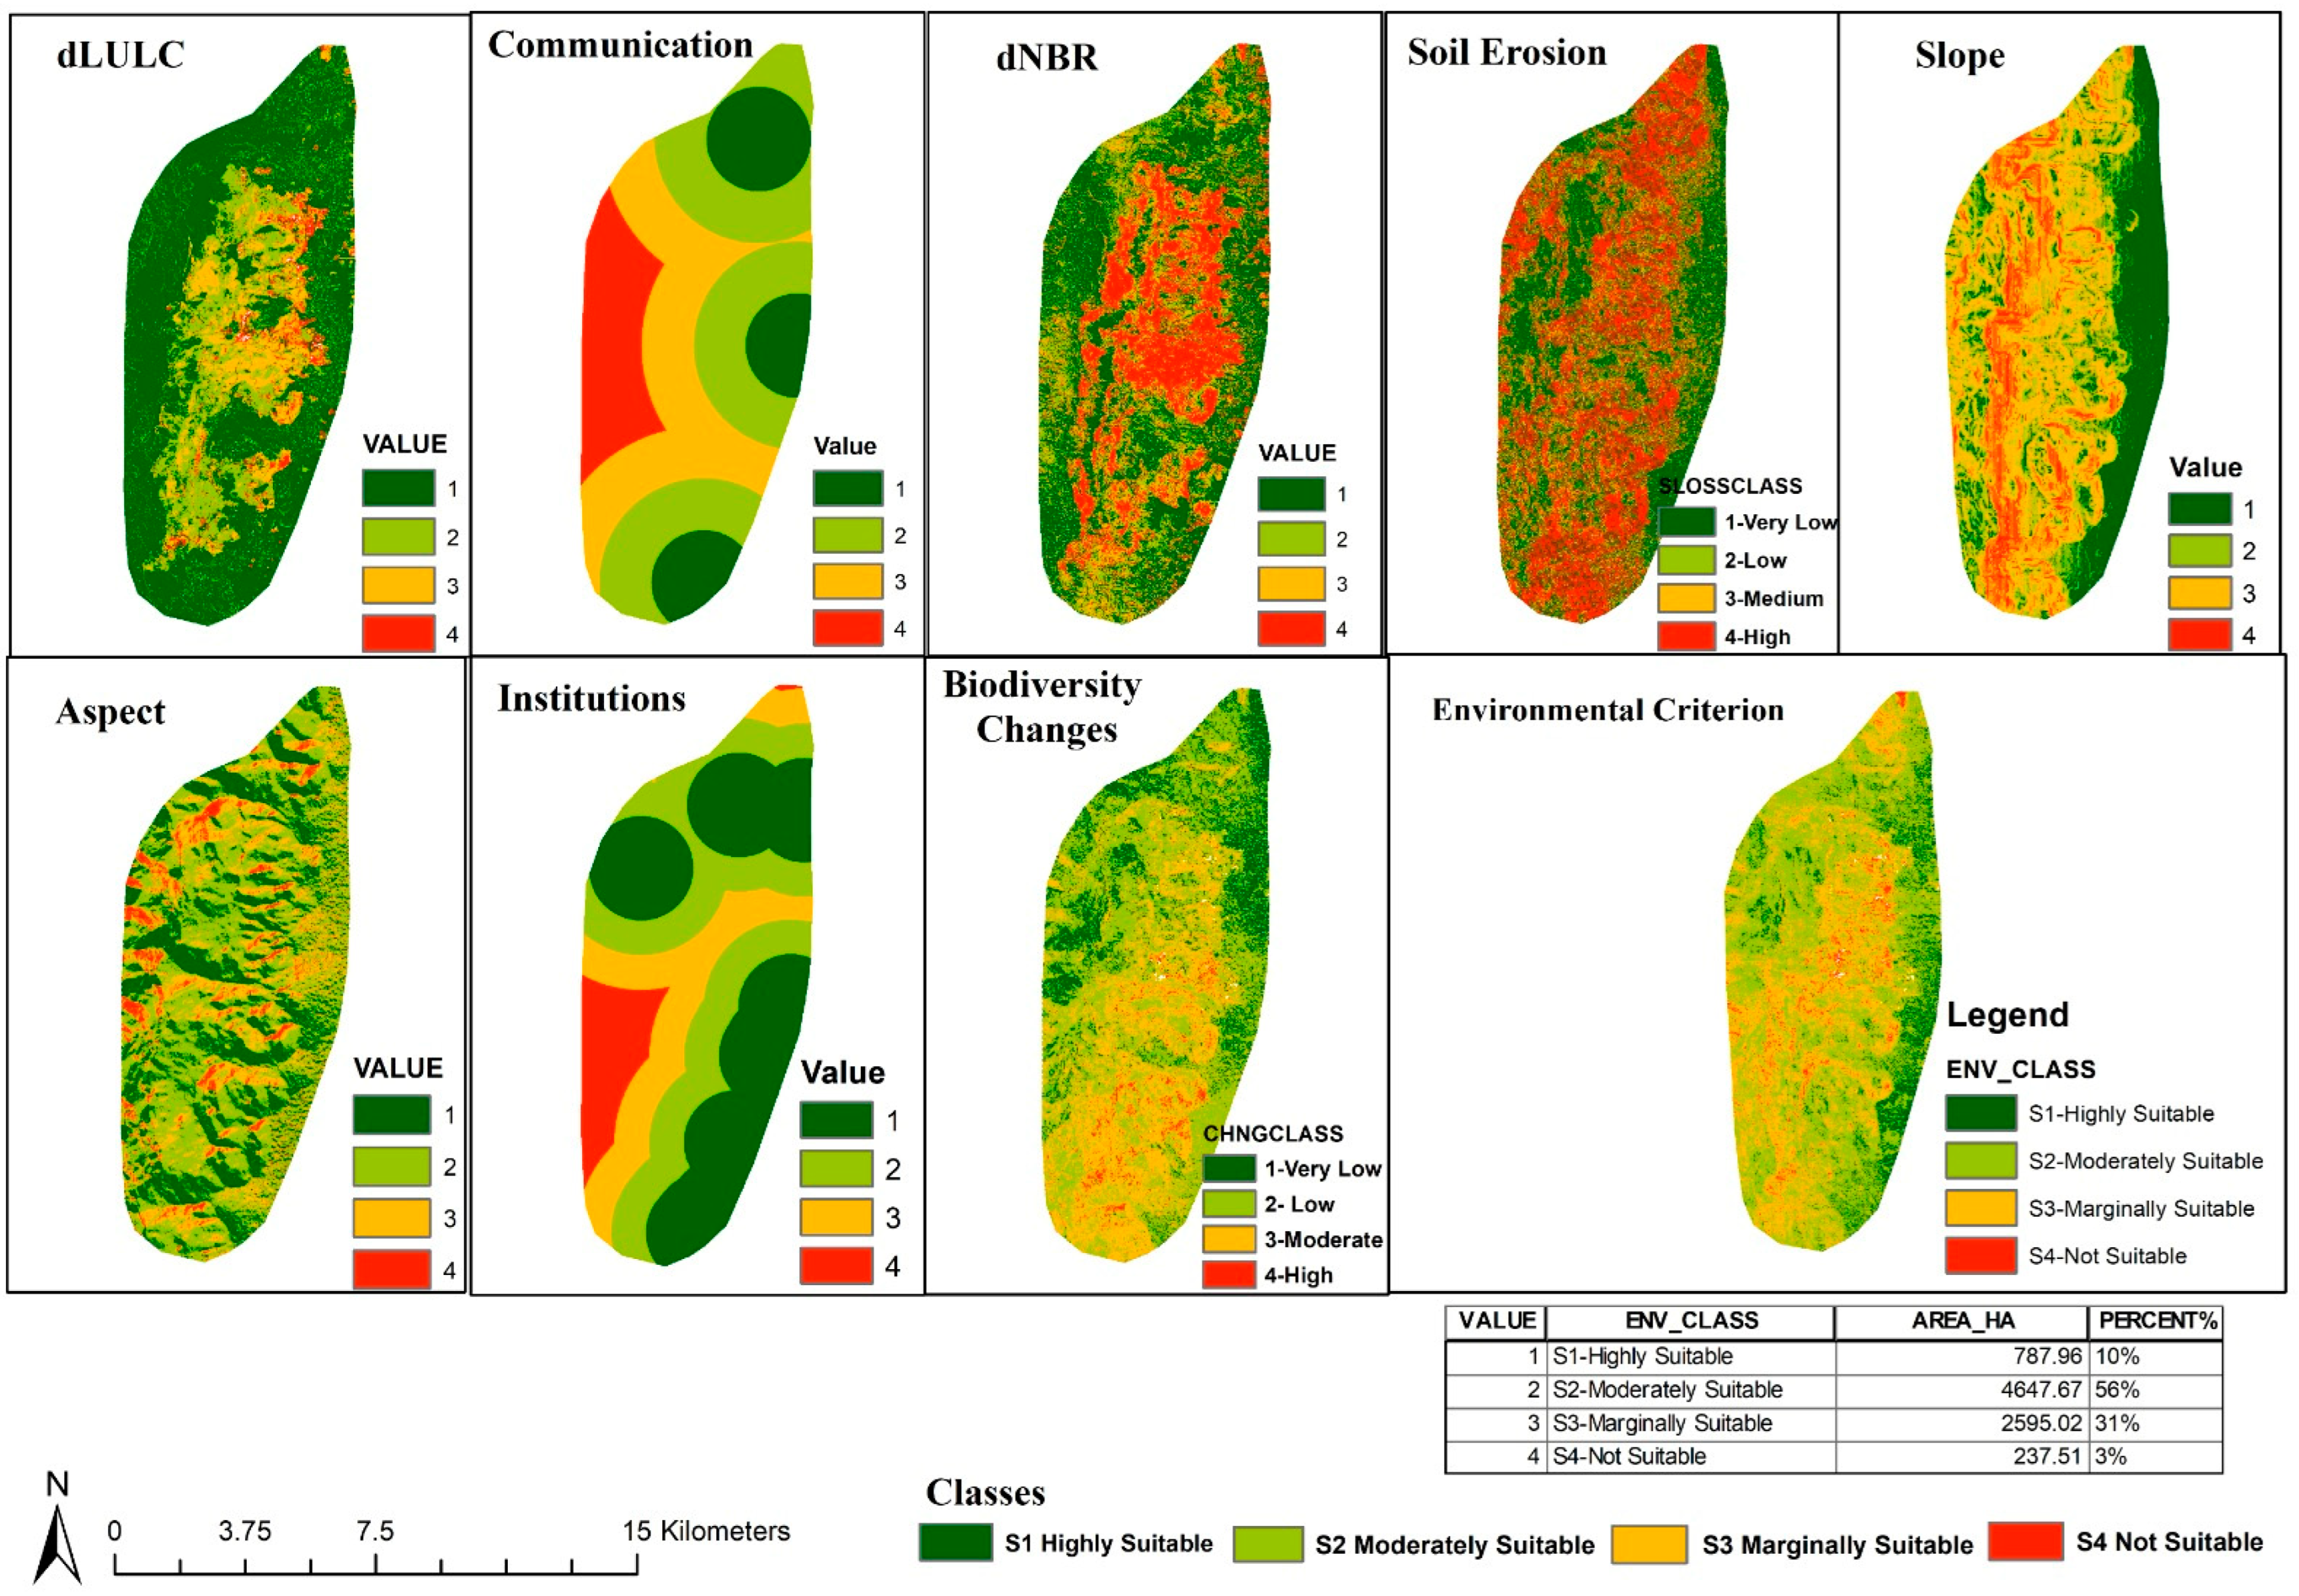
3.3.3. Environmental Criterion
In the study area, it was observed that slopes exceeding 35 degrees are more prone to recurrent fires due to their rapid spread and decreased fire control capabilities, compared to the preferred gentle slopes ranging from 0 to 10%. Gentle slopes aid soil retention and enhance water storage, contributing to biodiversity stability. Plant species, humidity, and rainfall rates are influenced by elevation, with fir and cedar trees thriving at altitudes exceeding 1000 m. Aspect, referring to the slope or orientation preference for southern, southeastern, and southwestern slopes, impacts sunlight exposure, resulting in a more favorable natural regeneration process in the forested regions categorized into four types.
Carbon sequestration accounts for half of the biomass in the vegetation cover (50%). Temperature exhibits minimal diversity in the study area due to its relatively small size compared to the entire Syrian region [
33,
34,
40]. The Natural Diversity Vegetation Index (NDVI) serves as a method for estimating the C-factor from remote sensing data commonly employed in vegetation and biomass assessments [
41]. Ranging from 0 to 1, NDVI values above 0.26 indicate healthy plants in equilibrium with infrared reflectance. The suitability criteria for the environmental criterion encompass: (1) assessing changes in land use and coverage combined with fire intensity to gauge vegetation cover resilience/resistance; (2) identifying alterations in environmental services, including carbon sequestration; (3) determining changes in biomass indicative of dispersal, loss, and deviations in vital habitats (flora–fauna); (4) evaluating changes in biodiversity, encompassing alterations in soil characteristics, soil loss/erosion, and changes in hydrology post-fire; (5) assessing variations in the humus or fuel layer after the fire through vegetation cover changes; and (6) considering the presence of administrative points and local community support centers affiliated with the government [
37].
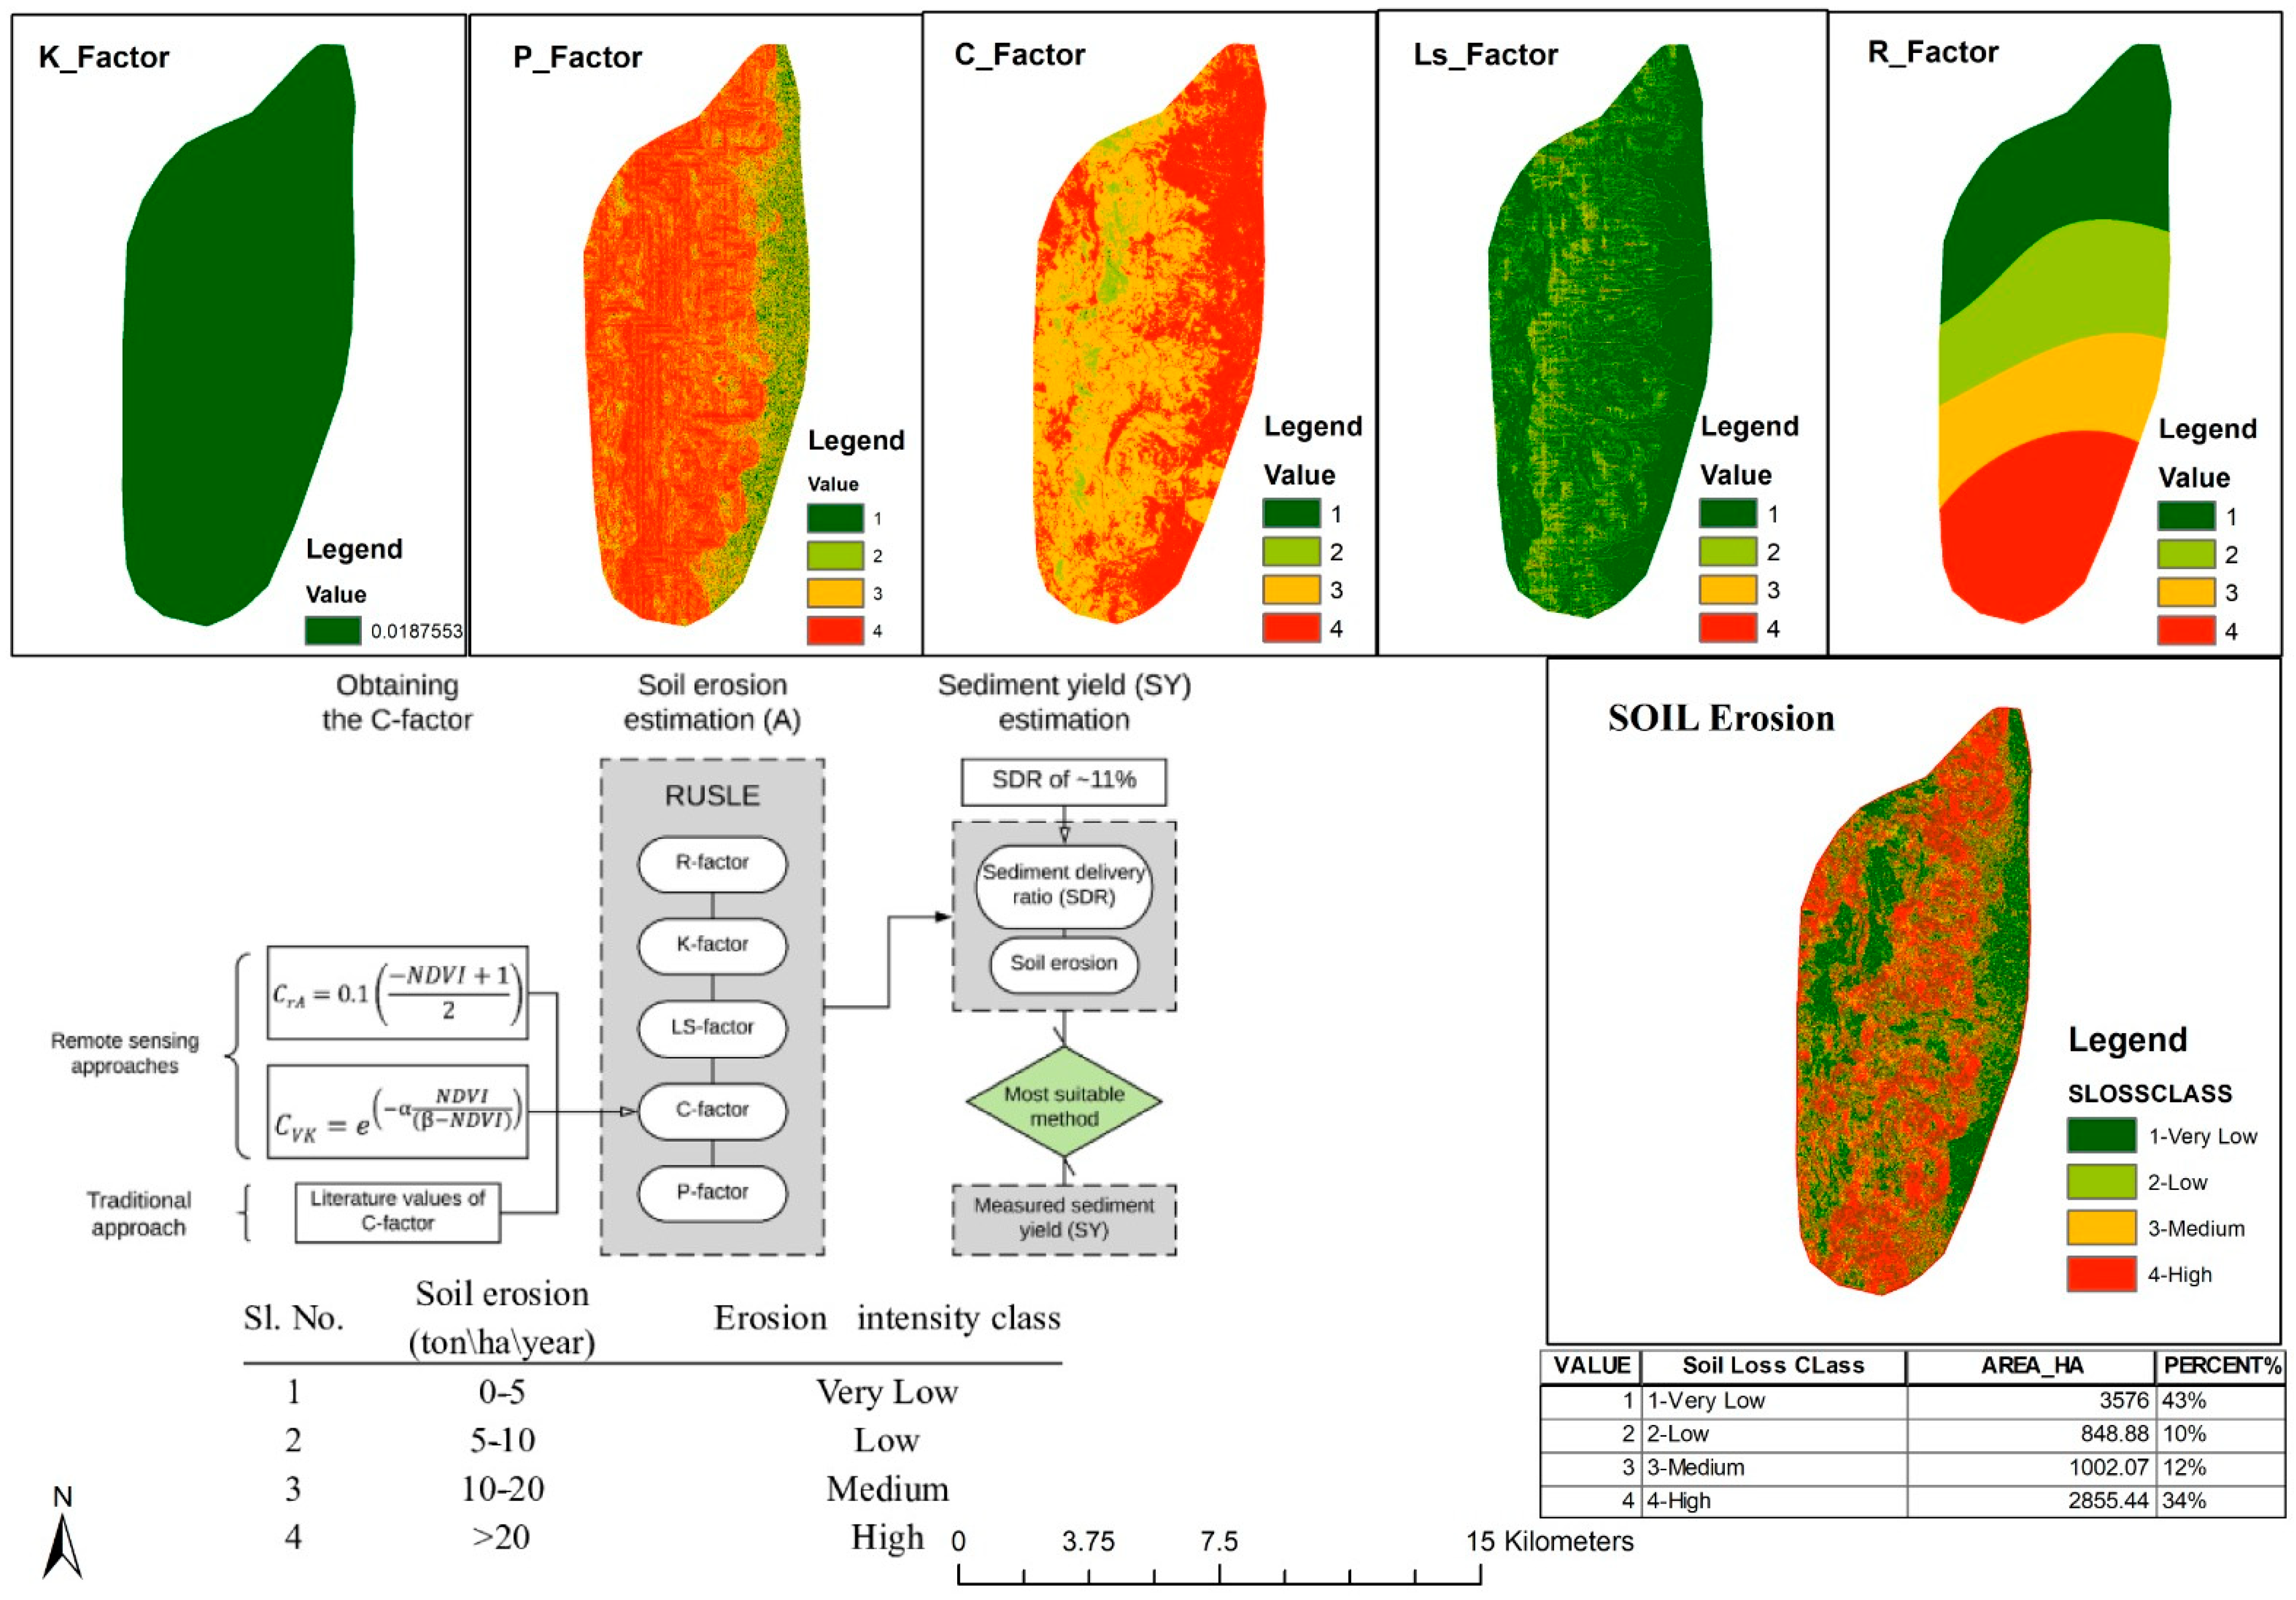
Figure 10 shows soil erosion was incorporated into the socioeconomic criterion as restoration efforts can contribute to preserving and stabilizing damaged areas. Convenience maps are typically generated by calculating distances, reflecting the proximity of environmentally significant sites such as forests and other vegetation, as well as the closeness to sources of disturbance like highways and residential areas [
9]. The calculation of annual soil erosion in this study employed the Universal Soil Loss Equation (USLE), detailed in
Appendix B.
Soil erosion is a source of fear because 45% of the chosen area suffers from soil erosion, and this is a negative indicator of forest restoration.As in
Figure 11, 33% of the study area has a high possibility of environmental readiness for restoration, especially moderate biodiversity changes, which indicates that healthy restoration is still possible before any future fires that may make the situation much worse or irreparable.
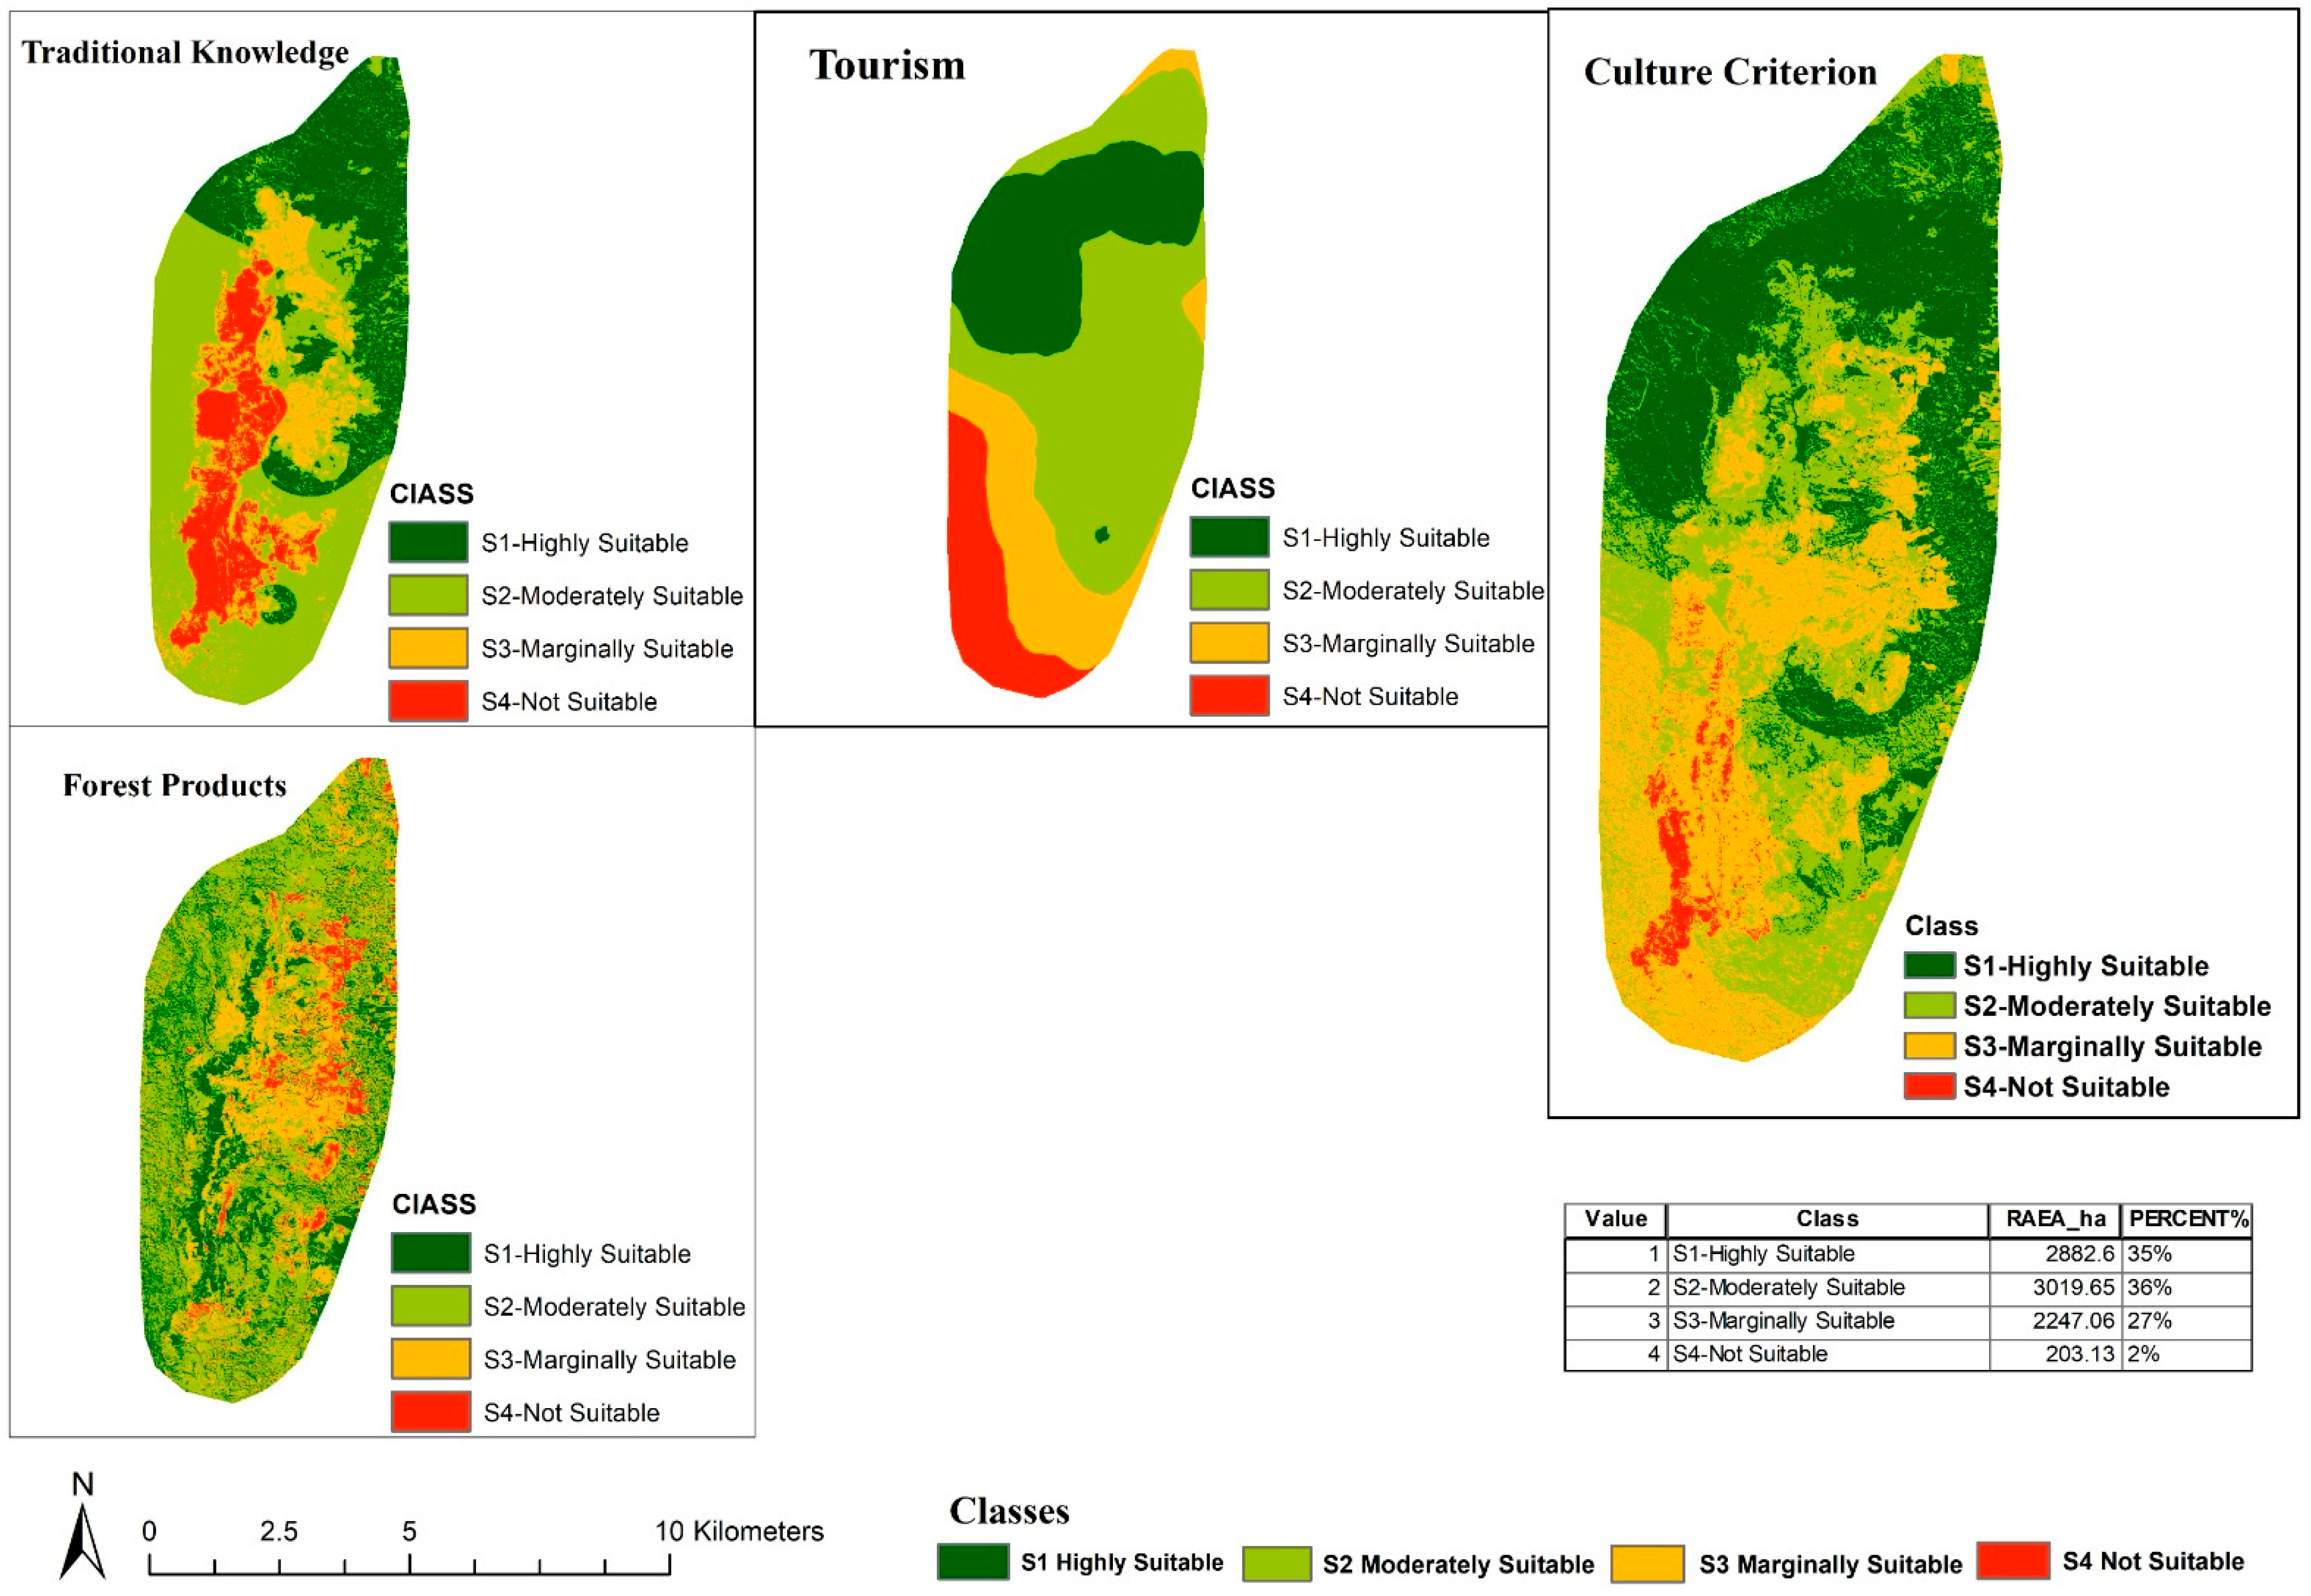
3.3.4. Cultural and Esthetic Criterion
For the cultural criterion, the following factors were considered in the suitability analysis approach, encompassing five key steps: (1) the identification of restoration criteria, (2) the acquisition of available datasets for each criterion, (3) the generation of suitability maps for each criterion, (4) the formulation of the fitness analysis model, and (5) the delineation of potential restoration locations. Cultural and esthetic appropriateness involves factors such as (a) proximity to monuments and restaurants, (b) land cover classes, (c) distance to settlements, (d) proximity to roadways, (e) distance to walkways, and (f) proximity to local market locations, as it appears in
Table 8. The ensuing
Figure 12 illustrates the suitability maps based on these aforementioned criteria.
Maps show that almost all of the cultural (traditional knowledge) and tourism roads and paths are 46% moderately affected by fires. At the same time, approximately 33% out of the whole cultural percentage shows moderate readiness towards forest restoration.
3.3.5. Infrastructure and Educational Criterion
The total number of wells in the region is approximately 5200, with an annual extraction volume of around 176 million m
3 [
28,
40]. The combined length of primary and secondary roads in Al-Ghab amounts to 361.628 km [
30,
40,
41]. Sufficiency requirements for the infrastructure and education criterion include (1) evaluating changes in land use and coverage to estimate the extent of damage to infrastructure networks caused by fires, encompassing major and minor roads, sewage systems, communication networks, and power lines; (2) identifying the location of fire stations, considering their proximity to roads, slope, and estimating their response speed and effectiveness in reaching fire-affected areas; (3) incorporating traditional ecological knowledge from the local community, integrating it with stakeholders, and consulting experts and scientists. This involves considering the historical fire data in the study area, integrating it with fire severity, seasonality, behavior, and frequency, particularly in inclined regions; and (4) assessing the presence of governmental and international organizations’ administrative offices, research or training facilities, and local community training resources.
Figure 13, show moderately suitable infrastructural readiness, except for electricity points, fire stations, and communication indicators, in places marginally affected by fires, and that reflects the need for increasing infrastructure facilities.
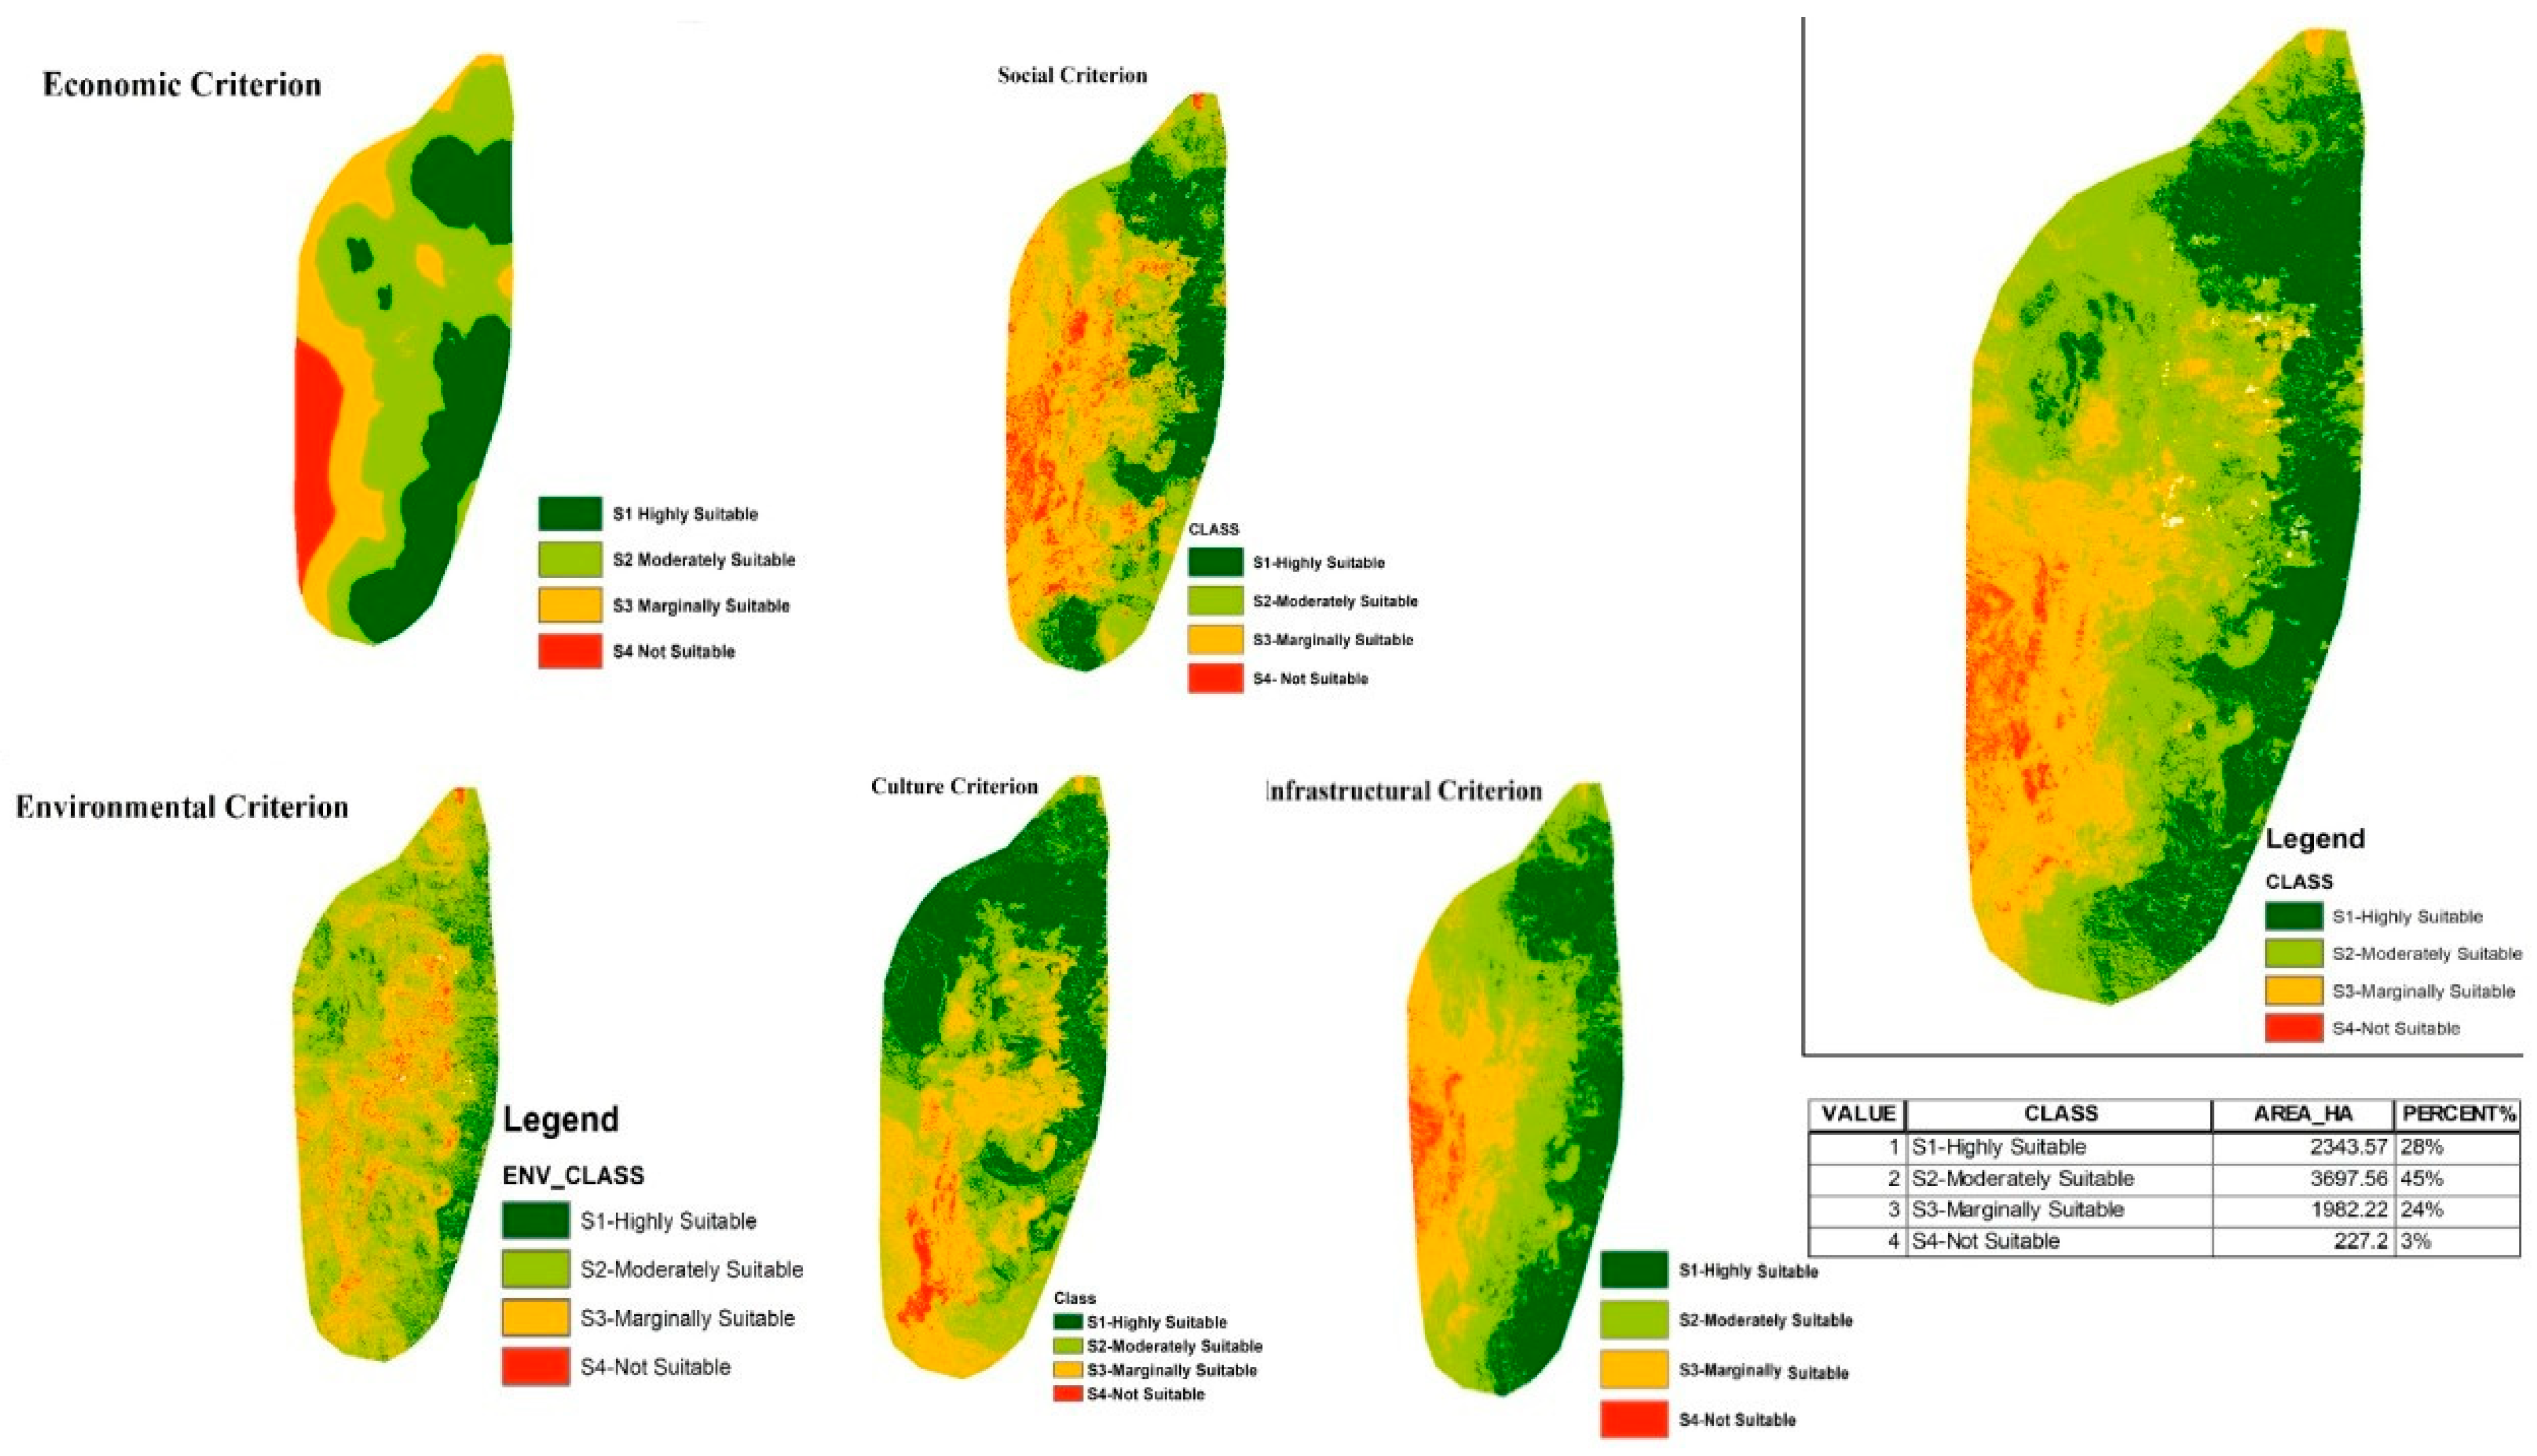
3.3.6. Management and Legal Criterion
This criterion incorporates all previously considered factors and drivers (social, economic, environmental diagnosis, and historical management). It cannot be directly represented in spatial maps or layers as it was included in each previous criterion separately. However, there were managerial indicators identified in each criterion, suggesting a potential influence on effective forest regeneration management post-fire. The concept of flexible management, explored in this study, seeks to balance the optimization of benefits for local communities with the imperative of environmental preservation.
In conclusion, areas less likely to undergo successful restoration may incur restoration costs that are over 32% higher during a specific timeframe compared to the benefits gained in less suitable or unsuitable areas. Our findings indicate that 28% of the study area is well-suited for post-fire forest restoration, as
Figure 14 shows. And 44% moderately suitable for restoration, allowing for adaptive management expansion. In contrast, 3% of the lands are marginally suitable for restoration, suggesting unsuitability due to factors such as steep slopes exceeding 35 degrees or elevations above 1000 m, leading to substantial soil erosion and the transformation of these areas into barren lands.
The chosen area of the case study is approximately 20% of the total Al-Ghab plain area, which means the results were multiplied by 5, considering the decisions of Syrian authorities. When it relates to management, there are two views: the optimistic view, which will increase interest in and the benefits of the complete realization of the study goal (CCI). The other, pessimistic view has almost disastrous effects on the (CCI) because the natural regeneration through the last 5 years was not more than 10% and showed unbalanced environmental growth due to the absent local management, which means the loss will be multiplied as well and make the Syrians forest at a high risk of repeated future fires.
4. Discussion
Summarizing the results of the methods employed in this study, the priority rankings, based on questionnaires distributed to decision-makers in the Syrian government, indicate that the economic criterion holds the top position. This underscores the economic challenges faced since the beginning of the Syrian war, emphasizing the need for local authorities to strategically utilize leftover wood and coal as resources for forest fire restoration. The social criterion, ranked second, highlights the importance of involving local communities in restoration efforts. This involves selling traditional materials and products, fostering a sense of connection between locals and the forests, and enhancing resilience against future fires. The significant gap in management methods in Syrian forest restoration is recognized, suggesting potential challenges, as each criterion encompasses management-related indicators.
In terms of the ranking of forest restoration strategies, economic considerations play a pivotal role for decision-makers facing obstacles or delays in restoration efforts. The top-ranking alternative is Integrated Forest Fire Decision-Making, focusing on developing a comprehensive fire control plan to support landscape, land use, and forest management. The second alternative, the Forest Fire Investment Planning System, aims to conduct risk-based analyses of wildfire outcomes and management operations. The third alternative, Forest Restoration Techniques, encompasses various interventions to accelerate natural regeneration. The fourth alternative, Suitable and Subsequent Treatments, involves standardizing the classification of forests, wooded land, and other land, emphasizing the importance of notification in areas with recurrent wildfires.
Analyzing the suitability maps, the eastern and northern parts emerge as the most suitable for restoration, with moderate-to-high fire intensity and severity. Notably, the infrastructural and environmental criteria suitability maps show almost no red areas, indicating a high potential for restoration in terms of these criteria. However, the southwestern parts are less suitable for restoration in terms of economic, social, and cultural criteria. The assessment of fire effects reveals that approximately 35% of the study area were moderately affected by fires, represented by light green and yellow areas.
The evaluation of criteria maps through a multi-criteria approach provides a suitability map for each criterion, contributing to the creation of a final suitability rating. Priority areas for restoration are selected based on a combination of environmental, social, economic, cultural, infrastructural, and administrative criteria. The results may vary with the inclusion of additional criteria, emphasizing the importance of accuracy in the analysis. Supporting and monitoring landscape restoration is crucial for reducing fire risk, enhancing resilience to climate change, and fostering local capacity building and fundraising.
Updating the master plan based on current land use and dividing areas according to the land suitability map offers guidance toward sustainable development. The unification of all criteria maps on a standardized scale facilitates comparison, and re-classifying maps allows for prioritization. Weight assignment to sub-criteria yields the final suitability map for primary restoration areas. The multi-purpose nature and planning of restoration applications contribute to naturalistic judgments, and the identification of priorities using a multi-criteria method aligns with protection projects encompassing social, economic, and environmental goals. Tools for quantity support are essential for examining spatial patterns and selecting preferences among various resetting technologies.
In conclusion, the study provides a comprehensive approach to post-fire forest restoration, integrating multi-criteria analysis tools, decision-making methodologies, and Spatial Decision Support Systems by enhancing the decision-making to provide a structured framework for evaluating restoration strategies, considering factors like biodiversity, soil health, community resilience, and economic viability by identifying spatially explicit patterns in post-fire impacts, prioritizing restoration efforts in areas in need. Additionally, the SDSS enables stakeholders to optimize resource allocation based on CCI, ensuring restoration actions are targeted towards areas with the highest potential for ecological recovery and societal benefits, leading to more efficient resource economic utilization, as well as environmental factors in guiding restoration strategies, emphasizing the need for adaptive management for long-term sustainability.
5. Study Implications
The findings of this study carry several implications that contribute to the broader understanding of post-fire forest restoration and its application in the Syrian context. The findings reveal that CCI enhances stakeholder engagement by involving local communities, researchers, government agencies, and NGOs, which may be useful in funding the restoration processes and in decision-making priorities and alternatives, promoting greater ownership and support for restoration initiatives. It also facilitates the integration of local and traditional knowledge, enriching decision-making processes and strengthening the legitimacy and relevance of restoration plans within local contexts.
Decision-makers can use multiring to explore investment contracts and determine optimum spending levels, addressing subjective elements due to incomplete data and political pressures. Support and evaluation improve accuracy and transparency by evaluating costs and benefits of alternative treatments by continuously monitoring and evaluating restoration outcomes, allowing stakeholders to advocate for policy reforms that prioritize ecosystem, community well-being, and sustainable land management practices, and to adjust strategies in real-time, enhancing ecosystem resilience over time (spatial–temporal trends, community dynamics, or ecological shifts) that capable of withstanding adaptive management strategies and for future disturbances.
CCI-guided SDSS offers a cost-effective and sustainable approach to post-fire forest restoration, leveraging local resources, knowledge, and capacities to minimize operational costs while maximizing ecological and socio-economic benefits. The study also emphasizes the significance of integrating and suggests future research could refine, explore additional criteria, and develop advanced spatial analysis techniques.
6. Limitations and Future Research
Limitations associated with the ongoing conflict in Syria pose challenges to the study, impacting data access and decision-maker engagement. The prevailing security concerns and reluctance to share information restricted access to critical data banks and materials essential for a comprehensive analysis. Additionally, obstacles in reaching decision-makers at higher government levels, coupled with delays in appointments and procedural hurdles, impeded direct engagement with key authorities.
Moreover, forest fire restoration has not been accorded a high priority in the Syrian national development plan. The country’s economic crisis diverted government attention and resources away from studies and initiatives related to forest restoration. This lack of prioritization reflects a broader challenge in allocating focus to environmental concerns amidst pressing economic issues. Furthermore, the study faces limitations stemming from the scarcity of national, local, and international research on forest fire restoration within the regional planning context. The absence of comprehensive studies and references hinders the ability to draw on existing knowledge and incorporate best practices into the research framework.
To address these limitations, future research efforts should explore collaborative data-sharing mechanisms, streamline engagement with decision-makers, advocate for the integration of forest restoration into national priorities, and promote initiatives that contribute to the existing body of knowledge on forest fire restoration in the Syrian context.
7. Conclusions
This article elucidates post-fire forest health restoration through the integration of regional decision-making, employing multi-criteria analysis tools (specifically, Analytical Hierarchy Process—AHP) and decision-making/evaluation methodologies such as Decision-Making Trial and Evaluation Laboratory (DEMATEL). The application of these tools, manifested in maps and tables, provides decision-makers with a comprehensive and scientifically grounded basis for making informed and unbiased decisions on the ground. This approach optimizes both time and resources, aligning decisions with a well-studied scientific foundation within national and regional development frameworks. The article underscores the synergy between general post-fire recovery and multi-criteria decision-making systems, aiding decision-makers in strategically allocating limited investments to regions most suitable for recovery. Evaluating the success of forest landscape restoration reinforces post-fire restoration methods, necessitating analyses of social consequences and environmental indicators across diverse spatial and temporal scales. To enhance the management strategy’s precision, a micro-assessment monitoring and control system is essential, facilitating adaptive management for long-term sustainability. This necessitates a comprehensive framework encompassing economic, social, environmental, cultural, and esthetic criteria and indicators tailored to the unique circumstances of each nation. Priority should be given to areas more frequently damaged or affected after fires, ensuring a holistic approach to forest regeneration.


