Article

The Pulses of Soil CO2 Emission in Response to Rainfall Events in Central Siberia: Revisiting the Overall Frost-Free Season CO2 Flux

by
Anastasia V. Makhnykina
1,2,
Eugene A. Vaganov
1,2,
Alexey V. Panov
1,
Nataly N. Koshurnikova
2 and
Anatoly S. Prokushkin
1,2,*
1
Sukachev Institute of Forest SB RAS, Krasnoyarsk 660036, Russia
2
Institute of Ecology and Geography, Siberian Federal University, Krasnoyarsk 660041, Russia
*
Author to whom correspondence should be addressed.
Forests 2024, 15(2), 355; https://doi.org/10.3390/f15020355
Submission received: 15 December 2023 / Revised: 7 February 2024 / Accepted: 7 February 2024 / Published: 12 February 2024

Abstract

:
Boreal forests nowadays act as a sink for atmospheric carbon dioxide; however, their sequestration capacity is highly sensitive to weather conditions and, specifically to ongoing climate warming. Extreme weather events such as heavy rainfalls or, conversely, heat waves during the growing season might perturb the ecosystem carbon balance and convert them to an additional CO2 source. Thus, there is an urgent need to revise ecosystem carbon fluxes in vast Siberian taiga ecosystems as influenced by extreme weather events. In this study, we focused on the soil CO2 pulses appearing after the rainfall events and quantification of their input to the seasonal cumulative CO2 efflux in the boreal forests in Central Siberia. Seasonal measurements of soil CO2 fluxes (both soil respiration and net soil exchange) were conducted during three consecutive frost-free seasons using the dynamic chamber method. Seasonal dynamics of net soil exchange fluxes demonstrated positive values, reflecting that soil respiration rates exceeded CO2 uptake in the forest floor vegetation layer. Moreover, the heavy rains caused a rapid pulse of soil emissions and, as a consequence, the release of additional amounts of CO2 from the soil into the atmosphere. A single rain event may cause a 5–11-fold increase of the NSE flux compared to the pre-rainfall values. The input of CO2 pulses to the seasonal cumulative efflux varied from near zero to 39% depending on precipitation patterns of a particular season. These findings emphasize the critical need for more frequent measurements of soil CO2 fluxes throughout the growing season which capture the CO2 pulses induced by rain events. This approach has inevitable importance for the accurate assessment of seasonal CO2 soil emissions and adequate predictions of response of boreal pine forests to climatic changes.

1. Introduction

Boreal forests, as a current active sink for atmospheric CO2, represent an important study region to trace the response of their carbon balance to the ongoing climate change [1,2]. Soils of the boreal belt are of particular importance as they contain four times more carbon than in the respective above-ground biomass [3] and climate change is projected to increase carbon (C) emissions from Arctic and subarctic soils [4,5]. Particularly, 37–174 Pg C in the form of CO2 and CH4 would be potentially released by 2100 under the current warming trajectory climate (RCP 8.5), with an average of 92 ± 17 Pg C across models [6].
Russia accounts for 46% of the total C runoff in the Northern Hemisphere, and carbon sequestration by Russian forests accounts for 56% of the total C accumulation in forest ecosystems of the Northern Hemisphere. Thus, the role of Russian terrestrial ecosystems in the global carbon biogeochemical cycle seems to be very significant [1,7].
Estimates of the sequestration capacity of ecosystems in the boreal zone vary significantly. The carbon sequestration process is influenced by a number of factors, natural and anthropogenic, which often lead to additional CO2 release from boreal forests [1,4,6]. Net soil exchange (NSE) fluxes of CO2 in the forest floor vegetation layer represent the difference between gross fluxes of CO2 uptake (through photosynthesis) and CO2 emissions (through respiration from multiple soil sources), but differ from net ecosystem exchange (NEE) as NSE does not comprise the overstore C fluxes [8]. Temperature and humidity are key factors in the control of NSE [9,10]. Projected global warming could have serious consequences for the NSE due to changes in its individual components. Nowadays, extreme weather events such as heavy rainfall or, on the contrary, droughts during the summer period have become more frequent [11,12,13]. To characterize the mechanism and to forecast the future the impact of extreme weather conditions, we need recent estimates of their input to the ecosystem carbon fluxes.
One of the effects that changes the atmospheric CO2 sequestration capacity of ecosystems is the “Birch effect” [14,15]. In this case, precipitation in the form of rain stimulates the emission flux of CO2, but the contribution of fluxes produced after heavy precipitation is not taken into account in the balance of ecosystems [16,17]. The essence of the effect is that rewetting of soil after drought, increases the rate of CO2 emission flux significantly. However, the reasons for this effect remain the subject of debate. A number of hypotheses have been put forward about possible mechanisms: (1) drought and rewetting disrupt soil aggregates and expose previously inaccessible organic substrates to decomposition [18]; (2) enhanced decomposition of microbial necromass produced during drought period after rewetting, (3) release of nutrients [19]; (4) spontaneous rapid increase in microbial biomass and fungal activity in response to improved water availability [20,21,22,23,24]; and (5) a microbial hypoosmotic stress response manifests itself [25,26,27,28]. Another important mechanism of “Birch effect” is degassing of soil [29]. As mentioned earlier, the CO2 stored in soil pores might significantly affect the amount of CO2 released after extreme rainfall events [30,31]. The CO2 pulse magnitude and length are driven by specific pre-pulse conditions [32], such as a severe dry period [31,33,34], availability of the substrate pool in soil, and desiccated ground floor vegetation [35]. In total, according to the recent estimates, rainfall may result in an increase of the annual CO2 flux from soil to the atmosphere from 20% [36] to 42% ([37] and references therein). Nevertheless, the existing data underline the gap in our understanding of “Birch effect” mechanisms and its role for the boreal region carbon balance.
The main goal of this study was to improve existing estimates of seasonal soil CO2 exchange fluxes in pine forests of Central Siberia by taking into account the frequently occurring pulses of CO2 efflux following rainfall events, which were usually excluded from quantification of seasonal CO2 release from soils. We specifically focused on seasonal dynamics of hydrothermal conditions, which imply strong control on the magnitude and longevity of soil CO2 emission pulses observed during three consecutive measurement seasons.

2. Materials and Methods

2.1. Study Area

The research was carried out on the territory of the Turukhansk district of the Krasnoyarsk Region (60°48′ N, 89°21′ E) on the basis of the International Observatory “ZOTTO” (http://www.zottoproject.org, accessed on 14 December 2023).
A sharply continental climate dominates in the study area (Figure 1), within which fluctuations in intra-annual air temperatures are observed, reaching more than 90 °C. On average, the amount of precipitation during the growing season (June–September inclusive) has been 263 ± 8 mm since the beginning of instrumental observations (1966–2022; sources—http://www.meteo.ru, accessed on 14 December 2023, http://www.rp5.ru, accessed on 14 December 2023). The air temperature of this area for the frost-free period from June to September is, on average, 13.3 ± 4.7 °C (1936–2022; sources—http://www.meteo.ru, accessed on 14 December 2023, http://www.rp5.ru, accessed on 14 December 2023).
The study was conducted in the lichen pine forest, which is one of the dominant types of land surface cover [38]. The tree stand layer is represented by Scots pine—Pinus sylvestris L. The ground floor vegetation is dominated by lichens Cladonia stellaris (Opiz) Pouzaret Vezda, and Cl. arbuscula (Wallr) Flot. with patches of mosses Pleurozium schreberi (Brid.) Mitt, and Dicranum polysetum Michx.
The soils of the study area are formed on glaciofluvial deposits and characterized by a predominance of sand in the upper part of the profile (top 1–2 m). The soils are albic podzols (WBR). Carbon stocks in the forest soil are relatively small, amounting up to 4 kg C m−2 in a 2 m deep soil profile. The soil organic carbon (SOC) content varies from 460 g C kg−1 in the upper soil organic horizon (forest floor) to 1.0 g C kg−1 in the subsoil (>40 cm) [39]. The organic soil horizon constitutes more than 30% of the total soil organic matter stock (1.10 kg C m−2) [40]. Root phytomass reservoirs vary from 30 to 50% of soil OM, and detritus content is about 10% [41].

2.2. Field Measurements

Seasonal measurements of CO2 fluxes were taken during three consecutive frost-free periods (2020, 2021, and 2022) using the dynamic chamber method.
Measurements of net soil exchange (NSE) of CO2 were carried out with an automated Li-Cor system consisting of an infrared gas analyzer Li-8100A (Li-Cor Biogeosciences Inc., Lincoln, NE, USA), and a transparent chamber for measuring soil gas exchange (8100-104C Clear Long-Term Chamber). The single chamber was installed on a PVC collar which represented the mean seasonal CO2 fluxes estimated for five replicate collars during 3 preceding years, as described earlier [42]. Thus, we assumed that the chosen soil collar characterized the general patterns reflecting the effects imposed by hydrothermal parameters on soil CO2 fluxes. Measurements NSE were carried out in triplicate, each measurement 2 min long, and the intervals between measurements were 30 s. Continuous measurements (every 30 min) were carried out from June to September (i.e., 144 measurements per 24 h in total), with short-term interruptions for soil emission measurements (dark respiration). In 2022, the NSE measurements were started in August due to technical issues.
Monitoring of seasonal changes in CO2 emission flux from the soil surface was also carried out using an Li-8100A measuring system (Li-Cor Biogeosciences Inc., Lincoln, NE, USA) with a chamber for measuring dark respiration (8100-103 Survey Chamber). The frequency of measurements was every 5 days during the frost-free period from June to September between 11:00 and 16:00 [42].
For each CO2 flux measurement, the soil temperature (Soil Temperature Probe Type E (Omega Engineering Inc., Norwalk, CT, USA)) at 10 cm depth and volumetric soil moisture (Theta Probe Model ML 2 (Delta T Devices Ltd., Cambridge, UK)) at 5 cm depth were also recorded.
Precipitation data with 10 min resolution were obtained from the ADOLF THIES rain gauge (Adolf Thies GmbH & Co. KG, Göttingen, Germany), connected to the eddy-covariance measuring complex, located nearby to the study area of the lichen pine forest.

2.3. Data Analysis

The calculation of primary data was carried out using a specialized software package—LI8100_win-4.0.0 Original Software. The plot SR mean was calculated as the average of 15 measurements with 3 repetitions per five soil collars. The NSE mean was calculated as the average of observations with 30 min resolution data for each season. Missing data were replaced with the mean of replicates. Hourly means of NSE fluxes and daily means of SR fluxes were used to examine the impact of soil temperature and soil moisture (SWC). We used linear regression to explore the relationships between NSE and SR fluxes and environmental variables, and statistical significance was set at p < 0.05. Our dataset included >10,000 measurements from the three frost-free seasons with different precipitation conditions. Data processing and statistical analysis of the obtained data were performed using Microsoft Office Excel 2010 and the R statistical software (Version 4.2.2) [43] using the dplyr [44], tidyverse [45], lubridate [46], ggplot2 [47], and shiny [48] packages.

3. Results

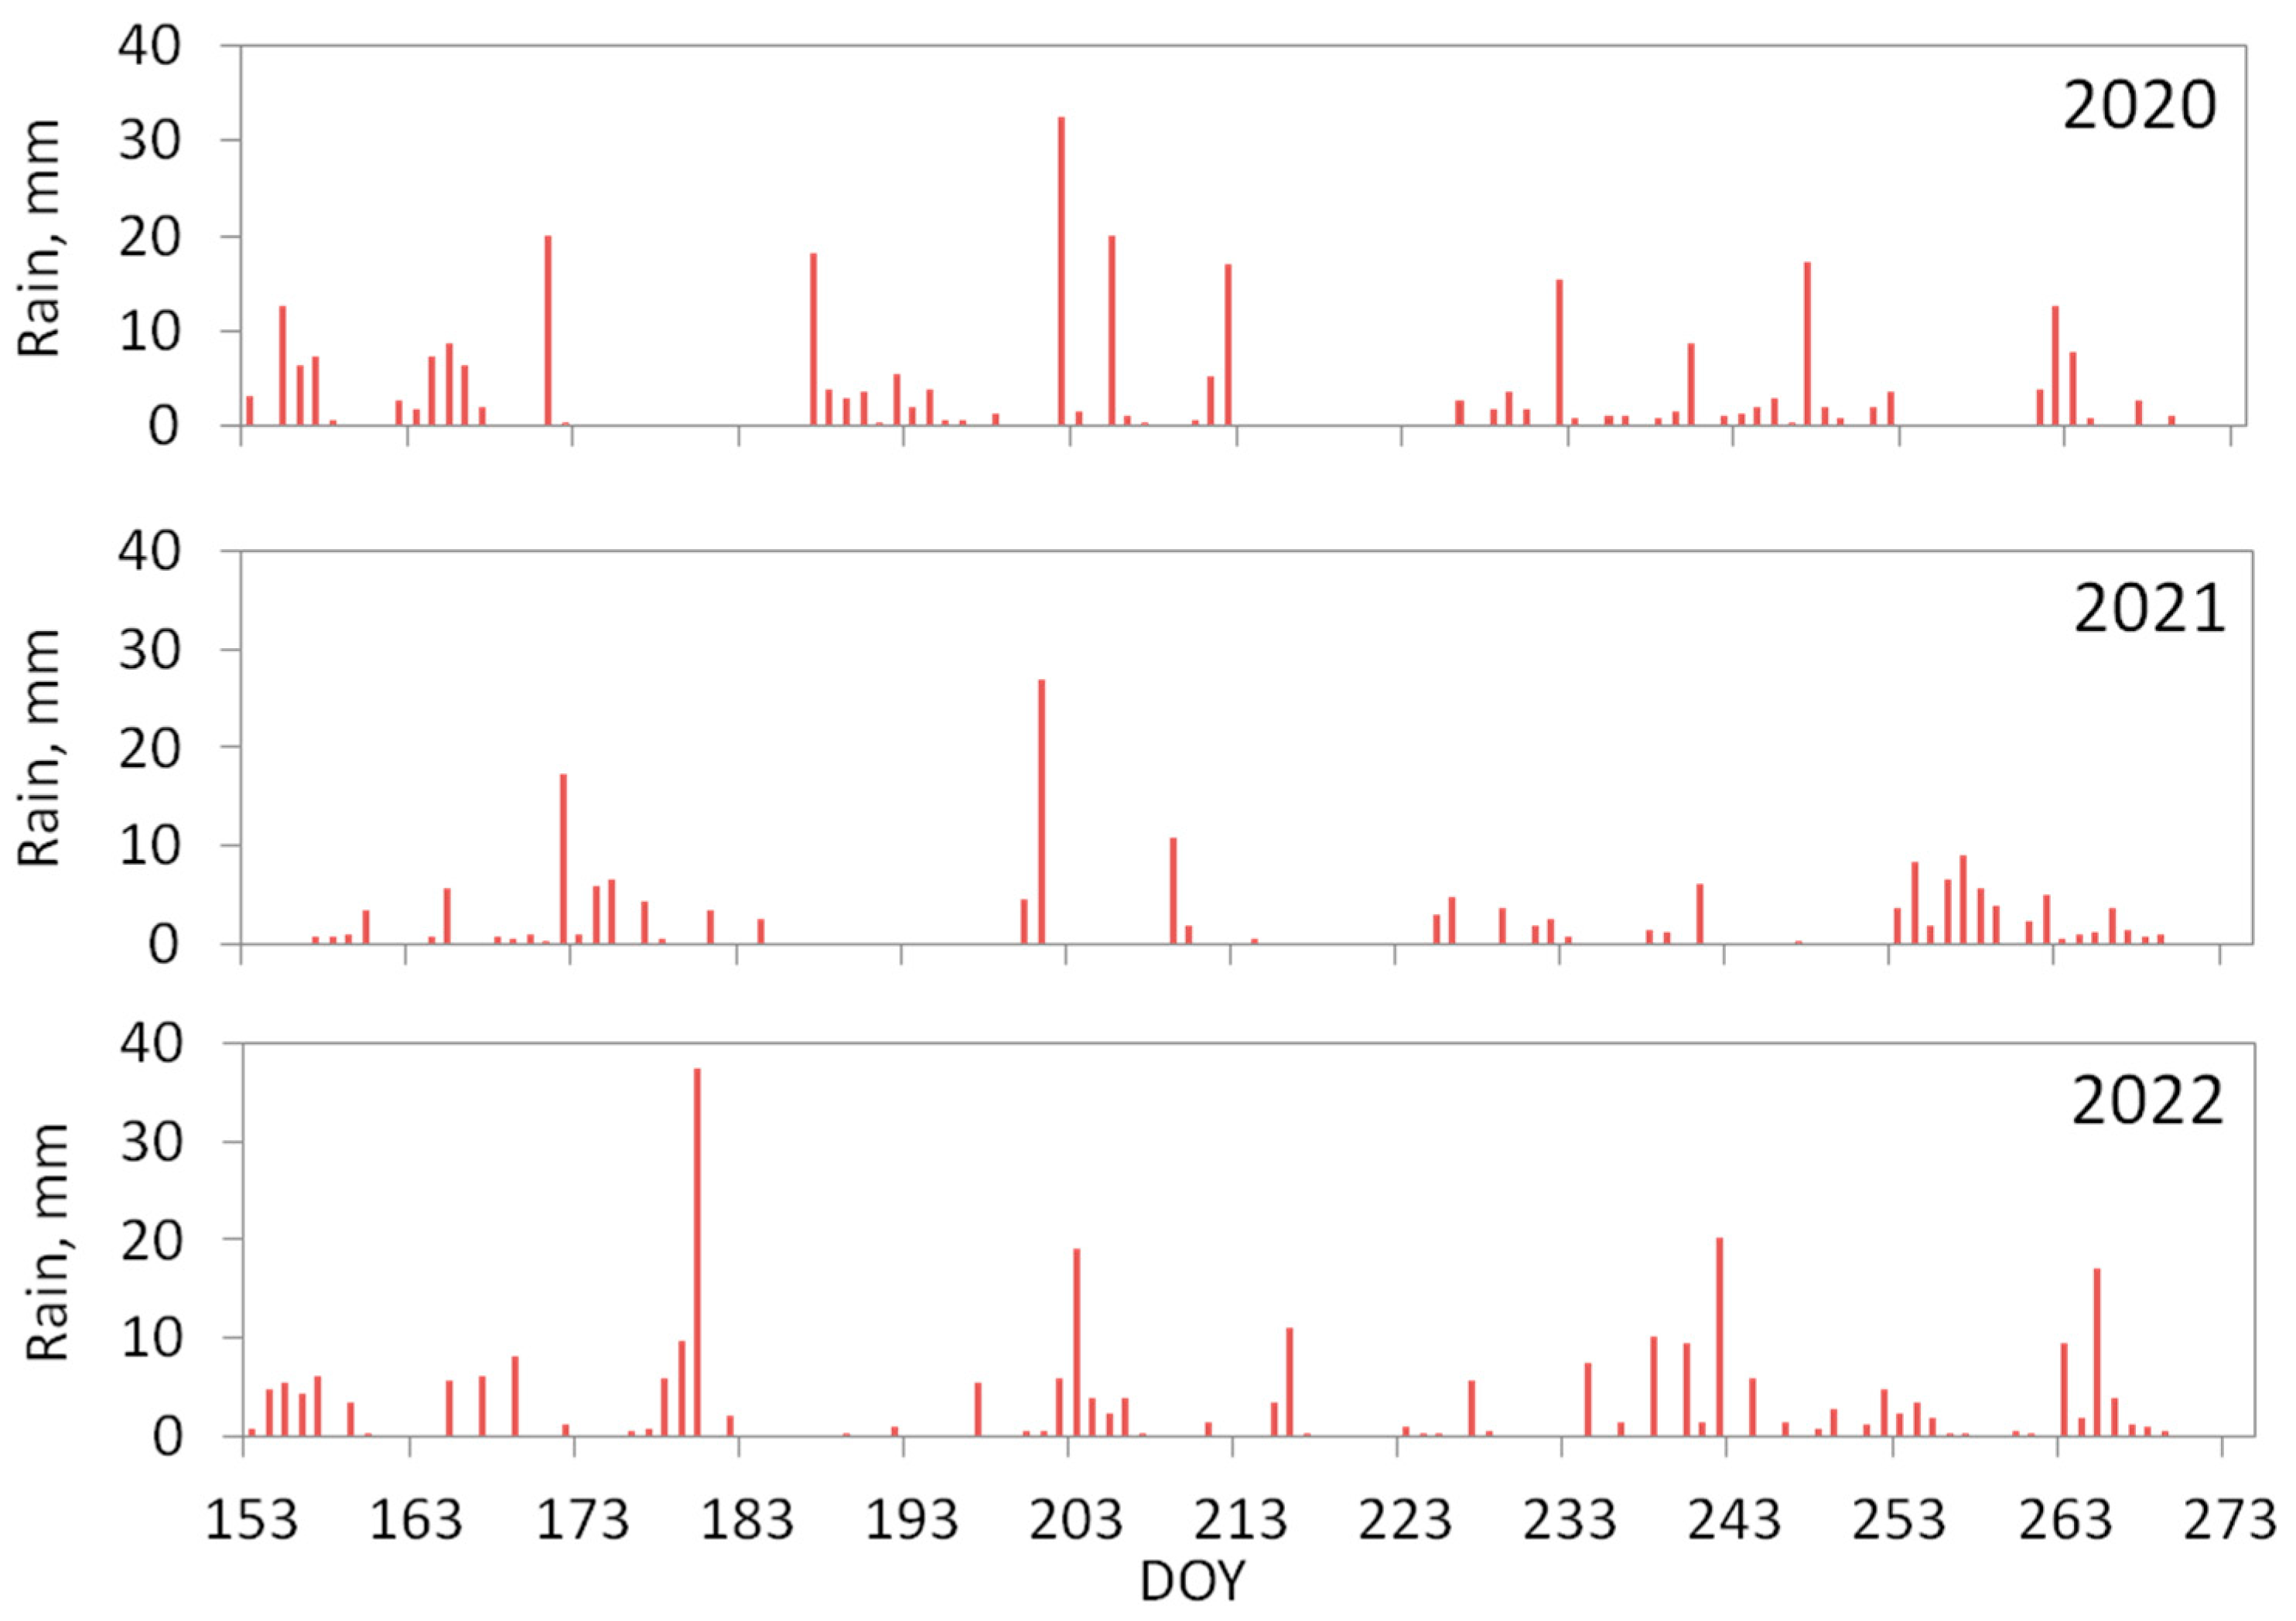
3.1. Precipitation Conditions of the Measurement Seasons

The precipitation varied significantly (p < 0.05) among the three compared growing seasons (Figure 2). The maximum amount of precipitation usually occurs in the second half of July. The year 2020 was the wettest of the three measurement seasons, when the amount of precipitation from June to September was 303 mm (43% of MAP). In 2021, we observed 40% less seasonal precipitation, and August was the driest month when the monthly precipitation was only 40% of the long-term mean monthly precipitation. The 2022 season was wet, with precipitation totals similar to those of 2020. Interestingly, in June 2022, we monitored the highest amount of precipitation (104 mm), which was 45% higher than the long-term mean monthly value.
To analyze the rain pulses, we chose rains with an intensity of 5 mm per day and higher. In 2020, the number of heavy rains achieved as much as 18, with the most events occurring in June and the first half of July. In 2021, the number of heavy rains did not exceed 12, mostly recorded at the early and late vegetation season. In 2022, the number of heavy rains was 20 with 8 events recorded in June. The periods without precipitation in 2020 and 2022 were comparable and reached 53 and 48 days, respectively, while the dry season in 2021 demonstrated 65 days with no rain events.

3.2. Seasonal Net Soil Exchange (NSE) and Soil Respiration (SR) Dynamics

The seasonal dynamics of daytime NSE fluxes of CO2 in pine forests across all three observed growing seasons continuously demonstrated positive values, reflecting that soil emission exceeded CO2 uptake by the ground vegetation (Figure 3).
In 2020, we observed two periods with maximal NSE rates (Figure 3a), specifically in the first half of June (early season) and the second half of August (late season). This year can be characterized by the largest number of CO2 pulses during the growing season and the amount of CO2 released into the atmosphere. Figure 3a demonstrates that all recorded NSE pulses were related to the sharp changes in soil moisture, while soil temperature was almost at the same level. During the growing season, most of the pulses occurred at the beginning and the second half of the season. A single rain event (>5 mm a day) caused a 5–11-fold increase in the NSE flux compared to the pre-rainfall values. Interestingly, the response of the NSE to the rain event was fast and usually observed within the first hours after rainfall.
The observed SR rates were nearly equal to the NSE flux values (Figure 3a). Monthly NSE fluxes and soil emissions demonstrated similar values in June, achieving 8.2 ± 2.4 and 7.7 ± 1.3 mol m−2, respectively. In July and August, we found 26% and 14% higher SR fluxes compared to the NSE that reached 13.7 ± 1.2 and 9.3 ± 2.1 mol m−2, correspondingly. However, in the first half of July, we recorded that SR rates were 2-fold larger than the NSE fluxes. In September the NSE fluxes were about 26% less than soil emission rates, not exceeding 5.9 ± 2.2 mol m−2, except for the periods with CO2 rain-driven pulses.
The SR rates in 2021 (Figure 3b) demonstrated much higher values compared to 2020 (p < 0.05). The monthly mean SR has ranged from 2.0 ± 0.4 mol m−2 in September up to 10.9 ± 2.0 mol m−2 in July (mean seasonal SR rates were 0.5 ± 0.2 mol m−2 day−1). Despite the fact that both soil emissions and NSE flux behavior were characterized by a classical curve with the maximum in the middle of the season and driven by soil temperature, the NSE flux had a lower magnitude and the mean monthly NSE CO2 flux rates reached 4.2 ± 0.8 mol m−2. The peaks of NSE in 2021 were measured at the end of July, when the NSE rates rose up to 2-fold during the daytime.
The highest SR fluxes among the compared seasons occurred in July 2022 (Figure 3c) and achieved 9.0 ± 2.4 mol m−2. The soil emissions in August demonstrated a value of 7.2 ± 2.8 mol m−2. A further decline of soil CO2 emission fluxes was observed in September, when monthly SR did not exceed 5.4 ± 1.3 mol m−2 and was well correlated with temperature decrease. Due to technical reasons, the NSE fluxes for 2022 were monitored only in the late growing season, specifically starting in the second half of August. The NSE fluxes that were observed in the rest of August and September were comparable to the previous seasons and reached 4.9 ± 2.5 and 3.9 ± 1.7 mol m−2, respectively. Within the observed period in August 2022, the amount of CO2 released after rain events (>5 mm a day) was up to four times larger compared to the background NSE rates.

3.3. NSE and SR Relationships with Soil Temperature and Soil Moisture

The relationship between SR rates and soil temperature (Figure 4a) illustrated an exponential growth of SR fluxes in response to soil temperature growth. Soil moisture is considered the second limiting factor that modulates soil emission rates during frost-free periods. Based on our long-term observations, we found that the optimal moisture value fluctuates around 0.23 m3 m−3 or 23% (Figure 4b). As we have observed, beyond these optimal soil moisture conditions, SR flux declines.
The relationship between NSE and soil temperature (ST) demonstrated a more complex behavior (Figure 4c). We observed the sporadic pulses demonstrating the sharp increase of NSE flux up to values as high as 35–39 µmol m−2 s−1 throughout the whole ST gradient. The largest NSE pulses were observed in 2020.
Despite the NSE dependence on soil moisture (Figure 4d), demonstrated by the similar patterns observed for SR, we found two optimal moisture intervals at ca. 0.23 m3 m−3 and 0.31 m3 m−3. Moreover, rain-induced pulses demonstrated their own specific dependence, lying significantly above the SR curve and characterized by descending limbs at higher moisture levels.

3.4. Rain-Induced CO2 Pulses

The pulse of CO2 following Huxman (2004) [30], occurs when the daily rainfall exceeds 5 mm. We followed this threshold and distinguished all CO2 pulses after 5 mm and more rain per day. Since CO2 pulse magnitude and its longevity were rain event-specific, in our study we divided all identified pulses into three types:
-
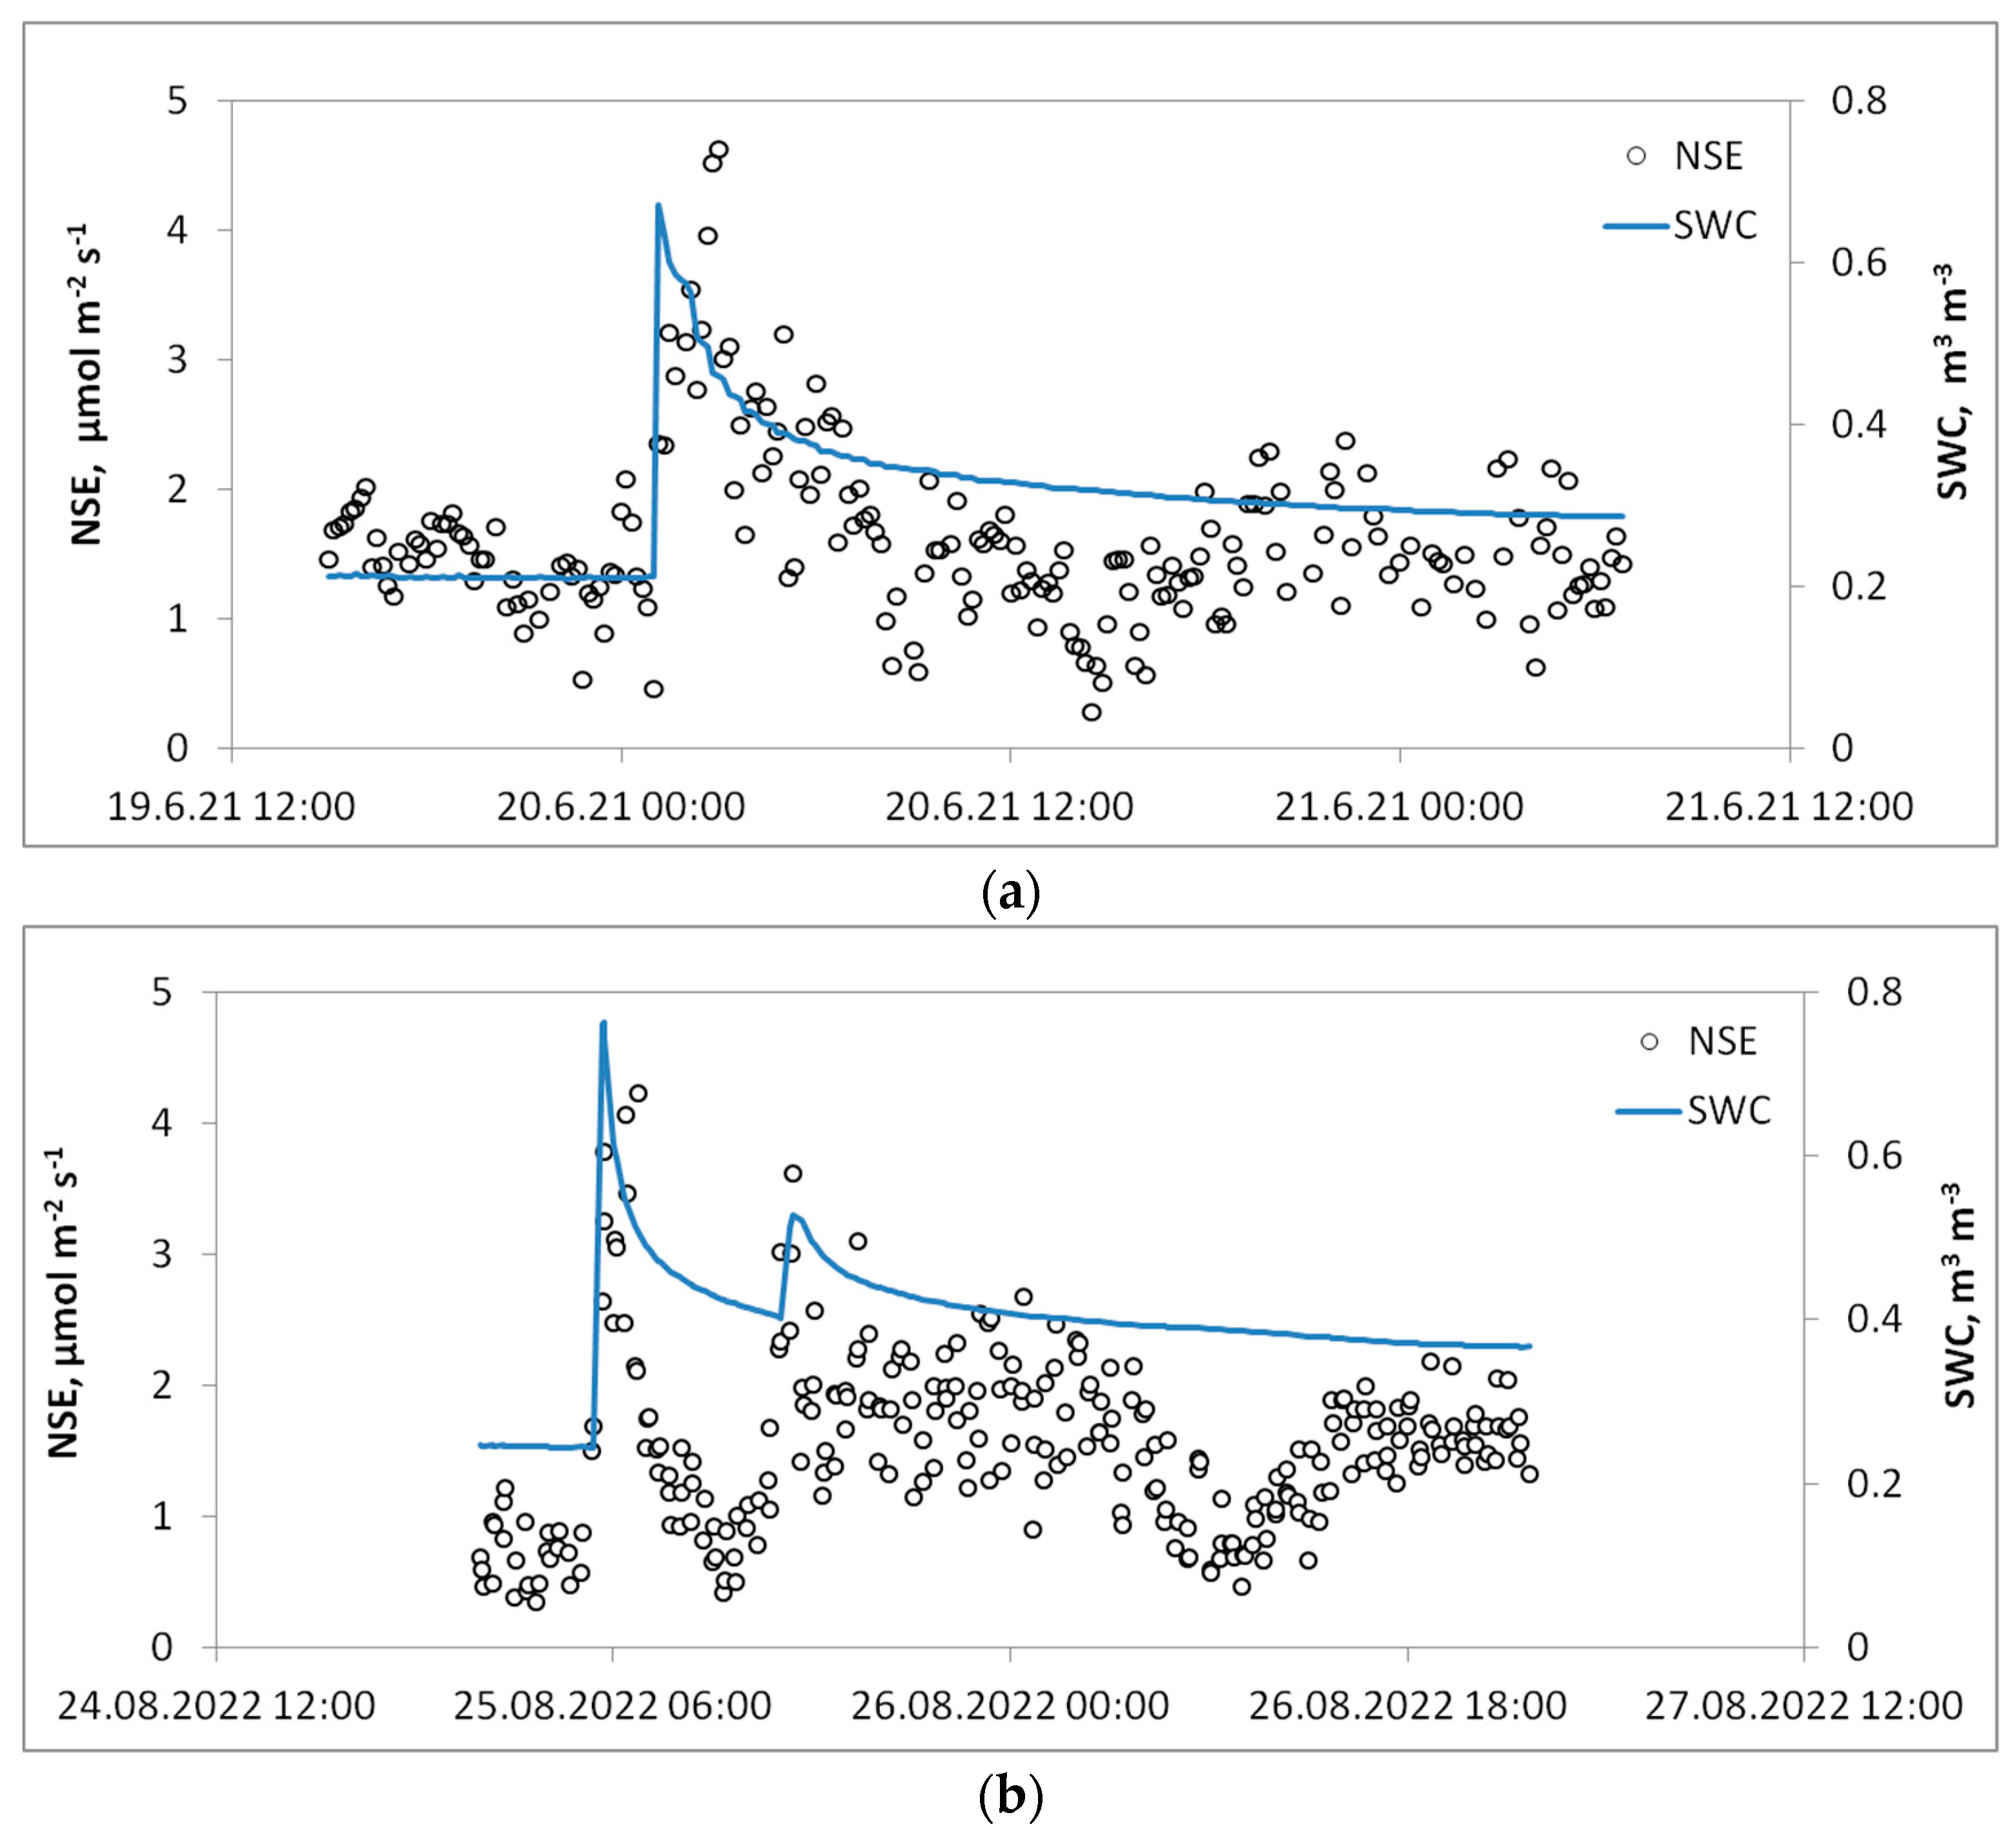
The first type was characterized by the descending behavior of CO2 efflux after a pulse (Figure 5a), i.e., after a heavy rain one observes a sharp increase in the CO2 flux rates, and then after the peak point it starts to decline;
-
The second type, the most common, is represented by multiple pulses following several consecutive rainfall events (Figure 5b). The first pulse is the strongest and the following pulses are usually less intense;
-
The third type of pulse has more complex behavior (Figure 5c). This type of pulse was observed in the 2020 season when after heavy rains, the sharp CO2 pulse lasted for a long period of time (up to 33 h), followed by a sharp decline of NSE rates. These pulses have the largest magnitude of NSE flux rates reaching 35–39 µmol m−2 s−1.
To compare the effect of rainfall with intensity >5 mm a day, we conducted the estimation of NSE flux rates for each season (Table 1). The strongest “Birch effect” was observed in 2020, with a mean NSE flux after rainfall almost 5-times exceeding the mean seasonal NSE. In 2021 and 2022, the NSE flux after rain events was much smaller, just 1.5–2.5 times higher than the mean NSE rates.

4. Discussion

4.1. Seasonal Dynamic of Soil CO2 Emission (SR) and Net Soil Exchange (NSE)

In general, soil temperature is considered as the major factor of seasonal dynamics of soil CO2 emissions [49,50]. The seasonal dynamic of SR usually displays a bell curve distribution with the peak of daily mean soil respiration in July following the general pattern for temperate, boreal, and tundra biomes, which reflect the soil temperature dynamics [49,50,51,52]. The NSE, as the balance of emission and assimilation fluxes, follow the variations in soil temperature, although can be also dependent on the vegetation phenology [53]. Soil moisture controls soil CO2 flux in dry regions [54] and might be a periodic limiting factor in temperate [54,55,56,57] and boreal forests [58,59].
Seasonal soil CO2 emissions for the studied region varies in a high range, and the mean daily fluxes vary from 0.4 to 10.9 µmol m−2 s−1 [60,61,62]. Even in the wettest seasons, the momentum SR rate does not exceed 16.5 µmol m−2 s−1 [63]. In general, these values are in agreement with existing estimates for boreal regions where the daily mean soil emission rates during a growing season ranged from 0.5 to 4 µmol m−2 s−1 [2,49,59]. However, the intensity of summer CO2 emissions might be sufficiently larger in the moister monsoon climate of the Russian Far East, where it ranges from 2.3 to 11.0 μmol m−2 s−1 [64].
The key limiting factor for plant productivity in the continental part of Siberia is low precipitation [65,66] and, thus, a shortage of available water in soils. The extended drought periods in summer cause the inhibition of all biological and biogeochemical processes. The optimal range of soil moisture in different forest ecosystems is between 21 and 40% [33,59], and it controls the mechanism of soil CO2 efflux. Our earlier findings demonstrated that despite contrasting weather seasons, the highest SR rates in pine lichen forests occur at soil moisture values ~30%, which is considered optimal [67]. Conversely, the study [68] conducted in the similar ecosystem, i.e., pine forest of the middle taiga subzone in Komi Republic, reported no statistically significant relationship between the average daily soil CO2 emissions and soil moisture. In current research, which included NSE measurements, we detected one more soil moisture interval around 23% that generates peaks in soil CO2 emission efflux (Figure 4b). Based on our previous results [69], the higher optimal moisture value (~30%) likely reflects the heterotrophic component of net soil flux. We hypothesize that the lower optimal moisture interval can be associated with the photosynthetic component of lichens consisting of two components—heterotrophic fungus and photosynthetic algal or cyanobacterial cells [70]. On the other hand, during the growing season, lichens experience frequent drying–rewetting cycles and, thus, their physiological status is highly dynamic. As such, droughts significantly limit both carbon dioxide uptake and respiration. Therefore, the specific physiological characteristics of ground vegetation, through their assimilation and respiration activities, determine the CO2 balance of forest floor [71,72] together with CO2 production in soil, controlled by physical and chemical soil properties [73].
In contrast to SR, temperature plays a minor role in control of NSE. The analysis of NSE seasonal dynamics of lichen-covered soil in a Central Siberian pine forest showed surprisingly low temporal variability during the growing season. The dominance of positive NSE and rare negative flux values, even at the period of potentially highest photoassimilation activity, reflect that lichen ground floor vegetation in Central Siberian pine forests acts mainly as a net CO2 source. These findings corroborate earlier results obtained in East Siberian larch forests of Yakutia [65] which demonstrated positive NSE (1–2 µmol m−2 s−1) during the growing season, i.e., soil respiration also exceeded CO2 photoassimilation by ground vegetation. Interestingly, arid ecosystems presented by a so-called “biocrust” have also demonstrated the positive rates of soil CO2 exchange fluxes that occur in the late spring and are characterized by the maximum activity of vascular plants [74]. In contrast, a NSE of peatland ecosystems of Western Siberia demonstrated negative values throughout the summer season, reflecting the high photosynthetic activity of peatbog vegetation [75]. So far, the steady state NSE behavior in the studied Central Siberian lichen pine forest during the entire frost-free season also suggests CO2 uptake offsets the peak of soil emissions in the middle of the growing season.

4.2. CO2 Pulses in NSE Seasonal Dynamics

Observed CO2 pulses to the atmosphere driven by a rainfall water input significantly alter the CO2 balance. In general, CO2 pulses triggered by rain events are common for the majority of bioclimatic zones [15], but have been rarely reported for the boreal regions. Despite the observed steady state NSE during the frost-free season, intense sporadic pulses in the CO2 efflux from the ground floor surface have been observed after heavy rains. These pulses of CO2 are the direct demonstration of the “Birch effect” in boreal forests [14,17,30]. The 2020 season had the most numerous and intense pulse events (up to 11-fold increase above initial levels), which were related to the distribution patterns of precipitation throughout the season and higher rain intensity. This resulted in the stronger peaks of SWC and deeper penetration of precipitation to the subsoil, likely responsible for enhanced pulse generation. In the drier season of 2021, we monitored only a few CO2 pulses from the soil and their intensity was much lower (i.e., up to 4-fold increase). The 2021 season was also characterized by an extended drought period in the mid-summer (Figure 2) and lower intensity rains, which leaded to the lower soil moisture and shallower layer rewetting. Thus, the distinctions in CO2 pulses among these seasons are caused by the difference in environmental settings responsible for CO2 pulses generation.
The importance of CO2 pulses is due to the quantity of CO2 released after heavy rains which significantly change the carbon balance. For example, in arid regions [76,77], bursts in CO2 emissions significantly affect the overall net ecosystem productivity. The study by Jenerette (2008) [78] noted that within 5 days after the pulse, there is an increase in the CO2 flux rates by 21% compared to the initial values. In this case, the magnitude of the emission pulses itself was determined by the type of ecosystem and topography of the landscape. In the study of Sponseller (2007) [79], a 30-fold increase in the CO2 emission flux was observed during the first 48 h after applying a different amount of precipitation. As noted there, the magnitude of the pulse itself depended not only on the precipitation amount, but also on the initial values of the CO2 flux, determined by the time between pulses and, accordingly, the period of the season when the emission pulse occurs [79].
The most common type of CO2 pulse [30,80] corresponds to our first type pulse curve (Figure 5a) which is characterized by a fast increase phase and a further steady decline of emission rates. The majority of observations of such pulse types were obtained in the laboratory experiments under controlled conditions [81] and are hypothesized to be driven by microbial activity and its components [22,23,24,82]. The pulse origin is associated with an increase of microbial activity induced by water input or, conversely, the CO2 release occurs as an adaptation of the microbial community to the water deficit following water input. These hypotheses should be supported by the period of time which requires microbes for their life cycle changes. However, from our in situ observations, the changes in CO2 flux rates are immediate (i.e., minutes) after a rain event, which suggests little changes in soil microbial activity in response to increasing soil moisture. Thus, at least for the studied boreal forest, the microbial role in pulse generation is mostly unlikely.
The second type (Figure 5b) of pulse behavior represents a commonly observed situation when several rain events occur within a day or in consecutive days. The first peak of CO2 pulse is characterized by the larger amount of released CO2 and the following fast decline. The second peak magnitude is lower possibly due to the combining effect of the first peak. The origin of the first peak is probably related to the physical extrusion of CO2 from the soil [32], while the following peaks are lower due to already depleted soil CO2 gas reservoirs [31,32,37].
The third pulse type (Figure 5c) is the most interesting due to the observed high and long-lasting flux rates, which are likely explained by both groups of factors—physical and biological. The physical processes might have generated the pulse [82], while soil biological processes (i.e., microbial decomposition of SOM) further maintain high CO2 efflux. A sharp decline may indicate that pulse behavior might be limited by time of the pulse and related to the deeper carbon pools and capacity of exact soils [22] or the development of the microbial community and its activity [25], which is also attributed to the climate zone and external factors such as temperature and moisture providing the supporting pulse conditions [33].
Our findings only partly agree with earlier demonstrated causes of soil CO2 pulses related mainly to drought length [11,33] and severity [18,20,82], pointing out the prevalence of the biological controls over CO2 pulses [32]. A key role in CO2 pulse generation in the study region is played by the texture of soils developed on Quaternary fluvioglacial sand deposits [83,84]. The water infiltration through the sandy soils is significantly faster (19–24 mm per hour [85]) compared to the other texture type soils. Thus, during a pulse, water rapidly penetrates into the subsoil and fills the soil pores [86,87]. One more likely component involved in pulse generation is the forest floor vegetation layer itself. Lichen tissues have large pore space that might be replaced by water during rain events. All the above mentioned processes presume pulses of CO2-enriched air from these pores.

4.3. The Role of CO2 Pulses in the Overall Frost-Free Season CO2 Flux

Previously, other research has focused on soil CO2 emissions for the studied area was carried out [60,88]. The first estimation of the seasonal CO2 emissions was around 285 g C m−2 [60], which is close to our estimations without including CO2 pulses (Figure 6). Another study carried out in this region reported the annual heterotrophic respiration rates for our research area [88] and the number for the lichen pine forest is around 180 g C m−2 [88]. However, in this case the high differences could be also related to different methods of CO2 measurements. Both studies represented the underestimation of the soil CO2 emissions.
Our study of three frost-free seasons demonstrated that the CO2 pulses might have contributed from 2 up to 39% of the total net soil CO2 emissions. The greatest input was observed in the wettest season of 2020. In the 2021 dry season, the pulse contribution to the total seasonal emission was 2% which is not a significant (p < 0.05) input to the seasonal CO2 efflux. In total, the cumulative seasonal NSE flux in 2020 (Figure 6) had as addition of 119 g C m−2 when the CO2 rain-induced pulses were included into our estimates. The highest discrepancy between NSE cumulative curves was observed from the second half of August up to the end of the growing season. Thus, including the soil emission pulses occurring during and after rain events into seasonal flux calculations may significantly increase the total efflux from the soil surface.

5. Conclusions

The quasi-continuous diurnal measurements of the net soil exchange, representing the difference between an uptake and efflux of CO2 from soil surface, were performed in a Siberian lichen pine forest to estimate the cumulative seasonal release of soil CO2 which comprise the CO2 pulses induced by precipitation events during a frost-free season. To our knowledge, this study during three seasons, differed by precipitation patterns, is the first to investigate the effect of rainfall events on soil respiration in a large boreal region. Our findings demonstrated that heavy rains cause a rapid pulse of soil emissions and, as a consequence, the release of additional amounts of CO2 from the soil into the atmosphere. The input of CO2 pulses to the seasonal efflux varied from near 0 to 39% when the sum CO2 release from the soil to the atmosphere amounted for from 4 to 155 gC m−2, depending on precipitation patterns of particular season. Soil CO2 pulses have a higher magnitude and longevity in wetter seasons. The main conditions to produce the stronger CO2 pulses are rain intensity and the optimal soil moisture values stimulating the activity of lichen and soil microbiota.
Thus, there is the critical need for at least hourly scale measurements of soil CO2 fluxes throughout the growing season which, in part, capture the CO2 pulses induced by rain events. This approach has inevitable importance for the accurate assessment of seasonal CO2 soil emissions and adequate predictions of responses of boreal pine forests to climate changes.

Author Contributions

Conceptualization, A.V.M., E.A.V. and A.S.P.; methodology, A.V.M.; formal analysis, A.V.M. and A.S.P.; investigation, A.V.M., E.A.V. and A.S.P.; resources, A.V.P., A.S.P. and A.V.M.; writing—original draft preparation, A.V.M.; writing—review and editing, A.S.P., A.V.P., N.N.K.; visualization, N.N.K. and A.V.P. All authors have read and agreed to the published version of the manuscript.

Funding

In situ observations and raw data processing were supported by the Russian Academy of Sciences within the framework of the state assignment (#FWES-2024-0040) of the Sukachev Institute of Forest Siberian Branch of the Russian Academy of Sciences. Also, this research was carried out as a part of the most important innovative project of national importance: “Development of a system for ground-based and remote monitoring of carbon pools and greenhouse gas fluxes in the territory of the Russian Federation, ensuring the creation of recording data systems on the fluxes of climate-active substances and the carbon budget in forests and other terrestrial ecological systems” (#123030300031-6).

Data Availability Statement

The data discussed in this paper are available upon request.

Acknowledgments

The authors express their deep gratitude to the staff of the international research station “ZOTTO” for maintaining continuous measurements.

Conflicts of Interest

The authors declare no conflicts of interest.

References

  1. Pan, Y.; Birdsey, R.; Fang, J.; Houghton, R.; Kauppi, P.E.; Kurz, W.A.; Phillips, O.L.; Shvidenko, A.; Lewis, S.L.; Canadell, J.G.; et al. A large and persistent carbon sink in the world’s forests. Science 2011, 33, 988–993. [Google Scholar] [CrossRef]
  2. Harel, A.; Sylvain, J.-D.; Drolet, G.; Thiffault, E.; Thiffault, N.; Tremblay, S. Fine scale assessment of seasonal, intra-seasonal and spatial dynamics of soil CO2 effluxes over a balsam fir-dominated perhumid boreal landscape. Agric. For. Meteorol. 2023, 335, 109469. [Google Scholar] [CrossRef]
  3. Mukhortova, L.; Schepaschenko, D.; Shvidenko, A.; McCallum, I.; Kraxner, F. Soil contribution to carbon budget of Russian forests. Agric. For. Meteorol. 2015, 200, 97–108. [Google Scholar] [CrossRef]
  4. Abbott, B.W.; Jones, J.B. Permafrost collapse alters soil carbon stocks, respiration, CH4, and N2O in upland tundra. Glob. Chang. Biol. 2015, 21, 4570–4587. [Google Scholar] [CrossRef]
  5. Bond-Lamberty, B.; Bailey, V.L.; Chen, M.; Gough, C.M.; Vargas, R. Globally rising soil heterotrophic respiration over recent decades. Nature 2018, 560, 80–83. [Google Scholar] [CrossRef]
  6. Schuur, E.A.G.; McGuire, A.D.; Schädel, C.; Grosse, G.; Harden, J.W.; Hayes, D.J.; Hugelius, G.; Koven, C.D.; Kuhry, P.; Lawrence, D.M.; et al. Climate change and the permafrost carbon feedback. Nature 2015, 520, 171–179. [Google Scholar] [CrossRef]
  7. Kurganova, I.N.; Kudeyarov, V.N. Is a significant positive imbalance in the carbon cycle (sink) possible in Russia? Environ. Dyn. Glob. Clim. Chang. 2015, 6, 32–35. [Google Scholar] [CrossRef]
  8. Darrouzet-Nardi, A.; Reed, S.C.; Grote, E.E.; Belnap, J. Observations of net soil exchange of CO2 in a dryland show experimental warming increases carbon losses in biocrust soils. Biogeochemistry 2015, 126, 363–378. [Google Scholar] [CrossRef]
  9. Fernandez, D.; Neff, J.; Belnap, J.; Reynolds, R. Soil respiration in the cold desert environment of the Colorado Plateau (USA): Abiotic regulators and thresholds. Biogeochemistry 2006, 78, 247–265. [Google Scholar] [CrossRef]
  10. Grote, E.E.; Belnap, J.; Housman, D.C.; Sparks, J.P. Carbon exchange in biological soil crust communities under differential temperatures and soil water contents: Implications for global change. Glob. Chang. Biol. 2010, 16, 2763–2774. [Google Scholar] [CrossRef]
  11. Lee, X.; Wu, H.J.; Sigler, J.; Oishi, C.; Siccama, T. Rapid and transient response of soil respiration to rain. Glob. Chang. Biol. 2004, 10, 1017–1026. [Google Scholar] [CrossRef]
  12. Prudhomme, C.; Giuntoli, I.; Robinson, E.L.; Clark, D.B.; Arnell, N.W.; Dankers, R.; Fekete, B.M.; Franssen, W.; Gerten, D.; Gosling, S.N.; et al. Hydrological droughts in the 21st century, hotspots and uncertainties from a global multimodel ensemble experiment. Proc. Natl. Acad. Sci. USA 2014, 111, 3262–3267. [Google Scholar] [CrossRef]
  13. IPCC. Climate Change 2021: The Physical Science Basis; Contribution of Working Group I to the Sixth Assessment Report of the Intergovernmental Panel on Climate Change; Cambridge University Press: Cambridge, UK, 2021. [Google Scholar] [CrossRef]
  14. Birch, H.F. The effect of soil drying on humus decomposition and nitrogen availability. Plant Soil 1958, 10, 9–31. [Google Scholar] [CrossRef]
  15. Jiang, Z.; Yang, S.; Ding, J.; Sun, X.; Chen, X.; Liu, X.; Xu, J. Modeling climate change effects on rice yield and soil carbon under variable water and nutrient management. Sustainability 2021, 13, 568. [Google Scholar] [CrossRef]
  16. Patrick, C.J.; McGarvey, D.J.; Larson, J.H.; Cross, W.F.; Allen, D.C.; Benke, A.C.; Brey, T.; Huryn, A.D.; Jones, J.; Murphy, C.A.; et al. Precipitation and temperature drive continental-scale patterns in stream invertebrate production. Sci. Adv. 2019, 5, eaav2348. [Google Scholar] [CrossRef] [PubMed]
  17. Zhang, S.; Yu, Z.; Lin, J.; Zhu, B. Responses of soil carbon decomposition to drying-rewetting cycles: A meta-analysis. Geoderma 2020, 361, 114069. [Google Scholar] [CrossRef]
  18. Denef, K.; Six, J.; Bossuyt, H.; Frey, S.D.; Elliott, E.T.; Merckx, R.; Paustian, K. Influence of dry-wet cycles on the interrelationship between aggregate, particulate organic matter, and microbial activity dynamics. Soil Biol. Biochem. 2001, 33, 1599–1611. [Google Scholar] [CrossRef]
  19. Bottner, P. Response of microbial biomass to alternate moist and dry conditions in a soil incubated with 14C- and 15N-labelled plant material. Soil Biol. Biochem. 1985, 17, 329–337. [Google Scholar] [CrossRef]
  20. Griffiths, E.; Birch, H.F. Microbiological changes in freshly moistened soil. Nature 1961, 189, 424. [Google Scholar] [CrossRef]
  21. Orchard, V.A.; Cook, F.J. Relationship between soil respiration and soil moisture. Soil Biol. Biochem. 1983, 15, 447–453. [Google Scholar] [CrossRef]
  22. Schimel, J.P. Life in Dry Soils: Effects of drought on soil microbial communities and processes. Annu. Rev. Ecol. Evol. Syst. 2018, 49, 409–432. [Google Scholar] [CrossRef]
  23. Sun, S.; Lei, H.; Chang, S.X. Drought differentially affects autotrophic and heterotrophic soil respiration rates and their temperature sensitivity. Biol. Fertil. Soils 2019, 55, 275–283. [Google Scholar] [CrossRef]
  24. Yang, W.; Cao, J.; Wu, Y.; Kong, F.; Li, L. Review on plant terpenoid emissions worldwide and in China. Sci. Total Environ. 2021, 787, 147454. [Google Scholar] [CrossRef] [PubMed]
  25. Kieft, T.L.; Soroker, E.; Firestone, M.K. Microbial biomass response to a rapid increase in water potential when dry soil is wetted. Soil Biol. Biochem. 1987, 19, 119–126. [Google Scholar] [CrossRef]
  26. Fierer, N.; Schimel, J.P. A proposed mechanism for the pulse in carbon dioxide production commonly observed following the rapid rewetting of a dry soil. Soil Sci. Soc. Am. J. 2003, 67, 798–805. [Google Scholar] [CrossRef]
  27. Blankinship, J.C.; Niklaus, P.A.; Hungate, B.A. A meta-analysis of responses of soil biota to global change. Oecologia 2011, 165, 553–565. [Google Scholar] [CrossRef]
  28. Sun, D.; Li, K.; Bi, Q.; Zhu, J.; Zhang, Q.; Jin, C.; Lu, L.; Lin, X. Effects of organic amendment on soil aggregation and microbial community composition during drying-rewetting alternation. Sci. Total Environ. 2017, 574, 735–743. [Google Scholar] [CrossRef]
  29. Kim, D.G.; Vargas, R.; Bond-Lamberty, B.; Turetsky, M.R. Effects of soil rewetting and thawing on soil gas fluxes: A review of current literature and suggestions for future research. Biogeosciences 2012, 9, 2459–2483. [Google Scholar] [CrossRef]
  30. Huxman, T.E.; Snyder, K.A.; Tissue, D.; Leffler, A.J.; Ogle, K.; Pockman, W.T.; Sandquist, D.R.; Potts, D.L.; Schwinning, S. Precipitation pulses and carbon fluxes in semiarid and arid ecosystems. Oecologia 2004, 141, 254–268. [Google Scholar] [CrossRef] [PubMed]
  31. Inglima, I.; Alberti, G.; Bertolini, T.; Vaccari, F.P.; Gioli, B.; Miglietta, F.; Peressotti, A. Precipitation pulses enhance respiration of Mediterranean ecosystems: The balance between organic and inorganic components of increased soil CO2 efflux. Glob. Chang. Biol. 2009, 15, 1289–1301. [Google Scholar] [CrossRef]
  32. Barnard, R.L.; Blazewicz, S.J.; Mary, K. Firestone rewetting of soil: Revisiting the origin of soil CO2 emissions. Soil Biol. Biochem. 2020, 147, 107819. [Google Scholar] [CrossRef]
  33. Xu, L.; Baldocchi, D.D.; Tang, J. How soil moisture, rain pulses, and growth alter the response of ecosystem respiration to temperature. Glob. Biogeochem. Cycles 2004, 18, GB4002. [Google Scholar] [CrossRef]
  34. Tiemann, L.K.; Billings, S.A. Changes in variability of soil moisture alter microbial community C and N resource use. Soil Biol. Biochem. 2011, 43, 1837–1847. [Google Scholar] [CrossRef]
  35. Dai, A.; Zhao, T.; Chen, J. Climate change and drought: A precipitation and evaporation perspective. Curr. Clim. Chang. Rep. 2018, 4, 301–312. [Google Scholar] [CrossRef]
  36. Fan, Z.; Neff, J.C.; Hanan, N.P. Modeling pulsed soil respiration in an African savanna ecosystem. Agric. For. Meteorol. 2015, 200, 282–292. [Google Scholar] [CrossRef]
  37. Sang, J.; Lakshani, M.M.T.; Deepagoda, C.T.K.K.; Shen, Y.; Li, Y. Drying and rewetting cycles increased soil carbon dioxide rather than nitrous oxide emissions: A meta-analysis. J. Environ. Manage. 2022, 324, 116391. [Google Scholar] [CrossRef]
  38. Klimchenko, A.V.; Verkhovets, S.V.; Slinkina, O.A.; Koshurnikova, N.N. Reserves of coarse woody debris in middle-taiga ecosystems of Yenisei Siberia. Geogr. Environ. Resour. 2011, 2, 91–97. (In Russian) [Google Scholar]
  39. Dymov, A.A.; Startsev, V.V.; Yakovleva, E.V.; Dubrovskiy, Y.A.; Milanovsky, E.Y.; Severgina, D.A.; Panov, A.V.; Prokushkin, A.S. Fire-induced alterations of soil properties in albic podzols developed under pine forests (middle taiga, Krasnoyarsky Kray). Fire 2023, 6, 67. [Google Scholar] [CrossRef]
  40. Polosukhina, D.A.; Prokushkin, A.S. Comparative characteristics of reserves and isotopic composition of soil organic matter in forest biogeocenoses in the footprint zone of the ZOTTO tall tower. In Proceedings of the Lomonosov Readings in Altai: Fundamental Problems of Science and Education, Barnaul, Russia, 14–17 November 2017. (In Russian). [Google Scholar]
  41. Makhnykina, A.V. The influence of temperature and humidity on CO2 emission fluxes from the soil surface in pine forests of the middle taiga subzone of Central Siberia. Diss. Cand. Biol. Sci. 2020. (In Russian) [Google Scholar]
  42. Makhnykina, A.V.; Prokushkin, A.S.; Vaganov, E.A.; Verkhovets, S.V.; Rubtsov, A.V. Dynamics of the CO2 fluxes from the soil surface in pine forests in Central Siberia. J. Sib. Fed. Univ. Biol. 2016, 3, 338–357. [Google Scholar] [CrossRef]
  43. R Core Team. R: A Language and Environment for Statistical Computing; R Foundation for Statistical Computing: Vienna, Austria, 2020; Available online: http://www.r-project.org (accessed on 15 May 2023).
  44. Wickham, H.; François, R.; Henry, L.; Müller, K. Dplyr: A Grammar of Data Manipulation. R Package Version 0.8.4.2020. Available online: https://CRAN.R-project.org/package=dplyr (accessed on 10 May 2023).
  45. Wickham, H.; Averick, M.; Bryan, J.; Chang, W.; Mc-Gowan, L.D.A.; François, R.; Grolemund, G.; Hayes, A.; Henry, L.; Hester, J.; et al. Welcome to the tidyverse. J. Open Source Softw. 2019, 4, 1686. [Google Scholar] [CrossRef]
  46. Grolemund, G.; Wickham, H. Dates and times made easy with lubridate. J. Open Source Softw. 2011, 40, 1–25. [Google Scholar] [CrossRef]
  47. Wickham, H.; Çetinkaya-Rundel, M.; Grolemund, G. R for Data Science, 2nd ed.; O’Reilly Media: Sebastopol, CA, USA, 2016; Available online: https://r4ds.hadley.nz (accessed on 6 April 2023).
  48. Wickham, H. Mastering Shiny; O’Reilly Media: Sebastopol, CA, USA, 2016; Available online: https://github.com/rstudio/shiny. (accessed on 16 April 2023).
  49. Karelin, D.V.; Pochikalov, A.V.; Zamolodchikov, D.G.; Gitarskii, M.L. Factors of spatiotemporal variability of CO2 fluxes from soils of southern taiga spruce forests of Valdai. Contemp. Probl. Ecol. 2014, 7, 743–751. [Google Scholar] [CrossRef]
  50. Laganière, J.; Paré, D.; Bergeron, Y.; Chen, H.Y.H. The effect of boreal forest composition on soil respiration is mediated through variations in soil temperature and C quality. Soil Biol. Biochem. 2012, 53, 18–27. [Google Scholar] [CrossRef]
  51. Raich, J.; Schlesinger, W.H. The global carbon dioxide flux in soil respiration and its relationship to vegetation and climate. Tellus B Chem. Phys. Meteorol. 1992, 44, 81–99. [Google Scholar] [CrossRef]
  52. Bond-Lamberty, B.; Thompson, A. Temperature-associated increases in the global soil respiration record. Nature 2010, 464, 579–582. [Google Scholar] [CrossRef] [PubMed]
  53. Roby, M.C.; Scott, R.L.; Biederman, J.A.; Smith, W.K.; Moore, D.J.P. Response of soil carbon dioxide efflux to temporal repackaging of rainfall into fewer, larger events in a semiarid grassland. Front. Environ. Sci. 2022, 10, 940943. [Google Scholar] [CrossRef]
  54. Savage, K.; Davidson, E.A.; Richardson, A.D.; Hollinger, D.Y. Three scales of temporal resolution from automated soil respi-ration measurements. Agric. For. Meteorol. 2009, 149, 2012–2021. [Google Scholar] [CrossRef]
  55. Sun, J.; Yu, K.; Chen, N.; Munson, S.M.; Li, X.; Jia, R. Biocrusts modulate carbon losses under warming across global drylands: A bayesian meta-analysis. Soil Biol. Biochem. 2013, 188, 109214. [Google Scholar] [CrossRef]
  56. Davidson, E.A.; Belk, E.; Boone, R.D. Soil water content and temperature as independent or confounded factors controlling soil respiration in a temperate mixed hardwood forest. Glob. Chang. Biol. 1998, 4, 217–227. [Google Scholar] [CrossRef]
  57. Subke, J.-A.; Reichstein, M.; Tenhunen, J.D. Explaining temporal variation in soil CO2 efflux in a mature spruce forest in Southern Germany. Soil Biol. Biochem. 2003, 35, 1467–1483. [Google Scholar] [CrossRef]
  58. Kolari, P.; Kulmala, L.; Pumpanen, J.; Launiainen, S.; Ilvesniemi, H.; Hari, P.; Nikinmaa, E. CO2 exchange and component CO2 fluxes of a boreal Scots pine forest. Boreal Environ. Res. 2009, 14, 761–783. [Google Scholar]
  59. Niinistö, S.M.; Kellomäki, S.; Silvola, J. Seasonality in a boreal forest ecosystem affects the use of soil temperature and moisture as predictors of soil CO2 efflux. Biogeosciences 2011, 8, 3169–3186. [Google Scholar] [CrossRef]
  60. Shibistova, O.; Lloyd, J.; Evgrafova, S.; Savushkina, N.; Zrazhevskaya, G.; Arneth, A.; Knohl, A.; Kolle, O.; Schulze, E.-D. Seasonal and spatial variability in soil CO2 efflux rates for a Central Siberian Pinus sylvestris forest. Tellus B 2002, 54, 552–567. [Google Scholar] [CrossRef]
  61. Makhnykina, A.; Panov, A.; Prokushkin, A. The impact of wildfires on soil CO2 emission in middle taiga forests in Central Siberia. Land 2023, 12, 1544. [Google Scholar] [CrossRef]
  62. Masyagina, O.V.; Menyailo, O.V.; Prokushkin, A.S.; Matvienko, A.I.; Makhnykina, A.V.; Evgrafova, S.Y.; Mori, S.; Koike, T.; Prokushkin, S.G. Soil respiration in larch and pine ecosystems of the Krasnoyarsk region (Russian Federation): A latitudinal comparative study. Arab. J. Geosci. 2020, 13, 954. [Google Scholar] [CrossRef]
  63. Makhnykina, A.V.; Prokushkin, A.S.; Menyailo, O.V.; Verkhovets, S.V.; Tychkov, I.I.; Urban, A.V.; Rubtsov, A.V.; Koshurnikova, N.N.; Vaganov, E.A. The impact of climatic factors on CO2 emissions from soils of middle-taiga forests in Central Siberia: Emission as a function of soil temperature and moisture. Russ. J. Ecol. 2020, 51, 46–56. [Google Scholar] [CrossRef]
  64. Ivanov, A.V.; Braun, M.; Tataurov, V.A. Seasonal and daily dynamics of the CO2 emission from soils of Pinus koraiensis forests in the south of the Sikhote-Alin Range. Eurasian Soil Sci. 2018, 51, 290–295. [Google Scholar] [CrossRef]
  65. Kotani, A.; Saito, A.; Kononov, A.V.; Petrov, R.E.; Maximov, T.C.; Iijima, Y.; Ohta, T. Impact of unusually wet permafrost soil on understory vegetation and CO2 exchange in a larch forest in eastern Siberia. Agric. For. Meteorol. 2019, 265, 295–309. [Google Scholar] [CrossRef]
  66. Maximov, T.C.; Maksimov, A.; Kononov, A.; Kotani, A.; Dolman, J. Carbon cycles in forest. In Water-Carbon Dynamics in Eastern Siberia; Ohta, T., Hiyama, T., Iijima, Y., Kotani, A., Maximov, T.C., Eds.; Springer: Tokyo, Japan, 2019; pp. 69–100. [Google Scholar] [CrossRef]
  67. Kim, Y. Effect of thaw depth on fluxes of CO2 and CH4 in manipulated Arctic coastal tundra of Barrow. Sci. Total Environ. 2015, 505, 385–389. [Google Scholar] [CrossRef] [PubMed]
  68. Osipov, A.F. Carbon dioxide emission from the soil surface in mature bilberry pine forest in middle taiga (Republic of Komi). Eurasian Soil Sci. 2016, 49, 926–933. [Google Scholar] [CrossRef]
  69. Makhnykina, A.V.; Tychkov, I.I.; Prokushkin, A.S.; Pyzhev, A.I.; Vaganov, E.A. Factors of soil CO2 emission in boreal forests: Evidence from Central Siberia. iForest 2023, 16, 86–94. [Google Scholar] [CrossRef]
  70. Henskens, F.L.; Allan Green, T.G.; Wilkins, A. Cyanolichens can have both cyanobacteria and green algae in a common layer as major contributors to photosynthesis. Ann. Bot. 2012, 110, 555–563. [Google Scholar] [CrossRef]
  71. Savage, K.; Davidson, E.A.; Tang, J. Diel patterns of autotrophic and heterotrophic respiration among phenological stages. Glob. Chang. Biol. 2013, 19, 1151–1159. [Google Scholar] [CrossRef]
  72. Wang, Y.; Li, X.; Zhang, C.; Wu, X.; Du, E.; Wu, H.; Yang, X.; Wang, P.; Bai, Y.; Wu, Y.; et al. Responses of soil respiration to rainfall addition in a desert ecosystem: Linking physiological activities and rainfall pattern. Sci. Total Environ. 2019, 650, 3007–3016. [Google Scholar] [CrossRef]
  73. Chapin, F.S.; Matson, P.A.; Vitousek, P. Principles of Terrestrial Ecosystem Ecology; Springer Science & Business Media: New York, NY, USA, 2011; p. 546. [Google Scholar] [CrossRef]
  74. Darrouzet-Nardi, A.; Reed, S.C.; Grote, E.E.; Belnap, J. Patterns of longer-term climate change effects on CO2 efflux from biocrusted soils differ from those observed in the short term. Biogeosciences 2018, 15, 4561–4573. [Google Scholar] [CrossRef]
  75. Dyukarev, E.A.; Golovatskaya, E.A.; Lapshina, E.D.; Filippova, N.V.; Zarov, E.A.; Filippov, I.V. Modeling of the net ecosystem exchange, gross primary production, and ecosystem respiration for peatland ecosystems of western Siberia. IOP Conf. Ser. Earth Environ. Sci. 2018, 211, 012028. [Google Scholar] [CrossRef]
  76. Schwinning, S.; Sala, O.E. Hierarchy of responses to resource pulses in arid and semi-arid ecosystems. Oecologia 2004, 141, 211–220. [Google Scholar] [CrossRef]
  77. Scott, R.L.; Serrano-Ortiz, P.; Domingo, F.; Hamerlynck, E.P.; Kowalski, A.S. Commonalities of carbon dioxide exchange in semiarid regions with monsoon and Mediterranean climates. J. Arid Environ. 2012, 84, 71–79. [Google Scholar] [CrossRef]
  78. Jenerette, G.D.; Scott, R.L.; Huxman, T.E. Whole ecosystem metabolic pulses following precipitation events. Funct. Ecol. 2008, 22, 924–930. [Google Scholar] [CrossRef]
  79. Sponseller, R.A. Precipitation pulses and soil CO2 flux in a Sonoran Desert ecosystem. Glob. Chang. Biol. 2007, 13, 426–436. [Google Scholar] [CrossRef]
  80. Barron-Gafford, G.A.; Scott, R.L.; Jenerette, G.D.; Huxman, T.E. The relative controls of temperature, soil moisture, and plant functional group on soil CO2 efflux at diel, seasonal, and annual scales. J. Geophys. Res. 2011, 116, G01023. [Google Scholar] [CrossRef]
  81. Ni, X.; Liao, S.; Wu, F.; Groffman, P.M. Short-term precipitation pulses stimulate soil CO2 emission but do not alter CH4 and N2O fluxes in a northern hardwood forest. Soil Biol. Biochem. 2019, 130, 8–11. [Google Scholar] [CrossRef]
  82. Xiang, S.-R.; Doyle, A.; Holden, P.A.; Schimel, J.P. Drying and rewetting effects on C and N mineralization and microbial activity in surface and subsurface California grassland soils. Soil Biol. Biochem. 2008, 40, 2281–2289. [Google Scholar] [CrossRef]
  83. Stepanova, O.G.; Trunova, V.A.; Osipov, E.Y.; Kononov, E.E.; Vorobyeva, S.S.; Parkhomchuk, E.V.; Kalinkin, P.N.; Vorobyeva, E.E.; Vershinin, K.E.; Rastigeev, S.A.; et al. Glacier dynamics in the southern part of East Siberia (Russia) from the final part of the LGM to the present based on from biogeochemical proxies from bottom sediments of proglacial lakes. Quat. Int. 2019, 524, 4–12. [Google Scholar] [CrossRef]
  84. Kharanzhevskaya, Y.A.; Voistinova, E.S.; Sinyutkina, A.A. Spatial and temporal variations in mire surface water chemistry as a function of geology, atmospheric circulation and zonal features in the south-eastern part of western Siberia. Sci. Total Environ. 2020, 733, 139343. [Google Scholar] [CrossRef] [PubMed]
  85. Bormann, H.; Klaassen, K. Seasonal and land use dependent variability of soil hydraulic and soil hydrological properties of two northern German soils. Geoderma 2008, 145, 295–302. [Google Scholar] [CrossRef]
  86. Zavalishin, A.A. Soils of the Forest Zone, Their Formation and Properties; Publishing House of the USSR Academy of Sciences: Leningrag, Russia, 1939; p. 111. [Google Scholar]
  87. Sanborn, P.; Lamontagne, L.; Hendershot, W. Podzolic soils of Canada: Genesis, distribution, and classification. Can. J. Soil Sci. 2011, 91, 843880. [Google Scholar] [CrossRef]
  88. Trefilova, O.V. Intensity of heterotrophic respiration in pine forest of middle taiga: Comparative analysis of assessment methods. Conifers Boreal Zone 2007, 24, 467–473. (In Russian) [Google Scholar]
Figure 1. Climograph for Bor (GHCN-D station code: RSM00023884 BOR Russia): mean monthly air temperature (1936–2022), mean monthly precipitation (1966–2022).
Forests 15 00355 g001
Figure 2. Daily precipitation for measurement seasons (1st June–30th September). DOY—day of year.
Forests 15 00355 g002
Figure 3. The seasonal dynamics of net soil exchange (NSE), soil respiration (SR), and continuous soil temperature at 8 cm depth (ST8) and soil moisture at 8 cm depth (SWC8) during three frost-free seasons: (a) 2020, (b) 2021, and (c) 2022. The NSE values are shown as hourly mean with standard deviations and SR as daily mean with standard deviations. Note the log scale on the first y-axis (NSE).
Forests 15 00355 g003aForests 15 00355 g003b
Figure 4. The dependencies of soil CO2 emission (a,b) and NSE (c,d) on soil temperature and soil moisture. The dashed lines show the shape of the dependence.
Forests 15 00355 g004
Figure 5. Changes in NSE (net soil exchange) and soil water content (SWC) for the different types of CO2 pulses: (a) Type 1, (b) Type 2, and (c) Type 3 (see Section 3.4 for details).
Forests 15 00355 g005aForests 15 00355 g005b
Figure 6. Cumulative NSE flux for the 2020 frost-free season: blue line—including CO2 pulses, red line—without CO2 pulses.
Forests 15 00355 g006
Table 1. Seasonal NSE fluxes (mean daily flux ± standard deviation).
SeasonMean Season NSE, µmol m−2 s−1 ± SDPulse NSE
(Rain > 5 mm),
µmol m−2 s−1 ± SD
Sum Mean NSE Per Season, g C m−2Sum Pulse NSE
Per Season, g C m−2
Pulse NSE Input (Rain > 5 mm)
Per Season, %
20203.7 ± 5.118.0 ± 8.2394.9154.539%
20211.6 ± 0.71.8 ± 1.3156.83.82%
2022 *1.4 ± 1.24.5 ± 2.934.85.415%
* In 2022, we carried out measurements in August and September.
Disclaimer/Publisher’s Note: The statements, opinions and data contained in all publications are solely those of the individual author(s) and contributor(s) and not of MDPI and/or the editor(s). MDPI and/or the editor(s) disclaim responsibility for any injury to people or property resulting from any ideas, methods, instructions or products referred to in the content.

