

Pedodiversity and Organic Matter Dynamics in the North Apennines (Italy): Relationships among Soil Types, Biodiversity, and Ecological Functionality

 , ,
, ,  ,
,  ,
,  ,
,  and
and
Abstract
1. Introduction
2. Materials and Methods
2.1. Characterization of the Study Areas: Location, Climate, Land Use, and Vegetation
2.2. Soil Survey
2.3. Soil Analysis
2.3.1. Physicochemical Soil Characteristics
2.3.2. Total Element Concentration
2.3.3. Organic C and Total N Determination and Stable Isotopes (δ13C and δ15N)
2.3.4. Total Element Concentrations
2.3.5. Biochemical Soil Parameters
2.3.6. DNA Extraction and Taxonomic Assignment
2.4. Data Elaboration and Statistical Analysis
3. Results
3.1. Pedodiversity
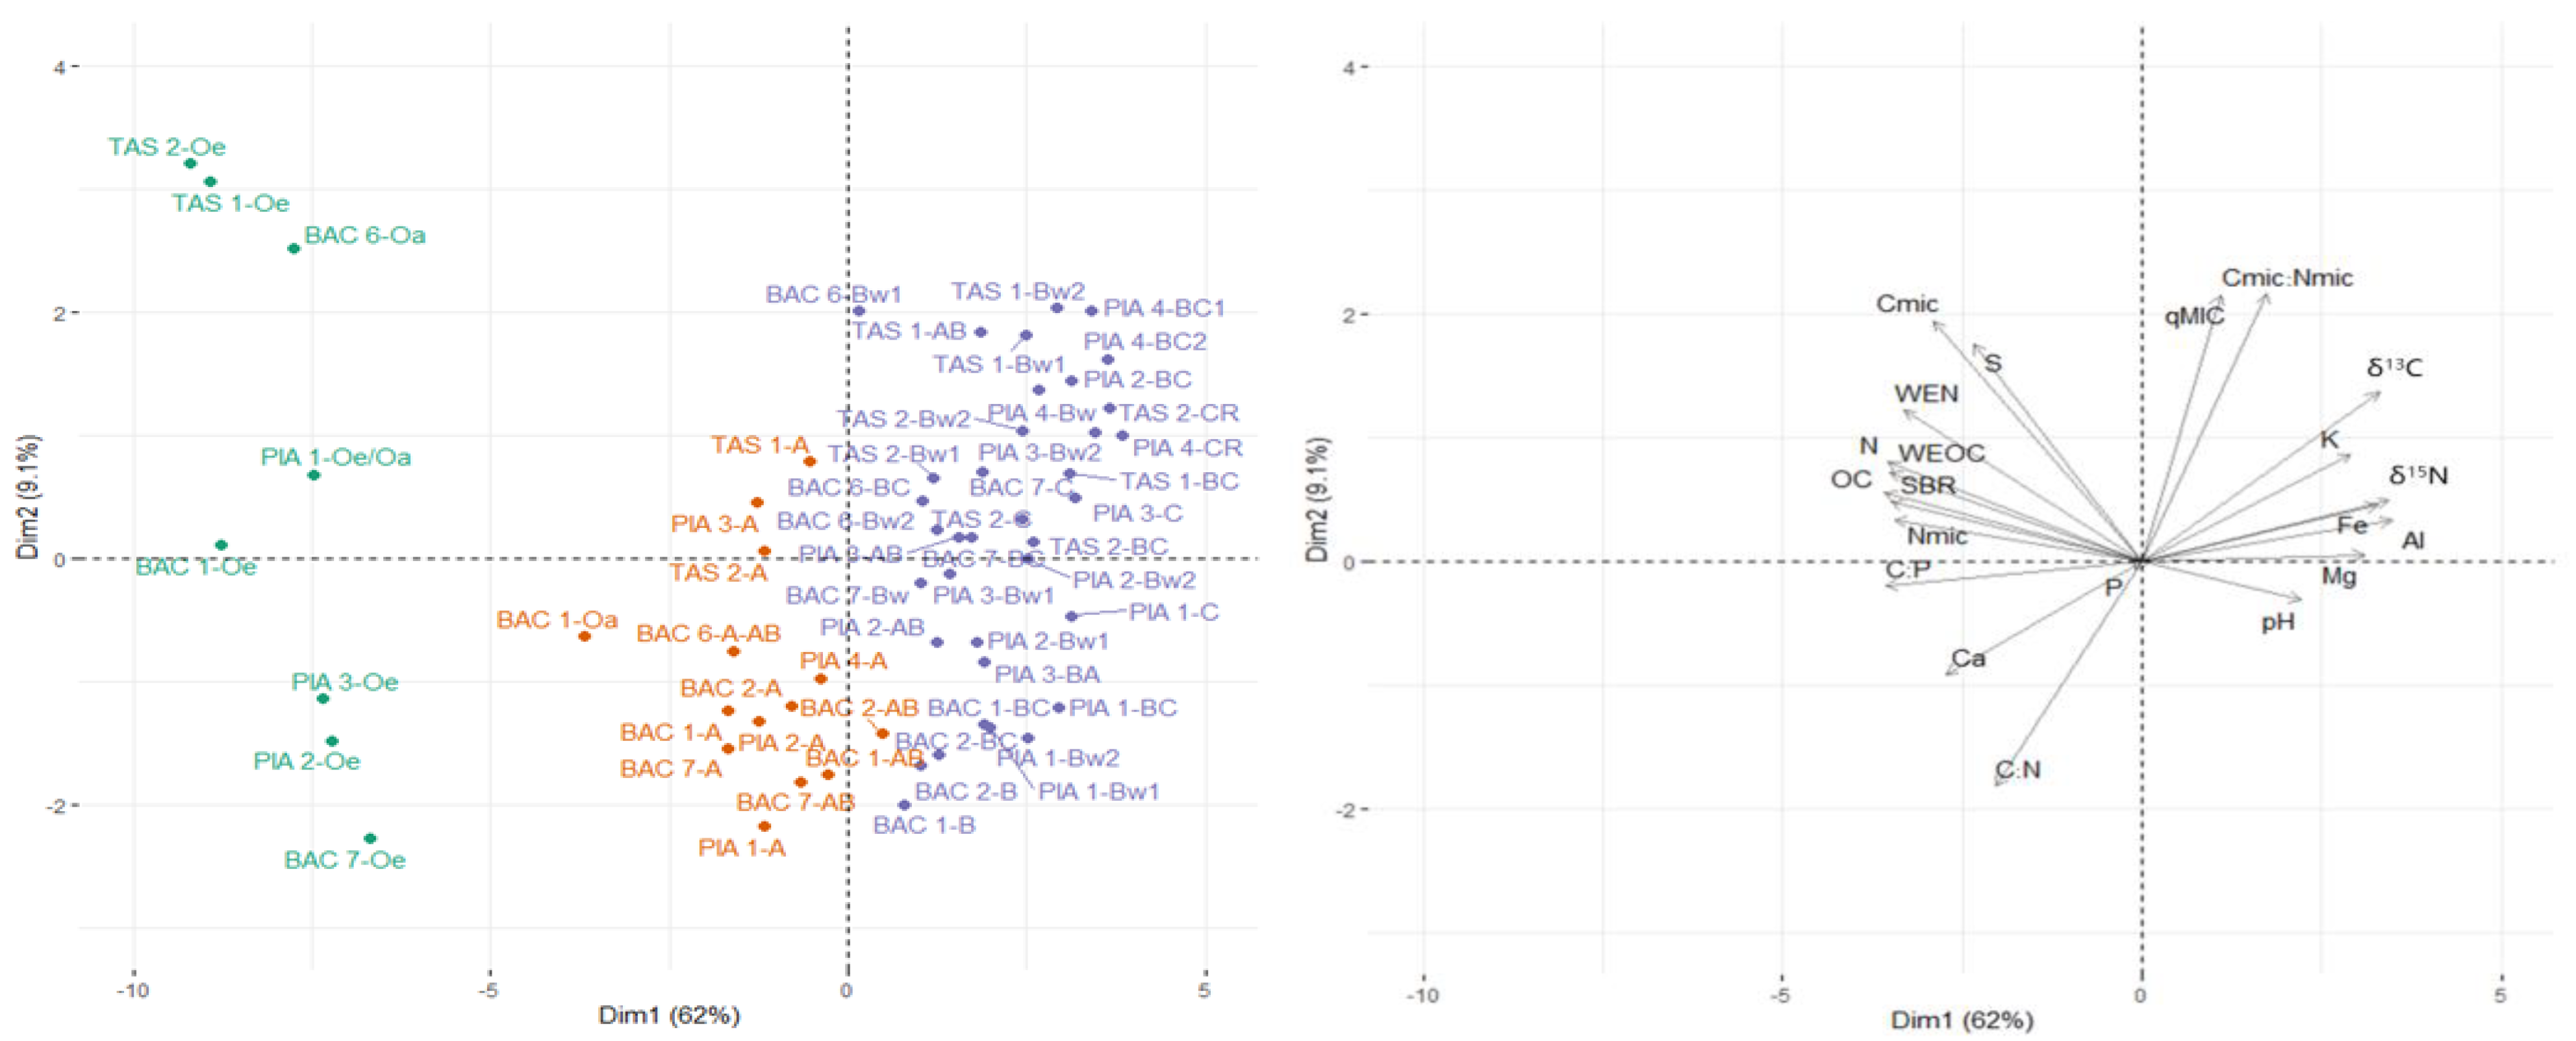
3.2. Principal Component Analysis
3.3. Soil Profiles, Features, and Organic Matter Characterization of Bulk Soil
3.4. Soil Organic Matter Fractions
3.5. Biochemical Parameters
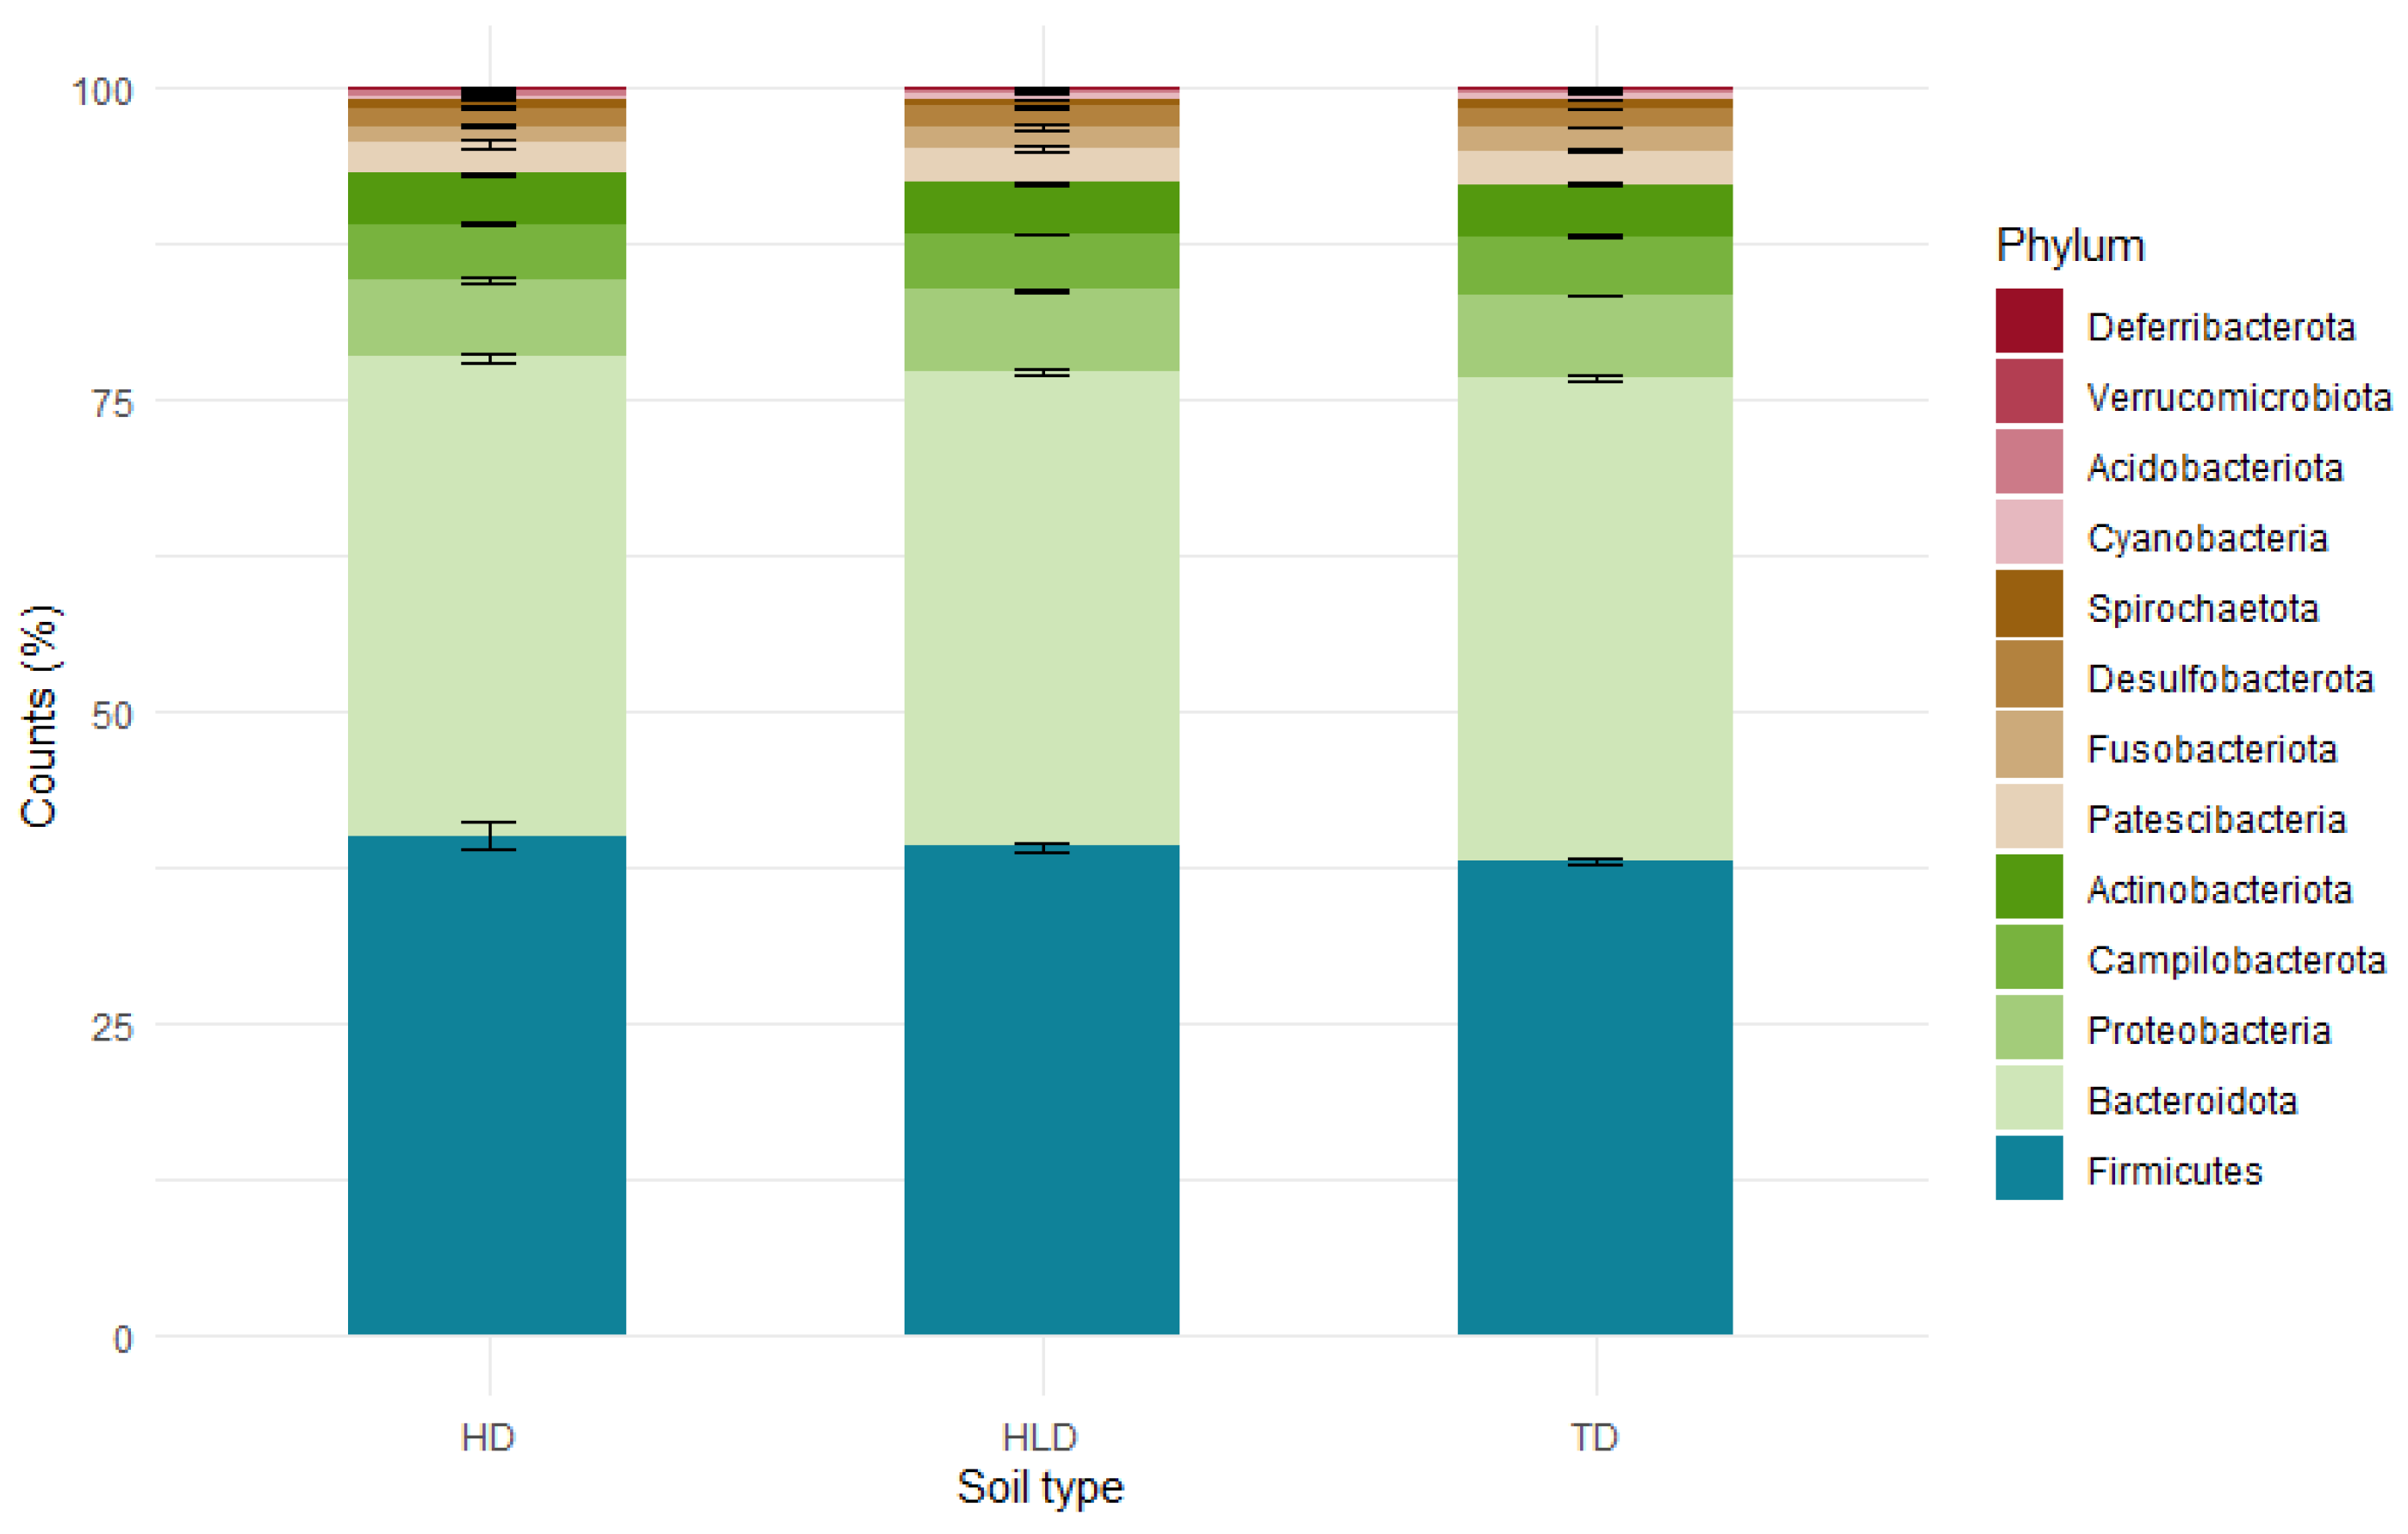
3.6. Functional and Genetic Biodiversity of Organo-Mineral Horizons
4. Discussion
4.1. Chemical and Biochemical Features of the Investigated Soils
4.2. Soil Organic Matter Turnover
4.3. Genetic and Ecophysiological Biodiversity of the A Horizons
5. Conclusions
Supplementary Materials
Author Contributions
Funding
Data Availability Statement
Conflicts of Interest
References
- Ibáñez, J.-J.; Sánchez-Díaz, J.; Rodríguez-Rodríguez, A.; Effland, W.R. Preservation of European soils: Natural and cultural heritage. Adv. Geoecol. 2008, 39, 37–59. [Google Scholar]
- Food and Agriculture Organization (FAO). Status World’s Soil Resouces: Main Report; Intergovernmental Technical Panel on Soils (ITPS); Food and Agriculture Organization: Rome, Italy, 2015; 608p. [Google Scholar]
- Costantini, E.A.C.; Mocali, S. Soil health, soil genetic horizons and biodiversity. J. Plant Nutr. Soil Sci. 2022, 185, 24–34. [Google Scholar] [CrossRef]
- Ibáñez, J.J.; Feoli, E. Global Relationships of Pedodiversity and Biodiversity. Vadose Zone J. 2013, 12, vzj2012-0186. [Google Scholar] [CrossRef]
- Fajardo, M.P.; McBratney, A.B.; Minasny, B. Measuring functional pedodiversity using spectroscopic information. Catena 2017, 152, 103–114. [Google Scholar] [CrossRef]
- Costantini, E.A.C.; Lorenzetti, R. Soil degradation processes in the Italian agricultural and forest ecosystems. Ital. J. Agron. 2013, 8, 233–243. [Google Scholar] [CrossRef]
- Lo Papa, G.; Palermo, V.; Dazzi, C. Is land-use change a cause of loss of pedodiversity? The case of the Mazzarrone study area, Sicily. Geomorphology 2011, 135, 332–342. [Google Scholar] [CrossRef]
- Vittori Antisari, L.; Trenti, W.; Buscaroli, A.; Falsone, G.; Vianello, G.; De Feudis, M. Pedodiversity and Organic Matter Stock of Soils Developed on Sandstone Formations in the Northern Apennines (Italy). Land 2023, 12, 79. [Google Scholar] [CrossRef]
- Abakumov, E. Pedodiversity of Subboreal Ecosystems under Contrasting Geogenic Factors (Case Study of Samarskaya Luka, Middle Volga Region, Russia). Geosciences 2022, 12, 443. [Google Scholar] [CrossRef]
- Vacek, O.; Vašát, R.; Borůvka, L. Quantifying the pedodiversity-elevation relations. Geoderma 2020, 373, 114441. [Google Scholar] [CrossRef]
- D’Amico, M.E.; Pintaldi, E.; Sapino, E.; Colombo, N.; Quaglino, E.; Stanchi, S.; Navillod, E.; Rocco, R.; Freppaz, M. Soil types of Aosta Valley (NW-Italy). J. Maps 2020, 16, 755–765. [Google Scholar] [CrossRef]
- Sorokin, A.; Owens, P.; Láng, V.; Jiang, Z.D.; Michéli, E.; Krasilnikov, P. “Black soils” in the Russian Soil Classification system, the US Soil Taxonomy and the WRB: Quantitative correlation and implications for pedodiversity assessment. Catena 2021, 196, 104824. [Google Scholar] [CrossRef]
- Krasilnikov, P.V.; Gerasimova, M.I.; Golovanov, D.L.; Konyushkova, M.V.; Sidorova, V.A.; Sorokin, A.S. Pedodiversity and Its Significance in the Context of Modern Soil Geography. Eurasian Soil Sci. 2018, 51, 1–13. [Google Scholar] [CrossRef]
- Wagg, C.; Bender, S.F.; Widmer, F.; Van Der Heijden, M.G.A. Soil biodiversity and soil community composition determine ecosystem multifunctionality. Proc. Natl. Acad. Sci. USA 2014, 111, 5266–5270. [Google Scholar] [CrossRef] [PubMed]
- El Mujtar, V.; Muñoz, N.; Mc Cormick, B.P.; Pulleman, M.; Tittonell, P. Role and management of soil biodiversity for food security and nutrition; where do we stand? Glob. Food Sec. 2019, 20, 132–144. [Google Scholar] [CrossRef]
- Breure, A.M. Soil biodiversity: Measurements, Indicators, Threats and soil functions. In Proceedings of the International Conference Soil and Compost Eco-Biology, León, Spain, 15–17 September 2004; pp. 83–96. [Google Scholar]
- Bünemann, E.K.; Bongiorno, G.; Bai, Z.; Creamer, R.E.; De Deyn, G.; de Goede, R.; Fleskens, L.; Geissen, V.; Kuyper, T.W.; Mäder, P.; et al. Soil quality—A critical review. Soil Biol. Biochem. 2018, 120, 105–125. [Google Scholar] [CrossRef]
- Drobnik, T.; Greiner, L.; Keller, A.; Grêt-Regamey, A. Soil quality indicators—From soil functions to ecosystem services. Ecol. Indic. 2018, 94, 151–169. [Google Scholar] [CrossRef]
- Hoffland, E.; Kuyper, T.W.; Comans, R.N.J.; Creamer, R.E. Eco-functionality of organic matter in soils. Plant Soil 2020, 455, 1–22. [Google Scholar] [CrossRef]
- Lorenz, K.; Lal, R.; Ehlers, K. Soil organic carbon stock as an indicator for monitoring land and soil degradation in relation to United Nations’ Sustainable Development Goals. Land Degrad. Dev. 2019, 30, 824–838. [Google Scholar] [CrossRef]
- Bongiorno, G.; Bünemann, E.K.; Oguejiofor, C.U.; Meier, J.; Gort, G.; Comans, R.; Mäder, P.; Brussaard, L.; de Goede, R. Sensitivity of labile carbon fractions to tillage and organic matter management and their potential as comprehensive soil quality indicators across pedoclimatic conditions in Europe. Ecol. Indic. 2019, 99, 38–50. [Google Scholar] [CrossRef]
- Jensen, J.L.; Schjønning, P.; Watts, C.W.; Christensen, B.T.; Peltre, C.; Munkholm, L.J. Relating soil C and organic matter fractions to soil structural stability. Geoderma 2019, 337, 834–843. [Google Scholar] [CrossRef]
- Lavallee, J.M.; Soong, J.L.; Cotrufo, M.F. Conceptualizing soil organic matter into particulate and mineral-associated forms to address global change in the 21st century. Glob. Chang. Biol. 2020, 26, 261–273. [Google Scholar] [CrossRef]
- Islam, M.R.; Singh, B.; Dijkstra, F.A. Stabilisation of soil organic matter: Interactions between clay and microbes. Biogeochemistry 2022, 160, 145–158. [Google Scholar] [CrossRef]
- Kallenbach, C.M.; Frey, S.D.; Grandy, A.S. Direct evidence for microbial-derived soil organic matter formation and its ecophysiological controls. Nat. Commun. 2016, 7, 13630. [Google Scholar] [CrossRef]
- Liang, C.; Amelung, W.; Lehmann, J.; Kästner, M. Quantitative assessment of microbial necromass contribution to soil organic matter. Glob. Chang. Biol. 2019, 25, 3578–3590. [Google Scholar] [CrossRef]
- Antisari, L.V.; Trenti, W.; De Feudis, M.; Bianchini, G.; Falsone, G. Soil quality and organic matter pools in a temperate climate (Northern italy) under different land uses. Agronomy 2021, 11, 1815. [Google Scholar] [CrossRef]
- Mocali, S.; Paffetti, D.; Emiliani, G.; Benedetti, A.; Fani, R. Diversity of heterotrophic aerobic cultivable microbial communities of soils treated with fumigants and dynamics of metabolic, microbial, and mineralization quotients. Biol. Fertil. Soils 2008, 44, 557–569. [Google Scholar] [CrossRef]
- Dilly, O.; Bartsch, S.; Rosenbrock, P.; Buscot, F.; Munch, J.C. Shifts in physiological capabilities of the microbiota during the decomposition of leaf litter in a black alder (Alnus glutinosa (Gaertn.) L.) forest. Soil Biol. Biochem. 2001, 33, 921–930. [Google Scholar] [CrossRef]
- Dilly, O. Microbial Energetics in Soils. In Microorganisms in Soils: Roles in Genesis and Functions; Springer: Berlin/Heidelberg, Germany, 2005; pp. 123–138. [Google Scholar]
- Wall, D.H.; Bardgett, R.D.; Kelly, E. Biodiversity in the dark. Nat. Geosci. 2010, 3, 297–298. [Google Scholar] [CrossRef]
- Fierer, N. Embracing the unknown: Disentangling the complexities of the soil microbiome. Nat. Rev. Microbiol. 2017, 15, 579–590. [Google Scholar] [CrossRef] [PubMed]
- Antwis, R.E.; Griffiths, S.M.; Harrison, X.A.; Aranega-Bou, P.; Arce, A.; Bettridge, A.S.; Brailsford, F.L.; de Menezes, A.; Devaynes, A.; Forbes, K.M.; et al. Fifty important research questions in microbial ecology. FEMS Microbiol. Ecol. 2017, 93, fix044. [Google Scholar] [CrossRef] [PubMed]
- Graham, E.B.; Knelman, J.E.; Schindlbacher, A.; Siciliano, S.; Breulmann, M.; Yannarell, A.; Beman, J.M.; Abell, G.; Philippot, L.; Prosser, J.; et al. Microbes as engines of ecosystem function: When does community structure enhance predictions of ecosystem processes? Front. Microbiol. 2016, 7, 214. [Google Scholar] [CrossRef]
- Fierer, N.; Wood, S.A.; de Mesquita, C.P.B. How microbes can, and cannot, be used to assess soil health. Soil Biol. Biochem. 2021, 153, 108111. [Google Scholar] [CrossRef]
- Antonioli, N.; Cazzola, M. Geologia e geomorfologia. In Parco Regionale Alto Appennino Modenese; Gruppo Editoriale Giunti: Firenze, Italy, 1998; pp. 41–49. [Google Scholar]
- Schoeneberger, P.J.; Wysocki, D.A.; Benham, E.C.; Soil Survey Staff. Field Book for Describing and Sampling Soils, Version 3.0; National Soil Survey Center, Natural Resources Conservation Service: Lincoln, NE, USA, 2012.
- Gee, G.W.; Bauder, J.W. Methods of Soil Analysis: Part 1—Physical and Mineralogical Methods; SSSA Book Series; Soil Science Society of America, American Society of Agronomy: Madison, WI, USA, 1986; ISBN 978-0-89118-864-3. [Google Scholar]
- Ferronato, C.; Vianello, G.; De Feudis, M.; Vittori Antisari, L. Technosols development in an abandoned mining area and environmental risk assessment. Appl. Sci. 2021, 11, 6982. [Google Scholar] [CrossRef]
- Agnelli, A.; Bol, R.; Trumbore, S.E.; Dixon, L.; Cocco, S.; Corti, G. Carbon and nitrogen in soil and vine roots in harrowed and grass-covered vineyards. Agric. Ecosyst. Environ. 2014, 193, 70–82. [Google Scholar] [CrossRef]
- Antisari, L.V.; Falsone, G.; Carbone, S.; Marinari, S.; Vianello, G. Douglas-fir reforestation in North Apennine (Italy): Performance on soil carbon sequestration, nutrients stock and microbial activity. Appl. Soil Ecol. 2015, 86, 82–90. [Google Scholar] [CrossRef]
- Brookes, P.C.; Landman, A.; Pruden, G.; Jenkinson, D.S. Chloroform fumigation and the release of soil nitrogen: A rapid direct extraction method to measure microbial biomass nitrogen in soil. Soil Biol. Biochem. 1985, 17, 837–842. [Google Scholar] [CrossRef]
- Vance, E.D.; Brookes, P.C.; Jenkinson, D.S. An extraction method for measuring soil microbial biomass C. Soil Biol. Biochem. 1987, 19, 703–707. [Google Scholar] [CrossRef]
- Chantigny, M.; Angers, D.; Kaiser, K.; Kalbitz, K. Extraction and Characterization of Dissolved Organic Matter. In Soil Sampling and Methods of Analysis, 2nd ed.; Carter, M.R., Gregorich, E.G., Eds.; CRC Press Taylor & Francis: Boca Raton, FL, USA, 2007. [Google Scholar]
- Anderson, T.H.; Domsch, K.H. Ratios of microbial biomass carbon to total organic carbon in arable soils. Soil Biol. Biochem. 1989, 21, 471–479. [Google Scholar] [CrossRef]
- García-López, J.D.; Barbieri, F.; Baños, A.; Madero, J.M.G.; Gardini, F.; Montanari, C.; Tabanelli, G. Use of two autochthonous bacteriocinogenic strains as starter cultures in the production of salchichónes, a type of Spanish fermented sausages. Curr. Res. Food Sci. 2023, 7, 100615. [Google Scholar] [CrossRef]
- Gardes, M.; Bruns, T.D. ITS primers with enhanced specificity for basidiomycetes—Application to the identification of mycorrhizae and rusts. Mol. Ecol. 1993, 2, 113–118. [Google Scholar] [CrossRef]
- White, T.J.; Bruns, T.; Lee, S.; Taylor, J. Amplification and Direct Sequencing of Fungal Ribosomal Rna Genes for Phylogenetics. PCR Protoc. 1990, 315–322. [Google Scholar] [CrossRef]
- Callahan, B.J.; McMurdie, P.J.; Rosen, M.J.; Han, A.W.; Johnson, A.J.A.; Holmes, S.P. DADA2: High-resolution sample inference from Illumina amplicon data. Nat. Methods 2016, 13, 581–583. [Google Scholar] [CrossRef]
- Acton, P.; Fox, J.; Campbell, E.; Rowe, H.; Wilkinson, M. Carbon isotopes for estimating soil decomposition and physical mixing in well-drained forest soils. J. Geophys. Res. Biogeosci. 2013, 118, 1532–1545. [Google Scholar] [CrossRef]
- Hobbie, E.A.; Ouimette, A.P. Controls of nitrogen isotope patterns in soil profiles. Biogeochemistry 2009, 95, 355–371. [Google Scholar] [CrossRef]
- Lorenz, M.; Derrien, D.; Zeller, B.; Udelhoven, T.; Werner, W.; Thiele-Bruhn, S. The linkage of 13C and 15N soil depth gradients with C:N and O:C stoichiometry reveals tree species effects on organic matter turnover in soil. Biogeochemistry 2020, 151, 203–220. [Google Scholar] [CrossRef]
- Põlme, S.; Abarenkov, K.; Henrik Nilsson, R.; Lindahl, B.D.; Clemmensen, K.E.; Kauserud, H.; Nguyen, N.; Kjøller, R.; Bates, S.T.; Baldrian, P.; et al. FungalTraits: A user-friendly traits database of fungi and fungus-like stramenopiles. Fungal Divers. 2020, 105, 1–16. [Google Scholar] [CrossRef]
- USDA-NRCS. Soil Survey Staff Keys to Soil Taxonomy, 13th ed.; Natural Resources Conservation Service: Washington, DC, USA, 2022.
- Merino, A.; Real, C.; Álvarez-González, J.G.; Rodríguez-Guitián, M.A. Forest structure and C stocks in natural Fagus sylvatica forest in southern Europe: The effects of past management. For. Ecol. Manag. 2007, 250, 206–214. [Google Scholar] [CrossRef]
- Conforti, M.; Longobucco, T.; Scarciglia, F.; Niceforo, G.; Matteucci, G.; Buttafuoco, G. Interplay between soil formation and geomorphic processes along a soil catena in a Mediterranean mountain landscape: An integrated pedological and geophysical approach. Environ. Earth Sci. 2020, 79, 59. [Google Scholar] [CrossRef]
- Fazlollahi Mohammadi, M.; Jalali, S.G.H.; Kooch, Y.; Said-Pullicino, D. Slope gradient and shape effects on soil profiles in the northern mountainous forests of Iran. Eurasian Soil Sci. 2016, 49, 1366–1374. [Google Scholar] [CrossRef]
- Łachacz, A.; Załuski, D. The usefulness of the Munsell colour indices for identification of drained soils with various content of organic matter. J. Soils Sediments 2023, 23, 4017–4031. [Google Scholar] [CrossRef]
- Ibáñez-Asensio, S.; Marqués-Mateu, A.; Moreno-Ramón, H.; Balasch, S. Statistical relationships between soil colour and soil attributes in semiarid areas. Biosyst. Eng. 2013, 116, 120–129. [Google Scholar] [CrossRef]
- Bruckman, V.J.; Yan, S.; Hochbichler, E.; Glatzel, G. Carbon pools and temporal dynamics along a rotation period in Quercus dominated high forest and coppice with standards stands. For. Ecol. Manag. 2011, 262, 1853–1862. [Google Scholar] [CrossRef]
- Camponi, L.; Cardelli, V.; Cocco, S.; Serrani, D.; Salvucci, A.; Cutini, A.; Agnelli, A.; Fabbio, G.; Bertini, G.; Roggero, P.P.; et al. Effect of coppice conversion into high forest on soil organic C and nutrients stock in a Turkey oak (Quercus cerris L.) forest in Italy. J. Environ. Manag. 2022, 312, 114935. [Google Scholar] [CrossRef]
- Córdova, S.C.; Olk, D.C.; Dietzel, R.N.; Mueller, K.E.; Archontouilis, S.V.; Castellano, M.J. Plant litter quality affects the accumulation rate, composition, and stability of mineral-associated soil organic matter. Soil Biol. Biochem. 2018, 125, 115–124. [Google Scholar] [CrossRef]
- Singh, P.; Ghosh, A.K.; Kumar, S.; Kumar, M.; Sinha, P.K. Influence of input litter quality and quantity on carbon storage in post-mining forest soil after 14 years of reclamation. Ecol. Eng. 2022, 178, 106575. [Google Scholar] [CrossRef]
- Bonifacio, E.; Falsone, G.; Catoni, M. Influence of serpentine abundance on the vertical distribution of available elements in soils. Plant Soil 2013, 368, 493–506. [Google Scholar] [CrossRef]
- Stewart, C.E.; Neff, J.C.; Amatangelo, K.L.; Vitousek, P.M. Vegetation Effects on Soil Organic Matter Chemistry of Aggregate Fractions in a Hawaiian Forest. Ecosystems 2011, 14, 382–397. [Google Scholar] [CrossRef]
- Kohl, L.; Philben, M.; Edwards, K.A.; Podrebarac, F.A.; Warren, J.; Ziegler, S.E. The origin of soil organic matter controls its composition and bioreactivity across a mesic boreal forest latitudinal gradient. Glob. Chang. Biol. 2018, 24, e458–e473. [Google Scholar] [CrossRef] [PubMed]
- Berger, T.W.; Swoboda, S.; Prohaska, T.; Glatzel, G. The role of calcium uptake from deep soils for spruce (Picea abies) and beech (Fagus sylvatica). For. Ecol. Manag. 2006, 229, 234–246. [Google Scholar] [CrossRef]
- Błońska, E.; Klamerus-Iwan, A.; Lasota, J.; Gruba, P.; Pach, M.; Pretzsch, H. What Characteristics of Soil Fertility Can Improve in Mixed Stands of Scots Pine and European Beech Compared with Monospecific Stands? Commun. Soil Sci. Plant Anal. 2018, 49, 237–247. [Google Scholar] [CrossRef]
- Ammer, S.; Weber, K.; Abs, C.; Ammer, C.; Prietzel, J. Factors influencing the distribution and abundance of earthworm communities in pure and converted Scots pine stands. Appl. Soil Ecol. 2006, 33, 10–21. [Google Scholar] [CrossRef]
- Agnelli, A.; Ascher, J.; Corti, G.; Ceccherini, M.T.; Nannipieri, P.; Pietramellara, G. Distribution of microbial communities in a forest soil profile investigated by microbial biomass, soil respiration and DGGE of total and extracellular DNA. Soil Biol. Biochem. 2004, 36, 859–868. [Google Scholar] [CrossRef]
- Wallenstein, M.D.; McNulty, S.; Fernandez, I.J.; Boggs, J.; Schlesinger, W.H. Nitrogen fertilization decreases forest soil fungal and bacterial biomass in three long-term experiments. For. Ecol. Manag. 2006, 222, 459–468. [Google Scholar] [CrossRef]
- Mganga, K.Z.; Razavi, B.S.; Kuzyakov, Y. Land use affects soil biochemical properties in Mt. Kilimanjaro region. Catena 2016, 141, 22–29. [Google Scholar] [CrossRef]
- Hamzehpour, N.; Shafizadeh-Moghadam, H.; Valavi, R. Exploring the driving forces and digital mapping of soil organic carbon using remote sensing and soil texture. Catena 2019, 182, 104141. [Google Scholar] [CrossRef]
- Haddix, M.L.; Gregorich, E.G.; Helgason, B.L.; Janzen, H.; Ellert, B.H.; Francesca Cotrufo, M. Climate, carbon content, and soil texture control the independent formation and persistence of particulate and mineral-associated organic matter in soil. Geoderma 2020, 363, 114160. [Google Scholar] [CrossRef]
- Ahirwal, J.; Nath, A.; Brahma, B.; Deb, S.; Sahoo, U.K.; Nath, A.J. Patterns and driving factors of biomass carbon and soil organic carbon stock in the Indian Himalayan region. Sci. Total Environ. 2021, 770, 145292. [Google Scholar] [CrossRef] [PubMed]
- Grüneberg, E.; Ziche, D.; Wellbrock, N. Organic carbon stocks and sequestration rates of forest soils in Germany. Glob. Chang. Biol. 2014, 20, 2644–2662. [Google Scholar] [CrossRef] [PubMed]
- Zeller, B.; Dambrine, E. Coarse particulate organic matter is the primary source of mineral N in the topsoil of three beech forests. Soil Biol. Biochem. 2011, 43, 542–550. [Google Scholar] [CrossRef]
- Sen, D.O.U.; Jun, S.; Xiangyun, S.; Rui, C.A.O.; Meng, W.U.; Chenglin, L.I.; Song, G. Are humic substances soil microbial residues or unique synthesized compounds? A perspective on their distinctiveness. Pedosphere 2020, 30, 159–167. [Google Scholar]
- Traversa, A.; D’Orazio, V.; Mezzapesa, G.N.; Bonifacio, E.; Farrag, K.; Senesi, N.; Brunetti, G. Chemical and spectroscopic characteristics of humic acids and dissolved organic matter along two Alfisol profiles. Chemosphere 2014, 111, 184–194. [Google Scholar] [CrossRef]
- Traversa, A.; Said-Pullicino, D.; D’Orazio, V.; Gigliotti, G.; Senesi, N. Properties of humic acids in Mediterranean forest soils (Southern Italy): Influence of different plant covering. Eur. J. For. Res. 2011, 130, 1045–1054. [Google Scholar] [CrossRef]
- Senesi, N.; Miano, T.M.; Provenzano, M.R.; Brunetti, G. Spectroscopic and compositional comparative characterization of I.H.S.S. reference and standard fulvic and humic acids of various origin. Sci. Total Environ. 1989, 81–82, 143–156. [Google Scholar] [CrossRef]
- Zavarzina, A.G.; Danchenko, N.N.; Demin, V.V.; Artemyeva, Z.S.; Kogut, B.M. Humic Substances: Hypotheses and Reality (a Review). Eurasian Soil Sci. 2021, 54, 1826–1854. [Google Scholar] [CrossRef]
- Ukalska-Jaruga, A.; Bejger, R.; Debaene, G.; Smreczak, B. Characterization of soil organic matter individual fractions (Fulvic acids, humic acids, and humins) by spectroscopic and electrochemical techniques in agricultural soils. Agronomy 2021, 11, 1067. [Google Scholar] [CrossRef]
- Machado, W.; Franchini, J.C.; de Fátima Guimarães, M.; Filho, J.T. Spectroscopic characterization of humic and fulvic acids in soil aggregates, Brazil. Heliyon 2020, 6, e04078. [Google Scholar] [CrossRef] [PubMed]
- Reemtsma, T.; These, A.; Springer, A.; Linscheid, M. Fulvic acids as transition state of organic matter: Indications from high resolution mass spectrometry. Environ. Sci. Technol. 2006, 40, 5839–5845. [Google Scholar] [CrossRef] [PubMed]
- Hayes, M.H.B.; Mylotte, R.; Swift, R.S. Humin: Its Composition and Importance in Soil Organic Matter. Adv. Agron. 2017, 143, 47–138. [Google Scholar] [CrossRef]
- Berg, B.; McClaugherty, C. Plant Litter: Decomposition, Humus Formation, Carbon Sequestration; Springer: Berlin, Germany, 2014; Volume 51. [Google Scholar]
- Hobbie, S.E.; Hobbie, S.E.; Reich, P.B.; Oleksyn, J.; Oleksyn, J.; Ogdahl, M.; Ogdahl, M.; Zytkowiak, R.; Zytkowiak, R.; Hale, C.; et al. Tree species effects on decomposition and forest floor dynamics in a common garden. Ecology 2006, 87, 2288–2297. [Google Scholar] [CrossRef] [PubMed]
- Ramírez, P.B.; Fuentes-Alburquenque, S.; Díez, B.; Vargas, I.; Bonilla, C.A. Soil microbial community responses to labile organic carbon fractions in relation to soil type and land use along a climate gradient. Soil Biol. Biochem. 2020, 141, 107692. [Google Scholar] [CrossRef]
- Fanin, N.; Hättenschwiler, S.; Fromin, N. Litter fingerprint on microbial biomass, activity, and community structure in the underlying soil. Plant Soil 2014, 379, 79–91. [Google Scholar] [CrossRef]
- Kuramae, E.; Gamper, H.; Van Veen, J.; Kowalchuk, G. Soil and plant factors driving the community of soil-borne microorganisms across chronosequences of secondary succession of chalk grasslands with a neutral pH. FEMS Microbiol. Ecol. 2011, 77, 285–294. [Google Scholar] [CrossRef] [PubMed]
- Bulgarelli, D.; Schlaeppi, K.; Spaepen, S.; Van Themaat, E.V.L.; Schulze-Lefert, P. Structure and functions of the bacterial microbiota of plants. Annu. Rev. Plant Biol. 2013, 64, 807–838. [Google Scholar] [CrossRef] [PubMed]
- Larsbrink, J.; McKee, L.S. Bacteroidetes bacteria in the soil: Glycan acquisition, enzyme secretion, and gliding motility. Adv. Appl. Microbiol. 2020, 110, 63–98. [Google Scholar] [CrossRef] [PubMed]
- Ziolkowska, A.; Debska, B.; Banach-Szott, M. Transformations of phenolic compounds in meadow soils. Sci. Rep. 2020, 10, 19330. [Google Scholar] [CrossRef] [PubMed]
- Kuramae, E.E.; Yergeau, E.; Wong, L.C.; Pijl, A.S.; Van Veen, J.A.; Kowalchuk, G.A. Soil characteristics more strongly influence soil bacterial communities than land-use type. FEMS Microbiol. Ecol. 2012, 79, 12–24. [Google Scholar] [CrossRef] [PubMed]
- Ahmad, N.; Johri, S.; Abdin, M.Z.; Qazi, G.N. Molecular characterization of bacterial population in the forest soil of Kashmir, India. World J. Microbiol. Biotechnol. 2009, 25, 107–113. [Google Scholar] [CrossRef]
- Aislabie, J.; Jordan, S.; Ayton, J.; Klassen, J.L.; Barker, G.M.; Turner, S. Bacterial diversity associated with ornithogenic soil of the Ross Sea region, Antarctica. Can. J. Microbiol. 2009, 55, 21–36. [Google Scholar] [CrossRef] [PubMed]
- Štursová, M.; Žifčáková, L.; Leigh, M.B.; Burgess, R.; Baldrian, P. Cellulose utilization in forest litter and soil: Identification of bacterial and fungal decomposers. FEMS Microbiol. Ecol. 2012, 80, 735–746. [Google Scholar] [CrossRef]
- Ma, A.; Zhuang, X.; Wu, J.; Cui, M.; Lv, D.; Liu, C.; Zhuang, G. Ascomycota Members Dominate Fungal Communities during Straw Residue Decomposition in Arable Soil. PLoS ONE 2013, 8, e66146. [Google Scholar] [CrossRef]


| Profile | Xcoor | Ycoor | Elevation | Slope | Aspect | Soil Type |
|---|---|---|---|---|---|---|
| mE | mN | m a.s.l. | ° | |||
| TAS 1 | 641,818 | 4,889,485 | 1517 | 25 | E | Humic Dystrudept, coarse loamy over coarse loamy skeletal, frigid (HD) |
| TAS 2 | 641,876 | 4,889,540 | 1487 | 14 | E | Humic Dystrudept, coarse loamy over coarse loamy skeletal, frigid (HD) |
| PIA 1 | 618,341 | 4,898,077 | 1501 | 2 | NW | Typic Dystrudept, coarse loamy, skeletal, frigid (TD) |
| PIA 2 | 618,311 | 4,898,094 | 1484 | 31 | NW | Typic Dystrudept, coarse loamy, skeletal, frigid (TD) |
| PIA 3 | 618,558 | 4,898,111 | 1457 | 9 | N | Typic Dystrudept, coarse loamy, skeletal, frigid (TD) |
| PIA 4 | 618,491 | 4,898,090 | 1465 | 16 | NE | Typic Dystrudept, coarse loamy, skeletal, frigid (TD) |
| BAC 1 | 627,259 | 4,887,352 | 1602 | 8 | N | Humic Lithic Dystrudept, coarse loamy, skeletal (HLD) |
| BAC 2 | 627,165 | 4,887,374 | 1598 | 30 | NW | Humic Lithic Dystrudept, sandy over coarse loamy, skeletal (HLD) |
| BAC 6 | 627,358 | 4,887,628 | 1601 | 5 | W | Humic Dystrudept, coarse loamy, skeletal (HD) |
| BAC 7 | 627,298 | 4,887,626 | 1593 | 18 | W | Humic Lithic Dystrudept, coarse loamy, skeletal (HLD) |
| pH | N | OC | δ13C | δ15N | Al | Fe | Ca | Mg | P | S | OC:N | OC:P | |
|---|---|---|---|---|---|---|---|---|---|---|---|---|---|
| % | % | ‰ | ‰ | g kg−1 | g kg−1 | g kg−1 | g kg−1 | g kg−1 | g kg−1 | ||||
| Humic Dystrudept | |||||||||||||
| O | 4.0 c | 1.8 a | 37.9 | −27.66 de | −2.82 c | 7.5 c | 6.0 d | 3.9 ab | 1.5 d | 0.7 a | 1.2 a | 20.9 a | 512 a |
| (0.30) | (0.11) | (2.23) a | (0.60) | (1.30) | (1.22) | (0.97) | (0.12) | (0.09) | (0.10) | (1.21) | (0.44) | (103) | |
| A | 3.7 c | 0.6 a | 9.2 | −26.79 cd | 1.45 bc | 27.2 bc | 15.9 c | 1.1 c | 3.5 cd | 0.7 ab | 0.6 a | 18.5 ac | 185 ab |
| (0.02) | (0.30) | (3.45) a | (0.29) | (1.73) | (9.83) | (0.83) | (0.44) | (0.23) | (0.43) | (0.56) | (6.07) | (96) | |
| ENDO | 4.5 b | 0.2 b | 3.3 b | −25.57 a | 5.48 a | 37.9 a | 27.9 a | 0.7 d | 7.5 b | 0.6 ab | 0.2 bc | 15.8 c | 75 b |
| (0.24) | (0.07) | (0.97) | (0.27) | (0.51) | (5.79) | (0.07) | (0.76) | (0.54) | (0.25) | (0.26) | (4.24) | (59) | |
| p value | <0.05 | <0.05 | <0.05 | <0.05 | <0.05 | <0.05 | <0.05 | <0.05 | <0.05 | ns | <0.05 | <0.05 | <0.05 |
| Humic Lithic Dystrudept | |||||||||||||
| O | 4.3 bc | 1.2 a | 27.8 a | −28.13 e | −3.64 c | 6.4 c | 5.1 d | 7.5 a | 1.8 d | 0.6 ab | 0.8 a | 22.6 a | 475 a |
| (0.35) | (0.32) | (8.79) | (0.46) | (1.15) | (5.4) | (4.23) | (3.64) | (0.02) | (0.10) | (0.14) | (1.17) | (111) | |
| A | 4.4 bc | 0.5 | 9.4 a | −27.29 de | −1.56 c | 23.3 bc | 14.9 c | 3.9 ab | 4.4 cd | 0.4 ab | 0.4 ab | 18.9 ac | 228 ab |
| (0.11) | (0.05) a | (0.79) | (0.07) | (0.07) | (0.03) | (0.09) | (0.04) | (0.04) | (0.04) | (0.07) | (0.34) | (6) | |
| ENDO | 4.6 ab | 0.2 b | 3.7 b | −26.55 c | 3.60 b | 32.4 b | 23.6 b | 2.7 b | 7.1 b | 0.3 b | 0.2 cd | 20.5 a | 119 ab |
| (0.27) | (0.08) | (1.33) | (0.49) | (2.00) | (5.9) | (5.61) | (0.52) | (0.24) | (0.07) | (0.03) | (2.38) | (40) | |
| p value | <0.05 | <0.05 | <0.05 | <0.05 | <0.05 | <0.05 | <0.05 | <0.05 | <0.05 | ns | <0.05 | <0.05 | <0.05 |
| Typic Dystrudept | |||||||||||||
| O | 4.2 bc | 1.5 a | 36.2 a | −28.57 e | −3.89 c | 9.9 c | 8.0 d | 3.6 ab | 2.4 cd | 0.6 ab | 0.9 a | 23.5 a | 587 a |
| (0.53) | (0.23) | (6.41) | (0.72) | (0.92) | (0.40) | (1.22) | (0.69) | (0.21) | (0.06) | (0.11) | (0.72) | (60) | |
| A | 3.9 c | 0.4 a | 8.7 a | −27.25 de | −0.11 c | 28.2 bc | 17.4 c | 1.2 c | 5.7 bc | 0.5 ab | 0.5 ab | 20.4 ab | 175 ab |
| (0.11) | (0.18) | (2.76) | (0.42) | (0.72) | (1.45) | (0.73) | (0.57) | (0.32) | (0.36) | (0.16) | (5.07) | (99) | |
| ENDO | 4.7 a | 0.1 c | 2.1 c | −26.01 b | 5.43 a | 39.4 a | 25.3 b | 0.8 c | 10.2 a | 0.6 ab | 0.2 d | 16.6 bc | 59 b |
| (0.19) | (0.05) | (0.07) | (0.52) | (1.28) | (5.79) | (3.85) | (0.35) | (0.27) | (0.27) | (0.08) | (3.67) | (79) | |
| p value | <0.05 | <0.05 | <0.05 | <0.05 | <0.05 | <0.05 | <0.05 | <0.05 | <0.05 | ns | <0.05 | <0.05 | <0.05 |
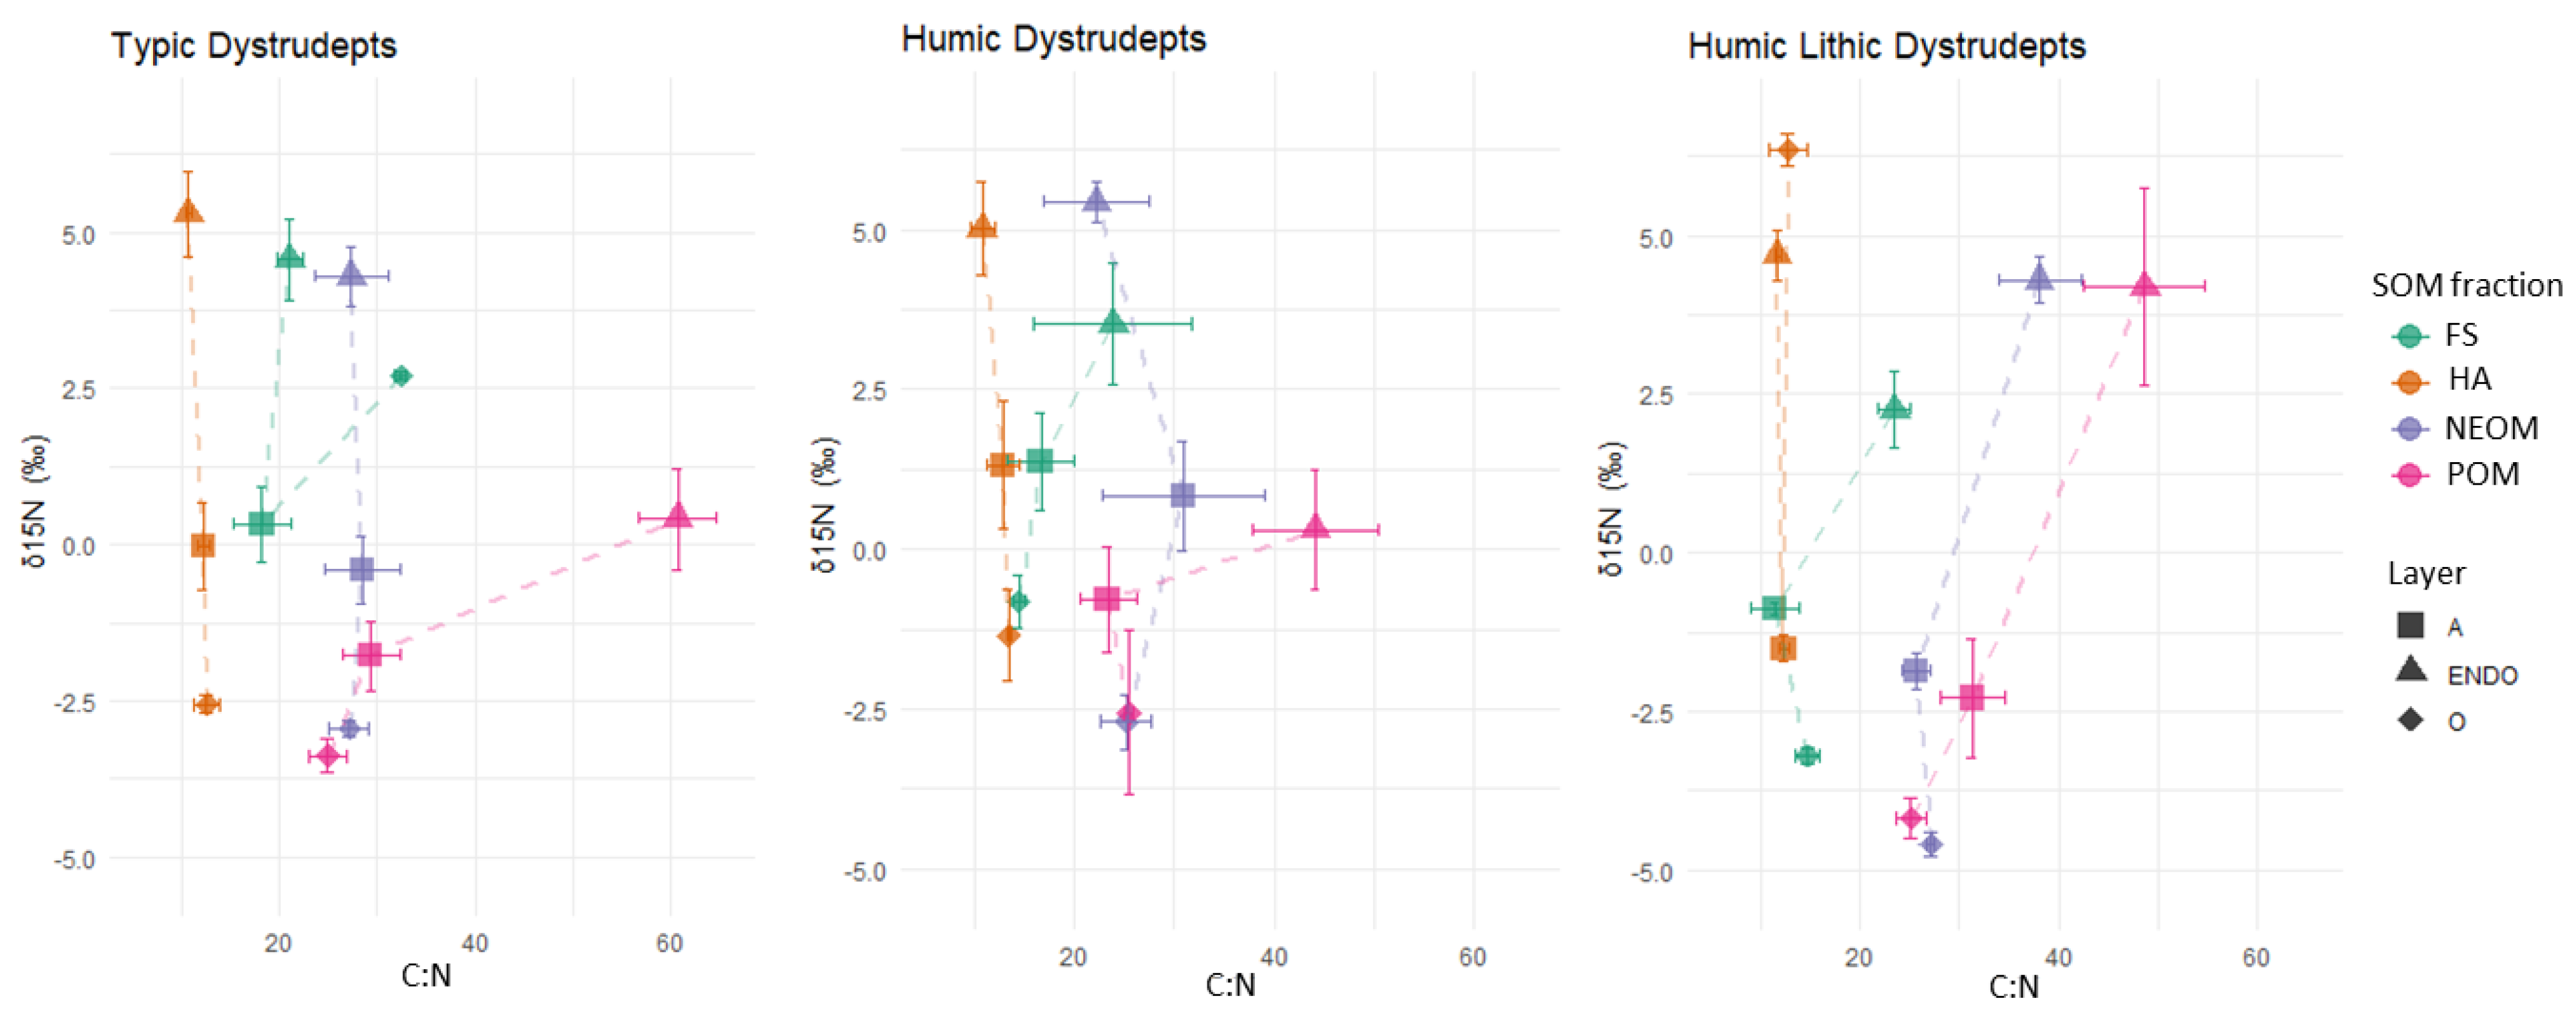
| HA | FS | NEOM | POM | |||||
|---|---|---|---|---|---|---|---|---|
| βδ13C | R2 | βδ13C | R2 | βδ13C | R2 | βδ13C | R2 | |
| Humic Dystrudepts | −1.11 | 1.00 | ns | ns | −0.61 | 0.87 | −0.17 | 0.98 |
| Humic Lithic Dystrudepts | −1.04 | 0.88 | −1.09 | 0.48 | ns | ns | 0.27 | 0.97 |
| Typic Dystrudepts | −1.41 | 0.64 | −1.38 | 0.98 | −0.63 | 0.98 | −0.09 | 0.80 |
| WEOC | WEN | Cmic | Nmic | Cmic:Nmic | qCO2 | qM | qMIC | Dilly’s Index | |
|---|---|---|---|---|---|---|---|---|---|
| mg kg−1 | mg kg−1 | mg kg−1 | mg kg−1 | µgC-CO2/µgCmic | % | % | |||
| Humic Dystrudept | |||||||||
| O | 1967 a | 337 a | 1570 a | 247 ab | 6.2 ab | 0.16 c | 2.7 a | 0.41 bc | 41 c |
| (362) | (110) | (243) | (87) | (1.62) | (0.30) | (0.01) | (0.03) | (2.1) | |
| A | 720 ab | 69 ab | 481 ab | 70 bd | 8.1 ab | 1.1 a | 2.3 ab | 0.60 ab | 117 bc |
| (314) | (25) | (10) | (26) | (4.34) | (0.05) | (0.01) | (0.11) | (4.5) | |
| ENDO | 500 b | 31 c | 350 bc | 37 d | 12.5 a | 0.47 b | 1.6 c | 0.98 a | 159 bc |
| (179) | (9) | (252) | (33) | (7.38) | (0.02) | (0.01) | (0.12) | (5.7) | |
| p value | <0.05 | <0.05 | <0.05 | <0.05 | <0.05 | <0.05 | <0.05 | <0.05 | <0.05 |
| Humic Lithic Dystrudept | |||||||||
| O | 1440 a | 177 ab | 843 ab | 158 ab | 5.4 ac | 0.33 c | 3.2 a | 0.31 bc | 113 bc |
| (403) | (81) | (560) | (81) | (1.19) | (0.15) | (1.15) | (0.15) | (6.4) | |
| A | 657 ab | 63 ab | 300 bd | 95 ac | 3.2 bc | 1.95 a | 2.6 a | 0.35 bc | 213 ab |
| (162) | (22) | (92) | (31) | (0.11) | (0.01) | (0.14) | (0.14) | (7.6) | |
| ENDO | 460 b | 28 c | 162 de | 44 cd | 6.9 bc | 1.11 ab | 1.6 bc | 0.43 bc | 303 ab |
| (141) | (11) | (67) | (22) | (0.76) | (0.07) | (0.54) | (0.54) | (16.3) | |
| p value | <0.05 | <0.05 | <0.05 | <0.05 | <0.05 | <0.05 | <0.05 | <0.05 | <0.05 |
| Typic Dystrudept | |||||||||
| O | 1770 a | 153 ab | 523 ab | 310 a | 1.7 c | 1.01 ab | 2.9 a | 0.16 c | 167 ac |
| (20) | (25) | (125) | (30) | (0.87) | (0.35) | (1.21) | (0.03) | (34.1) | |
| A | 696.3 ab | 54 b | 297 cd | 83 bc | 3.7 bc | 3.05 a | 2.6 a | 0.35 bc | 344 ab |
| (211) | (13) | (87) | (46) | (2.11) | (0.21) | (0.67) | (0.04) | (67.2) | |
| ENDO | 336 c | 18 d | 118 e | 12 e | 14.4 a | 0.57 b | 1.8 bc | 0.58 b | 589 a |
| (183) | (10) | (74) | (11) | (11.01) | (0.08) | (0.34) | (0.01) | (111,1) | |
| p value | <0.05 | <0.05 | <0.05 | <0.05 | <0.05 | <0.05 | <0.05 | <0.05 | <0.05 |
Disclaimer/Publisher’s Note: The statements, opinions and data contained in all publications are solely those of the individual author(s) and contributor(s) and not of MDPI and/or the editor(s). MDPI and/or the editor(s) disclaim responsibility for any injury to people or property resulting from any ideas, methods, instructions or products referred to in the content. |
© 2024 by the authors. Licensee MDPI, Basel, Switzerland. This article is an open access article distributed under the terms and conditions of the Creative Commons Attribution (CC BY) license (https://creativecommons.org/licenses/by/4.0/).
Share and Cite
Vittori Antisari, L.; De Feudis, M.; Trenti, W.; Falsone, G.; Puliga, F.; Zambonelli, A.; Tabanelli, G.; Gardini, F. Pedodiversity and Organic Matter Dynamics in the North Apennines (Italy): Relationships among Soil Types, Biodiversity, and Ecological Functionality. Forests 2024, 15, 353. https://doi.org/10.3390/f15020353
Vittori Antisari L, De Feudis M, Trenti W, Falsone G, Puliga F, Zambonelli A, Tabanelli G, Gardini F. Pedodiversity and Organic Matter Dynamics in the North Apennines (Italy): Relationships among Soil Types, Biodiversity, and Ecological Functionality. Forests. 2024; 15(2):353. https://doi.org/10.3390/f15020353
Chicago/Turabian StyleVittori Antisari, Livia, Mauro De Feudis, William Trenti, Gloria Falsone, Federico Puliga, Alessandra Zambonelli, Giulia Tabanelli, and Fausto Gardini. 2024. "Pedodiversity and Organic Matter Dynamics in the North Apennines (Italy): Relationships among Soil Types, Biodiversity, and Ecological Functionality" Forests 15, no. 2: 353. https://doi.org/10.3390/f15020353
APA StyleVittori Antisari, L., De Feudis, M., Trenti, W., Falsone, G., Puliga, F., Zambonelli, A., Tabanelli, G., & Gardini, F. (2024). Pedodiversity and Organic Matter Dynamics in the North Apennines (Italy): Relationships among Soil Types, Biodiversity, and Ecological Functionality. Forests, 15(2), 353. https://doi.org/10.3390/f15020353