Article

Development of a Tool for Navigating the Evidence concerning Land Managers and Woodland Creation in the United Kingdom

by
Gillian Petrokofsky
1,2,3,*,
Michael Dunn
4,
David Edwards
4,
William J. Harvey
1,5,
Gabriel E. Hemery
2,
Harry Marshall
4,
Stephen McConnachie
4,*,
Leo Petrokofsky
1,
Kevin Watts
6,7 and
Bianca Ambrose-Oji
8
1
Oxford Systematic Reviews LLP, Oxford OX2 7DL, UK
2
Sylva Foundation, Little Wittenham, Oxfordshire OX14 4RA, UK
3
Long-Term Ecology Laboratory, Department of Biology, University of Oxford, Oxford OX1 3SZ, UK
4
Forest Research, Northern Research Station, Roslin, Midlothian EH25 9SY, UK
5
School of Archaeology, University of Oxford, Oxford OX1 2PG, UK
6
Forest Research, Alice Holt Lodge, Farnham, Surrey GU10 4LH, UK
7
Biological and Environmental Sciences, University of Stirling, Stirling FK9 4LA, UK
8
Forest Research, 620 Coldharbour Lane, Bristol BS16 1EJ, UK
*
Authors to whom correspondence should be addressed.
Forests 2024, 15(2), 299; https://doi.org/10.3390/f15020299
Submission received: 15 December 2023 / Revised: 23 January 2024 / Accepted: 25 January 2024 / Published: 4 February 2024
(This article belongs to the Section Forest Economics, Policy, and Social Science)

Abstract

:
Woodland creation has become an important objective for a variety of stakeholders to help tackle the climate and biodiversity crises. One of the key evidence needs is a better understanding of the multiple factors influencing the willingness and ability of landowners and managers to establish new woodlands. To address this gap, a systematic map of evidence was prepared comprising publications from academic journals and grey literature accessed through bibliographic databases (Web of Science, Scopus, and CAB Abstracts), libraries, direct requests to relevant organisations and individuals, and citation tracking from past reviews. A screening process refined the evidence base to 226 studies within the UK. The systematic evidence map codes the content of each study against a comprehensive list comprising actors, drivers of or barriers to woodland creation, and outcomes. These are presented as a freely accessible, interactive online dashboard detailing sources of evidence. The systematic evidence map helps users navigate the evidence, demonstrating where the bulk of the evidence lies and, conversely, several evidence gaps where there is comparatively little evidence. The findings serve as a basis for dialogue with stakeholders to determine priorities for future primary research.

1. Introduction

There is a global drive to increase forest cover to help tackle the climate and biodiversity crises [1,2,3]. Sustainable Development Goals 13 (“Take urgent action to combat climate change and its impacts”) and 15 (“Protect, restore and promote sustainable use of terrestrial ecosystems, sustainably manage forests, combat desertification, and halt and reverse land degradation and halt biodiversity loss”), in particular, have gained wide acceptance as issues of high priority for forestry policy and research. As a result, many initiatives at global, national, and local scales are underway to promote and fund the creation of new forests, woodlands, and trees outside woodlands, whether urban, on farms, or in other landscapes [4]. This is especially true for countries with low forest cover and high forest creation targets, such as the United Kingdom, which has committed to plant 30,000 hectares of trees a year by 2025 in a bid to reach net zero by 2050 and help tackle the biodiversity crisis [5]. Just under 13,000 hectares of new woodland were created in the UK in 2022/23, mostly on private land. Sixty-three percent of the new planting took place in Scotland, 24% in England, 9% in Wales, and 3% in Northern Ireland. Annual woodland creation rates have ranged from 6000 to 14,000 hectares over the past ten years, and the rate of woodland creation in 2022/23 represents a decrease of 7% from the area created in 2021/22 [6]. The current rates of woodland creation across the UK are causing growing concerns that woodland creation targets in the UK will not be met [7]. As a consequence, policymakers and delivery bodies seeking to realise this aspiration are keen for a better understanding of the multiple factors that influence landowners’ and managers’ willingness and ability to create woodland.
A substantial body of research has been conducted on this topic over recent decades, including reviews by Lawrence & Dandy [8], Rose et al. [9], Staddon et al. [10], and Wentworth & Jordon [11] as well as research by Valatin et al. [12], and Lawrence et al. [13]. However, to date, this large body of knowledge has not been compiled systematically and presented in a format that is useful for policymakers and practitioners and that allows them to interact with the evidence base to explore and interrogate the evidence according to their particular context (regional, social, or other situation), or specific policy objective. Evidence maps and evidence heat maps have been developed to overcome the twin problems of (a) lack of synthesised knowledge and (b) lack of tools for readily accessing such knowledge in a way that can support decision-makers to know what evidence exists and where there are evidence gaps which may help define future research and policy initiatives [14]. These two problems have been a recurrent theme in many evidence reviews, which also highlight the associated problem of the wastefulness of ‘lost knowledge’ resulting in research being repeated often at public expense (Purgar et al. in ecology [15], and in health research [16]).
The need for rigour, objectivity, and transparency in drawing conclusions from a body of scientific information has been enshrined in many areas of policy and practice, including environmental issues, since the influential Modernising Government White Paper of 1999 [17]. Systematic evidence evaluations and synthesis methodologies emerged as useful tools for evidence-informed decision-making in environmental management [18] and have become a recognised standard for accessing, appraising, and synthesising scientific information.
The systematic evidence evaluation approach taken in the current review differed from other recent reviews because it (a) sought to include every available publication within the scope of the study, including peer-reviewed articles and grey literature, with no limit on publication date, and (b) systematically mapped the content of each publication against a comprehensive protocol of actors, factors, interventions, and outcomes to create a resource for others to access evidence needs across a range of contexts.
While the review is limited to the UK context (and the term ‘woodland’ is used to include what would be termed ‘forest’ in other countries), the technique for collecting and displaying the evidence is of high relevance to other countries with similar objectives of understanding drivers and barriers of forest creation initiatives.
The overall objectives of the current evidence review were as follows:
  • To create a tool that helps researchers and stakeholders navigate the evidence base and access the knowledge they need to address specific queries.
  • To gain a comprehensive overview of the evidence of the factors influencing landowners’ and managers’ willingness and ability to create woodland.
The decision was taken to undertake a systematic evidence map, rather than a systematic review, for the current topic because systematic mapping is designed to collate, describe, and catalogue all types of available evidence deemed relevant by stakeholders rather than answer a very specific ‘what works’ type of question [19].
The resultant systematic evidence map and associated data visualisation tool allow users to identify all the evidence available for a specific query. The tools allow users to answer queries such as
  • Do influencing factors vary within or between different types of landowners and managers?
  • What evidence gaps exist in our understanding of factors that influence willingness or ability among landowners and managers to create woodland?

2. Materials and Methods

2.1. Scope

We followed good practice guidance for the creation of systematic evidence maps, including guidance from the Collaboration for Environmental Evidence [20], 3iE [21], and the Campbell Collaboration [22]. We adapted the six stages of systematic mapping [19] to create a search-select-synthesis framework that defined the scope of the review as influenced by the needs of the evidence. Specifically, we sought to define the evidence base by (i) location, through restricting searches to studies conducted within the United Kingdom; (ii) population, restricting to the managers and owners of land used with the potential to consider and deliver woodland creation or tree planting (referred to as ‘actors’ in the discussion of results); (iii) phenomena of interest—specifically with reference to drivers and barriers of woodland creation and tree planting; and (iv) outcomes, both in terms of the establishment of woodlands or trees or the intention to do so. Figure 1 shows the steps of the methods used.

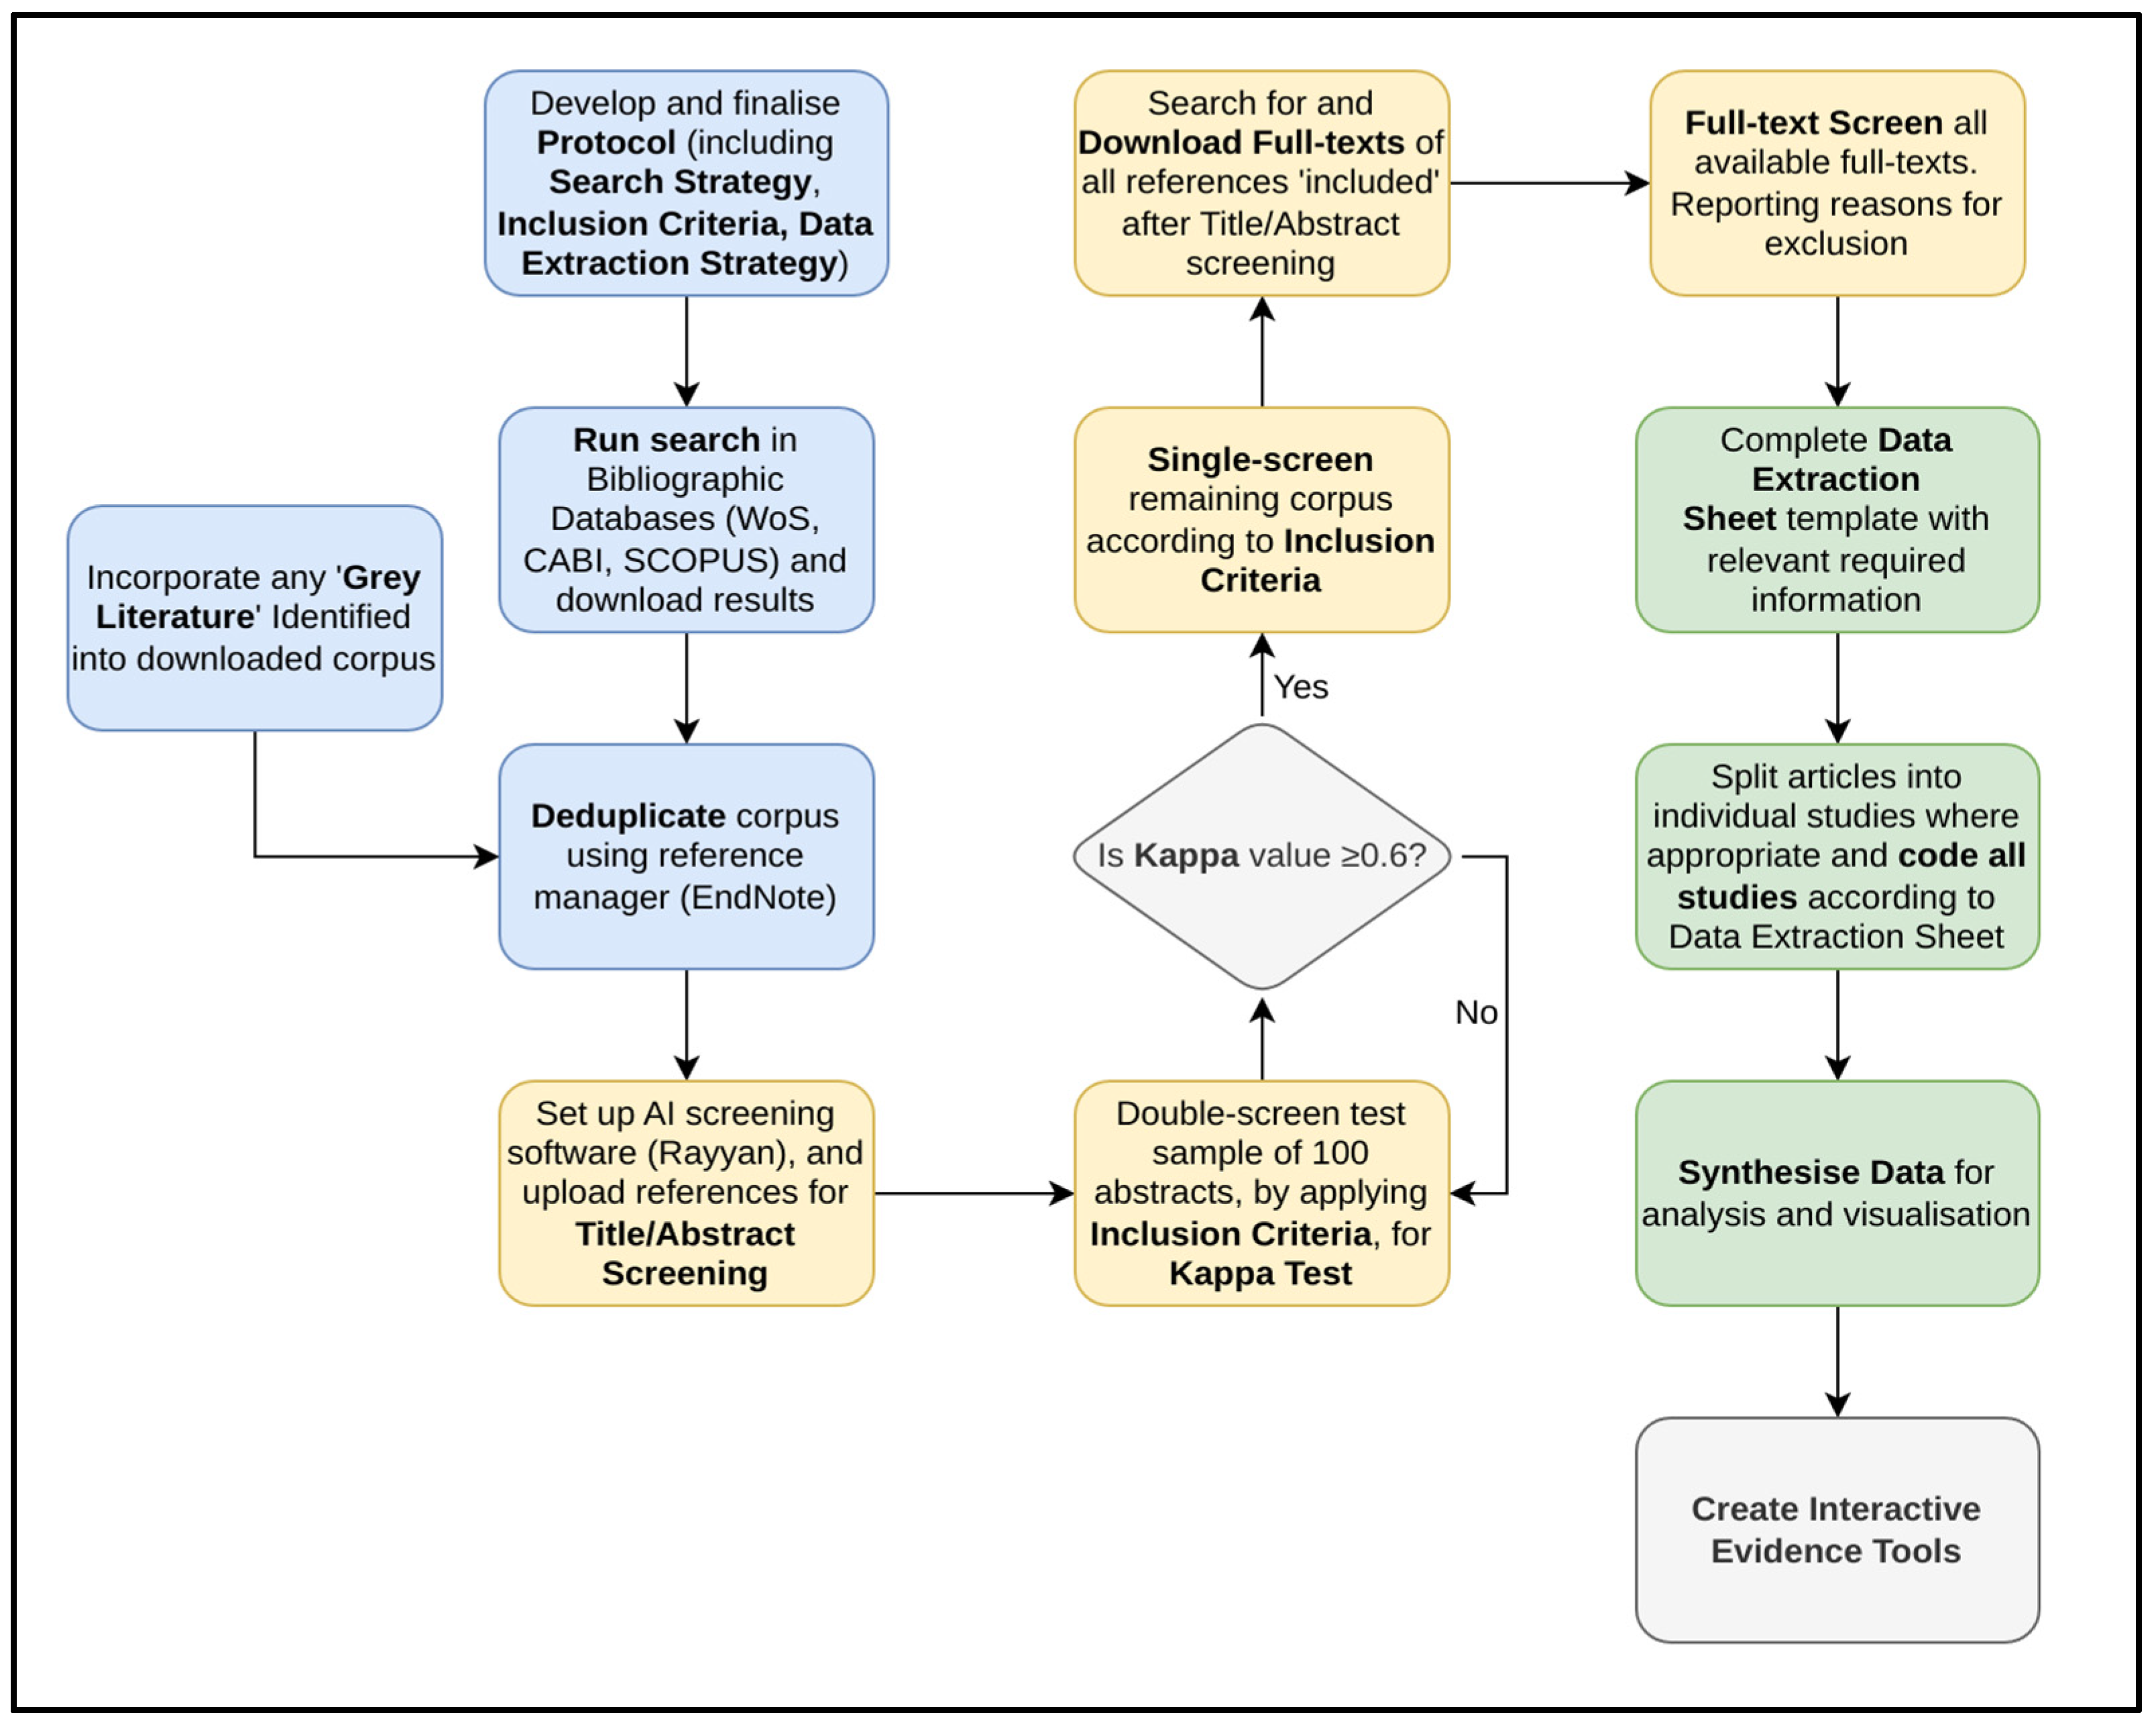
2.2. Search Strategy

The search itself involved a multi-faceted approach. Academic journal articles were targeted through bibliographic databases and aggregators, namely Web of Science, SCOPUS, and CAB Abstracts (on 20 January 2022). ‘Grey literature’ (e.g., books, conferences, institution reports, and government publications) were identified and collected in subsequent weeks through (i) searching websites of relevant organisations (Table S1), (ii) contacting those organisations directly, and (iii) ‘snowballing’ (also known as reference chaining, citation tracking, hand searching, which is the process of checking articles cited in known, relevant articles, and retrieving those articles [20]) from four relevant, extensive literature reviews [8,9,10,11]. Where cited articles were not readily available online or in Oxford’s Bodleian Library Forestry archive, the authors of the literature review were contacted for copies. A limited number of articles that could not be retrieved were coded from a secondary source and were identified as such to enable these to be filtered out by the systematic evidence map user if required (as unverified in the current review). In addition, the contents pages of conferences or books with separately authored chapters that were retrieved in the database searches, either as a whole publication or where an individual chapter was retrieved, were screened online or in situ if the publication was in print only (available to read in the Bodleian Library).

Search Terms

In a bid to ensure that all the literature pertaining to the topic was captured through the searches, an iterative approach was applied to create, validate, and optimise keywords and search terms. This involved discussions among the research team to arrive at an initial set of search terms for each of the aforementioned four scoping criteria (location, population, phenomena of interest, and outcomes). The terms were then formatted into a search string that combined search terms with Boolean operators (‘AND’/‘OR’), and its performance was tested by exploring the extent to which the string’s results would detect a pre-selected list of ten sources (composed of diverse study types spanning academic and grey literature). By examining a string’s coverage of the test sample and the underlying causes for any missed sources, it was possible to refine the search terms to an optimum combination of terms. In the case of journal article searches, the resultant search string comprised 90 terms. However, owing to the functional nature of the search engines on organisations’ websites, a simplified search string of 14 terms was used to search for grey literature. For websites where this string was still too complex, a modified version was used, focusing on ‘woodland creation’ or ‘farm woodland’ or ‘tree planting’ as the key concepts. All searches were conducted only in English. Supplementary Materials contains details of search terms and Boolean search strings (Tables S2 and S3).

2.3. Selection Strategy

Sourced articles were only retained for inclusion in the systematic evidence map if the content matched the scoping criteria: (i) landowners or managers who have considered or implemented woodland creation and/or extension of existing woodland within the UK and (ii) drivers and/or barriers to woodland creation, or intention to create. Records that presented only syntheses, reviews, remote sensing data, or models were also included. No limitations relating to language or date of article publication were used to exclude articles. Articles were excluded if they did not contain data of relevance to the scoping criteria. All individual studies identified were given separate unique identifiers. International articles that contained UK sites were included if the data for UK sites could be separately identified.
Duplicate articles found in more than one database were removed prior to screening in the reference management EndNote software (version 20). Following good practice guidance [20], screening was conducted in two stages. Firstly, using Rayyan software [23], titles and abstracts of all citations retrieved from the searches were screened by individual reviewers for eligibility according to inclusion criteria. Rayyan is a free natural-language processing tool that employs machine learning to screen articles for systematic evidence evaluation. Whenever doubt about inclusion arose, reviewers discussed the uncertainty in order to reach a common understanding of how the inclusion criteria were applied. Cohen’s kappa, which adjusts for the frequency with which reviewers may agree by chance, was used to quantify and evaluate reviewers’ agreement. A kappa value of 0.7 is commonly adopted as a threshold for adequate agreement [24,25]. In our case, a kappa value of 0.75 was established between reviewers on a test sample of 100 studies, signifying that the inclusion criteria were sufficiently clear to identify all the relevant papers in the searched databases. The second stage involved full-text screening of all articles that passed stage one. At full-text screening, consistency checking was applied to 10% of articles following common practice [26].

2.4. Synthesis Strategy

2.4.1. Data Coding and Extraction

A detailed coding sheet was devised to code the articles that met inclusion criteria at full-text screening and extract relevant information required to answer the review questions. The coded and extracted data included (i) article metadata, (ii) study location, (iii) land management and setting/contextual information, (iv) drivers and barriers to woodland creation, and (v) outcomes. Table 1 summarises the data coding and extraction fields in these five sections. Articles that reported more than one discrete study were divided into separately coded studies.

2.4.2. Data Dashboard

The coded data of all studies included in the systematic review was presented in a data dashboard. The dashboard was created using a number of packages in R programming language [27], including flexdashboard, htmlwidgets, and plotly, to visualise where there was an abundance or lack of published literature on a particular cross-section of the factors. Specifically, the focus was on studies that investigated the potential determinants of woodland creation across various land manager categories. The data visualisation approach used a jitter plot, with each data point symbolising an individual study within the dataset.

2.4.3. Limitations

Systematic reviews strive to reduce biases in the selection and synthesis of studies, but biases in reviewers’ interpretation of results can still occur. The primary objective of the current review is to assemble (map) the evidence that exists and make it available through an interactive tool, but not to attempt to over-interpret the evidence collected. Selection bias was greatly reduced by applying inclusion criteria that received wide agreement. The main limitations of the evidence review are biases inherent in the publishing process itself, and these are not limited to the field of forestry. The reliance on specific databases and predetermined keywords could have missed relevant studies not indexed or using different terminologies.

3. Results

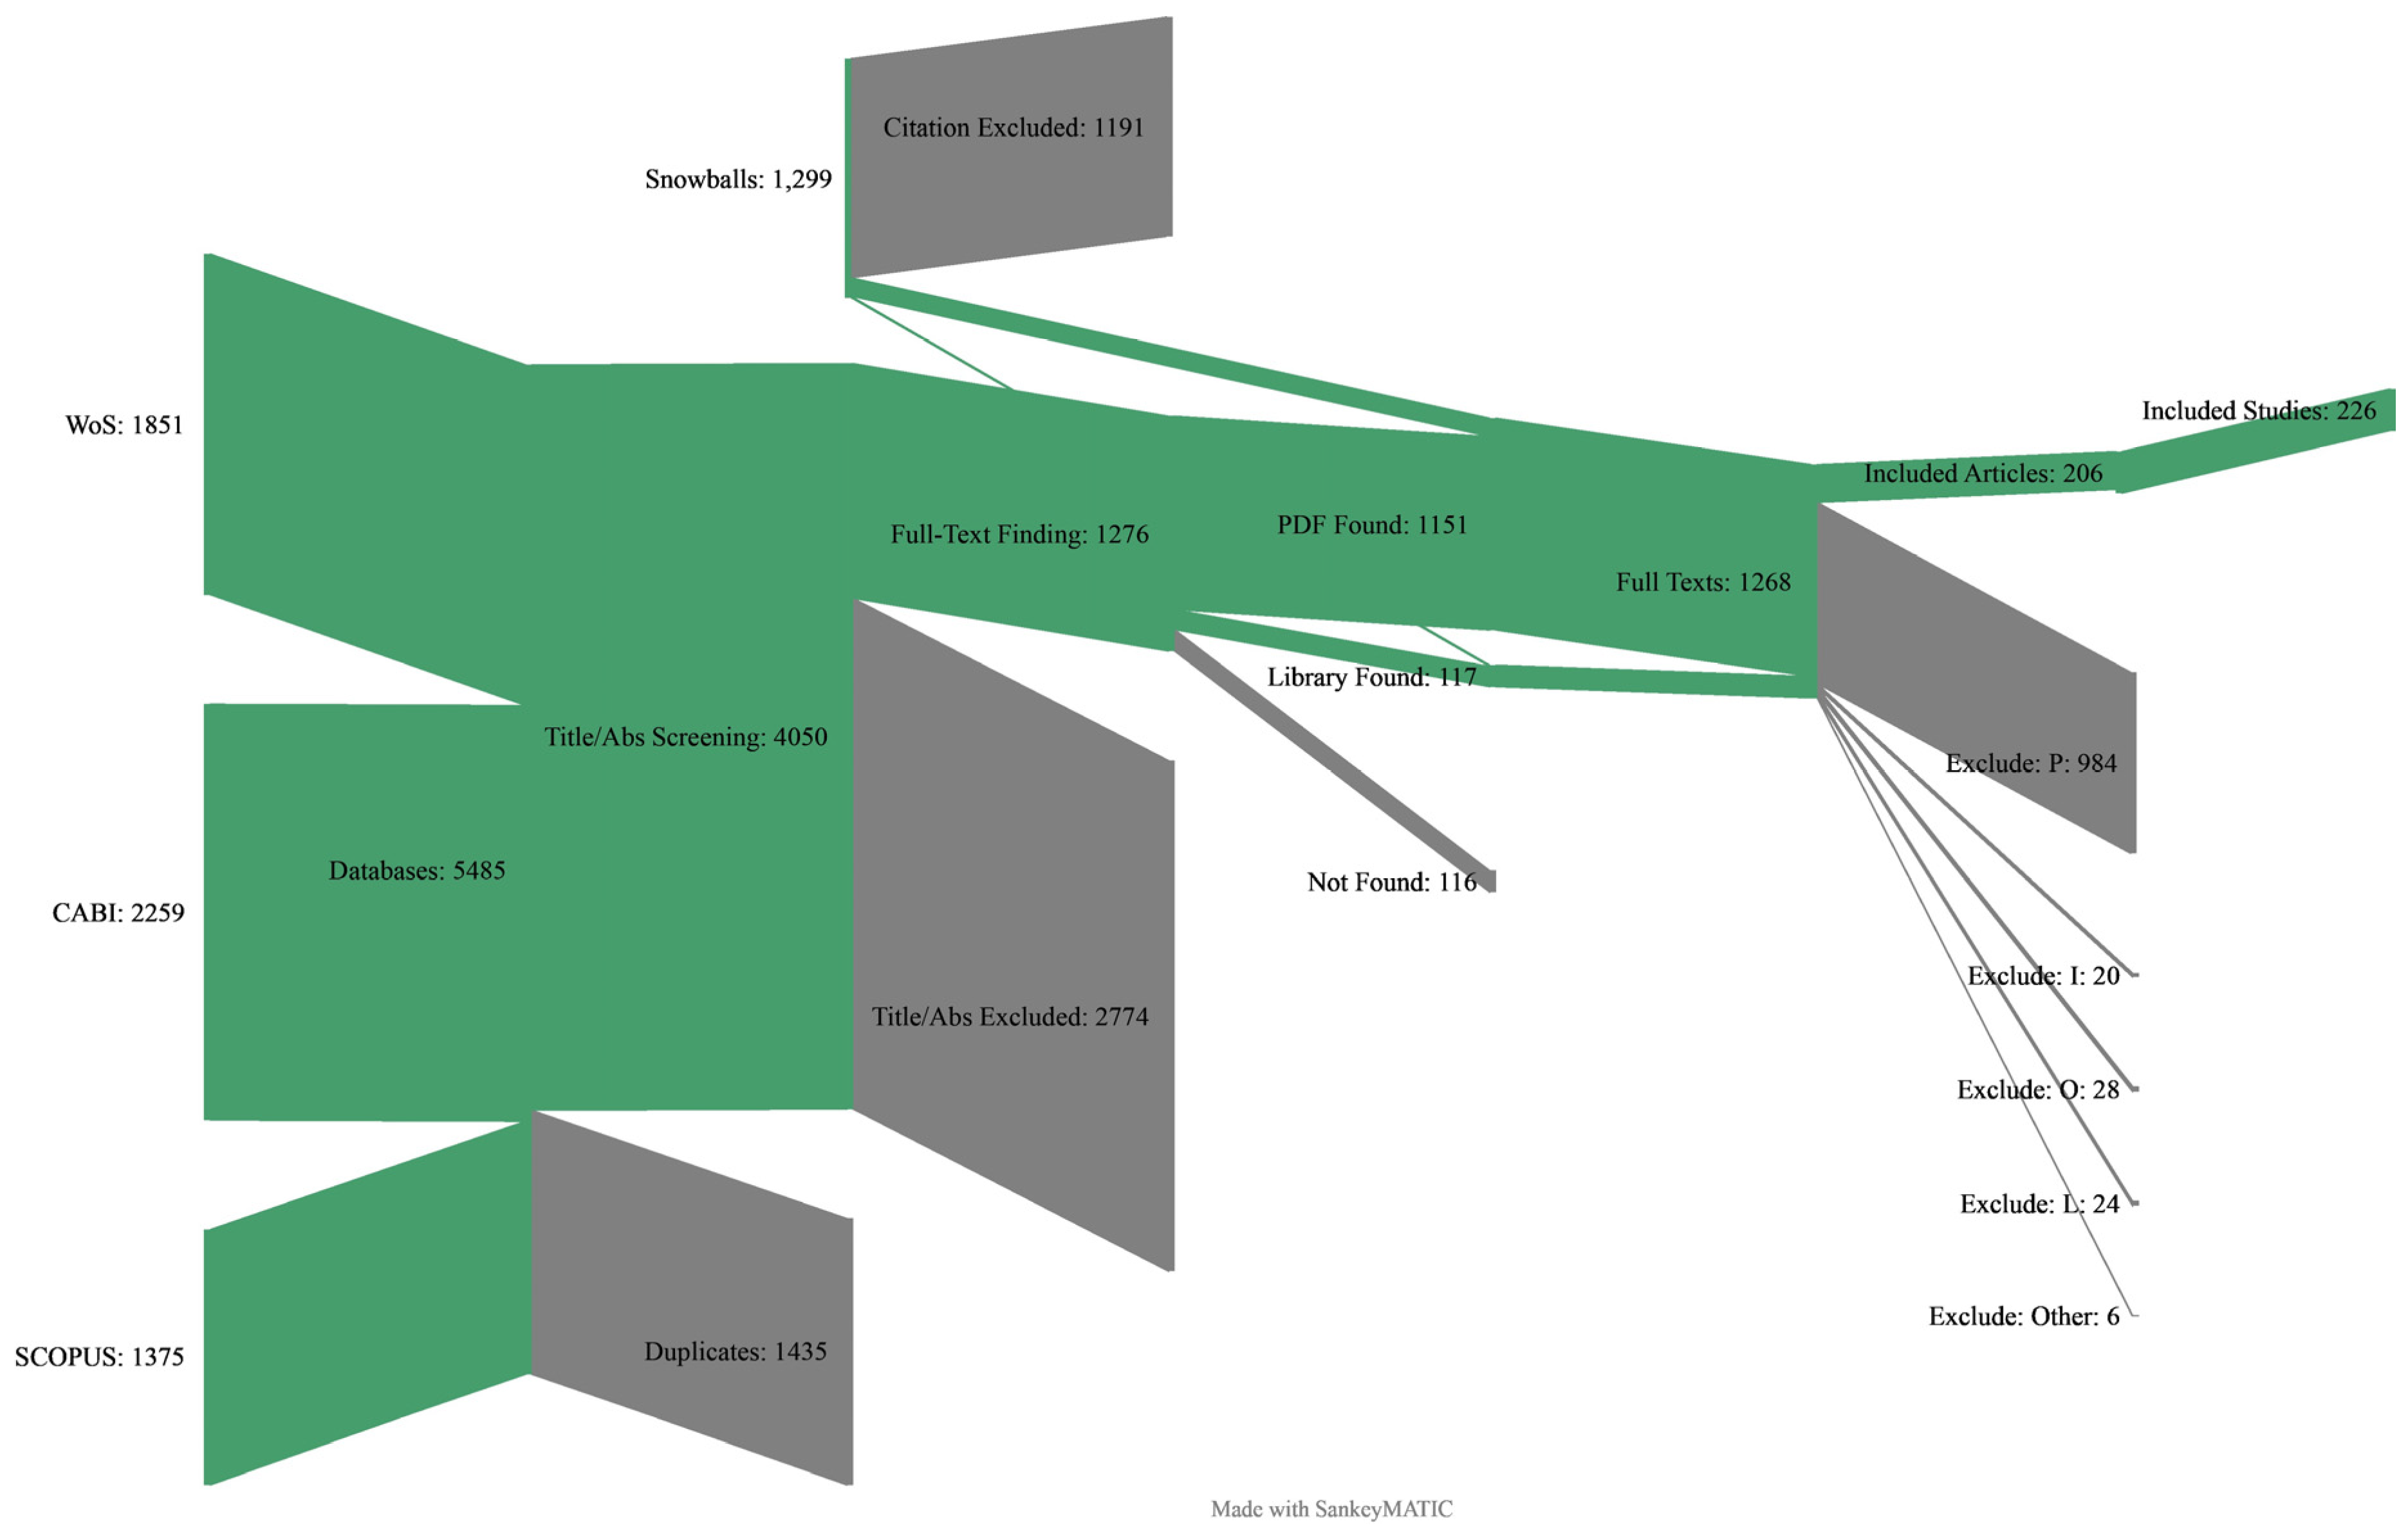
3.1. Selection of Literature

From an initial sum of 6784 articles retrieved from bibliographic databases and an extensive search in the archives of the Bodleian Library’s forestry collections, 206 articles were selected for the systematic evidence map, over half of which were journal articles (112). The remainder consisted of reports (60), conference papers (18), book chapters (6), theses (5), books (2), conference proceedings (2), and correspondence (1). The sourcing and exclusion of materials through the above method are illustrated in Figure 2. As a result of some articles containing more than one study, the total number of studies included (226) exceeded the number of sources.

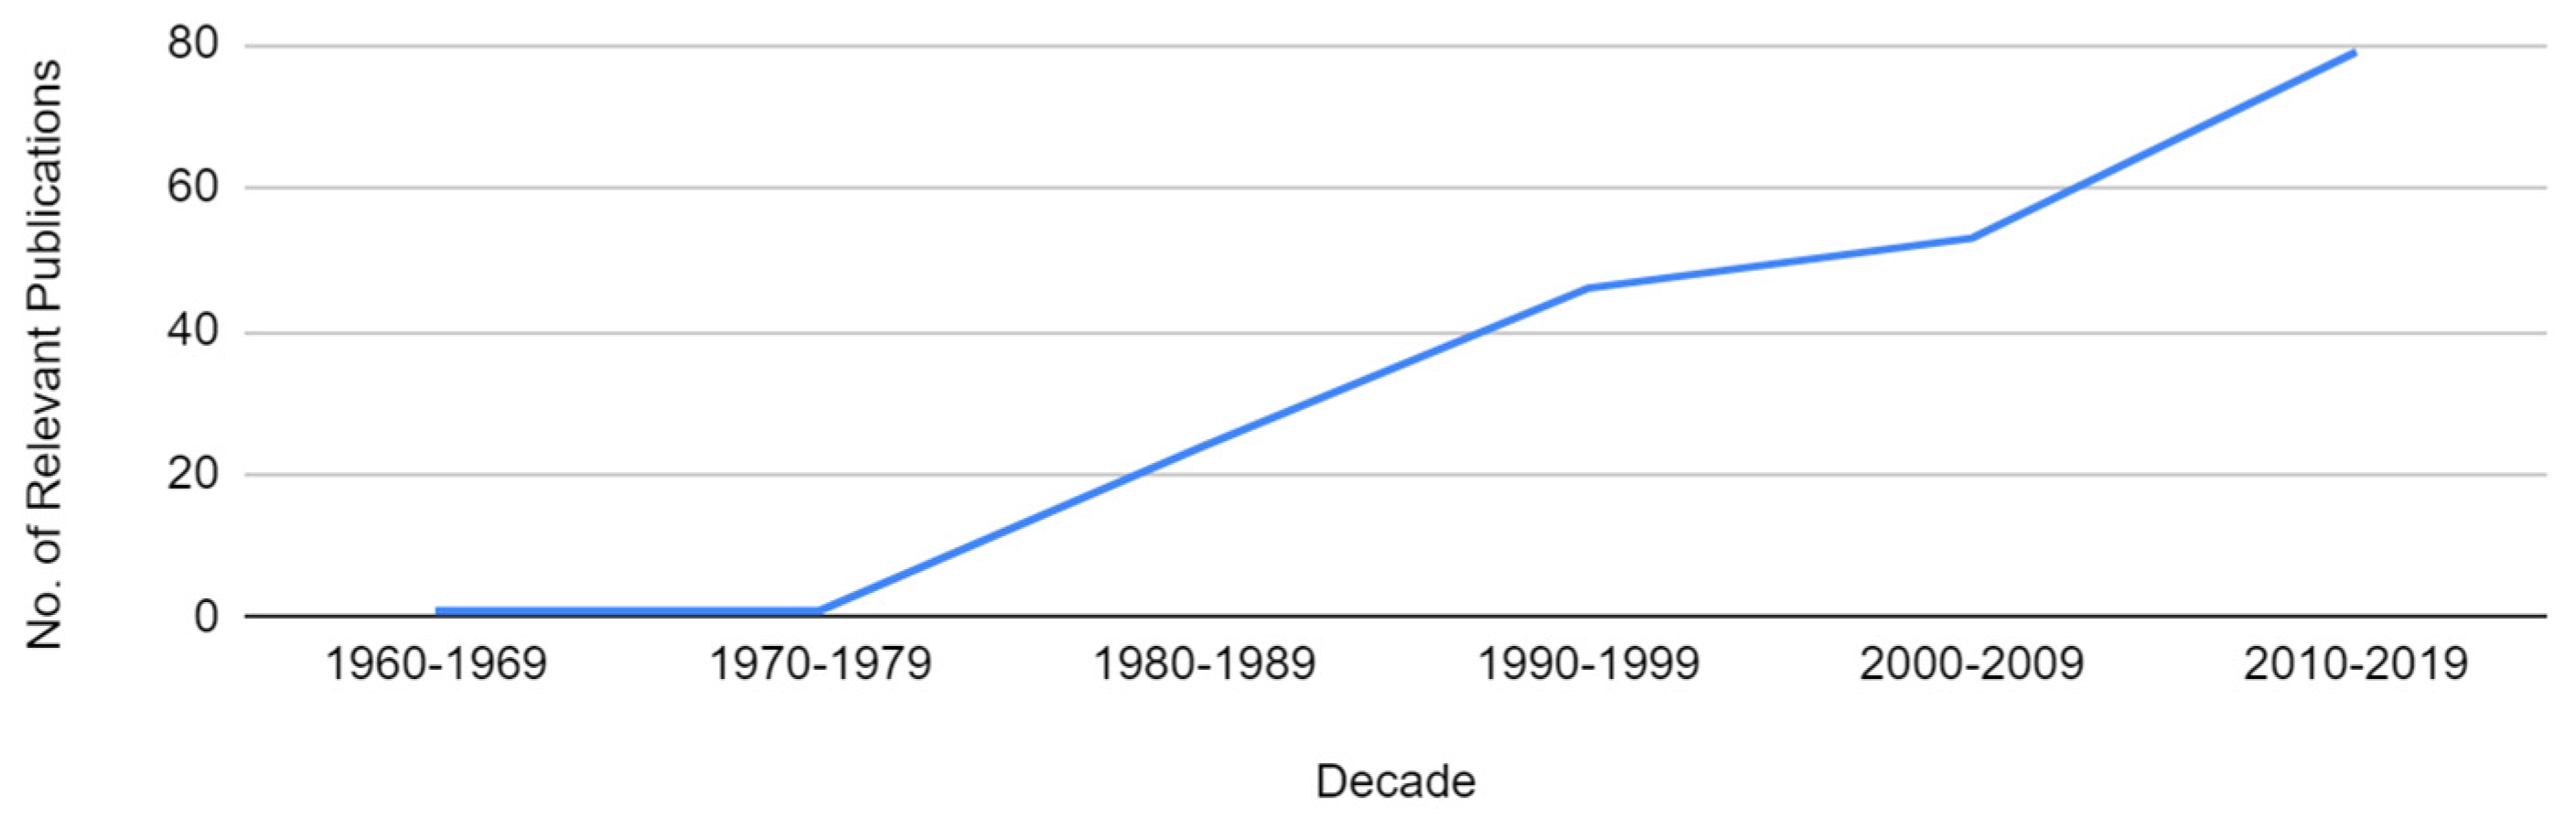
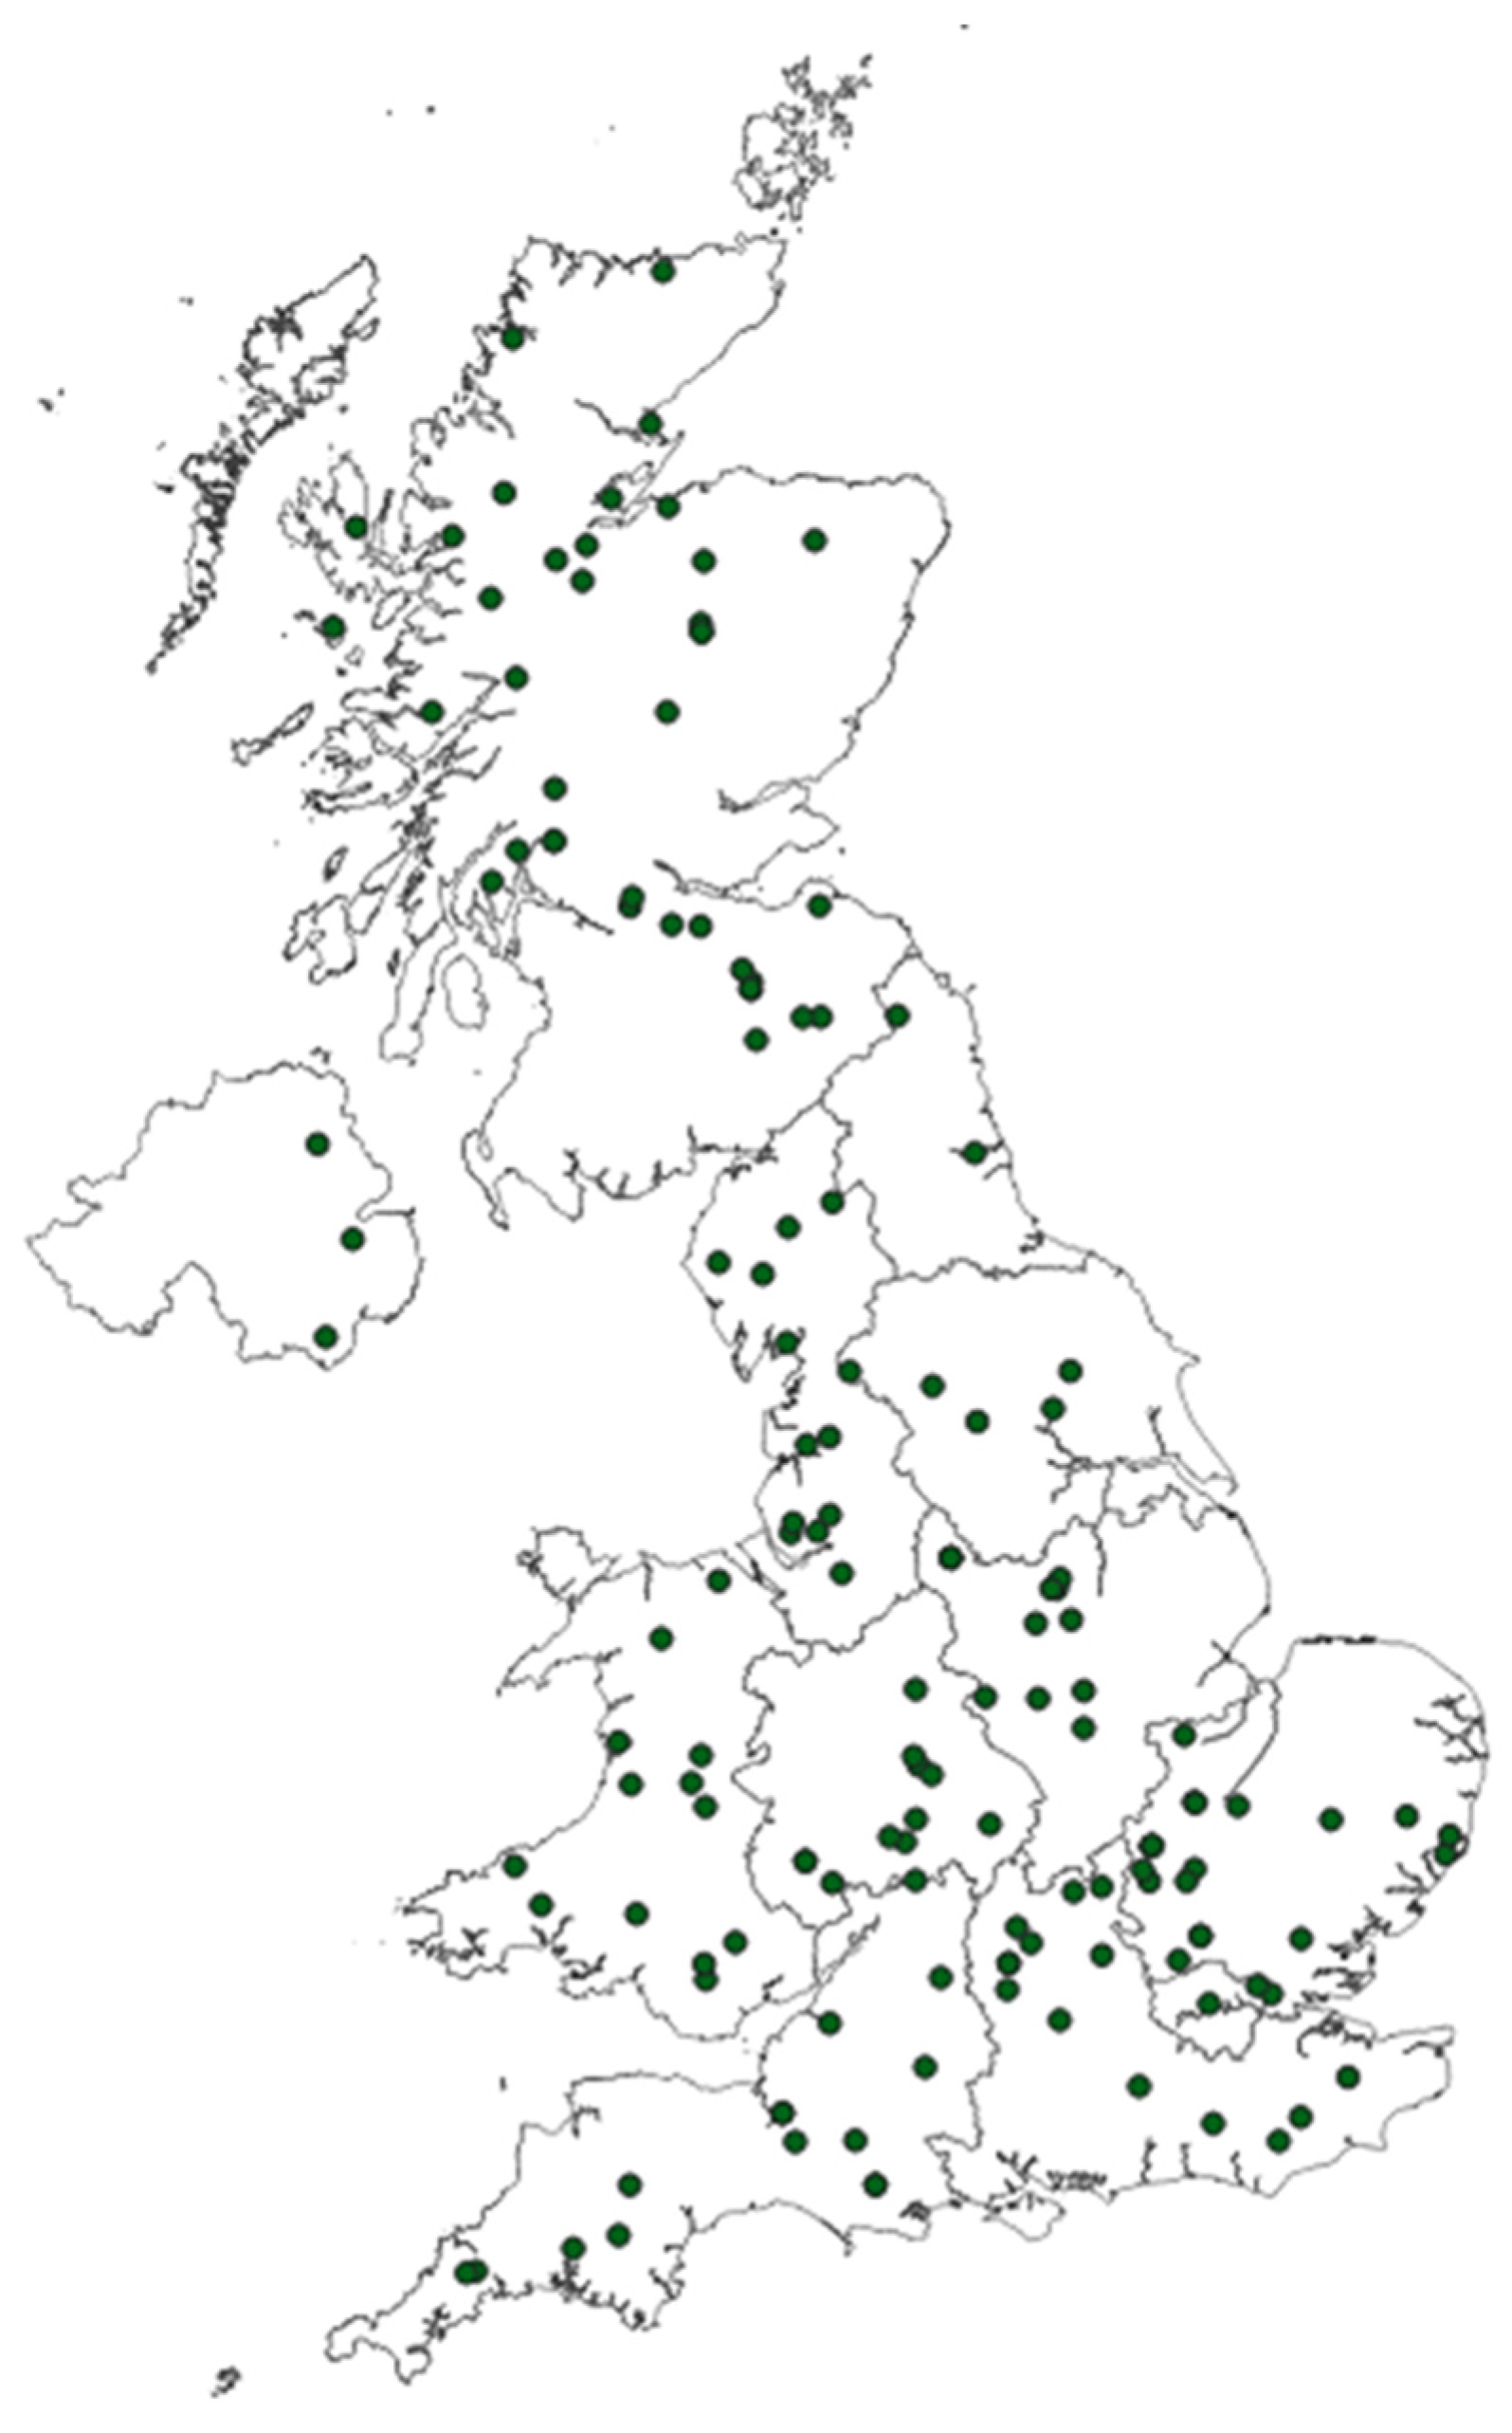
3.2. Temporal and Spatial Results

Coding of the publication date allowed for trends in the number of relevant studies to be established. On the whole, the number of relevant published studies has been shown to increase year-on-year since the 1970s. The lack of published studies from the 1960s is a surprising finding. The search for older literature was extensive, and it is not clear why little or none of the work on woodland establishment was reported in the academic literature (Figure 3).
The distribution of studies appears to be spread broadly across the UK. Although England has the strongest evidence base in terms of number of relevant studies (143), Scotland (84), Wales (50), and Northern Ireland (21) are similarly represented in relation to land area and/or population. Many of the studies referred to specific locations, as shown on the map in Figure 4 (studies that covered wider areas, such as entire regions or Great Britain as a whole, are not depicted). The majority of studies focused on rural locations (136) and on lowland (77) rather than upland (51) areas (note, some of these studies included both lowland and upland data), though such information was not always apparent.

3.3. Data Visualisation—Data Dashboard Tool

All data coded according to the data synthesis strategy were incorporated into a data dashboard. This process presents the systematic evidence map as a freely accessible and interactive visualisation tool: (https://cdn.forestresearch.gov.uk/2023/02/Evidence_Map_Data_Dashboard_2023.html, accessed on 8 December 2023). The data dashboard allows users to explore the following issues:
  • Drivers of woodland creation for different types of landowners and managers;
  • Drivers of woodland creation in relation to land tenure;
  • The types of woodland created by different types of land managers;
  • Land management objectives among different types of land managers;
  • Land management objectives of different types of farmers.
For each query, the tool presents a matrix with each intersection displaying the relevant sources of evidence as a spiralling cluster of dots, the outermost of which represents the most recently published source. By comparing the size of the spirals (number of dots) at different intersects, users can quickly understand the relative scale of evidence for different aspects of a particular query. For example, Figure 5 illustrates, in the context of woodland creation, how the scale of evidence (number of dots) for different drivers (y-axis) compares between different types of land managers (x-axis). Users can zoom in on the spirals and hover over the dots to identify individual citations. Clicking on the dots takes users to the webpage containing the respective source (where available). In addition, each query contains a tab with a table summarising the scale of the evidence in a numerical format, as well as tabs for the different variables containing a list of all relevant citations in text format. This information can be copied or downloaded in CSV, Excel, or PDF format.
The range of reviewed drivers and barriers influencing woodland creation was well-represented across the literature. Particularly well-represented evidence was found for the effects of economic incentives through tax and public grants (featured in 147 studies), attitudes and values (114), and land or resource suitability (107). Less evidence was available for private finance (38) and operational factors (49). Of the land manager objectives for woodland creation, the most frequently evidenced were conservation (76), timber production (74), and social or recreation (73). Few studies covered specialised objectives of contemporary policy interest, such as water quality (10), bioenergy (10), health and wellbeing (10), flood regulation (17), and carbon sequestration (24).
The evidence was marginally more focused on farmers (163) than non-farmers (135). Of the studies that specified the type of farmer, there were comparable numbers covering livestock (73) and arable farmers (62). Of the non-farmers, the weight of evidence focused on local authorities (52), NGOs (40), community groups (33), and forest companies (30), and with relatively little evidence pertaining to the Church (1), Crown Estate (1), developers (3), utility and transport companies (6), and National Parks (11). Regarding land ownership (primarily relating to farmers), the evidence included substantial numbers of studies for both owned land (68) and tenanted land (45), although in most cases, ownership was not specified (153).
By summarising the evidence for various queries, the interactive evidence tool offers policymakers, researchers, funders, and practitioners an overview of the scale of available information with respect to woodland creation drivers and outcomes. Conversely, it also highlights queries for which there are evidence gaps or shortfalls, i.e., potential areas for future research. Furthermore, the tool serves as a springboard for more detailed research into specific queries, allowing users to identify the relevant literature necessary for targeted reviews or exploration of evidence. For example, a user is able to identify, source, and subsequently review the literature to better understand whether a particular driver is of differing importance to different land managers or to determine which interventions are most likely to result in an increase in woodland creation by a particular type of farmer–queries which the scale of evidence alone do not reveal. Indeed, there is scope for the tool to assist in exploring and answering a plethora of such queries, depending on personal interest or concern. Importantly, this is the first iteration of the interactive evidence tool demonstrating a use case for such an approach. The intention is to improve functionality and useability so that users can explore the regularly updated data in greater depth. Forest Research (UK) will endeavour to re-run the aforementioned search and coding process in subsequent years in order to update the evidence map and interactive tool to reflect the ever-changing research landscape.

4. Discussion

The current systematic evidence map provides comprehensive detail about the range of evidence that exists regarding land managers and woodland creation. The accompanying data visualisation tool offers a user-friendly and intuitive tool through which to explore this evidence. The evidence map codes sources on a range of areas, including drivers (such as incentives, land suitability, and cultural factors), objectives such as timber production and enterprise improvement, and characteristics such as ownership and land manager type. The systematic evidence map and data visualisation tool can be used to identify evidence gaps for future research and also help overcome the perennial problem of research being lost or overlooked (particularly grey literature), thereby breaking the cycle of unnecessary repetition in research efforts. By helping to identify relevant literature and providing confidence in the range of evidence identified, the systematic evidence map can also help policymakers and delivery bodies target specific groups when promoting woodland creation and frame messages and incentives in a way which is likely to be more appealing. Given the considerable importance currently attached to tree planting and woodland creation, particularly by governments and policymakers, and widespread concern about poor creation rates and missing targets in many countries, we propose that the systematic evidence map is promoted and used widely across the sector. Owing to the rapid rate at which new publications on this topic are being published (which has increased steadily over recent decades), we propose that the systematic evidence map is updated regularly to ensure its relevance and value can be maintained as bodies of evidence continue to grow.
The approach taken in the current research—systematic evidence mapping—is a transparent and repeatable way to evaluate information on any forestry management issue that affects policy and decision-making and is not restricted to any individual country; it is widely applicable to complex policy-practice challenges. In the field of forestry, it is still not widely used, and the current research is an innovative approach to the problem of synthesising knowledge and enabling stakeholders to use that knowledge. In the future, improvements in text mining and machine learning/artificial intelligence (AI) will make this method less labour-intensive and should facilitate better evidence-informed policy in forestry.

5. Conclusions

In summary, the systematic evidence map and its accompanying data visualisation tool represent a significant advancement in understanding the factors influencing land managers and implementation of woodland creation in the United Kingdom. This transparent and repeatable methodology compiles evidence from diverse sources, providing a holistic overview of the current knowledge landscape.
The evidence map, which includes an interactive online dashboard, identifies the abundance of evidence in certain areas and conversely highlights critical evidence gaps. Beyond academia, it offers practical utility for policymakers and delivery bodies by guiding targeted interventions and messaging. It can support improved design of incentives, approaches, and policies seeking to enhance woodland creation.
We advocate widespread adoption of the systematic evidence mapping approach across the sector, recognising its relevance in the context of the growing importance of woodland creation. Regular updates to the evidence mapping are recommended to ensure continued applicability as new publications contribute to the evolving body of evidence.
The innovative approach to evidence mapping and interrogation contributes significantly to specific challenges faced in the UK while also introducing a methodology applicable to forestry management globally. Looking forward, advancements in text mining, machine learning, and artificial intelligence are expected to streamline processes, enhancing evidence-informed policy and decision-making in forestry and land management.

Supplementary Materials

The following supporting information can be downloaded at https://www.mdpi.com/article/10.3390/f15020299/s1, Table S1: List of organizations; Table S2: Key words/terms; Table S3: Boolean search string.

Author Contributions

Conceptualization, B.A.-O., D.E. and M.D.; methodology, D.E., G.E.H., G.P., K.W., L.P., M.D. and W.J.H.; validation, D.E., G.P., K.W., L.P., M.D. and W.J.H.; formal analysis, D.E., G.P., K.W., L.P., M.D. and W.J.H.; investigation, G.P., W.J.H. and L.P.; resources, D.E.; data curation, H.M.; writing—original draft preparation, B.A.-O., D.E., G.E.H., G.P., K.W., L.P., M.D. and W.J.H.; writing—review and editing, B.A.-O., M.D., G.E.H., G.P., H.M., K.W., L.P., S.M. and W.J.H.; visualization, H.M. and S.M.; supervision, D.E.; project administration, B.A.-O., D.E. and S.M.; funding acquisition, D.E. All authors have read and agreed to the published version of the manuscript.

Funding

Forest Research’s Core Programme 6: ‘Woodland Creation and Expansion’ developed in response to the ‘Science and Innovation Strategy for Forestry in Great Britain’ via funding from the governments of England, Scotland and Wales, with additional funding from the Defra Nature for Climate Fund (ETPP-Woodland Creation Lessons from Evidence and Community Forests Experience. Project number 157601).

Data Availability Statement

Data available from the corresponding author(s) on request.

Acknowledgments

The authors are indebted to the librarians of the Radcliffe Science Library, the Vere Harmsworth Library, the Social Science Library, and the Law Library (part of the University of Oxford’s Bodleian Libraries) for their assistance with accessing archival material. The substantial contributions of Thomas Carter and Ali Malik, who undertook most of the screening and data coding, are also gratefully acknowledged.

Conflicts of Interest

The authors declare no conflicts of interest. The funders had no role in the design of the study, in the collection, analyses, or interpretation of data, in the writing of the manuscript, or in the decision to publish the results.

References

  1. Aronson, J.; Alexander, S. Ecosystem Restoration is Now a Global Priority: Time to Roll up our Sleeves. Restor. Ecol. 2013, 21, 293–296. [Google Scholar] [CrossRef]
  2. Bastin, J.F.; Finegold, Y.; Garcia, C.; Mollicone, D.; Rezende, M.; Routh, D.; Zohner, C.M.; Crowther, T.W. The global tree restoration potential. Science 2019, 365, 76–79. [Google Scholar] [CrossRef] [PubMed]
  3. Griscom, B.; Jackson, R.B.; Konijnendijk, C. Trees as Nature-Based Solutions. One Earth 2020, 2, 387–389. [Google Scholar]
  4. Verdone, M.; Seidl, A. Time, space, place, and the Bonn Challenge global forest restoration target. Restor. Ecol. 2017, 25, 903–911. [Google Scholar] [CrossRef]
  5. BEIS. The Ten Point Plan for a Green Industrial Revolution: Building back better, supporting green jobs, and accelerating our path to net zero. In Department for Business Energy & Industrial Strategy 2020; HM Government: London, UK, 2020. [Google Scholar]
  6. Forest Research. Forestry Facts & Figures: A Summary of Statistics about Woodland and Forestry in the UK. 2023. Available online: https://cdn.forestresearch.gov.uk/2023/09/FFF2023.pdf (accessed on 28 November 2023).
  7. House of Commons, Environment Audit Committee. Seeing the Wood for the Trees: The Contribution of the Forestry and Timber Sectors to Biodiversity and Net Zero Goals. Fifth Report of Session 2022–2023. Report, Together with Formal Minutes Relating to the Report. Ordered by the House of Commons to be Printed 12 July 2023. 2023 HC 637. Available online: https://publications.parliament.uk/pa/cm5803/cmselect/cmenvaud/637/report.html (accessed on 28 November 2023).
  8. Lawrence, A.; Dandy, N. Private landowners’ approaches to planting and managing forests in the UK: What’s the evidence? Land Use Policy 2014, 36, 351–360. [Google Scholar] [CrossRef]
  9. Rose, D.C.; Keating, C.; Morris, C. Understand How to Influence Farmers’ Decision-Making Behaviour: A Social Science Literature Review; Report for the Agriculture and Horticulture Development Board (AHDB): Warwickshire, UK, 2018; p. 44. [Google Scholar]
  10. Staddon, P.; Urquhart, J.; Mills, J.; Goodenough, A.; Powell, J.; Vigani, M.; Simmonds, P.; Rowe, E. Encouraging Woodland Creation, Regeneration and Tree Planting on Agricultural Land: A Literature Review; NEER020; Countryside and Community Research Institute Report to Natural England: Peterborough, UK, 2021. [Google Scholar]
  11. Wentworth, J.; Jordon, M. Woodland Creation. UK Parliament Research Briefing; UK Parliamentary Office of Science and Technology: London, UK, 2021. [Google Scholar]
  12. Valatin, G.; Moseley, D.; Dandy, N. Insights from behavioural economics for forest economics and environmental policy: Potential nudges to encourage woodland creation for climate change mitigation and adaptation? For. Policy Econ. 2016, 72, 27–36. [Google Scholar] [CrossRef]
  13. Lawrence, A.; Dandy, N.; Urquhart, J. Landowner Attitudes to Woodland Creation and Management in the UK. Forest Research, Alice Holt, Farnham. 2010. Available online: https://www.forestry.gov.uk/fr/ownerattitudes (accessed on 28 November 2023).
  14. Pullin, A.S.; Cheng, S.H.; Cooke, S.J.; Haddaway, N.R.; Macura, B.; Mckinnon, M.C.; Taylor, J.J. Informing conservation decisions through evidence synthesis and communication. In Conservation Research, Policy and Practice; Cambridge University Press: Cambridge, UK, 2020; pp. 114–128. [Google Scholar]
  15. Purgar, M.; Klanjscek, T.; Culina, A. Quantifying research waste in ecology. Nat. Ecol. Evol. 2022, 6, 1390–1397. [Google Scholar] [CrossRef] [PubMed]
  16. Glasziou, P.; Chalmers, I. Research waste is still a scandal—An essay by Paul Glasziou and Iain Chalmers. BMJ 2018, 363, k4645. [Google Scholar] [CrossRef]
  17. Cabinet Office. Modernising Government; White Paper, CM4310; TSO: London, UK, 1999. [Google Scholar]
  18. Pullin, A.S.; Knight, T.M. Doing more good than harm–Building an evidence-base for conservation and environmental management. Biol. Conserv. 2009, 142, 931–934. [Google Scholar] [CrossRef]
  19. James, K.L.; Randall, N.P.; Haddaway, N.R. A methodology for systematic mapping in environmental sciences. Environ. Evid. 2016, 5, 7. [Google Scholar] [CrossRef]
  20. Collaboration for Environmental Evidence. Guidelines and Standards for Evidence synthesis in Environmental Management, Version 5.1.; Pullin, A.S., Frampton, G.K., Livoreil, B., Eds.; Collaboration for Environmental Evidence: Bulgaria, Czech Republic, 2022. Available online: https://www.environmentalevidence.org/information-for-authors (accessed on 28 November 2023).
  21. Snilstveit, B.; Bhatia, R.; Rankin, K.; Leach, B. 3ie Evidence Gap Maps: A Starting Point for Strategic Evidence Production and Use; 3ie Working Paper 28; International Initiative for Impact Evaluation: New Delhi, India, 2017. [Google Scholar]
  22. Littell, J.H.; White, H. The Campbell Collaboration: Providing Better Evidence for a Better World. Res. Soc. Work. Pract. 2018, 28, 6–12. [Google Scholar] [CrossRef]
  23. Ouzzani, M.; Hammady, H.; Fedorowicz, Z.; Elmagarmid, A. Rayyan—A web and mobile app for systematic reviews. Syst. Rev. 2016, 5, 210. [Google Scholar] [CrossRef] [PubMed]
  24. Lombard, M.; Snyder-Duch, J.; Bracken, C.C. Content Analysis in Mass Communication: Assessment and Reporting of Intercoder Reliability. Hum. Commun. Res. 2002, 28, 587–604. [Google Scholar] [CrossRef]
  25. Church, S.; Dunn, M.; Prokopy, L. Benefits to Qualitative Data Quality with Multiple Coders: Two Case Studies in Multi-coder Data Analysis. J. Rural. Soc. Sci. 2019, 34, 2. [Google Scholar]
  26. Frampton, G.K.; Livoreil, B.; Petrokofsky, G. Eligibility screening in evidence synthesis of environmental management topics. Environ. Evid. 2017, 6, 27. [Google Scholar] [CrossRef]
  27. Sievert, C.; Interactive Web-Based Data Visualization with R, Plotly, and Shiny. 19 December 2019. Available online: https://plotly-r.com/ (accessed on 23 January 2024).
Figure 1. Diagrammatic representation of the methodological procedure. Boxes in blue indicate the “search stage”, yellow the “select stage”, and green the “synthesize stage” of the review process.
Forests 15 00299 g001
Figure 2. Sankey diagram showing the flow of materials from searching to selection for the systematic evidence map. Grey elements represent rejection; green elements represent processing to the following stage of the process. Exclusion at full-text is reported on the basis of wrong Population (P), Phenomena of Interest (I), Outcome (O), Location (L), or Other (article type, e.g., a review or commentary piece).
Forests 15 00299 g002
Figure 3. Trend in publication of relevant studies by decade.
Forests 15 00299 g003
Figure 4. Specified study sites are shown as dots on the map. Studies that covered wider areas–county-wide, regional, or national—are not included on the map.
Forests 15 00299 g004
Figure 5. Partial screenshot of the data dashboard depicting interactive clusters of evidence sources for different woodland creation drivers and land manager types.
Forests 15 00299 g005
Table 1. Coded elements from relevant sources of evidence.
Coded ElementIndividual Data Fields
Article MetadataReference Type, Year, Author, Author Institution, Title, Journal Title, ISBN/ISSN, DOI, URL, Abstract, Volume, Issue, Pages
Study LocationScale of Study, Number of Study Sites, UK Nation, Lat/Lon (DD)
Land Management and Setting/Contextual InformationStudy Question/Objective(s), Study Type, Sample Size, Altitude, Rural/Urban Setting, Land Manager Type, Ownership, Area of Land Owned/Managed, Units of Land
Drivers and Barriers to Woodland CreationEconomic Conditions, Economic Incentives (Public), Economic Incentives (Private), Regulation, Personal/Company Circumstances, Land or Resource Suitability, Operational, Knowledge/Skills/Experience/Awareness, Networks and Partnerships, Access to Advice and Research, Cultural factors, Attitudes and Values, Land Manager Objectives
OutcomesWoodland Creation Status, Woodland Type, Establishment, Provenance and/or Genetics
Disclaimer/Publisher’s Note: The statements, opinions and data contained in all publications are solely those of the individual author(s) and contributor(s) and not of MDPI and/or the editor(s). MDPI and/or the editor(s) disclaim responsibility for any injury to people or property resulting from any ideas, methods, instructions or products referred to in the content.

