Article

Predicting the Potential Habitat Distribution of Relict Plant Davidia involucrata in China Based on the MaxEnt Model

1
International Center for Bamboo and Rattan, Key Laboratory of National Forestry and Grassland Administration, Beijing 100102, China
2
Hubei Academy of Forestry, Wuhan 430075, China
3
Hubei Qizimeishan National Nature Reserve Administration, Enshi 445000, China
*
Author to whom correspondence should be addressed.
Forests 2024, 15(2), 272; https://doi.org/10.3390/f15020272
Submission received: 20 November 2023 / Revised: 27 December 2023 / Accepted: 25 January 2024 / Published: 31 January 2024
(This article belongs to the Section Forest Ecology and Management)

Abstract

:
Davidia involucrata Baill. 1871 (D. involucrata), as a tertiary relict plant unique to China, is a national Class I protected plant with high economic value. Oil extracted from its seeds and peels can be used for both consumption and industrial purposes. It has become a popular income-earning export tree in China because of its graceful posture and beautiful white bracts. Climate change affects the distribution of the species’ potential habitat areas. Thus, studying its natural distribution pattern and future potential habitat distribution changes has great significance for the sustainable resource utilization and biodiversity conservation of D. involucrata. Here, we employed the MaxEnt model and ArcGIS software to predict the current and future (the 2050s and 2070s) potential habitats of D. involucrata via 130 species distribution records and 37 environmental variables. Meanwhile, we used the jackknife method to assess the importance of environmental factors. Our results showed the following: (1) When the RM = 4 and FC = LQHPT, the MaxEnt model exhibited the lowest complexity and overfitting degree while achieving high model prediction accuracy. The area under the curve (AUC) value of the simulated training was 0.958, indicating an excellent forecast. (2) Under the current climate scenario, D. involucrata was mainly concentrated in eastern Sichuan, western Hubei, northern Guizhou, and northwestern Hunan, with an area of 98.02 × 10⁴ km2. (3) The precipitation in the warmest quarter (Bio18, 30%), mean temperature in the driest quarter (Bio9, 24.4%), annual mean radiation (Bio20, 14.6%), and elevation (ele, 12.7%) were the main environmental factors affecting its habitat distribution; the t contribution was 82.1%. (4) Under different future climate scenarios, the potential habitat area of D. involucrata decreased overall. Compared with the current climate scenario, the areas of potential habitats gradually decreased in both the 2050s and 2070s under the ssp126 and ssp585 climate scenarios but decreased in the 2050s and then increased in the 2070s under the ssp370 climate scenario. Therefore, it is of great significance to track and monitor the existing population or community on the basis of the possible changes in its distribution area. Moreover, the artificial breeding of its seedlings should be considered in the future to improve the quality of its germplasm resources. In summary, our findings can provide a scientific understanding of D. involucrata distribution in China and are conducive to conservation and utilization.

1. Introduction

Climate change poses a substantial threat to the global economy, food security, health, and livelihoods [1,2]. Its impact is increasingly prominent worldwide, with notable effects on the geographic distributions of species, biodiversity, and ecosystem services and functions [3,4,5]. The frequency of human activities contributing to climate warming is resulting in a decrease in the distribution range of species [6,7,8], the degradation or loss of habitats, and an acceleration of species extinction [9]. The global average surface temperature has already risen by approximately 1 °C, in comparison to that of the pre-industrial revolution, which will further increase global warming over the next 20 years [10], consequently affecting the distribution of suitable habitats for species. Numerous studies have investigated the effects of climate change on multiple species, demonstrating its profound impact on species distribution ranges [11,12,13]. Therefore, studying natural distribution patterns and forecasting changes in potentially suitable areas are of paramount importance for the sustainable utilization of resources and the conservation of biodiversity.
Davidia involucrata Baill. 1871 (D. involucrata), commonly known as the water pear tree or the dove tree, belongs to the genus Davidia of the family Nyssaceae [14]. It is designated as a national Class I protected plant and is often referred to as a “living fossil”. However, due to its strict habitat requirements, D. involucrata has a relatively small population. It primarily thrives in the mountainous regions of south-central and southwest China. These forests, where D. involucrata is the dominant species, are predominantly found in cool, foggy areas with cloudy climates, situated at altitudes ranging from 1300 to 1900 m (and at higher elevations, of 2300 to 2800 m, in Yunnan) [15]. As a unique tertiary relict plant in China [16], D. involucrata has high pharmaceutical and economic value, which is recognized worldwide [17]. The root and pericarp of D. involucrata are used in traditional medicine for their bitter taste and cool nature and are known for their heat-clearing, detoxifying, and hemostatic properties [18]. A chemical analysis of D. involucrata has revealed the presence of tannins, sterols, and triterpenes [19]. Tannins possess anti-inflammatory and antibacterial effects and may inhibit the proliferation of cancer cells [20]. Phytosterols can reduce blood cholesterol, inhibit mammary gland hyperplasia, and regulate immunity [21]. Triterpenes exhibit various biological and pharmacological activities, particularly in anti-tumor and anti-inflammatory applications, as well as for immune regulation [22]. Economically, oil extracted from D. involucrata seeds and peels can be used for both consumption and industrial purposes [23]. Furthermore, D. involucrata has gained popularity as an ornamental tree for its tall stature, graceful posture, and beautiful white bracts. It is often transplanted to urban areas for shading and landscaping. Since its discovery by French priest Davis in Muping (Baoxing), Sichuan Province, in 1869, D. involucrata has been introduced to numerous countries and regions, becoming a renowned economic and ornamental garden tree worldwide. Current studies on D. involucrata mostly focus on its photosynthetic characteristics [24], gene cloning and expression [25,26,27], population structure and dynamics [28,29], and community characteristics and diversity [30]. Regarding its geographical distribution, most existing studies primarily consider climate factors as the main environmental variables [31,32], while soil factors have received less attention.
Species distribution models (SDMs) combine occurrence records and environmental factors to simulate the changes in suitable habitat areas under diverse scenarios. Researchers have devised numerous models, including GARP, BIOCLIM, RFs, GLMs, ENFA, and MaxEnt [33,34,35,36,37]. Among these models, the MaxEnt model stands out due to its straightforward operation, adaptability for small sample sizes, and capacity to deliver consistent and precise predictive outcomes [38,39,40,41]. Notably, MaxEnt exhibits superior explanatory power in comparison to other models. In recent decades, MaxEnt has been extensively applied to simulate the distributions of endangered species and assess the risks of alien invasive species [42]. For instance, Karuppaiah [43] forecasted the distribution of Thrips tabaci (T. tabaci) in India, highlighting temperature and precipitation as the primary influential factors; Cui [44] explored the potential distributions of mangroves and Spartina alterniflora (S. alterniflora) along the coastline of southeast China, revealing that mangroves were more sensitive to annual sea surface temperature changes, while the terrain and coastline distance played important roles in the distribution of S. alterniflora. Additionally, Wang’s study [45] centered on the historical and projected distributions of Quercus sect. Heterobalanus in China, demonstrating that temperature was the most important environmental factor affecting its distribution.
Considering global climate change, researching the potential distribution of D. involucrata in the future could provide theoretical support for its advancement and judicious promotion [46]. In this study, we employed the MaxEnt model to predict potentially suitable areas for D. involucrata under the current and six future climate scenarios, utilizing its distribution records and environmental factors. This study aimed to achieve the following objectives: (1) identification of the primary environmental factors affecting species distribution; (2) prediction of the potential distribution of D. involucrata under the current climate scenario and exploration of the relationship between environmental variables and potential geographical distribution; and (3) elucidation of the dynamic changes of potentially suitable areas under varying climate scenarios in the future. This research provides a crucial scientific foundation for the conservation of relict plant D. involucrata and its habitat.

2. Materials and Methods

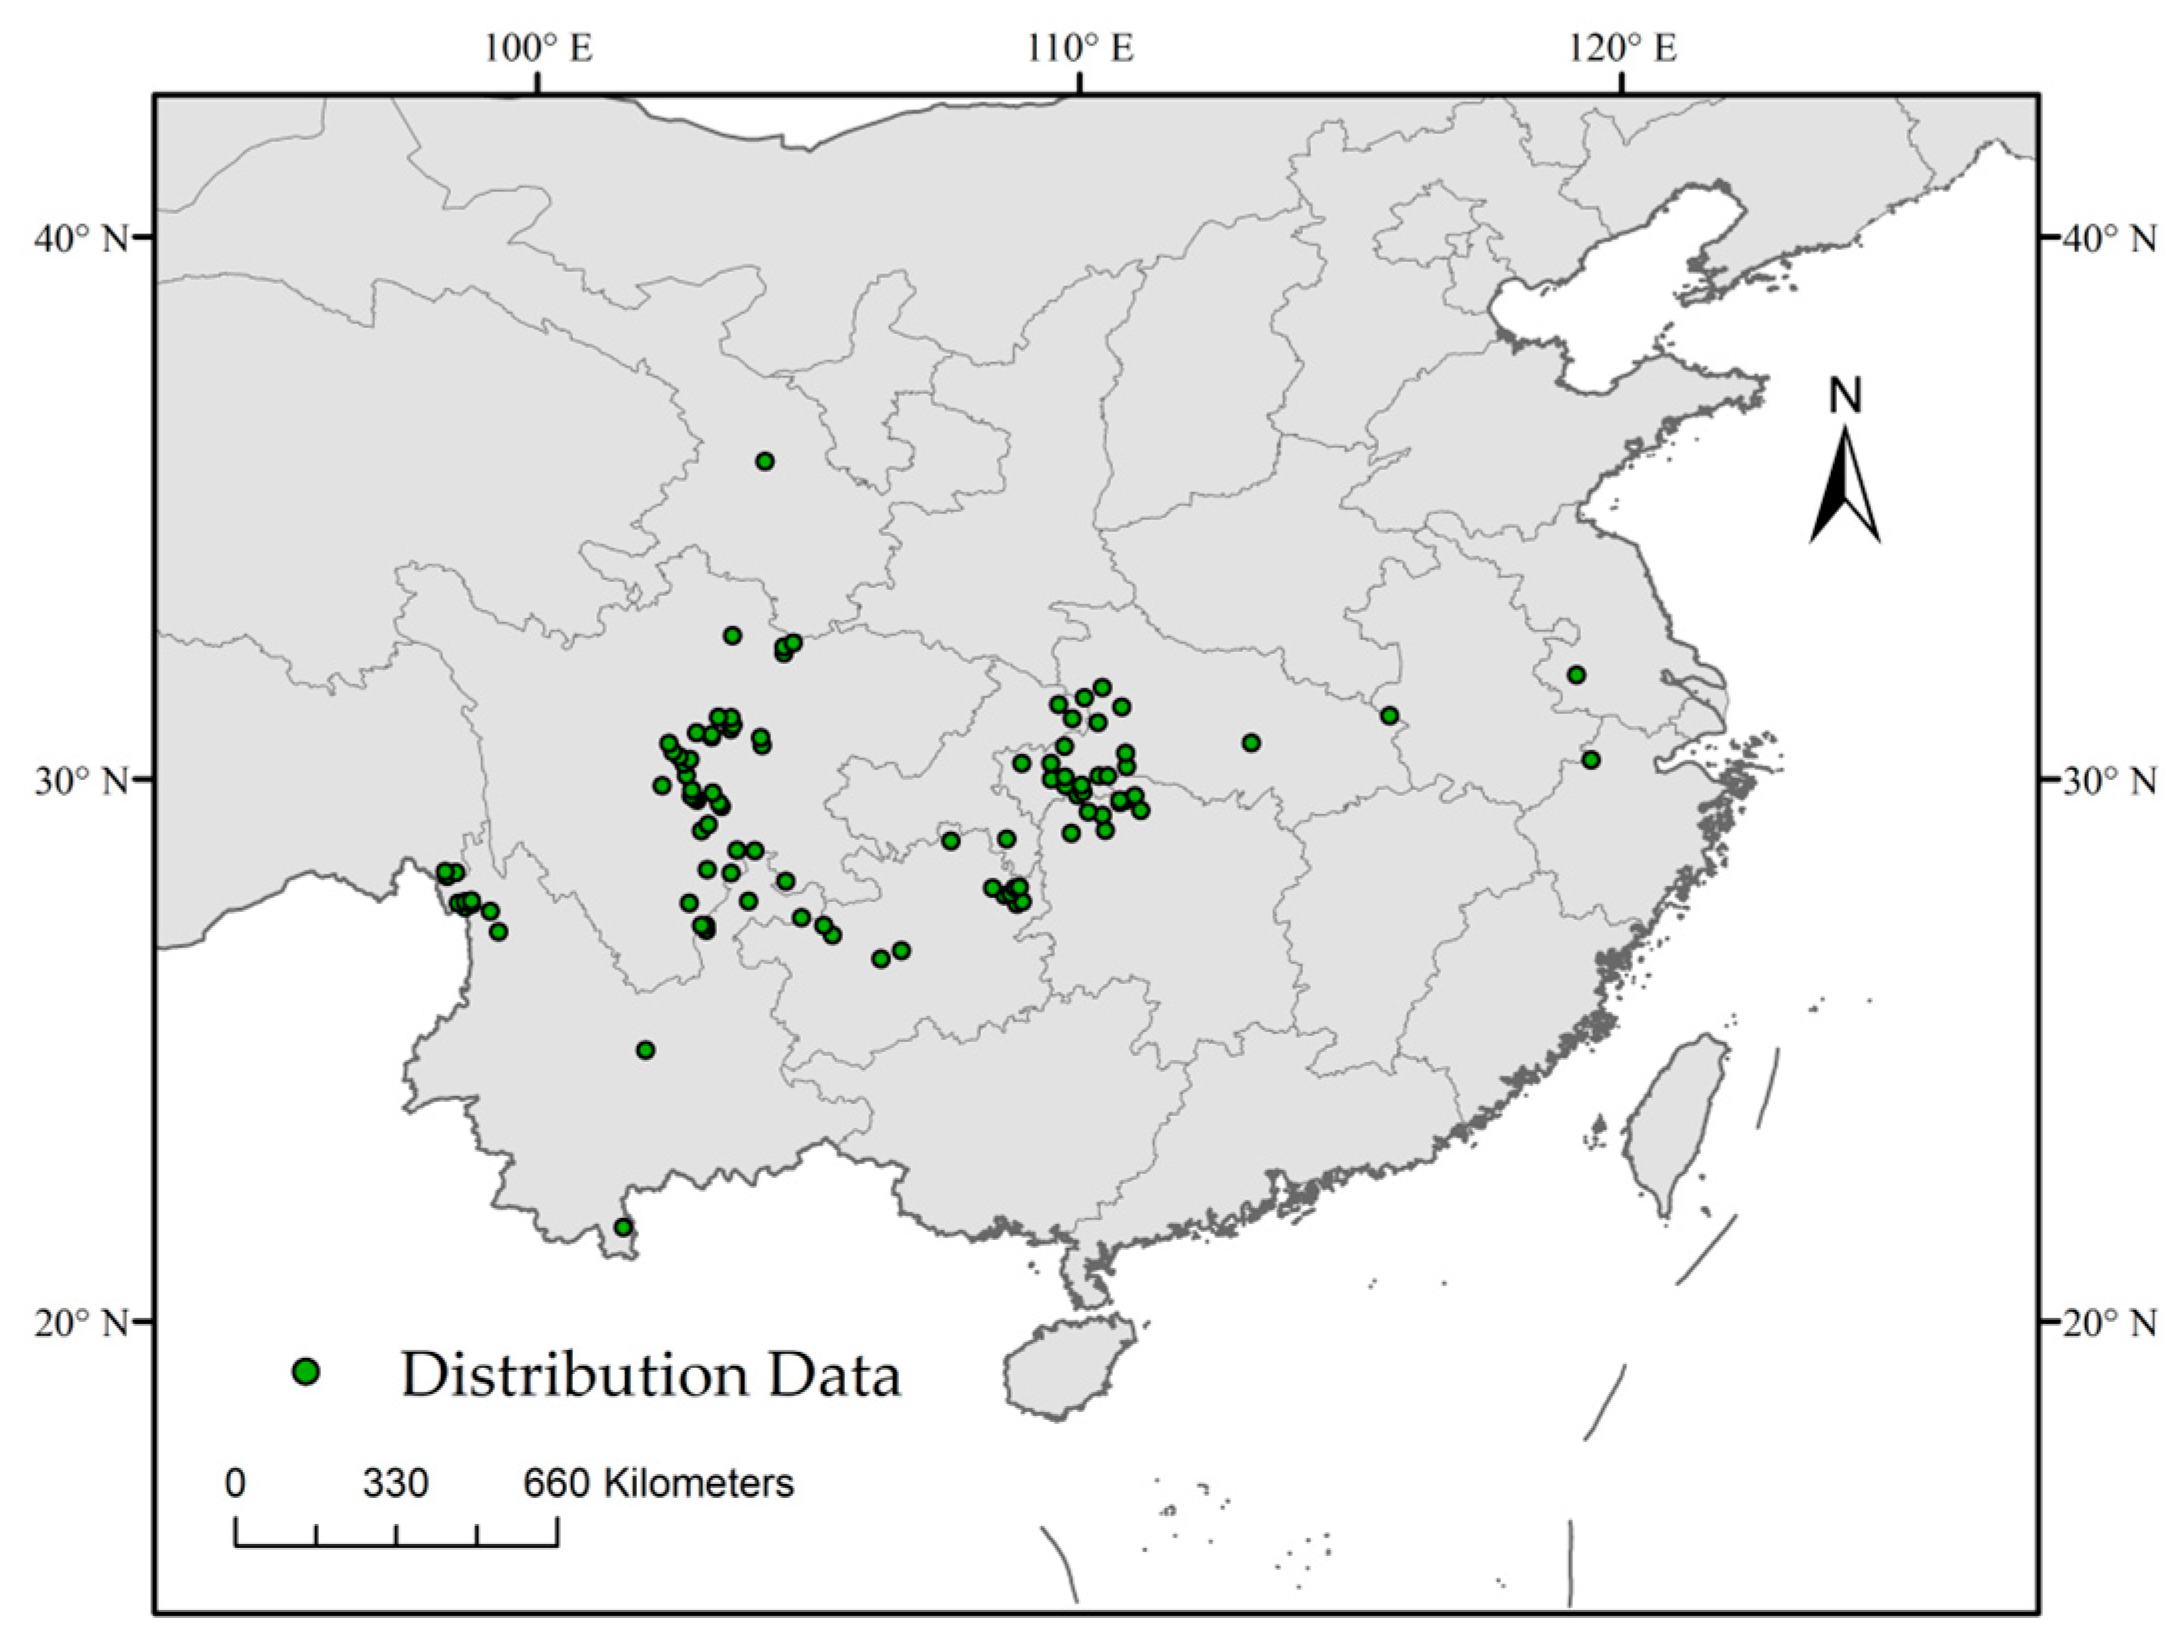
2.1. Species Distribution Data

The geographic distribution data of D. involucrata were collected from two approaches, most of which were obtained from the Global Biodiversity Information Facility (GBIF, https://www.gbif.org/ (accessed on 8 September 2023)) and the Chinese Virtual Herbarium (CVH; http://www.cvh.org.cn/ (accessed on 8 September 2023)); the rest were obtained directly from related literature [28,47,48,49]. To avoid the effect of spatial autocorrelation caused by the too-close spatial distribution points, after eliminating the duplicate and unclear (without accurate coordinates of latitude and longitude) records [50], we used the SDM toolbox (version 2.6) [51] in ArcGIS10.2 to ensure that only one distribution record existed within 10 km × 10 km [52], which finally gained a total of 130 distribution points (Figure 1). Meanwhile, the species latitude and longitude coordinates of the sample were converted to .csv format in Excel for future use [45].

2.2. Environmental Data

In the study of species distribution, environmental variables are the main leading factors of species niches at large spatial scales [53,54]. We selected 37 environmental variables that may affect the growth distribution of D. involucrata and predicted the current and future suitable distribution areas in our study. Climate data and altitude data in the former were both from the WorldClim Database (version 2.1) (http://worldclim.org (accessed on 8 September 2023)), where 19 bioclimatic factors (Bio1–Bio19) were extensively used to build a species niche model [55]. For the present, the data we downloaded were average values from 1970–2000, which represented the annual mean temperature, precipitation change, seasonal variation, and extreme trends. Future climate data were based on the BCC-CSM2-MR climate system model developed by the National (Beijing) Climate Center deriving from the Coupled Model Intercomparison Project 6 (CMIP6) [56,57]. Three scenarios of the shared socioeconomic pathway (SSPs) were selected: SSP126 (an upgrade of the RCP2.6 scenario based on SSP1 (low forcing scenario); radiative forcing reaches 2.6 W/m2 in 2100), SSP370 (an additional RCP7.0 emission path based on SSP3 (medium forcing scenario), where radiative forcing reaches 7.0 W/m2 in 2100), and SSP585 (an upgrade of the RCP8.5 scenario based on SSP5 (high forcing scenario), where radiative forcing reaches 8.5 W/m2 in 2100) for the 2050s (2041–2060) and 2070s (2061–2080) [58]. The current and future were both at a spatial resolution of 0.86 km2 (30″) [59]. Sixteen soil factors (30″) [60] were obtained from the Harmonized World Soil Database v1.2 (http://www.fao.org/soils-portal/ (accessed on 8 September 2023)) [61]. In addition, the annual mean radiation from Climond (https://www.climond.org/ (accessed on 8 September 2023)) was added [62]. All environmental variables were uniformly resampled at a resolution of 30″ in ArcGIS10.2.
The relevance and integrity of the environmental variables are key factors in building a model [63,64]. To avoid the collinearity between environmental factors, the variance inflation factor (VIF) was used to eliminate the factors with high correlation coefficients [59]. The environmental data of each distribution point were sampled and analyzed, with a multiple regression model built in R 4.3.1 by R packages (car and ggplot2). After repeating the VIF calculation 10 times, factors with a VIF of less than 10 were retained; meanwhile, correlation analysis of the environmental factors was performed. The distribution point data and environmental factor data were input into the model for pre-simulation, and the factors whose contribution rate was 0 in the experiment were excluded [50]. For the variables with a Pearson correlation coefficient |r| > 0.7 (Figure 2) [65], factors with higher contributions to the model operation results and greater biological significance were retained to eliminate multicollinearity among the variables. Finally, we obtained 12 environmental variables for the current and future distribution predictions (Table 1).

2.3. MaxEnt Modeling Process

The distribution records and environmental data were imported into the MaxEnt model (Version 3.4.4) for the simulation of suitable areas. We used 20,000 randomly selected pixels within the study area as the background for the model’s calibration [66]. Since using the default parameters of the model might lead to overfitting and impact the model’s accuracy [67], the ENMeval package (R4.3.1) was utilized in this study to optimize the model [68]. A total of 9 regularization multipliers (RM), ranging from 0.5 to 4 with an interval of 0.5 plus 0.1, were cross-combined with 6 feature combinations (FC), namely L, LQ, LQH, H, LQHP, and LQHPT (L: linear features, T: threshold features, Q: quadratic features, H: high features, and P: product features) [45]. The AICc value was calculated for the model in various combinations, and the minimum AICc value was selected. The final screening result is RM = 4 and FC = LQHPT. Moreover, 25% of the distribution point data were randomly selected to verify the model, and the remaining 75% of the samples were used as training data at the same time, along with setting the maximum number of iterations to 500 and the other parameters remaining unchanged by default; then, the calculation would continue 10 times [69]. Spectacularly, the jackknife method was used to calculate the contribution rate of each environmental factor and the importance of displacement. Mainly, the accuracy was tested by the receiver operating characteristic curve (ROC curve) drawn by the model, with the area under the curve (AUC) evaluating the accuracy of the simulation results. The value of the AUC ranged from 0 to 1, and a larger value indicated a higher confidence in the prediction result [70]. Generally, an AUC value of <0.7 indicates poor prediction results, 0.7–0.9 indicates that the accuracy of the model simulation results is average, while an AUC value of >0.9 indicates that the accuracy of the model simulation results is high [71,72]. The true skill statistic (TSS) was also used for the model evaluation. TSS, based on the components of the standard confusion matrix representing matches and mismatches between observations and predictions [73], was calculated using the maximum training sensitivity plus the specificity Cloglog threshold.

2.4. The Classification and Spatial Pattern Changes of Suitable Areas of D. involucrata

The MaxEnt model (v3.4.4) results were imported into ArcGIS10.2 and converted from the ‘asc’ format to Raster data (WGS1984) [74,75]. We used the nature break-point grading method (Jenks) in the ArcGIS10.2 reclassification tool to divide the suitable areas into four grades: a value of less than 0.2 represents unsuitable habitat, 0.2–0.4 represents a lowly suitable habitat, 0.4–0.6 represents a moderately suitable habitat, while a value greater than 0.6 represents a high-suitable habitat [76]. Then, we calculated the area of each suitable habitat and determined the proportion of each habitat range. In ArcGIS, the suitable areas were binarized [45]. The threshold of 0.2 was designated as the unfit region and assigned a value of 0, while the region with a distribution probability of ≥0.2 was designated as the unfit region and assigned a value of 1. Subsequently, the binary graph matrix representing the fit/unfit status for each period was generated. Further, 0-0 was defined as the unsuitability area, 0-1 as the newly added suitability area, 1-0 as the lost suitability area, and 1-1 as the retained suitability area. The study calculated the changes, trends, and ranges of D. involucrata in various climate scenarios and contemporary times. It also determined the areas of expansion, retention, and contraction, as well as the geographical ranges.

3. Results

3.1. MaxEnt Model Prediction and Accuracy Evaluation for the Suitable Habitat of D. involucrata

Based on the species distribution data and 12 selected environmental variables, our study utilized the ENMeval package in R for cross-validation tuning with various combinations of RM and FC. The best RM combination was 4 and had linear, quadratic, product, threshold, and hinge features (delta.AICc = 0, AUC.diff.Avg = 0.052, or_10p_avg = 0.13), while the training AUC, test AUC, and the TSS value were 0.958, 0.931, and 0.80, respectively. The results showed that the MaxEnt model was accurate in predicting the potential distribution of D. involucrata in China (Figure 3 and Figure 4).

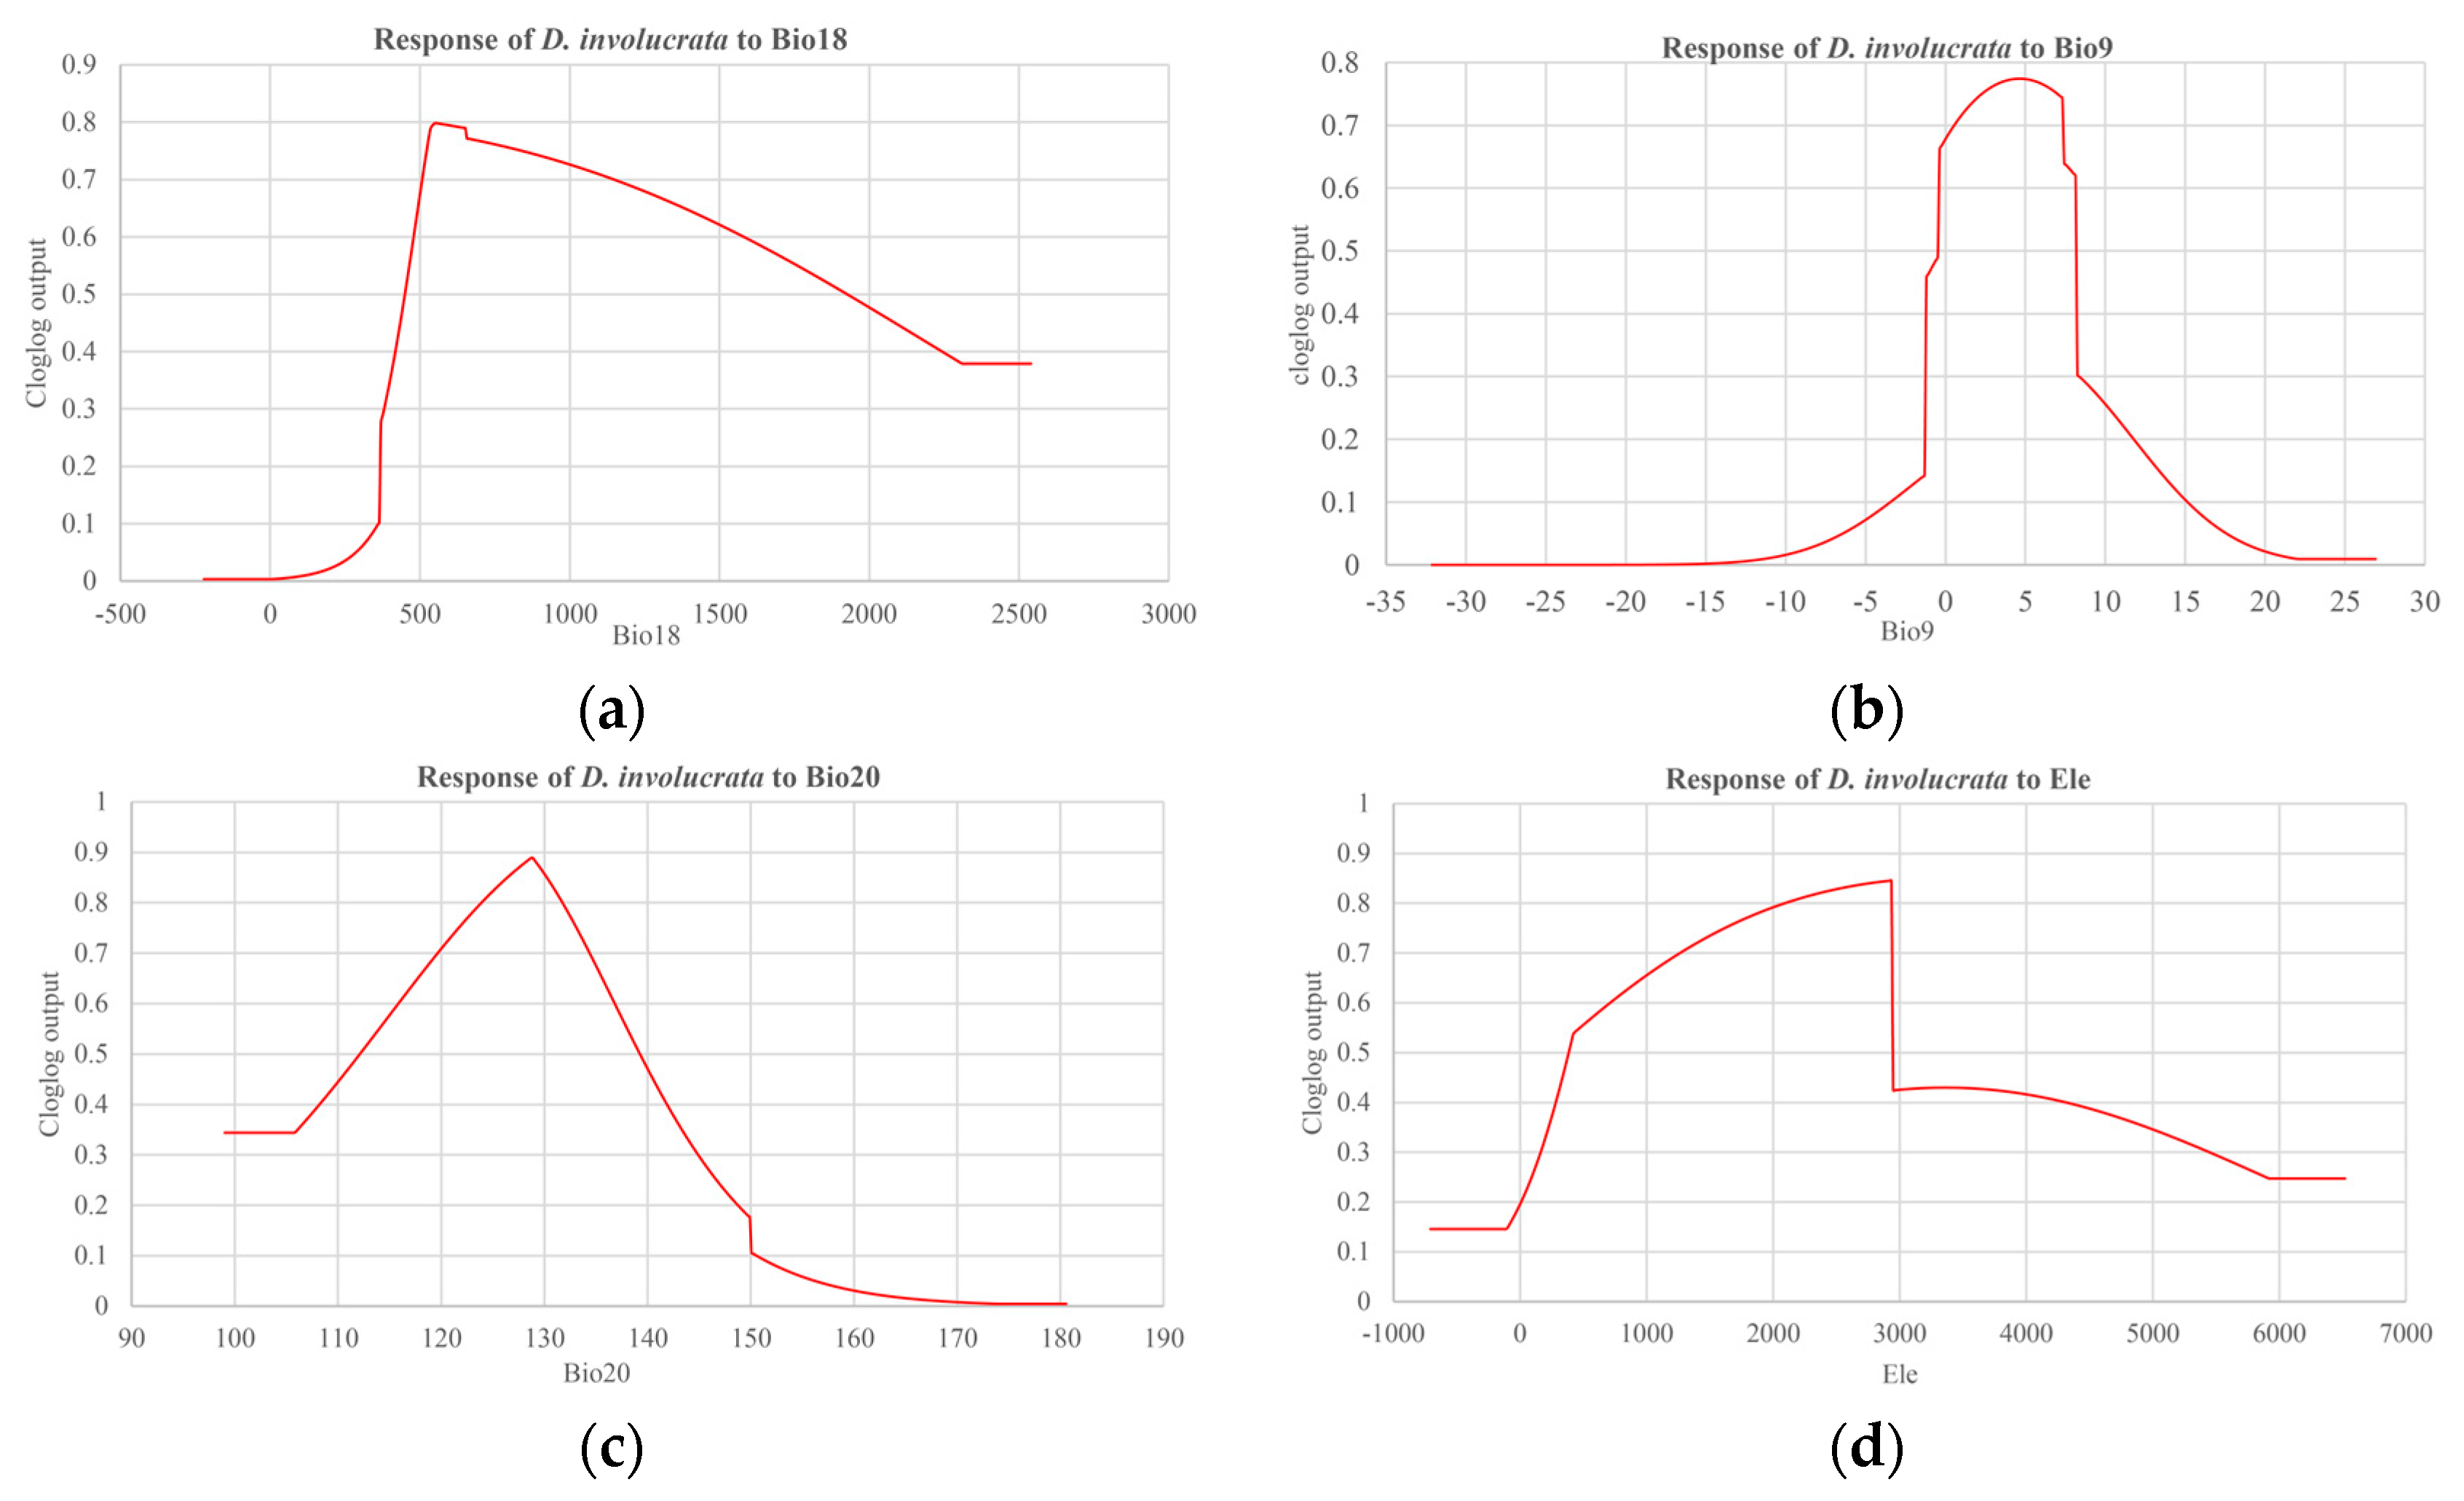
3.2. Contribution of Each Variable to the MaxEnt Prediction Model

In this study, the MaxEnt model output results were used to evaluate the importance of each biological environmental variable using the jackknife test. Further, our calculation precisely characterized the percent contribution and permutation importance (Table 1). The results showed that among the 12 environmental variables used to construct the MaxEnt prediction model, the top four contributors were precipitation of the warmest quarter (Bio18, 30%), mean temperature of the driest quarter (Bio9, 24.4%), annual mean radiation (Bio20, 14.6%) and elevation (ele, 12.7%), with a cumulative contribution of 81.7%, and the remaining variables contributed a total of 18.3%. Bio18, Bio9, Bio20, and ele were also high in terms of permutation importance, the same as the percent contribution, which proved to be the greatest variables for its distribution.
It can be seen that the first contribution was Bio18, which meant precipitation of the warmest quarter played the foremost important role in defining the potential distribution of D. involucrata, which was similar to the previous research. According to the jackknife test, which was used to estimate the contribution of each factor to the distribution of D. involucrata, the mean temperature of the driest quarter (Bio9), mean diurnal range (Bio2), precipitation of the warmest quarter (Bio18), and annual mean radiation (Bio20) ran in the top four places in the regularized training gain and test gain (Figure 5). In particular, the environmental variable that decreased the gain the most when it is omitted is the mean temperature of the driest quarter (Bio9), which, therefore, appeared to have the most information that was not present in the other variables. Furthermore, the red band represented the performance of all the factors involved as a control group.
The relationship between factors and suitable areas was distinctly reflected by the single-factor response curve; meanwhile, we obtained the optimal range of values for the environmental variables from the jackknife test, which might clearly indicate the correlation between the probability of presence and environmental variables. Generally, it is believed that a probability of presence of >0.6 means the environmental factor is more conducive to species growth. According to the response curves of the main environmental factors for the suitable habitat of D. involucrata (Figure 6a–d), the optimum habitat conditions were as follows: precipitation of the warmest quarter (Bio18) was 480.24~1579.20 mm; mean temperature of the driest quarter (Bio9) was −0.36~8.14 °C; annual mean radiation (Bio20) was 115.99~136.70 W m−2d−1; and elevation (ele) was 722.76~2934.41 m.

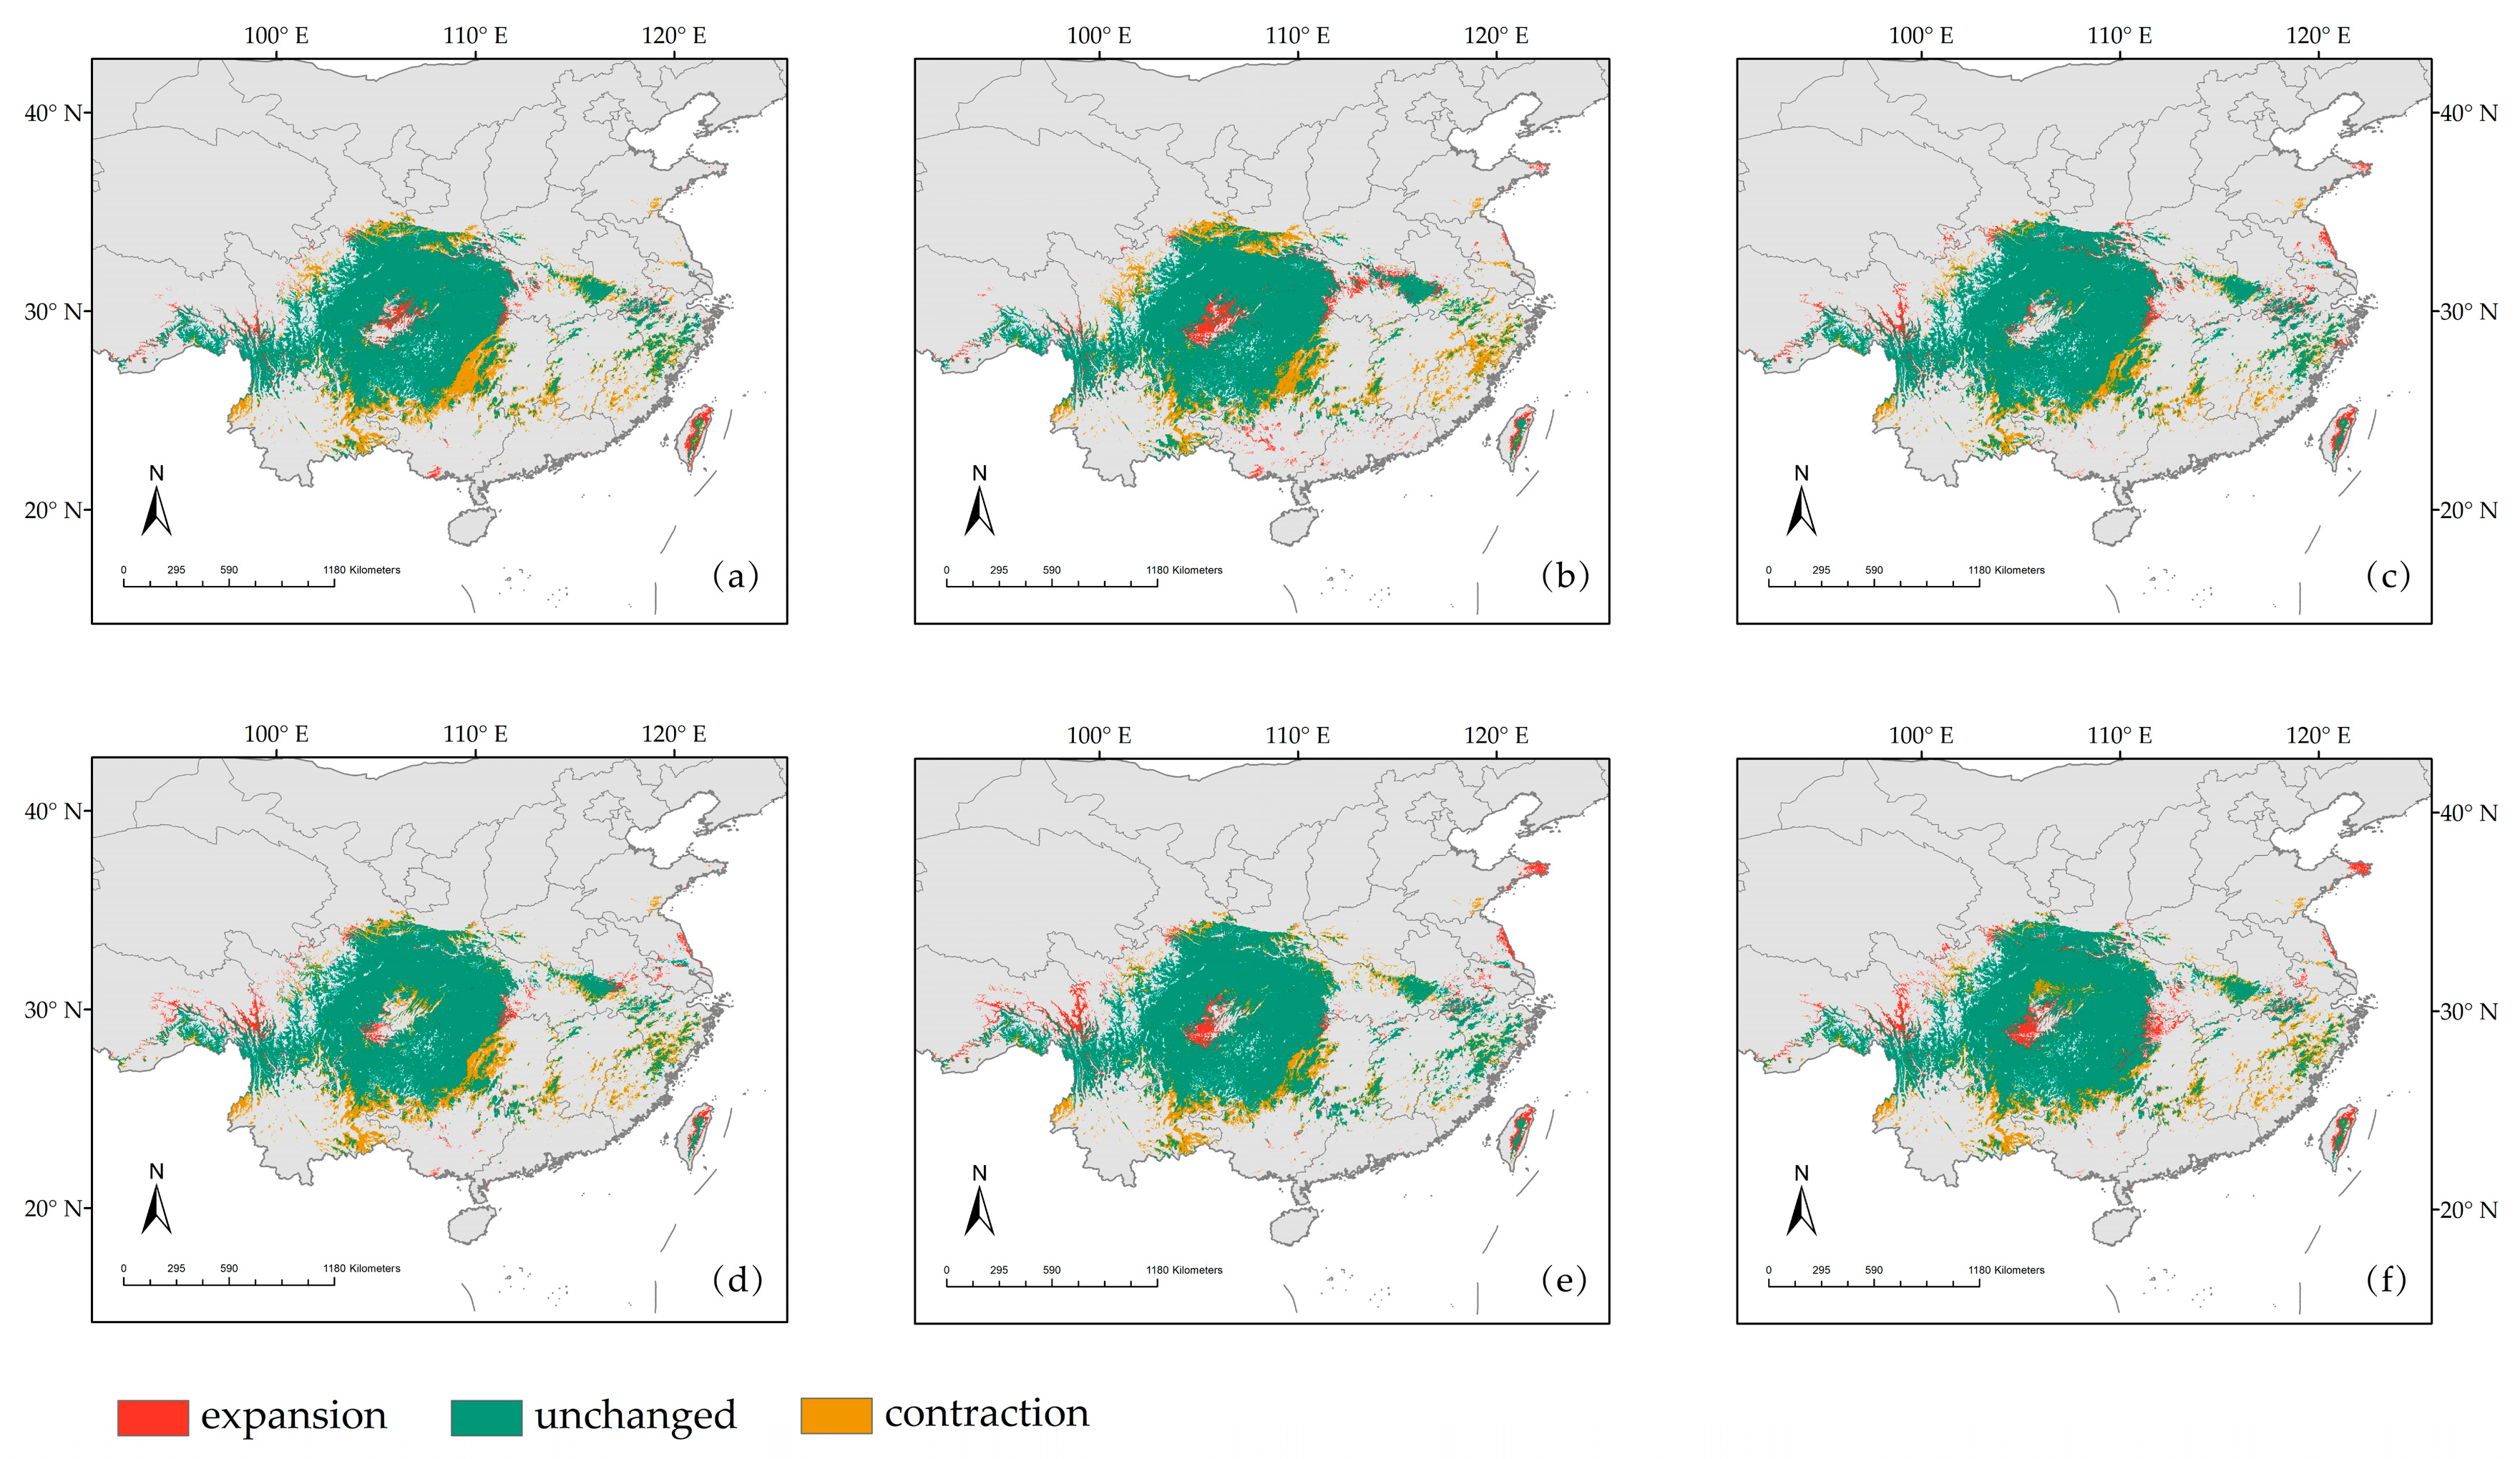
3.3. Potential Habitat Changes of D. involucrata under Current and Future Climate Scenarios

At present, the main distribution area of D. involucrata in China is 21°43′44″–32°38′17″ N, 98°18′8″–119°26′11″ E, with its potential habitat area being 98.02 × 10⁴ km2, which is mainly located in the mountainous regions of southwest China, particularly in Sichuan, Hubei, Guizhou, and other provinces (Figure 7 and Table 2). The high-suitable habitat areas were mainly distributed in the mountainous areas around the Sichuan Basin, namely, eastern Sichuan, western Hubei, northern Guizhou, northwestern Hunan, southern Shaanxi, western Anhui, and southeastern Tibet. The medium-suitable areas were mainly distributed in the marginal area of the above high-suitable areas. Meanwhile, the distribution span of the low-suitable habitats was large, including more provinces in southern China; in addition to the adjacent regions of high- and medium-suitability areas, Zhejiang, Fujian, Taiwan, and other coastal provinces were also distributed.
MaxEnt model was used to predict the potential habitat area of D. involucrata in China under six climate scenarios: 2050s (2041–2060) ssp126, 2050s ssp370, 2050s ssp585, 2070s (2061–2080) ssp126, 2070s ssp370, and 2070s ssp585. The results showed that the distribution of suitable areas for D. involucrata under future climate scenarios was slightly different from the current scenario (Figure 8a–f, Table 2).
We found that the total suitable habitat areas of D. involucrata would decrease in different degrees under future climate scenarios compared with the current scenario. These results indicated that future climate change will have negative effects on the habitat distribution of D. involucrata. In the climate scenario 2070s ssp126, the total suitable area experienced the largest decrease, reaching 14.01 × 10⁴ km2. In the 2050s ssp585 climate scenario, the total suitable area decreased the least, which was 5.76 × 10⁴ km2. In the future, under ssp370 climate scenarios, the total potential habitat areas of D. involucrata will decrease first and then increase, while under the ssp126 and ssp585 climate scenarios, the total potential habitat areas of D. involucrata gradually decrease. In the 2050s, the total potential habitat areas of D. involucrata were ssp585 > ssp370 > ssp126 under the three climate scenarios and ssp370 > ssp585 > ssp126 in the 2070s. Spectacularly, the potential suitable area of D. involucrata would always be large in the future climate scenario of ssp585. At the same time, under the current climate scenario, the proportion of low-suitability areas was the largest, followed by high-suitability, while the proportion of medium-suitability areas came at the end. In future climate scenarios, the proportion of high-suitability areas became the largest.
The area of suitable habitat for D. involucrata in China will generally shrink under the six climate scenarios in the future, with its reduction accompanied by the emergence of new suitable habitats and the loss of more old suitable habitats (Figure 9a–f and Table 3). Compared with the current climate, the 2070s ssp585 climate scenario possessed the largest new area, while the 2050s ssp585 climate scenario possessed the smallest loss area and the smallest overall rate of change. Under 2070s ssp585, the expansion and contraction areas were 9.62 × 10⁴ km2 and 16.58 × 10⁴ km2, with the increase and loss rates being 9.81% and 16.91%, respectively. Under 2050s ssp585, the expansion and contraction areas were 8.43 × 10⁴ km2 and 14.31 × 10⁴ km2, and the increase and loss rates were 8.60% and 14.60%. Spectacularly, the overall change rates were 7.10% and 6.00%. Under 2070s ssp126, the new area was the smallest, and the loss area was also high enough, resulting in the total change area becoming the largest. The increment rate, the loss rate, and the change rate were 6.40%, 20.88%, and 14.48%, respectively. The results proved that the suitable area of D. involucrata was most affected by environmental factors under this climate scenario.

4. Discussion

The influence of environmental factors on species distribution, particularly climatic factors, has emerged as a serious research topic in the context of global warming. Endangered plants are a key component of biodiversity, and their presence is indicative of healthy ecosystem services [77,78]. D. involucrata holds significant value for conservation and the economy as an endangered and unique tertiary relict plant in China. Comprehending its appropriate distribution is a prerequisite for the rational conservation and utilization of resources [79]. Our findings indicated that under current and future climate scenarios, the total potential habitat area of D. involucrata decreased apparently, which was aligned with the observations of other endangered species. Suitable habitats for numerous endangered species are expected to undergo varying degrees of reduction in the future, including Gastrodia elata (G. elata), Cathaya argyrophylla (C. argyrophylla), etc. For instance, Hu’s [80] findings demonstrated that the geographical distribution of G. elata would reduce in the future and move towards higher latitude regions. Zhao [81] explored C. argyrophylla and demonstrated that its habitat would be threatened in response to global warming and would decrease evidently. In light of the present circumstances, the primary communities of D. involucrata were sporadically distributed in mountainous areas with complex terrain and rich plant species, predominantly found growing on both sides of gullies in high mountains, influenced by the Quaternary glaciation [82]. We found that D. involucrata mainly inhabits the mountain systems surrounding the Sichuan Basin in southwest China, with the distribution of high-suitable habitats being the most concentrated. Areas with medium suitability are generally located around high-suitable areas, while low-suitable habitat areas are more widely dispersed. The results are in good agreement with the established distribution areas of D. involucrata [83].
In contrast to the representative concentration pathways (RCPs) in the CMIP5, the shared socioeconomic pathways (SSPs) were characterized by the integration of multiple factors, including population, technology, and economic growth. The SSPs, derived from the Coupled Model Intercomparison Project 6 (CMIP6), defined diverse baseline scenarios, incorporating the climate policies already adopted by individual countries, excluding the future climate policies resulting from international coordination. Additionally, it excluded the current commitments to future climate policies. Even in the absence of any climate policies, it has the potential for significantly varied emissions and warming scenarios in the future. As a result, certain climate models in CMIP6 exhibited a significantly higher level of sensitivity compared to those in CMIP5 [58]. We employed SSPs to forecast the potential habitat distribution of D. involucrata, which outperformed the RCPs by incorporating policy and other human-related variables to project future climate conditions.
The 19 bioclimatic factors and topographic factors, derived from the scenarios and models in CMIP6, were essential environmental factors. Among them, precipitation and temperature have a significant impact on the growth of endangered species. For instance, the mean precipitation of the coldest quarter has been identified as the most crucial factor influencing the distribution of Abies ziyuanensis (A. ziyuanensis) [84]. Xu’s [85] study determined that the mean temperature of the driest quarter accounted for 53.5% of the suitable habitat of Ginkgo biloba (G. biloba) in China. The analysis of the environmental factors in the model revealed that precipitation and temperature greatly influenced the distribution of potentially suitable areas for D. involucrata. Both excessively high and excessively low levels resulted in a near-zero probability of D. involucrata presence (Figure 6). Our findings demonstrated that the main limiting factors for D. involucrata were the precipitation of the warmest quarter (480.24~1579.20 mm), the mean temperature of the driest quarter (−0.36~8.14 °C), the annual mean radiation (115.99~136.70 W m−2d−1), and the elevation (722.76~2934.41 m). Previous studies have indicated that the net photosynthetic rate of D. involucrata seedlings significantly decreased under drought stress. Meanwhile, water stress restricts access to the resources required for photosynthesis due to stomatal closure and a reduction in internal water transport [86]. Prior research has demonstrated that a water deficiency could also limit the height and ground diameter of D. involucrata seedlings, thus impeding their growth [87]. Furthermore, low temperatures reduce the chlorophyll content in D. involucrata leaves and constrain stomatal growth, leading to a decline in both net photosynthetic and transpiration rates [88]. Peng [89] elucidated that as the temperature decreased, the activity of POD dropped while the Proline content increased. The application of polyamines (POD) has been found to effectively mitigate the impact of reactive oxygen species (ROS) in plants during adverse conditions. This process reduces the toxicity of harmful substances to living cells, thereby enhancing the plant’s ability to withstand stress. Additionally, the cold resistance of plants has been observed to be associated with the concentration of Proline [90]. Our findings were consistent with the aforementioned results, illustrating that it was not drought-tolerant and preferred a cool and humid environment [15].
The optimal altitude for D. involucrata is considered as 722.76~2934.41 m. Li speculated the augment of ultraviolet light intensity and the decrease in temperature at high altitudes might induce a decline in chlorophyll content in the leaves of D. involucrata, resulting in the minimization of the photosynthetic rate [91]. Moreover, solar radiation is one of the essential elements in plant growth. An inappropriate intensity will cause mild stress, leading to reduced photosynthesis efficiency [92]. In this study, we found that the annual mean radiation had an impressive impact on the distribution of D. involucrata. More adequate work should be conducted.
Climate change will have diverse effects on species. In our study, we utilized the MaxEnt model to predict the potential habitat area and distribution pattern of D. involucrata under current and future climate scenarios. The potential habitat area of D. involucrata decreases in the future, indicating that the species may encounter less favorable habitat conditions in the long term. Under the ssp585 climate scenarios, the increment of suitable areas was the most significant, while a reduction in suitable areas was the least pronounced. This suggested that the rise in radiative forcing did not necessarily lead to a decrease in potentially suitable habitats.
Although the habitats predicted by the MaxEnt model in this study were remarkable, the risk of errors and boundedness still exist due to the lack of occurrence coordinates and the limited selection of environmental variables. We selected bioclimate, terrain, and soil factors to speculate and establish the regions suitable for growth. Nevertheless, these cannot be treated as entirely comprehensive or as objective results. The potential habitat distribution of D. involucrata under different climate scenarios will ultimately depend on national policies, human activities, and other contributing factors. For example, D. involucrata, a large deciduous tree, is often intermixed with other broad-leaved tree species [93]. The rhizosphere effect and interspecific interactions within the community may also influence the growth and distribution of the community [94]. Therefore, appropriate strategies should be formulated for protecting its original community. Simultaneously, decision-makers need to plan and establish nature reserves following the actual local conditions, which is the principal method to protect endangered species. Priority should be given to areas where current climate scenarios overlap with potentially suitable areas under future climate scenarios [95]. For the low habitat area suitable for the growth of D. involucrata, there are further reasons to introduce policy according to the predicted results under different scenarios and the actual local conditions. It is of great significance to track and monitor the existing population or community on the basis of the possible changes in the distribution area of it. In addition, artificial breeding of D. involucrata seedlings should be considered in the future to enhance the quality of its germplasm resources. These efforts will help D. involucrata better adapt to the changing climate scenarios in the future. Further study is needed to examine other factors and relevant mechanisms of action in detail.

5. Conclusions

Estimating how climate change will affect the distribution of suitable habitats for D. involucrata is of paramount importance for conservation. The results indicated that under the current climate scenario, the species was primarily concentrated in eastern Sichuan, western Hubei, northern Guizhou, and northwestern Hunan, with a total area of 102.42 × 10⁴ km2. Precipitation of the warmest quarter, mean temperature of the driest quarter, elevation, and annual mean radiation were the dominant environmental variables. Under various future climate scenarios, the potential suitable habitat areas decreased. In addition, under the 2050s ssp370 scenario, the loss of potentially suitable areas was the largest in comparison with other climate scenarios. Therefore, original community protection of D. involucrata should be carried out in the high-suitable area in future work. Meanwhile, areas with low suitability require enhanced preservation and collection of germplasm resources. Our findings can provide a scientific basis for the conservation and resource utilization of D. involucrata.

Author Contributions

Conceptualization, T.W., W.L. and H.C.; Methodology, T.W. and W.L.; Software, T.W., L.F. and Y.J.; Data curation, T.W., Y.W. and L.F.; Formal analysis, W.L., Y.S. and Y.J.; Validation, H.C., C.L. and Q.Y.; Investigation, Y.S., C.L. and Q.Y.; writing—original draft preparation, T.W.; writing—review and editing, Y.W. and L.Q.; Visualization, H.C. and Y.S.; Supervision, L.Q. and H.C.; Funding acquisition, C.L. and Q.Y. All authors have read and agreed to the published version of the manuscript.

Funding

This research was funded by the Investigation Project of the Davidia involucrata and Fagus longipetiolata Plant Community (Hubei Qizimeishan National Nature Reserve Administration, WUXLH—202310—810).

Data Availability Statement

The data presented in this study are available on request from the corresponding author.

Acknowledgments

We sincerely thank the editor and anonymous reviewers for their valuable comments and suggestions to improve the quality of this paper.

Conflicts of Interest

The authors declare no conflicts of interest.

References

  1. Ginbo, T. Heterogeneous impacts of climate change on crop yields across altitudes in Ethiopia. Clim. Chang. 2022, 170, 12. [Google Scholar] [CrossRef]
  2. Schnitter, R.; Berry, P. The Climate Change, Food Security and Human Health Nexus in Canada: A Framework to Protect Population Health. Int. J. Environ. Res. Public Health 2019, 16, 2531. [Google Scholar] [CrossRef] [PubMed]
  3. Bradshaw, C.J.A.; Ehrlich, P.R.; Beattie, A.; Ceballos, G.; Crist, E.; Diamond, J.; Dirzo, R.; Ehrlich, A.H.; Harte, J.; Harte, M.E.; et al. Underestimating the challenges of avoiding a ghastly future. Front. Conserv. Sci. 2021, 1, 615419. [Google Scholar] [CrossRef]
  4. Ceballos, G.; Ehrlich, P.R.; Barnosky, A.D.; García, A.; Pringle, R.M.; Palmer, T.M. Accelerated modern human–induced species losses: Entering the sixth mass extinction. Sci. Adv. 2015, 1, e1400253. [Google Scholar] [CrossRef]
  5. Sanderson, E.W.; Jaiteh, M.; Levy, M.A.; Redford, K.H.; Wannebo, A.V.; Woolmer, G. The human footprint and the last of the wild: The human footprint is a global map of human influence on the land surface, which suggests that human beings are stewards of nature, whether we like it or not. Bioscience 2002, 52, 891–904. [Google Scholar] [CrossRef]
  6. Wilson, R.J.; Gutiérrez, D.; Gutiérrez, J.; Martínez, D.; Agudo, R.; Monserrat, V.J. Changes to elevational limits and extent of species ranges associated with climate change. Ecol. Lett. 2005, 8, 1138–1146. [Google Scholar] [CrossRef] [PubMed]
  7. Walther, G.R.; Beißner, S.; Burga, C.A. Trends in the upward shift of alpine plants. J. Veg. Sci. 2005, 16, 541–548. [Google Scholar] [CrossRef]
  8. Colwell, R.K.; Brehm, G.; Cardelús, C.L.; Gilman, A.C.; Longino, J.T. Global warming, elevational range shifts and lowland biotic attrition in the wet tropics. Science 2008, 322, 258–261. [Google Scholar] [CrossRef]
  9. Thomas, J.A.; Telfer, M.G.; Roy, D.B.; Preston, C.D.; Greenwood, J.J.D.; Asher, J.; Fox, R.; Clarke, R.T.; Lawton, J.H. Comparative losses of British butterflies, birds and plants and the global extinction crisis. Science 2004, 303, 1879–1881. [Google Scholar] [CrossRef]
  10. Zhang, G.; Zeng, G.; Yang, X.; Jiang, Z. Future Changes in Extreme High Temperature over China at 1.5 °C–5 °C Global Warming Based on CMIP6 Simulations. Adv. Atmos. Sci. 2021, 38, 253–267. [Google Scholar] [CrossRef]
  11. Moraitis, M.L.; Valavanis, V.D.; Karakassis, I. Modelling the effects of climate change on the distribution of benthic indicator species in the Eastern Mediterranean Sea. Sci. Total Environ. 2019, 667, 16–24. [Google Scholar] [CrossRef]
  12. Wang, B.; Deveson, E.D.; Waters, C.; Spessa, A.; Lawton, D.; Feng, P.Y.; Liu, D.L. Future climate change likely to reduce the Australian plague locust (Chortoicetes terminifera) seasonal outbreaks. Sci. Total Environ. 2019, 668, 947–957. [Google Scholar] [CrossRef]
  13. Wilson, K.L.; Skinner, M.A.; Lotze, H.K. Projected 21st-century distribution of canopy-forming seaweeds in the Northwest Atlantic with climate change. Divers. Distrib. 2019, 25, 582–602. [Google Scholar] [CrossRef]
  14. Liu, M.; Wen, J.H.; Xu, W.J.; Chen, Y.M.; Ma, Z.L. The Impact of Nitrogen Application on Leaf and Root Functional Traits of Davidia involucrata Saplings. Forests 2023, 14, 1668. [Google Scholar] [CrossRef]
  15. Tang, C.; Dong, Y.F.; Herrando-Moraira, S.; Matsui, T.; Ohashi, H.; He, L.Y.; Nakao, K.; Tanaka, N.; Tomita, M.; Li, X.S.; et al. Potential effects of climate change on geographic distribution of the Tertiary relict tree species Davidia involucrata in China. Sci. Rep. 2017, 7, 43822. [Google Scholar] [CrossRef] [PubMed]
  16. Fu, L.G.; Jin, J.M. China Plant Red Data Book: Rare and Endangered Plants; Science Press: Beijing, China, 1992; Volume 1, pp. 350–351. [Google Scholar]
  17. Li, G.L.; Cao, C.X.; Yang, H.; Wang, J.H.; Wei, W.; Zhu, D.H.; Gao, P. Molecular cloning and potential role of DiSOC1s in flowering regulation in Davidia involucrata Baill. Plant Physiol. Biochem. 2020, 157, 453–459. [Google Scholar] [CrossRef] [PubMed]
  18. Ma, J.; Deng, H.Z.; Chao, Z.; Liu, C.M.; Zhao, H.W. Medicinal plant resources of the Chinese endemic genera of seed plants. China J. Chin. Mater. Med. 2004, 29, 123–129. [Google Scholar] [CrossRef]
  19. Xiang, G.Q.; Lu, F.S. Study on chemical components of Davidia involucrata Baill. native to China. J. Integr. Plant Biol. 1989, 31, 540–543. [Google Scholar]
  20. Fan, X.M. Extraction, Separation and Activity Study of Tannin of Patrinia villosa Juss; Zhejiang University: Hangzhou, China, 2014. [Google Scholar]
  21. Dai, Y. Effects of Plant Sterol on Plasma Lipids and Liver Lipids in High-Fat Diet Rat; Fourth Military Medical University: Xi’an, China, 2010. [Google Scholar]
  22. Zhou, M.; Zhang, R.H.; Wang, M.; Xu, G.B.; Liao, S.G. Prodrugs of triterpenoids and their derivatives. Eur. J. Med. Chem. 2017, 131, 222–236. [Google Scholar] [CrossRef] [PubMed]
  23. Yu, Y.T.; Xu, G.B.; Wang, X.P. Literature Review of Research on Davidia involucrata Baill. Nonwood For. Res. 2006, 24, 92–94, 98. [Google Scholar] [CrossRef]
  24. Wu, Y.; Rong, R.; Chen, F.; Xu, Y. Effect of light quality on morphogenesis and photosynthetic characteristics of Davidia involucrata seedings. J. Sichuan Univ. Nat. Sci. Ed. 2020, 57, 804–810. [Google Scholar] [CrossRef]
  25. Xiong, Y.L.; Cao, F.X.; Liu, Z.M.; Dong, X.J.; Li, M. Cloning and expression analysis of Ces A genes involved in seed abortion in dove tree (Davidia involucrate). J. Plant Physiol. 2016, 52, 1481–1490. [Google Scholar] [CrossRef]
  26. Lei, N.; Peng, S.; Niu, B.; Chen, J.; Zhou, J.; Tang, L.; Xu, Y.; Wang, S.; Chen, F. Molecular cloning and characterization of a novel microsomal oleate desaturase gene DiFAD2 from Davidia involucrata Baill. Biol. Plant. 2010, 54, 41–46. [Google Scholar] [CrossRef]
  27. Wei, X.R.; Ding, H.F.; Fan, Y.L.; Wu, X.M.; Liu, X.D.; Niu, J.; Cao, F.X.; Li, M. Overexpression of a laccase gene, DiLAC17, from Davidia involucrata causes severe seed abortion in Arabidopsis. Plant Physiol. Biochem. 2023, 202, 107956. [Google Scholar] [CrossRef] [PubMed]
  28. Liu, H.Y.; Jin, X.L.; Shen, S.Y.; Zhang, R.Q. Population quantitative characteristics and dynamics of rare and endangered plant Davidia involucrata in Hunan Province. Acta Ecol. Sin. 2012, 32, 7738–7746+5. [Google Scholar] [CrossRef]
  29. Su, R.J.; Wu, Q.G.; Yang, Y.L.; Hu, T.X. Relationship between Diameter at Breast Height and Tree Age in Populations of a Rare and Endangered Plant, Davidia involucrata. Pol. J. Ecol. 2021, 69, 84–95. [Google Scholar] [CrossRef]
  30. Yang, S.X.; Zhang, J. The Study on Davidia involucrata Community in the Seven-Sisters Mountain Nature Reserve. J. Shandong For. Sci. Technol. 2015, 45, 69–71+65. [Google Scholar] [CrossRef]
  31. Chen, L.X.; He, M.X.; Wang, B.; Tan, J.B.; Huang, Y.H.; Ran, J.H. Analysis of suitable habitat distribution and its influence factors of Davidia involucrata in Liangshan Mountains based on Maxent model. J. Sichuan Univ. Nat. Sci. Ed. 2018, 55, 873–880. [Google Scholar] [CrossRef]
  32. Zhang, X.Y.; Zhou, R.H.; Yu, F.Y.; Ye, X.; Wang, M.; Qi, J.Q.; Hao, J.F. Flora, structure, and dynamics of Davidia involucrata community in Daxiangling Nature Reserve. Chin. J. Ecol. 2020, 39, 1509–1517. [Google Scholar] [CrossRef]
  33. Stockwell, D.R.; Peterson, A. Effects of sample size on accuracy of species distribution models. Ecol. Model. 2002, 148, 1–13. [Google Scholar] [CrossRef]
  34. Hirzel, A.H.; Hausser, J.; Perrin, D.C. Ecological-Niche Factor Analysis: How to compute habitat-suitability maps without absence data? Ecology 2002, 83, 2027–2036. [Google Scholar] [CrossRef]
  35. Haase, C.G.; Yang, A.N.; McNyset, K.M.; Blackburn, J.K. GARPTools: R software for data preparation and model evaluation of GARP models. Ecography 2021, 44, 1790–1796. [Google Scholar] [CrossRef]
  36. Semwal, D.P.; Pandey, A.; Gore, P.G.; Ahlawat, S.P.; Yadav, S.K.; Kumar, A. Habitat prediction mapping using BioClim model for prioritizing germplasm collection and conservation of an aquatic cash crop ‘makhana’ (Euryale ferox Salisb.) in India. Genet. Resour. Crop. Evol. 2021, 68, 3445–3456. [Google Scholar] [CrossRef]
  37. Ma, R.M.; Ban, J.; Wang, Q.; Zhang, Y.Y.; Yang, Y.; Li, S.S.; Shi, W.J.; Zhou, Z.; Zang, J.W.; Li, T.T. Full-coverage 1km daily ambient PM2.5 and O3 concentration of China in 2005-2017 based on a multi-variable random forest model. Earth Syst. Sci. Data 2022, 14, 943–954. [Google Scholar] [CrossRef]
  38. Beck, H.E.; Zimmermann, N.E.; McVicar, T.R.; Vergopolan, N.; Berg, A.; Wood, E.F. Present and future Köppen–Geiger climate classifcation maps at 1-km resolution. Sci. Data 2018, 5, 180214. [Google Scholar] [CrossRef] [PubMed]
  39. Song, X.Y.; Milne, R.I.; Fan, X.Y.; Xie, S.Y.; Lei, Z.; Zheng, H.L.; Fan, L.Q.; Chung, J.M.; Chuang, M.G.; Ma, T.; et al. Blow to the Northeast? Intraspecifc differentiation of Populus davidiana suggests a north-eastward skew of a phylogeographic break in East Asia. J. Biogeogr. 2020, 48, 187–201. [Google Scholar] [CrossRef]
  40. Anand, V.; Oinam, B.; Singh, I.H. Predicting the current and future potential spatial distribution of endangered Rucervus eldii eldii (Sangai) using Maxent model. Environ. Monit. Assess. 2021, 193, 147. [Google Scholar] [CrossRef] [PubMed]
  41. Zhang, Y.; Tang, J.S.; Ren, G.; Zhao, K.X.; Wang, X.F. Global potential distribution prediction of Xanthium italicum based on Maxent model. Sci. Rep. 2021, 11, 16545. [Google Scholar] [CrossRef]
  42. Liu, J.M.; Xu, Y.Y.; Sun, C.W.; Wang, X.; Zheng, Y.L.; Shi, S.L.; Chen, Z.; He, Q.Y.; Weng, X.H.; Jia, L.M. Distinct ecological habits and habitat responses to future climate change in three east and southeast Asian Sapindus species. For. Ecol. Manag. 2022, 507, 119982. [Google Scholar] [CrossRef]
  43. Karuppaiah, V.; Maruthadurai, R.; Das, B.; Soumia, P.S.; Gadge, A.S.; Thangasamy, A.; Ramesh, S.V.; Shirsat, D.V.; Mahajan, V.; Krishna, H.; et al. Predicting the potential geographical distribution of onion thrips, Thrips tabaci in India based on climate change projections using MaxEnt. Sci. Rep. 2023, 13, 7934. [Google Scholar] [CrossRef] [PubMed]
  44. Cui, L.; Berger, U.; Cao, M.; Zhang, Y.; He, J.; Pan, L.; Jiang, J. Conservation and Restoration of Mangroves in Response to Invasion of Spartina alterniflora Based on the MaxEnt Model: A Case Study in China. Forests 2023, 14, 1220. [Google Scholar] [CrossRef]
  45. Wang, X.F.; Duan, Y.X.; Jin, L.L.; Wang, C.Y.; Peng, M.C.; Li, Y.; Wang, X.H.; Ma, Y.F. Prediction of historical, present and future distribution of Quercus sect. Heterobalanus based on the optimized MaxEnt model in China. Acta Ecol. Sin. 2023, 43, 6590–6604. [Google Scholar]
  46. Wu, C.; Chen, D.; Shen, J.; Sun, X.; Zhang, S. Estimating the distribution and productivity characters of Larix kaempferi in response to climate change. J. Environ. Manag. 2021, 280, 111633. [Google Scholar] [CrossRef]
  47. Ma, Y.F.; Li, J.Q. Population structure of Davidia involucrata in Mt. Seven-sister Nature Reserve of central China’s Hubei Province. J. Beijing For. Univ. 2005, 27, 12–16. [Google Scholar] [CrossRef]
  48. Zhang, W.; Cao, G.X.; Liu, G.H.; Liu, X. Population structure and distribution pattern of Davidia involucrata at Labahe Nature Reserve of Sichuan Province. J. Zhejiang For. Coll. 2008, 25, 451–457. [Google Scholar] [CrossRef]
  49. Wu, M.K.; Shen, Z.J.; Liu, H.; Wu, Y.Y.; He, R.T.; Qiu, Y.; Yang, N.; Yang, N. Life table and survival analysis of nature Davidia involucrata population in Fanjing Mountain Nature Reserve, Guizhou Province of Southwest China. Chin. J. Ecol. 2012, 31, 1419–1424. [Google Scholar] [CrossRef]
  50. Wang, D.S.; Zhao, W.; Cheng, B.B.; Zhang, J.J. Potential Suitable Areas of Crataegus pinnatifida in China based on MaxEnt Modeling. Sci. Silvae Sin. 2022, 58, 43–50. [Google Scholar] [CrossRef]
  51. Brown, J.L.; Bennett, J.R.; French, C.M. SDMtoolbox 2.0: The next generation Python-based GIS toolkit for landscape genetic, biogeographic and species distribution model analyses. Peerj 2017, 5, e4095. [Google Scholar] [CrossRef] [PubMed]
  52. Liu, Y.; Fang, Y.; Zhang, Y.; Wang, Z.M.; Ma, J.; Gao, J.; Yang, D.G.; Wei, Y.D.; Kang, F.F. Prediction of the Potential Geographical Distribution of Solanum sisymbriifolium in China. Plant Quar. 2023, 37, 52–56. [Google Scholar] [CrossRef]
  53. Wei, J.F.; Li, X.Z.; Lu, Y.Y.; Zhao, L.; Zhang, H.F.; Zhao, Q. Modeling the potential global distribution of Phenacoccus madeirensis Green under Various Climate Change Scenarios. Forests 2019, 10, 773. [Google Scholar] [CrossRef]
  54. Zhang, Y.F.; Chen, S.T.; Gao, Y.; Yang, L.; Yu, H. Prediction of global potential suitable habitats of Nicotiana alata Link et Otto based on MaxEnt model. Sci. Rep. 2023, 13, 4851. [Google Scholar] [CrossRef]
  55. Fick, S.E.; Hijmans, R.J. WorldClim2: New 1-km spatial resolution climate surfaces for global land areas. Int. J. Climatol. 2017, 37, 4302–4315. [Google Scholar] [CrossRef]
  56. Zhang, W.P.; Hu, Y.Y.; Li, Z.H.; Feng, X.P.; Li, D.W. Predicting suitable distribution areas of Juniperus przewalskii in Qinghai Province under climate change scenarios. J. Appl. Ecol. 2021, 32, 2514–2524. [Google Scholar] [CrossRef]
  57. Jiang, C.X.; Zhang, X.Y.; Xie, W.Q.; Wang, R.L.; Feng, C.H.; Ma, L.; Li, Q.; Yang, Q.F.; Wang, H.J. Predicting the potential distribution of the fall armyworm Spodoptera frugiperda (J.E. Smith) under climate change in China. Glob. Ecol. Conserv. 2022, 33, e01994. [Google Scholar] [CrossRef]
  58. Hausfather, Z. Explainer: How ‘Shared Socioeconomic Pathways’ Explore Future Climate Change. Carbon Brief (19 April 2018). Available online: https://www.carbonbrief.org/explainer-how-shared-socioeconomic-pathways-explore-future-climate-change/ (accessed on 8 September 2023).
  59. Wu, Y.X.; Zhang, M.; Yang, Y.; Lyu, Z.M.; Zhang, X.Q.; Wang, L.S. Effects of Climate Changes on the Distribution of Osmanthus fragrans. J. Northwest For. Univ. 2022, 37, 129–134. [Google Scholar] [CrossRef]
  60. Teng, J.; Li, H.; Lu, S.F.; Yin, X.J.; Li, G.; Chen, Z.; Wang, Y. Responses of Cold-Temperate Coniferous Forest to Climate Change in Southwestern China. J. Northwest For. Univ. 2023, 38, 33–44. [Google Scholar]
  61. Fischer, G.; Nachtergaele, F.O.; Prieler, S.; Teixeira, E.; van Velthuizen, H.; Verelst, L.; Wiberg, D. Global Agro-Ecological Zones Assessment for Agriculture (GAEZ 2008); IIASA: Laxenburg, Austria; FAO: Rome, Italy, 2008. [Google Scholar]
  62. Kriticos, D.J.; Webber, B.L.; Leriche, A.; Ota, N.; Macadam, I.; Bathols, J.; Scott, J.K. CliMond: Global high-resolution historical and future scenario climate surfaces for bioclimatic modelling. Methods Ecol. Evol. 2011, 3, 53–64. [Google Scholar] [CrossRef]
  63. Guo, Y.L.; Li, X.; Zhao, Z.F.; Wei, H.Y.; Gao, B.; Gu, W. Prediction of the potential geographic distribution of the ectomycorrhizal mushroom Tricholoma matsutake under multiple climate change scenarios. Sci. Rep. 2017, 7, 46221. [Google Scholar] [CrossRef] [PubMed]
  64. Xu, W.; Jin, J.W.; Cheng, J.M. Predicting the potential geographic distribution and habitat suitability of two economic forest trees on the Loess Plateau, China. Forests 2021, 12, 747. [Google Scholar] [CrossRef]
  65. Dormann, C.F.; Elith, J.; Bacher, S.; Buchmann, C.; Carl, G.; Carré, G.; Marquéz, J.R.G.; Gruber, B.; Lafourcade, B.; Leitão, P.J.; et al. Collinearity: A review of methods to deal with it and a simulation study evaluating their performance. Ecography 2013, 36, 27–46. [Google Scholar] [CrossRef]
  66. Guevara, L.; Gerstner, B.E.; Kass, J.M.; Anderson, R.P. Toward ecologically realistic predictions of species distributions: A cross-time example from tropical montane cloud forests. Glob. Chang. Biol. 2018, 24, 1511–1522. [Google Scholar] [CrossRef]
  67. Yackuic, C.B.; Chandler, R.; Zipkin, E.F.; Royle, J.A.; Nichols, J.D.; Campbell Grant, E.H.; Veran, S. Presence-only modelling using MAXENT: When can we trust the inferences? Methods Ecol. Evol. 2013, 4, 236–243. [Google Scholar] [CrossRef]
  68. Muscarella, R.; Galante, P.J.; Soley-Guardia, M.; Boria, R.A.; Kass, J.; Uriarte, M.; Anderson, R.P. ENMeval: An R package for conducting spatially independent evaluations and estimating optimal model complexity for Maxent ecological niche models. Methods Ecol. Evol. 2014, 5, 1198–1205. [Google Scholar] [CrossRef]
  69. Wang, R.; Jiang, C.; Liu, L.; Shen, Z.; Yang, J.; Wang, Y.; Hu, J.; Wang, M.; Hu, J.; Lu, X.; et al. Prediction of the potential distribution of the predatory mite Neoseiulus californicus McGregor in China using MaxEnt. Glob. Ecol. Conserv. 2021, 29, e01733. [Google Scholar] [CrossRef]
  70. Porfirio, L.L.; Harris, R.M.B.; Lefroy, E.C.; Hugh, S.; Gould, S.F.; Lee, G.; Bindoff, N.L.; MacKey, B. Improving the use of species distribution models in conservation planning and management under climate change. PLoS ONE 2014, 9, e113749. [Google Scholar] [CrossRef] [PubMed]
  71. Somodi, I.; Lepesi, N.; Botta-Dukát, Z. Prevalence dependence in model goodness measures with special emphasis on true skill statistics. Ecol. Evol. 2017, 7, 863–872. [Google Scholar] [CrossRef] [PubMed]
  72. Lobo, J.M.; Jiménez-Valverde, A.; Real, R. AUC: A misleading measure of the performance of predictive distribution models. Glob. Ecol. Biogeogr. 2008, 17, 145–151. [Google Scholar] [CrossRef]
  73. Sánchez-Mercado, A.Y.; Ferrer-Paris, J.R. Mapping Species Distributions: Spatial Inference and Prediction; Cambridge University Press: Cambridge, UK, 2011; Volume 86, pp. 219–220. [Google Scholar] [CrossRef]
  74. Thapa, A.; Wu, R.D.; Hu, Y.B.; Nie, Y.G.; Singh, P.B.; Khatiwada, J.R.; Yan, L.; Gu, X.D.; Wei, F.W. Predicting the potential distribution of the endangered red panda across its entire range using MaxEnt modeling. Ecol. Evol. 2018, 8, 10542–10554. [Google Scholar] [CrossRef] [PubMed]
  75. Zarzo-Arias, A.; Penteriani, V.; Delgado, M.D.M.; Peón Torre, P.; García-González, R.; Mateo-Sánchez, M.C.; Vázquez García, P.; Dalerum, F. Identifying potential areas of expansion for the endangered brown bear (Ursus arctos) population in the Cantabrian Mountains (NW Spain). PLoS ONE 2019, 14, e0209972. [Google Scholar] [CrossRef] [PubMed]
  76. Zhang, K.L.; Yao, L.J.; Meng, J.S.; Tao, J. MaxEnt modeling for predicting the potential geographical distribution of two peony species under climate change. Sci Total Environ. 2018, 634, 1326–1334. [Google Scholar] [CrossRef] [PubMed]
  77. Leitão, R.P.; Zuanon, J.; Villéger, S.; Williams, S.; Baraloto, C.; Fortunel, C.; Mendonça, F.; Mouillot, D. Rare species contribute disproportionately to the functional structure of species assemblages. Proc. Biol. Sci. 2016, 283, 20160084. [Google Scholar] [CrossRef] [PubMed]
  78. Dee, L.E.; Cowles, J.; Isbell, F.; Pau, S.; Gaines, S.D.; Reich, P.B. When do ecosystem services depend on rare species? Trends Ecol. Evol. 2019, 34, 746–758. [Google Scholar] [CrossRef] [PubMed]
  79. Girona, M.M.; Aakala, T.; Aquilué, N.; Bélisle, A.C.; Chaste, E.; Danneyrolles, V.; Díaz-Yáñez, O.; D’Orangeville, L.; Grosbois, G.; Gauthier, S.; et al. Challenges for the Sustainable Management of the Boreal Forest Under Climate Change. In Boreal Forests in the Face of Climate Change: Sustainable Management; Springer International Publishing: Cham, Switzerland, 2023; pp. 773–837. [Google Scholar] [CrossRef]
  80. Hu, J.; Feng, Y.; Zhong, H.; Liu, W.; Tian, X.; Wang, Y.; Tan, T.; Hu, Z.; Liu, Y. Impact of climate change on the geographical distribution and niche dynamics of Gastrodia elata. PeerJ 2023, 11, e15741. [Google Scholar] [CrossRef] [PubMed]
  81. Zhao, H.X. Response of Potential Geographical Distribution of Eight China’s First-Class Rare and Endangered Plants to Climate Change and Analysis of GAP; Northwest Normal University: Lanzhou, China, 2021. [Google Scholar] [CrossRef]
  82. Liu, H.Y.; Jin, X.L.; Xue, H.W.; Luo, X.M.; Zhang, R.Q. Research Progress on Community Characteristics and Population Ecology of Davidia involucrata Baill. Chin. Agric. Sci. Bull. 2012, 28, 1–4. [Google Scholar] [CrossRef]
  83. Su, Z.X.; Zhang, S.L. The reproductive Phenology and the Influencing Factors of Davidia involucrata Population. J. China West Norm. Univ. Nat. Sci. 1999, 20, 313–318. [Google Scholar] [CrossRef]
  84. Li, S.; Mo, S.; Hu, X.H.; Deng, T. Prediction of potential suitable areas of endangered plant Abies ziyuanensis based on MaxEnt and ArcGIS. Chin. J. Ecol. 2023, 1–11. Available online: http://kns.cnki.net/kcms/detail/21.1148.Q.20230311.1445.004.html (accessed on 20 October 2023).
  85. Xu, Y. Predicting the Suitable Habitats of Relic Plants Ginkgo biloba and Davidia involucrate; North China Electric Power University: Beijing, China, 2019. [Google Scholar] [CrossRef]
  86. Sun, Y.A.; Wang, C.T.; Chen, H.Y.H.; Ruan, H.H. Response of Plants to Water Stress: A Meta-Analysis. Front. Plant Sci. 2020, 11, 978. [Google Scholar] [CrossRef]
  87. Jiang, R.F.; Liu, Y.H. Effects of Soil Matrix and Moisture on the Growth of Davidia involucrata Seedlings. J. Northwest For. Univ. 2016, 31, 134–139+164. [Google Scholar] [CrossRef]
  88. Ding, K.Y.; Liu, Y.H. Effects of Nitrogen and Continuous Ngihttime Low Temperature on Photosynthetic Characteristics of Davidia involucrata Leaves. J. Northeast. For. Univ. 2015, 43, 56–61. [Google Scholar] [CrossRef]
  89. Peng, H.L.; Su, Z.X. Effects of Low Temperature Stress on the Activity of Perox Dase, the Content of Chlorophyll and Free Proline in Davidia involucrata Seedling. J. Hanzhong Teach. Coll. Nat. Sci. 2004, 22, 50–53. [Google Scholar] [CrossRef]
  90. Zeng, R.; Ma, L.; Wu, J.Y.; Yang, G.; Zhang, N.; Xu, J.; Zhu, M.C.; Ma, M.; Tao, X.L.; Li, X.C.; et al. Relationship between withered leaf stage and cold resistance of winter Brassica rapa under low temperature stress. Chin. J. Oil Crop Sci. 2023, 45, 766–775. [Google Scholar] [CrossRef]
  91. Li, L.B.; Huang, G.Y.; Wu, D.; Zhang, H.B.; Wang, X.Y.; Wang, L.; Wu, J.H. Responses of Davidia involucrata Leaves to Different Elevations on Physiological Indices and Photosynthetic Characteristics. Mol. Plant Breed. 2023, 1–10. Available online: http://kns.cnki.net/kcms/detail/46.1068.S.20230228.0938.006.html (accessed on 20 October 2023).
  92. Wang, N.N. Responses of Photosynthetic Characteristics of Davidia involucrata Baill. Seedlings to Drought Stress, Shading and Carbon Dioxide Elevation; Beijing Forestry University: Beijing, China, 2010. [Google Scholar]
  93. Liu, Y.; Wang, Y.R.; Hou, G.W.; Liu, X.A.; Chen, C.; Xiao, X.Y.; Wang, H.Q. Analysis of Natural Population Dynamics of Davidia involucrata in Bayuelin Nature Reserve. J. Sichuan For. Sci. Technol. 2018, 39, 87–90. [Google Scholar] [CrossRef]
  94. Yin, L.M.; Dijkstra, F.A.; Wang, P.; Zhu, B.; Cheng, W. Rhizosphere priming effects on soil carbon and nitrogen dynamics among tree species with and without intraspecific competition. New Phytol. 2018, 218, 1036–1048. [Google Scholar] [CrossRef]
  95. Zhang, Y.; Zhang, J.; Tian, L.; Huang, Y.; Shao, C. The Ginkgo biloba L. in China: Current Distribution and Possible Future Habitat. Forests 2023, 14, 2284. [Google Scholar] [CrossRef]
Figure 1. Distribution records and study regions of D. involucrata.
Forests 15 00272 g001
Figure 2. Environmental variables correlation test (The names of all the variables are summarized in Table 1).
Forests 15 00272 g002
Figure 3. The output of MaxEnt models optimization using different combinations of regularization multipliers and feature classes (rm: regularization multiplier; fc: feature combination; L: linear features; H: hinge features; Q: quadratic features; P: product features; T: threshold features; AUC: the area under the subject curve; AICc: the Akaike information criterion corrected; auc_diff_avg: average difference between the training and testing AUC; auc_val_avg: average AUC calculated on the validation datasets; delta.AICc: the minimum information criterion AICc value; or_10p_avg: mean value of 10% training omission rate).
Forests 15 00272 g003
Figure 4. Receiver operating characteristic (ROC) curve and the area under the subject curve (AUC) of the MaxEnt model. The red curve indicates training data, the blue curve indicates test data, and the black line indicates random prediction.
Forests 15 00272 g004
Figure 5. Important analysis of environmental variables based on jackknife of regularized training gain and test gain. (The dark blue bands indicate the gain from using each variable in isolation, the light blue bands indicate the gain lost by removing a single variable from the full model, and the red band indicates the gain using all variables).
Forests 15 00272 g005
Figure 6. (ad) Response curves showing the relationships between the probability of the presence of D. involucrata and the key four environmental variables: (a) response curve of D. involucrata to precipitation of warmest quarter (Bio18); (b) response curve of D. involucrata to mean temperature of driest quarter (Bio9); (c) response curve of D. involucrata to annual mean radiation (Bio20); and (d) response curve of D. involucrata to elevation (ele). The probability values shown are the average over 10 replicate runs; within blue margins show ±SD (standard deviation) calculated over 10 repetitions.
Forests 15 00272 g006
Figure 7. Prediction of potential habitat areas of D. involucrata in China under current climate scenario.
Forests 15 00272 g007
Figure 8. (af) Prediction of potential habitat areas of D. involucrata in China under future climate scenarios: (a) 2050s ssp126; (b) 2050s ssp370; (c) 2050s ssp585; (d) 2070s ssp126; (e) 2070s ssp370; and (f) 2070s ssp585.
Forests 15 00272 g008
Figure 9. (af) Spatial changes of the suitable habitats of D. involucrata between different future climate scenarios and current climate scenario: (a) the suitable habitats change of D. involucrata between the 2050s ssp126 scenario and current; (b) the suitable habitats change of D. involucrata between the 2050s ssp370 scenario and current; (c) the suitable habitats change of D. involucrata between the 2050s ssp585 scenario and current; (d) 2070s ssp126; (e) 2070s ssp370; and (f) 2070s ssp585. Note: “unchanged”: Suitable areas that remain unchanged under current to future climate scenarios; “contraction”: the suitable area under current climate conditions became the unsuitable area under the future scenarios; “expansion”: the unsuitable area under current climate conditions became the suitable area under the future scenarios.
Forests 15 00272 g009
Table 1. Environmental variables and their percent contribution and permutation importance in the MaxEnt prediction model.
SymbolEnvironmental VariablesPercent Contribution (%)Permutation Importance (%)
Bio18Precipitation of Warmest Quarter3028
Bio9Mean Temperature of Driest Quarter24.451
Bio20Annual mean radiation14.615.3
Bio2Mean Diurnal Range12.71.1
eleElevation12.60.7
Bio10Mean Temperature of Warmest Quarter1.70.7
T_USDATopsoil USDA Texture Classification1.61.2
T_CEC_clayTopsoil CEC (clay)1.10.1
T_CACTopsoil Calcium Carbonate0.40.9
T_pHTopsoil pH (H2O)0.40.1
Bio15Precipitation Seasonality0.30.5
T_gravelTopsoil gravel content0.20.2
Table 2. Potential habitat areas of D. involucrata in different periods/(×104 km2).
PeriodCurrent2050s (2041–2060)2070s (2061–2080)
ssp126ssp370ssp585ssp126ssp370ssp585
Low-suitable area37.4129.0132.4132.2929.7834.5033.98
Medium-suitable area25.2721.0821.0723.1320.2322.9920.26
High-suitable area35.3434.0631.9436.8434.0034.4236.93
Total98.0284.1585.4292.2684.0191.9191.17
Table 3. Spatial changes of potential habitat area of D. involucrata under different climate scenarios.
PeriodArea/(×104 km2)Change Rate/(%)
ExpansionUnchangedContractionChangeIncrementUnchangedLossChange
2050s ssp1266.4777.2720.5414.076.6078.8320.9514.35
2050s ssp3708.7876.2721.5412.768.9677.8121.9813.02
2050s ssp5858.4383.5114.315.888.6085.2014.606.00
2070s ssp1266.2877.3420.4714.196.4078.9020.8814.48
2070s ssp3708.9382.6715.146.219.1184.3415.456.34
2070s ssp5859.6281.2316.586.969.8182.8716.917.10
Disclaimer/Publisher’s Note: The statements, opinions and data contained in all publications are solely those of the individual author(s) and contributor(s) and not of MDPI and/or the editor(s). MDPI and/or the editor(s) disclaim responsibility for any injury to people or property resulting from any ideas, methods, instructions or products referred to in the content.

