Article

Climatic Warming Caused a Transition in Tree Growth Sensitivity from Temperature to Moisture Conditions: Evidence from Multi-Species Tree-Ring Data in the Southeastern Tibetan Plateau

1
College of Geography and Planning, Chengdu University of Technology, Chengdu 610059, China
2
College of Earth Science, Chengdu University of Technology, Chengdu 610059, China
3
Research Center for Human Geography of Tibetan Plateau and Its Eastern Slope, Key Research Base of Humanities and Social Sciences of College in Sichuan Province, Chengdu 610059, China
4
College of Ecology and Environment, Chengdu University of Technology, Chengdu 610059, China
*
Author to whom correspondence should be addressed.
Forests 2024, 15(2), 241; https://doi.org/10.3390/f15020241
Submission received: 17 December 2023 / Revised: 21 January 2024 / Accepted: 24 January 2024 / Published: 26 January 2024
(This article belongs to the Section Forest Meteorology and Climate Change)

Abstract

:
Traditionally, investigations into the climatic response of various tree species have spanned different regions. However, dendrochronological studies within a single region, characterized by minor climatic differences, have received comparatively less attention. Therefore, this study collected 230 tree cores from four prevalent conifer species (P. yunnanensis, A. forrestii, P. likiangensis, and T. dumosa) in the Lugu Lake Wetland Nature Reserve of southwestern China, a region undergoing climate warming and drying. This study employed dendrochronological methods to investigate tree growth–climate static responses, individual tree responses to climate, and dynamic tree–climate interactions. Our findings revealed that as the trend of warming and drying persists, tree growth exhibits an initial increase followed by a subsequent decrease. Dynamic response analyses, along with standardized assessments, indicate that in the early stages of warming, tree growth benefits from elevated temperatures. However, in the later stages of warming, the combined effects of warming and drying become more pronounced. During this phase, the facilitating impact of temperature diminishes, while the controlling influence of moisture conditions intensifies. Looking ahead, with the ongoing intensification of warming and drying, tree growth in the region is anticipated to become increasingly reliant on the water supply. This shift may lead to the decline or mortality of tree species intolerant to drought, such as T. dumosa.

1. Introduction

Climate change has emerged as a critical global concern in recent years, with reported surface temperatures showing a rise of 1.1 °C in the period 2011–2020 compared with the period 1850–1900 [1]. Overall, it is anticipated that temperatures will continue to rise in the coming decades [2]. Climate change is already influencing, to varying extents, the growth of trees in forests, the composition of forest species, and the dynamic evolution of forests [3,4]. However, regions exhibit distinct climatic and topographic conditions, resulting in varied impacts for climate change on trees in forests across different areas [5,6]. As a result, there is a need to study the response of regional radial tree growth to climate. In addition, distinct tree species exhibit varying physiological traits [7,8], potentially leading to divergent responses to climate change. These differences can profoundly impact the forest composition [9,10]. Therefore, comprehending the unique responses of different tree species within regional forests to climate change within the broader context of global warming is crucial. Such insights are pivotal for predicting shifts in forest composition and safeguarding these vital ecosystems.
Dendrochronological research has extensively explored how different tree species respond to climate. Some studies have suggested that tree species in neighboring regions exhibit similar growth responses to warming climates [11,12,13], while others have identified notable differences in the climate response among species [14,15]. However, the majority of previous studies have focused on distinct tree species in different regions, with limited research on different tree species within the same region. Comparative studies of tree species within the same region, which experience fewer climatic fluctuations, can offer more intuitive insights into the similarities and differences in the climatic responses of different tree species. Therefore, conducting growth–climate response studies for multiple tree species in the same location is essential to determine whether growth mechanisms among tree species are similar under identical climatic conditions.
The Lugu Lake Nature Reserve, situated in southern China, has experienced a warming and drying climate trend since the 1980s [16]. In high-altitude regions, trees are generally more sensitive to temperature [11], while in arid areas, trees tend to be more responsive to precipitation [17]. The region’s combination of high altitude and warm–dry climatic features makes it particularly valuable for dendrochronological research. For this dendrochronological study, samples of Pinus yunnanensis, Abies forrestii, Picea likiangensis, and Tsuga dumosa were collected at high altitudes ranging from 2849 to 3643 m. The study conducted tree growth–climate response analyses using static response analysis, correlation ratio analysis, and dynamic response analysis. We anticipate that (1) different tree species have different responses to climatic conditions, but due to their close geographical location, they may have similar responses to some climatic conditions; (2) the temperature and moisture conditions will play crucial roles in shaping tree growth in the area; and (3) tree growth may initially benefit from climatic warming and drying but become increasingly reliant on moisture supply as these conditions intensify.

2. Materials and Methods

2.1. Study Area

The reserve is situated at the southeast edge of the Tibetan Plateau, on the eastern side of the central Hengduan Mountains (Figure 1) and at the southern end of the Shaluli Mountain System. This location serves as the transition zone from the Tibetan Plateau to the Yunnan–Guizhou Plateau and the Sichuan Basin, as well as from the northwest Sichuan Plateau to the southwest Sichuan Mountainous Region. The topography varies significantly, with elevated terrain to the north and south and a lower central region. The lowest point in the area is at 2650 m (Haimen River exit), while the highest elevation reaches 3785 m (Luojia Volcano), resulting in a relative height difference of 1135 m. Lugu Lake is situated in the southwest monsoon climate region and falls within the low-latitude plateau monsoon climate zone. It exhibits the characteristics of a warm temperate mountain monsoon climate. The territory’s intricate topography, characterized by rolling hills and surrounded by mountains, is influenced by deep-water lakes, contributing to the formation of unique climate features. This results in distinct three-dimensional climate characteristics, where temperature decreases with increasing altitude. The region displays evident soil zonal differentiation, featuring a red soil belt below 2899 m and a brown soil belt above 2800 m. The dominant vegetation types include A. forrestii forests, P. likiangensis forests, and P. yunnanensis forests, with P. yunnanensis forests covering the largest area.
The sampling site is in close proximity to the Muli meteorological station and is situated at approximately 27.7° N and 100.9° E, with an elevation ranging from 2849 to 3643 m (Table 1). By analyzing the meteorological data from 1960 to 2019 at the Muli station, the region experiences its highest temperatures in July and its lowest temperatures in January (Figure 1). With regard to precipitation, the area receives a total annual rainfall of 819 mm, and a significant portion of this, roughly 82%, occurs during the months of June to September, indicating a pronounced wet season during this period.
In addition, it is important to note a significant increase in temperature in the Lugu Lake area that is observed around 1990 (p < 0.001), signifying an accelerated warming trend in the region (Figure 2a). Concurrently, relative humidity in the area began to rapidly decline (p < 0.001), indicating a shift toward a warmer and drier climate pattern (Figure 2c).

2.2. Tree Ring Sampling and Measurements

With the exception of P. yunnanensis, classified as a secondary primary forest, all other tree species comprise natural primary forests. P. yunnanensis forests stand as pure forests, characterized by dominant species and heightened levels of human interference. The A. forrestii is positioned at the alpine timberline, forming a tree layer composed of both A. forrestii and P. likiangensis. T. dumosa and P. likiangensis emerge as the dominant and well-established species within the forest, serving as the primary occupants of the tree layer. The sampling sites for P. yunnanensis and T. dumosa are situated on sunlit slopes with inclines ranging from 20 to 40 degrees, while those for P. likiangensis and A. forrestii are located on shaded or partially sunny slopes with inclines below 10 degrees. The soils encompass mountain brown loam, dark brown loam, and purple soil, incorporating sand and gravel components.
For tree ring sampling, trees with diameters at a breast height (DBH) of 1.3 m were selected and we utilized increment borers (diameter 5.1 mm) to extract cores from each tree. A core was taken along the slope both vertically and horizontally. The extracted cores were then carefully placed in labeled plastic tubes and transported to the laboratory. The tree cores were secured in wooden trays using white glue and left to air dry for one month. Next, the cores underwent a meticulous sanding process, which involved using progressively finer sandpaper, including 180 mesh, 300 mesh, 600 mesh, 1000 mesh, and 1500 mesh sandpaper, to unveil the annual rings. Subsequently, the sanded sample cores were dated under a microscope. The width of the annual rings was precisely measured and corrected using a LINTAB™ 6.0 (German) instrument. Furthermore, the ring widths were subjected to testing using the COFECHA [18] program in LINTAB™ 6.0 instrument. Cores that did not meet the criteria set by the COFECHA program were excluded from the dataset. A total of 260 tree cores from 151 trees were utilized for the climate response analysis in this study.
Ultimately, the COFECHA-passed cores were subjected to the detrending process using the “dplR 1.7.4” [19] package in the R statistical environment (R Core Team), resulting in the creation of a regional curve standardization (RCS) chronology based on the tree ring widths.

2.3. Climate Data

The average temperature (Tmean), precipitation (Pre), relative humidity (RH), and Palmer drought severity index (PDSI) used in this study were sourced from meteorological data collected at the Muli meteorological station. The station is situated at the coordinates 27.56 N latitude and 101.16 E longitude and at an elevation of 2426.5 m above sea level. This meteorological station is the closest one to the sampling site; the meteorological station is 38–46.5 km from the sampling site. The meteorological data were retrieved from the Resource Sharing Platform of the National Meteorological Science Data Center of China (https://data.cma.cn, accessed on 16 December 2023). The PDSI was calculated using data from the Climatic Research Unit (CRU) grid points. Specifically, data from four grid points near the sample site were utilized (http://climexp.knmi.nl, accessed on 16 December 2023). The precision of the grid points was 0.5°. The calculated PDSI values were subsequently averaged to derive a representative value for the study area.

2.4. Data Analysis

Taking into account the “lag effect” [20] of tree development as described by Fan et al., monthly scale correlation analyses were performed on monthly mean temperature, precipitation, relative humidity, PDSI drought index, and the regional curve standardization (RCS) chronology of tree annual rings. This analysis covered the period from June of the previous year to October of the current year, spanning from 1960 to 2019.
Furthermore, seasonal-scale correlation analyses were performed to examine the relationships between climatic factors and tree-ring chronologies for various seasons, including the previous winter (December of the previous year to February of the current year), spring of the current year (March to May), summer (June to August), autumn (September to November), non-growing season (December of the previous year to April of the current year), growing season (May to September), and entire year (January to December).
The results of both the seasonal-scale and monthly-scale correlation analyses were integrated to standardize the tree-ring chronology and identify the significant climatic factors influencing tree development from 1960 to 2019. Following the correlation analysis, the main climatic factors affecting tree growth were identified and associations between climate factors and individual tree cores were established to determine the proportions of positive and negative responses to these factors for each tree species.
Finally, a 25-year sliding-scale correlation study between the tree-ring chronology and seasonal and yearly climate parameters was conducted. To create visual representations of the findings, ver. R 4.2.0 (R Development Core Team) was used.

3. Results

3.1. Chronological Characteristics and Growth Pattern

From the statistical parameters of the chronological table (Table 1), the expressed population signal (EPS) of the samples of the four tree species exceeded 0.85. The signal-to-noise ratio (SNR) ranged from 11.2 to 20.2, with a higher SNR indicating the greater impact of the climate on tree growth. The mean inter-series correlation (Rbar) ranged from 0.536 to 0.677, and the first-order autocorrelation (AC1) ranged from 0.568 to 0.837. This suggests that the climate of the previous year has a significant impact on the tree growth of the current year and that the regional climate significantly influences the radial growth of the four tree species. The mean sensitivities (MS) of the tree species were between 0.24 and 0.28, indicating that the sequences contain more high-frequency variation information.
Plotting the RCS chronology and sample sizes showed that from the late 1980s to around 2000, there was an increasing trend in the sample bars for all species, suggesting an increase in the radial growth rate of trees during this period (Figure 3). There was a decreasing trend in the sample bar function for each species around 2000 (T. dumosa p = 0.077, the other tree species p < 0.05), suggesting a decrease in the radial growth rate of trees.

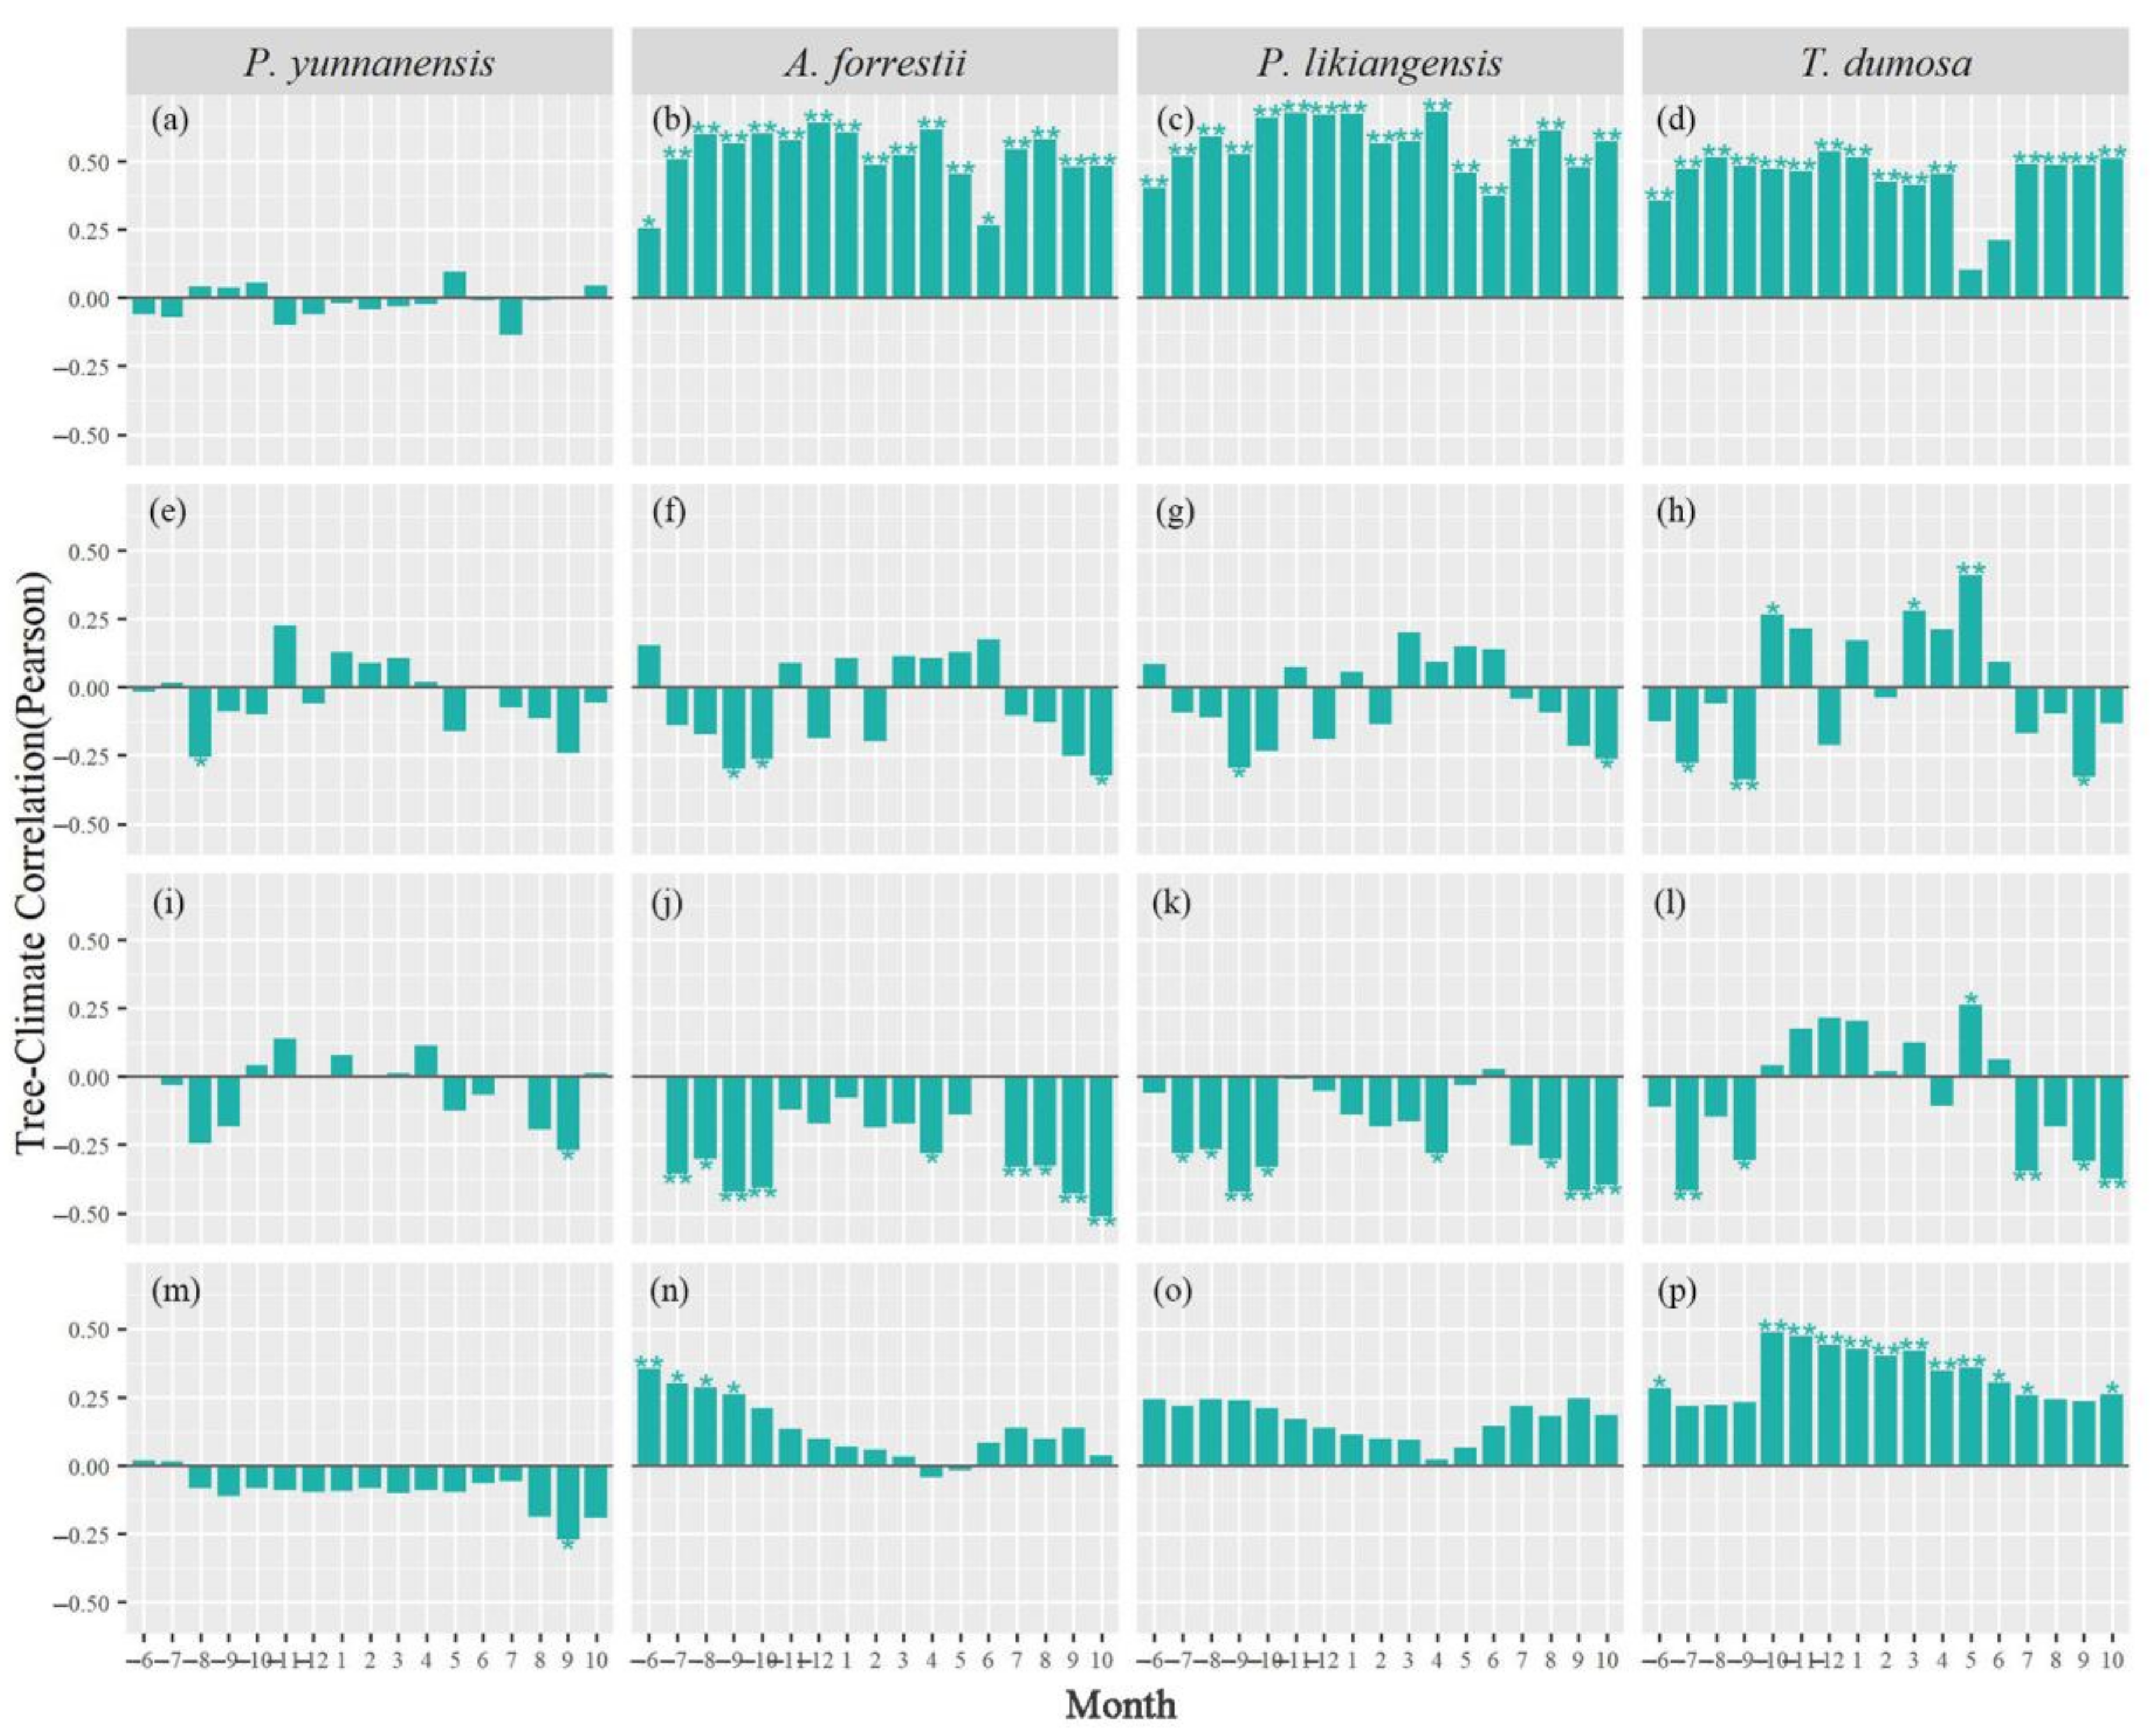
3.2. Tree Growth–Climate Single-Month Relationships

The results of the monthly scale response study indicated that there was no significant correlation found between the monthly mean temperature and the radial growth of P. yunnanensis (Figure 4a); however, there was a significant positive correlation (p < 0.05) between the growth of A. forrestii and the monthly mean temperature from June of the previous year to October of the current year (Figure 4b). Similarly, the growth of P. likiangensis and the monthly mean temperature from June of the previous year to October of the current year were positively correlated (p < 0.01) (Figure 4c). Additionally, except for May and June of this year, there was a significant positive (p < 0.01) correlation between the monthly mean temperature and the growth of T. dumosa (Figure 4d). The growth of P. yunnanensis and the precipitation in August of the previous year showed a significant negative correlation (p < 0.05) (Figure 4e). Similarly, the growth of A. forrestii and the precipitation in September and October of the previous year and October of the current year showed a significant negative correlation (p < 0.05) (Figure 4f); the growth of P. likiangensis and the precipitation in September of the previous year and October of the current year showed a significant negative correlation (p < 0.05) (Figure 4g); the growth of T. dumosa and the precipitation in July and September of the previous year and September of the current year showed a significant negative correlation (p < 0.05); and the growth of T. dumosa and the precipitation in September of the previous year and September of the current year held a significant positive correlation (p < 0.05) (Figure 4h). P. yunnanensis growth and the relative humidity in September showed a significant negative correlation (p < 0.05) (Figure 4i); A. forrestii growth and the relative humidity from July to October of the previous year, April of the current year, and July to October of the current year showed a significant negative correlation (p < 0.05) (Figure 4j); the growth of P. likiangensis showed a significant negative correlation (p < 0.05) with the relative humidity in July of the previous year, September of the previous year, and July, September, and October of the current year and a significant positive correlation with t (Figure 4k); and the growth of T. dumosa showed a significant negative correlation (p < 0.05) with the relative humidity from April and August to October of the current year (Figure 4l). P. yunnanensis growth and the September PDSI showed a significant negative correlation (p < 0.05) (Figure 4m); A. forrestii growth and the PDSI from June to September of the previous year showed a significant positive correlation (p < 0.05) (Figure 4n); P. likiangensis growth and the PDSI showed a non-significant correlation (Figure 4o); and T. dumosa growth and the PDSI from June of the previous year and from October of the previous year to July of the current year showed a significant positive correlation (p < 0.05) (Figure 4p).

3.3. Tree Growth–Climate Seasonal and Interannual Relationships

The findings from the analyses of interannual climate factor responses indicated that there was no significant relationship between the growth of P. yunnanensis and seasonal temperature (Figure 5a). However, the growth of A. forrestii and the previous winter’s and current year’s spring, summer, autumn, non-growing season, and growing season average temperatures were significantly positively correlated (p < 0.01) (Figure 5b); P. likiangensis growth and the previous winter’s and current year’s spring, summer, autumn, non-growing season, and growing season average temperatures were significantly positively correlated (p < 0.01) (Figure 5c); and the growth of T. dumosa and the average temperatures of the previous winter and the current year’s spring, summer, autumn, and growing season displayed significant positive correlations (p < 0.01) (Figure 5d). P. yunnanensis growth did not significantly correlate with the seasons (Figure 5e); A. forrestii growth and the autumn precipitation were significantly negatively correlated (p < 0.05) (Figure 5f); P. likiangensis growth and the autumn precipitation were significantly negatively correlated (p < 0.05) (Figure 5g); T. dumosa growth and the spring and growing season precipitation were significantly positively correlated (p < 0.05), whereas T. dumosa growth was significantly negatively correlated (p < 0.05) with the autumn precipitation (Figure 5h). P. yunnanensis growth did not significantly correlate with the relative humidity in any of the seasons (Figure 5i); A. forrestii growth did significantly negatively correlate (p < 0.05) with the relative humidity in the spring, summer, autumn, non-growing season, and growing season (Figure 5j); P. likiangensis growth negatively correlated (p < 0.05) with the relative humidity in the autumn, non-growing season, and growing season (Figure 5k); and T. dumosa growth significantly negatively correlated (p < 0.05) with the relative humidity in autumn (Figure 5l). There was no significant correlation found between the growth of P. yunnanensis, A. forrestii, and P. likiangensis and the PDSI of each season and the entire year (Figure 5m–o). In contrast, T. dumosa growth was significantly and positively correlated (p < 0.05) with the PDSI of the previous winter and the current year’s spring, summer, non-growing season, and growing season (Figure 5p).

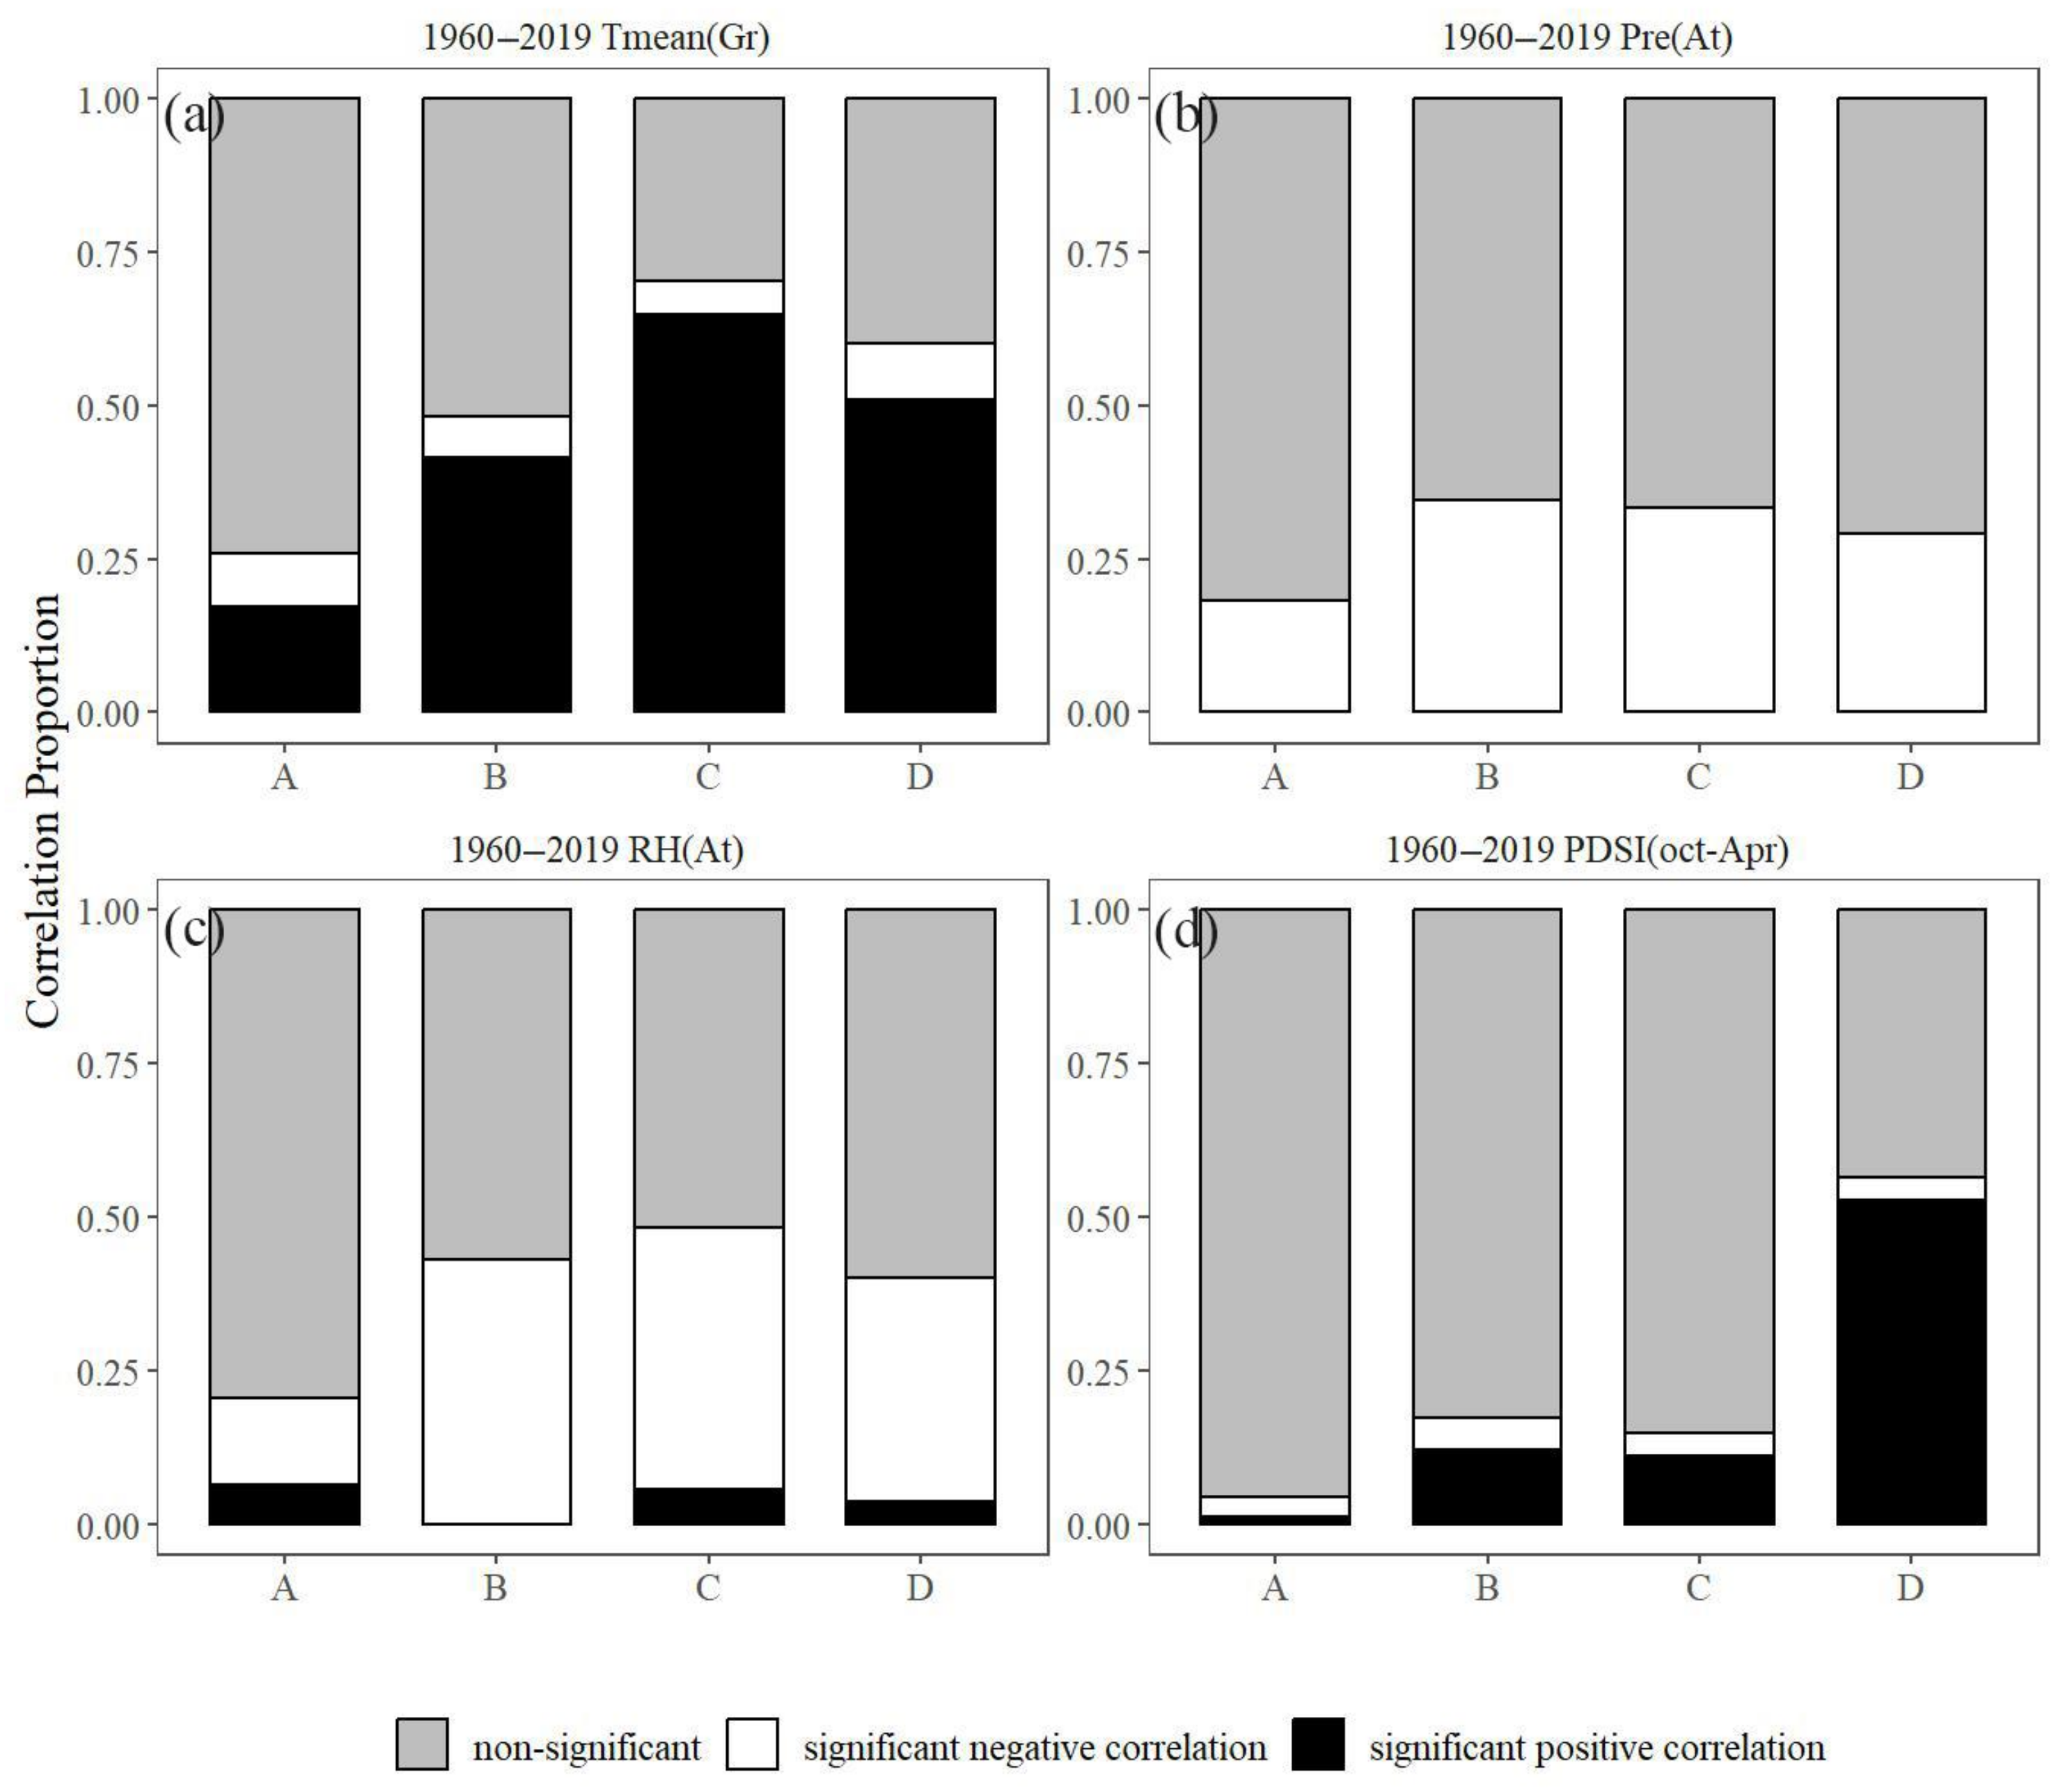
3.4. Individual Tree Response to Climate

In the study examining the responses of individual trees of the four conifer species to the climatic conditions, the following findings were observed: the proportion of positive responses to the growing season temperature for individual trees of P. yunnanensis, A. forrestii, P. likiangensis, and T. dumosa was 17.2%, 41.4%, 64.8%, and 50.9%, respectively. A small proportion of individual trees from each species exhibited a substantial negative connection with the growing seasonal temperature (Figure 6a).
Individual trees of P. yunnanensis, A. forrestii, P. likiangensis, and T. dumosa responded negatively to autumn precipitation in the proportions of 18.3%, 34.5%, 33.3%, and 29.1%, respectively (Figure 6b). Individual trees of P. yunnanensis, P. likiangensis, and T. dumosa exhibited seasonal responses to the humidity conditions (Figure 6c). A significant proportion of individual T. dumosa trees, accounting for 52.7%, responded positively to the PDSI from October of the previous year to April of the current year. Only a small number of individual trees from other species responded positively to the PDSI (P. yunnanensis 1.5%, A. forrestii 12.1%, and P. likiangensis 11.1%) (Figure 6d).

3.5. Stability of Climate–Growth Relationships

In the 25-year moving correlation analysis spanning 1960 to 2019, the following trends and findings were observed: P. yunnanensis’s response to temperature had fluctuated in the past, with varying associations. However, the correlation between P. yunnanensis growth and temperature was not consistently high (Figure 7a). In terms of the temperature response for the other species, similar effects of the climate were noted for A. forrestii, P. likiangensis, and T. dumosa. The correlation between the growth of these species and the temperature was not significant in the past but became significantly positive before and after 1990, declining after 2010 (Figure 7b–d).
The effect of the summer precipitation on P. yunnanensis increased from a non-significant to a significant positive correlation. A. forrestii and P. likiangensis showed an increased response to autumn precipitation, shifting from non-significant to a significant negative correlation before returning to non-significant. T. dumosa’s growth response to the autumn precipitation followed a similar pattern. The response to the growing season shifted from non-significant to a significant positive correlation before returning to being non-significant (Figure 7e–h).
The correlation between the seasonal and annual relative humidity and P. yunnanensis growth was generally not significant. A. forrestii and P. likiangensis exhibited an increased response to the relative humidity in the previous year’s winter and in the autumn of the current year, shifting from a non-significant to a significant negative correlation before returning to being non-significant. T. dumosa’s growth, while not significantly correlated with the relative humidity in most intervals, shows a strong positive connection with the summer temperature for recent years (Figure 7i–l).
P. yunnanensis growth did not exhibit a significant association with PDSI, although there was a declining trend in the non-significant negative correlation. T. dumosa growth shows significant positive correlations with the summer, growing season, and average annual PDSI, especially for recent years (Figure 7m,p).

3.6. Standardization of Tree and Climate Data

Following the standardization of the chronology and the identification of the growing season temperature and the autumn relative humidity, at the end of the 1980s, temperatures started to rise; the trend lines of P. yunnanensis, A. forrestii, P. likiangensis, and T. dumosa samples exhibited a significant upward trajectory (p < 0.01) in the initial phase of warming. However, as temperatures continued to increase, the growth trend of the trees gradually deviated from the temperature growth curve (Figure 8a,b). Conversely, starting from the late 1980s, the relative humidity began to exhibit a declining trend. Initially, this trend did not exert a significant impact on tree growth. Subsequently, from the year 2000 onward, the tree growth trend displayed a decreasing pattern (p < 0.05) that followed a similar trend to the autumn relative humidity (Figure 8c,d).

4. Discussion

4.1. The Trend of Tree Growth and Its Influence on Climate

The growth of P. yunnanensis in the Lugu Lake area did not exhibit a significant response to temperature (Figure 4a), suggesting that temperature may not be a major factor influencing the long-term growth of Pinus yunnanensis. Abies forrestii, Picea likiangensis, and Tsuga dumosa demonstrated positive responses (p < 0.01) across most months (Figure 4b–d). At higher elevations, the growth of most tree species is constrained by temperature [21,22]. These three sites are situated at altitudes exceeding 3200 m (Table 1). Despite the tree having completed its growth in the previous autumn/winter, the higher temperatures during this time promote carbohydrate storage and organic matter synthesis and subsequently enhance xylem growth in the following year’s growing season [23,24]. Moreover, elevated winter temperatures maintain the activity of the root system, consequently promoting overall tree growth [25]. In contrast, cold winters have the potential to freeze buds, hinder root activity, and postpone the growing season, ultimately resulting in a reduced width for the annual rings [26]. Elevated spring temperatures contribute to the thawing of permafrost, supplying moisture for tree growth and extending the growing season, thereby favoring the width of the annual rings [27].
Autumn precipitation inhibited the radial growth of all species except Pinus sylvestris. Furthermore, a higher relative humidity in early autumn (September) had a suppressing effect on the radial growth of Pinus sylvestris, while a similar inhibitory effect was observed in the remaining species (Figure 4 and Figure 5). The negative correlation between the autumn moisture conditions and annual growth may be due to a shift in growth-limiting factors [28], high summer temperatures, high transpiration, and soil moisture limiting tree growth. The soil moisture limitation of tree whorl growth decreases in autumn; however, with lower temperatures in autumn compared with summer, excessive precipitation and high relative humidity lead to a further decrease in temperatures [29], and low temperatures limit radial tree growth [30]; this may lead to an early entry into dormancy, thus decreasing the width of the tree’s annual whorl. On the other hand, the thicker cloud cover caused by precipitation reduces light intensity and brings the growing season to an early end. A study of Nordic mountain birch in the far north of Europe by E. Shutova et al. [31] also found that thicker cloud cover in autumn may lead to lower light intensity and the earlier end of the growing season.
For T. dumosa, a shade-loving and drought-intolerant tree species [32], its growth was positively influenced by spring precipitation levels (Figure 5h). The impact of precipitation extends to the effectiveness of soil moisture in spring, as highlighted in a study in 2020, thereby influencing the overall growth of the tree [33,34]. Precipitation during the initial stages of the growing season supports cell division and expansion, leading to enhanced cell volume. This, in turn, facilitates an increase in the width of the tree whorl. The impact of spring precipitation on tree growth is a widespread phenomenon. Shalik Ram Sigdel’s [35] research demonstrated that spring precipitation facilitates the upward movement of birch and fir forest lines in the eastern Himalaya. Similarly, in the Vienna Basin, Austria, there is a robust positive correlation between Pinus nigra growth and spring as well as summer rainfall [36].
Individual response analyses further revealed the sensitivity of different tree species to climate and also highlighted the dispersive response of the trees, which were less dispersive in terms of tree growth in this study area (Figure 6). Individual response analysis further unveiled insights into the temperature sensitivity of various tree species, with notable distinctions observed in the growth patterns of P. likiangensis, A. forrestii, and T. dumosa. P. likiangensis, occupying the highest distribution elevation with a cold habitat, exhibited a remarkable reliance on temperature, with 64.8% of individuals displaying positive responses to warming conditions. This suggests that temperature acts as a critical factor influencing the majority of P. likiangensis growth. In contrast, A. forrestii and T. dumosa showed a higher proportion of temperature sensitivity, with 41.4% and 50.9% of individuals, respectively, responding positively to temperature changes. The prevalence of temperature sensitivity, especially at higher altitudes, aligns with common observations [4,6,14]. Research on fir (Abies spp.) and spruce (Picea spp.) individuals on the Tibetan Plateau corroborates this trend, indicating favorable responses to temperature for a significant portion of the year [29]. Response studies of individual P. yunnanensis confirmed that the species is generally resilient and only in a few cases showed temperature sensitivity. In total, 25.8% of P. yunnanensis responded significantly to the mean annual temperatures (Figure 6). These subtle observations of the temperature sensitivity of individual species contribute to a more comprehensive understanding of their adaptive strategies in response to changing climatic conditions.

4.2. Response Stability of Tree Growth to Climate Change

Moving correlation analyses revealed a notable temporal pattern in the tree growth response to climate change (refer to Figure 7). Correlations with temperature and humidity exhibited an ascending trend in the late 1980s, followed by a decline in the late 2000s. Spline function and climate factor standardization analyses further illustrated an initial increase in tree growth concomitant with rising temperatures during the early phase of climate change, succeeded by a subsequent decline around the 2000s (see Figure 8). The onset of climate warming and drying occurred in southwest China around the 1980s [16], as documented by Shi in 2014, and in the Lugu Lake area from the late 1980s (refer to Figure 2, Figures S1 and S3). The primary determinant influencing tree growth appears to be the prolonged low-temperature limitation at high altitudes. Shankar Panthi et al. [37], in their study on Himalayan fir, observed that elevated temperatures positively influenced fir growth at higher altitudes. Additionally, Salzer et al. [38] reported the accelerated growth of bristlecone pine in response to higher temperatures.
As the warming persisted, the trajectory of tree growth gradually diverged from the ongoing autumn relative humidity trend (Figure 8a,b). Simultaneously, there was a notable enhancement in the correlation between relative humidity and tree growth (Figure 7). This phenomenon may be attributed to “drought stress” affecting tree growth, stemming from heightened evapotranspiration and inadequate soil moisture supply due to the ongoing warming and drying conditions [39]. Alternatively, it could be a consequence of temperatures surpassing the optimal threshold required for optimal tree growth [27]. Observations by Gazol et al. documented a decrease in silver fir growth that was attributed to drought stress within the European distribution area [40]. Furthermore, a study conducted by Leander D. et al. [41] on two tree species, Pinus ponderosa and Populus tremuloides, revealed distinct responses to drought stress, underscoring the influence of varied physiological traits among different tree species. Nevertheless, in the current study, all four species exhibited responses to drought that did not rely solely on the relative humidity; instead, this dependence was shifted towards a reliance on temperature (Figure 8).

4.3. Potential Variation in Forest Dynamics

Dynamic response analyses and standardized assessments unveiled a transition from temperature-related constraints to moisture limitations influencing the climate effects on tree growth. During the initial phase of warming in the study area, temperature exerted a constraining influence on tree growth. However, over time, the role of temperature in fostering tree growth diminished, whereas the influence of water conditions in limiting tree growth amplified. With the ongoing warming and drying of the region’s climate, there is a discernible shift towards a greater dependence on moisture conditions for tree growth. This increasing reliance on moisture aligns with findings from studies conducted in cold arid regions, where temperature holds less significance in controlling tree growth. Similarly, in northern Alaska [42], certain timberline trees experience drought stress due to insufficient moisture availability [43]. With the escalating warming and drying of the climate in the region, the growth of P. yunnanensis, A. forrestii, and P. likiangensis is poised to become increasingly reliant on moisture conditions. Considering the moisture-dependent characteristics of T. dumosa, the persistent warming and drying trends in the southwestern part of the country may result in a decline in its growth rate or even lead to mortality, thereby constraining its distribution.
In this study, the sample size for each tree species is limited and, while the impact of climatic conditions on tree growth is examined, it is essential to acknowledge that factors beyond climate also influence radial growth. For instance, competition, the age of the tree, the slope direction, and where the tree is located all contribute to variations in radial growth of trees.

5. Conclusions

At the initial stage of the temperature rise in the Lugu Lake area, the tree growth generally exhibited an upward trend. However, with the passage of time, P. yunnanensis, A. forrestii, and P. likiangensis experienced a significant downward trend in growth (p < 0.05) (Figure 3). Different tree species in the same area demonstrated varied responses to temperature changes, though certain species exhibited similar responses to climate-induced growth. For instance, the positive correlation observed between A. forrestii, P. likiangensis, and T. dumosa and most months of the year suggests that elevated temperatures significantly impact radial growth. Notably, the autumn water conditions emerged as a crucial factor influencing the growth of A. forrestii, P. likiangensis, and T. dumosa, thus validating hypotheses 1 and 2. Through dynamic response studies and standardized analyses (Figure 7 and Figure 8), it was determined that, in the early stages of climate change, the temperature positively influenced tree growth. However, as climate warming intensified and the relative humidity decreased in the Lugu Lake area, the influence of temperature on tree growth diminished. Simultaneously, the dependence on water conditions became more pronounced, supporting hypothesis 3. Considering the anticipated future climate warming and drying trends in this region, the growth of drought-resistant species such as T. dumosa may decline or cease altogether. In contrast, the growth of P. yunnanensis, A. forrestii, and P. likiangensis appears to be increasingly reliant on the water conditions.

Supplementary Materials

The following supporting information can be downloaded at: https://www.mdpi.com/article/10.3390/f15020241/s1, Figure S1. The black lines represent the mean temperature for each season from 1960 to 2019. The gray regions represent 95% confidence intervals, and the blue lines are smoothed trends; Sp, spring; Sm, summer; At, autumn; Wt, winter. Figure S2. The black lines represent the mean precipitation for each season from 1960 to 2019. The gray regions represent 95% confidence intervals, and the blue lines are smoothed trends; Sp, spring; Sm, summer; At, autumn; Wt, winter. Figure S3. The black lines represent the mean relative humidity for each season from 1960 to 2019. The gray regions represent 95% confidence intervals, and the blue lines are smoothed trends; Sp, spring; Sm, summer; At, autumn; Wt, winter. Figure S4. The black lines represent the mean Palmer drought score index for each season from 1960 to 2019. The gray regions represent 95% confidence intervals, and the blue lines are smoothed trends; Sp, spring; Sm, summer; At, autumn; Wt, winter.

Author Contributions

Conceptualization, W.L. and S.S.; methodology, S.S.; software, W.L. and C.X.; validation, W.L.; formal analysis, W.L.; investigation, C.X. and S.S.; resources, C.X. and W.L.; data curation, S.S.; writing—original draft preparation, W.L.; writing—review and editing, S.S.; visualization, W.L.; supervision, G.W. and X.B.; project administration, S.S.; funding acquisition, J.L. All authors have read and agreed to the published version of the manuscript.

Funding

This research was funded by the Natural Science Foundation of Sichuan, China (2023NSFSC0188), the Second Tibetan Plateau Scientific Expedition and Research Program (2019QZKK0402), and the Key Research and Development Program of Sichuan (2022YFS0491).

Data Availability Statement

The data presented in this study are available on request from the corresponding author.

Acknowledgments

We are very grateful to Zongshan Li for the revision of the thesis.

Conflicts of Interest

The authors declare no conflicts of interest.

References

  1. Calvin, K.; Dasgupta, D.; Krinner, G.; Mukherji, A.; Thorne, P.W.; Trisos, C.; Romero, J.; Aldunce, P.; Barrett, K.; Blanco, G.; et al. Climate Change 2023: Synthesis Report. Contribution of Working Groups I, II and III to the Sixth Assessment Report of the Intergovernmental Panel on Climate Change; Core Writing Team, Lee, H., Romero, J., Eds.; Intergovernmental Panel on Climate Change (IPCC): Geneva, Switzerland, 2023. [Google Scholar]
  2. Peng, Z.; Zhang, Y.; Zhu, L.; Lu, Q.; Mo, Q.; Cai, J.; Guo, M. Divergent Tree Growth and the Response to Climate Warming and Humidification in the Tianshan Mountains, China. Forests 2022, 13, 886. [Google Scholar] [CrossRef]
  3. Allen, C.D.; Macalady, A.K.; Chenchouni, H.; Bachelet, D.; McDowell, N.; Vennetier, M.; Kitzberger, T.; Rigling, A.; Breshears, D.D.; Hogg, E.H.; et al. A Global Overview of Drought and Heat-Induced Tree Mortality Reveals Emerging Climate Change Risks for Forests. For. Ecol. Manag. 2010, 259, 660–684. [Google Scholar] [CrossRef]
  4. Boisvenue, C.; Running, S.W. Impacts of Climate Change on Natural Forest Productivity—Evidence since the Middle of the 20th Century. Glob. Chang. Biol. 2006, 12, 862–882. [Google Scholar] [CrossRef]
  5. Adams, H.R.; Barnard, H.R.; Loomis, A.K. Topography Alters Tree Growth–Climate Relationships in a Semi-arid Forested Catchment. Ecosphere 2014, 5, 1–16. [Google Scholar] [CrossRef]
  6. Ackerman, F.; Goldblum, D. Lodgepole Pine and Interior Spruce Radial Growth Response to Climate and Topography in the Canadian Rocky Mountains, Alberta. Can. J. For. Res. 2021, 51, 986–1001. [Google Scholar] [CrossRef]
  7. Canham, C.D.; Murphy, L. The Demography of Tree Species Response to Climate: Sapling and Canopy Tree Growth. Ecosphere 2016, 7, e01474. [Google Scholar] [CrossRef]
  8. Fei, S.; Desprez, J.M.; Potter, K.M.; Jo, I.; Knott, J.A.; Oswalt, C.M. Divergence of Species Responses to Climate Change. Sci. Adv. 2017, 3, e1603055. [Google Scholar] [CrossRef]
  9. Community and Ecosystem Responses to Recent Climate Change|Philosophical Transactions of the Royal Society B: Biological Sciences. Available online: https://royalsocietypublishing.org/doi/10.1098/rstb.2010.0021 (accessed on 19 January 2024).
  10. Scherrer, D.; Massy, S.; Meier, S.; Vittoz, P.; Guisan, A. Assessing and Predicting Shifts in Mountain Forest Composition across 25 Years of Climate Change. Divers. Distrib. 2017, 23, 517–528. [Google Scholar] [CrossRef]
  11. Holtmeier, F.-K.; Broll, G. Sensitivity and Response of Northern Hemisphere Altitudinal and Polar Treelines to Environmental Change at Landscape and Local Scales: Treeline and Environmental Change. Glob. Ecol. Biogeogr. 2005, 14, 395–410. [Google Scholar] [CrossRef]
  12. Qi, Z.; Liu, H.; Wu, X.; Hao, Q. Climate-Driven Speedup of Alpine Treeline Forest Growth in the Tianshan Mountains, Northwestern China. Glob. Chang. Biol. 2015, 21, 816–826. [Google Scholar] [CrossRef]
  13. Silva, L.C.R.; Sun, G.; Zhu-Barker, X.; Liang, Q.; Wu, N.; Horwath, W.R. Tree Growth Acceleration and Expansion of Alpine Forests: The Synergistic Effect of Atmospheric and Edaphic Change. Sci. Adv. 2016, 2, e1501302. [Google Scholar] [CrossRef]
  14. Ning, Q.-R.; Gong, X.-W.; Li, M.-Y.; Hao, G.-Y. Differences in Growth Pattern and Response to Climate Warming between Larix olgensis and Pinus koraiensis in Northeast China Are Related to Their Distinctions in Xylem Hydraulics. Agric. For. Meteorol. 2022, 312, 108724. [Google Scholar] [CrossRef]
  15. Che, C.; Xiao, S.; Ding, A.; Peng, X.; Su, J. Growth Response of Plantations Hippophae rhamnoides Linn. on Different Slope Aspects and Natural Caragana opulens Kom. to Climate and Implications for Plantations Management. Ecol. Indic. 2022, 138, 108833. [Google Scholar] [CrossRef]
  16. Shi, P.; Sun, S.; Wang, M.; Li, N.; Wang, J.; Jin, Y.; Gu, X.; Yin, W. Climate Change Regionalization in China (1961–2010). Sci. China Earth Sci. 2014, 57, 2676–2689. [Google Scholar] [CrossRef]
  17. Kastridis, A.; Kamperidou, V.; Stathis, D. Dendroclimatological Analysis of Fir (A. borisii-regis) in Greece in the Frame of Climate Change Investigation. Forests 2022, 13, 879. [Google Scholar] [CrossRef]
  18. Holmes, R.L. Computer-Assisted Quality Control in Tree-Ring Dating and Measurement. Tree-Ring Bull. 1983, 43, 69–78. [Google Scholar]
  19. Bunn, A.G. A Dendrochronology Program Library in R (dplR). Dendrochronologia 2008, 26, 115–124. [Google Scholar] [CrossRef]
  20. Fan, Z.-X.; Bräuning, A.; Cao, K.-F.; Zhu, S.-D. Growth–Climate Responses of High-Elevation Conifers in the Central Hengduan Mountains, Southwestern China. For. Ecol. Manag. 2009, 258, 306–313. [Google Scholar] [CrossRef]
  21. Liang, E.; Wang, Y.; Piao, S.; Lu, X.; Camarero, J.J.; Zhu, H.; Zhu, L.; Ellison, A.M.; Ciais, P.; Peñuelas, J. Species Interactions Slow Warming-Induced Upward Shifts of Treelines on the Tibetan Plateau. Proc. Natl. Acad. Sci. USA 2016, 113, 4380–4385. [Google Scholar] [CrossRef]
  22. St George, S.; Ault, T.R. The Imprint of Climate within Northern Hemisphere Trees. Quat. Sci. Rev. 2014, 89, 1–4. [Google Scholar] [CrossRef]
  23. Zhu, H.; Zheng, Y.; Shao, X.; Liu, X.; Xu, Y.; Liang, E. Millennial Temperature Reconstruction Based on Tree-Ring Widths of Qilian juniper from Wulan, Qinghai Province, China. Sci. Bull. 2008, 53, 3914–3920. [Google Scholar] [CrossRef]
  24. Gou, X.; Chen, F.; Jacoby, G.; Cook, E.; Yang, M.; Peng, J.; Zhang, Y. Rapid Tree Growth with Respect to the Last 400 Years in Response to Climate Warming, Northeastern Tibetan Plateau. Int. J. Climatol. 2007, 27, 1497–1503. [Google Scholar] [CrossRef]
  25. Tierney, G.L.; Fahey, T.J.; Hardy, J.P.; Fitzhugh, R.D.; Driscoll, C.T. Soil Freezing Alters Fine Root Dynamics in a Northern Hardwood Forest. Biogeochemistry 2001, 56, 175–190. [Google Scholar] [CrossRef]
  26. Girardin, M.-P.; Tardif, J.C.; Flannigan, M.D.; Bergeron, Y. Synoptic-Scale Atmospheric Circulation and Boreal Canada Summer Drought Variability of the Past Three Centuries. J. Clim. 2006, 19, 1922–1947. [Google Scholar] [CrossRef]
  27. Keyimu, M.; Li, Z.; Jiao, L.; Chen, W.; Wu, X.; Fan, Z.; Zeng, F.; Fu, B. Radial Growth Response of Quercus Liaotungensis to Climate Change—A Case Study on the Central Loess Plateau, China. Trees 2022, 36, 1811–1822. [Google Scholar] [CrossRef]
  28. Jevšenak, J.; Tychkov, I.; Gričar, J.; Levanič, T.; Tumajer, J.; Prislan, P.; Arnič, D.; Popkova, M.; Shishov, V.V. Growth-Limiting Factors and Climate Response Variability in Norway Spruce (Picea abies L.) along an Elevation and Precipitation Gradients in Slovenia. Int. J. Biometeorol. 2021, 65, 311–324. [Google Scholar] [CrossRef] [PubMed]
  29. Rebetez, M. Seasonal Relationship between Temperature, Precipitation and Snow Cover in a Mountainous Region. Theor. Appl. Clim. 1996, 54, 99–106. [Google Scholar] [CrossRef]
  30. Bai, X.; Zhang, X.; Li, J.; Duan, X.; Jin, Y.; Chen, Z. Altitudinal Disparity in Growth of Dahurian Larch (Larix gmelinii Rupr.) in Response to Recent Climate Change in Northeast China. Sci. Total Environ. 2019, 670, 466–477. [Google Scholar] [CrossRef] [PubMed]
  31. Shutova, E.; Wielgolaski, F.E.; Karlsen, S.R.; Makarova, O.; Berlina, N.; Filimonova, T.; Haraldsson, E.; Aspholm, P.E.; Flø, L.; Høgda, K.A. Growing Seasons of Nordic Mountain Birch in Northernmost Europe as Indicated by Long-Term Field Studies and Analyses of Satellite Images. Int. J. Biometeorol. 2006, 51, 155–166. [Google Scholar] [CrossRef] [PubMed]
  32. Yin, Y.-L.; Zaw, Z.; Peng, X.-H.; Zhang, H.; Fu, P.-L.; Wang, W.-L.; Bräuning, A.; Fan, Z.-X. Tree Rings in Tsuga Dumosa Reveal Increasing Drought Variability in Subtropical Southwest China over the Past Two Centuries. Palaeogeogr. Palaeoclimatol. Palaeoecol. 2023, 628, 111757. [Google Scholar] [CrossRef]
  33. Hong, Y.; Zhang, L.; Liu, X.; Aritsara, A.N.A.; Zeng, X.; Xing, X.; Lu, Q.; Wang, K.; Wang, Y.; Zhang, Y.; et al. Tree Ring Anatomy Indices of Pinus tabuliformis Revealed the Shifted Dominant Climate Factor Influencing Potential Hydraulic Function in Western Qinling Mountains. Dendrochronologia 2021, 70, 125881. [Google Scholar] [CrossRef]
  34. Castagneri, D.; Battipaglia, G.; Von Arx, G.; Pacheco, A.; Carrer, M. Tree-Ring Anatomy and Carbon Isotope Ratio Show Both Direct and Legacy Effects of Climate on Bimodal Xylem Formation in Pinus Pinea. Tree Physiol. 2018, 38, 1098–1109. [Google Scholar] [CrossRef]
  35. Sigdel, S.R.; Wang, Y.; Camarero, J.J.; Zhu, H.; Liang, E.; Peñuelas, J. Moisture-mediated Responsiveness of Treeline Shifts to Global Warming in the Himalayas. Glob. Chang. Biol. 2018, 24, 5549–5559. [Google Scholar] [CrossRef]
  36. Leal, S.; Eamus, D.; Grabner, M.; Wimmer, R.; Cherubini, P. Tree Rings of Pinus Nigra from the Vienna Basin Region (Austria) Show Evidence of Change in Climatic Sensitivity in the Late 20th Century. Can. J. For. Res. 2008, 38, 744–759. [Google Scholar] [CrossRef]
  37. Panthi, S.; Fan, Z.; Van Der Sleen, P.; Zuidema, P.A. Long-term Physiological and Growth Responses of Himalayan Fir to Environmental Change Are Mediated by Mean Climate. Glob. Chang. Biol. 2020, 26, 1778–1794. [Google Scholar] [CrossRef]
  38. Salzer, M.W.; Hughes, M.K.; Bunn, A.G.; Kipfmueller, K.F. Recent Unprecedented Tree-Ring Growth in Bristlecone Pine at the Highest Elevations and Possible Causes. Proc. Natl. Acad. Sci. USA 2009, 106, 20348–20353. [Google Scholar] [CrossRef]
  39. Drought Stress, Growth and Nonstructural Carbohydrate Dynamics of Pine Trees in a Semi-Arid Forest|Tree Physiology|Oxford Academic. Available online: https://academic.oup.com/treephys/article/34/9/981/2338180?login=false (accessed on 20 January 2024).
  40. Gazol, A.; Camarero, J.J.; Gutiérrez, E.; Popa, I.; Andreu-Hayles, L.; Motta, R.; Nola, P.; Ribas, M.; Sangüesa-Barreda, G.; Urbinati, C.; et al. Distinct Effects of Climate Warming on Populations of Silver Fir (Abies Alba) across Europe. J. Biogeogr. 2015, 42, 1150–1162. [Google Scholar] [CrossRef]
  41. Anderegg, L.D.L.; HilleRisLambers, J. Drought Stress Limits the Geographic Ranges of Two Tree Species via Different Physiological Mechanisms. Glob. Chang. Biol. 2016, 22, 1029–1045. [Google Scholar] [CrossRef] [PubMed]
  42. Franke, A.K.; Bräuning, A.; Timonen, M.; Rautio, P. Growth Response of Scots Pines in Polar-Alpine Tree-Line to a Warming Climate. For. Ecol. Manag. 2017, 399, 94–107. [Google Scholar] [CrossRef]
  43. Wilmking, M.; Juday, G.P. Longitudinal Variation of Radial Growth at Alaska’s Northern Treeline—Recent Changes and Possible Scenarios for the 21st Century. Glob. Planet. Chang. 2005, 47, 282–300. [Google Scholar] [CrossRef]
Figure 1. Tree annual ring sampling point locations, meteorological station location, and, in the lower right corner, monthly average temperature and precipitation in the Lugu Lake area from 1960 to 2019, calculated using data from the Muli meteorological station (the meteorological station nearest to the sampling point).
Forests 15 00241 g001
Figure 2. The black lines indicate (a) the mean annual temperature (Tmean), (b) mean annual precipitation (Pre), (c) mean annual humidity (RH), and (d) mean annual Palmer drought index (PDSI) for the years 1960 to 2019. The gray regions represent 95% confidence intervals, and the green lines are smoothed trends.
Forests 15 00241 g002
Figure 3. The RCS chronology for P. yunnanensis, A. forrestii, P. likiangensis, and T. dumosa. The gray area shows the 95% confidence interval, the black line shows the average series, the black curve shows the smoothed line for these series, the red and blue lines show the fitted trend line of the chronology, and the gray line shows the number of samples.
Forests 15 00241 g003
Figure 4. Correlation of P. yunnanensis, A. forrestii, P. likiangensis, and T. dumosa;, with the temperature (Tmean, ad), precipitation (Pre, eh), relative humidity (RH, il), and Palmer drought score index (PDSI, mp) from June of the previous year to October of the current year, * p < 0.05, ** p < 0.01.
Forests 15 00241 g004
Figure 5. Correlation between P. yunnanensis, A. forrestii, P. likiangensis, and T. dumosa; with the temperature (Tmean, ad), precipitation (Pre, eh), relative humidity (RH, il), and Palmer drought score index (PDSI, mp) in different seasons. Wt, previous winter; Sp, spring of the current year; Sm, summer; At, autumn; Ng, non-growing season; Gr, growing season, * p < 0.05, ** p < 0.01.
Forests 15 00241 g005
Figure 6. The proportion of tree growth correlated with the (a) mean growing season temperature (Tmean (Gr)), (b) autumn precipitation (Pre (At)), (c) autumn relative humidity (RH (At)), and the (d) Palmer drought score index (PDSI (Oct-Apr)) from October of the previous year to April of the current year for (A) P. yunnanensis, (B) A. forrestii, (C) P. likiangensis, and (D) T. dumosa.
Forests 15 00241 g006
Figure 7. Twenty-five-year sliding correlation of P. yunnanensis, A. forrestii, P. likiangensis, and T. dumosa with the temperature (Tmean, ad), precipitation (Pre, eh), relative humidity (RH, il), and Palmer drought score index (PDSI, mp) in different seasons and throughout the year, with the gray area representing p < 0.05., Winter of the previous year (Wt), spring (Sp), summer (Sm), autumn (At), non-growing season (Ng), growing season (Gr).
Forests 15 00241 g007
Figure 8. The (a,b) are dendrochronology and growth season temperature (Tmean(Gr)) standardized map; (c,d) are dendrochronology and autumn relative humidity (RH(At)) standardized map, * p < 0.05, ** p < 0.01, *** p < 0.001.
Forests 15 00241 g008
Table 1. RCS Chronological Statistical Parameters.
ItemP. yunnanensisA. forrestiiP. likiangensisT. dumosa
Longitude100.939° E100.908° E100.831° E100.888° E
Latitude27.672° N27.779° N27.777° N27.781° N
Elevation2849 m3520 m3643 m3380 m
Sample size (trees/cores)55/9335/5830/5431/55
Chronology span/A.D1937–20181886–20191834–10181702–2019
Mean sensitivity (MS)0.2720.2800.2410.281
Signal-to-noise ratio (SNR)15.10412.54220.17211.205
Expressed population signal (EPS)0.9380.9260.9530.918
First order autocorrelation (AC1)0.8370.5680.8110.722
Gleichläufigkeit (GLK)0.9830.6240.6620.642
Mean inter-series correlation (Rbar)0.6770.5360.6510.594
Disclaimer/Publisher’s Note: The statements, opinions and data contained in all publications are solely those of the individual author(s) and contributor(s) and not of MDPI and/or the editor(s). MDPI and/or the editor(s) disclaim responsibility for any injury to people or property resulting from any ideas, methods, instructions or products referred to in the content.

