1. Introduction
Currently, under the combined influence of intensified human activities and climate change, the global environment is facing severe challenges such as accelerating land desertification and extensive deforestation. As a critical ecological barrier and a vital water resource security zone in China, the Yellow River Basin plays a core role in national and regional sustainable development. However, in recent years, the Yellow River Basin has faced a series of ecological and environmental challenges, including wetland degradation, land desertification, soil erosion, and fragmentation of ecological corridors. These issues not only threaten the stability of the basin’s ecosystems but also impose significant pressures on regional economic development and national food and water security [
1]. To address these challenges, the Chinese government has identified ecological security protection and high-quality development of the Yellow River Basin as a strategic priority critical to the great rejuvenation of the Chinese nation. It has also proposed the ecological protection framework of “one belt, five zones, and multiple points” to curb ecological degradation and accelerate the restoration of key ecosystems [
2]. The Jinan section, located in the lower reaches of the Yellow River, is closely connected to major economic hubs and represents an integral part of the Yellow River Basin with significant ecological importance [
3]. However, due to the dual impacts of human activities and climate change, this region has long faced severe ecological problems such as soil erosion and land desertification [
4,
5,
6,
7,
8,
9,
10,
11,
12]. Given the increasingly severe vegetation degradation [
13,
14], systematically exploring the trends in vegetation coverage, the spatial patterns of regional vegetation cover, and the underlying driving mechanisms are essential for mitigating these ecological problems and providing scientific evidence for ecological restoration and sustainable development of the basin. The period from 2008 to 2022 encompasses a critical phase of rapid economic development and ecological environmental changes in China, reflecting the comprehensive impacts of human activities and climate change [
15]. Additionally, NDVI data from this period are relatively abundant, providing a solid foundation for systematic analysis. Studying vegetation dynamics during this timeframe can reveal trends in ecological changes and provide scientific evidence for regional ecological protection and sustainable management. Therefore, based on NDVI data from 2008 to 2022, this study comprehensively analyzes the vegetation dynamics and driving factors in the Jinan section of the Yellow River Basin. This research will contribute to advancing the ecological protection and high-quality development strategies for the Yellow River Basin and provides valuable scientific references for studying vegetation dynamics in similar basins.
NDVI provides continuous spatio-temporal data, enabling the quantitative monitoring of dynamic changes in vegetation coverage on the Earth’s surface and serving as an optimal indicator for characterizing vegetation growth conditions [
16,
17,
18,
19,
20,
21,
22,
23,
24]. In recent years, researchers worldwide have extensively utilized NDVI data to analyze the spatio-temporal evolution patterns of vegetation coverage and its response to climatic factors. In China, Wang et al. [
25] investigated the spatiotemporal characteristics of NDVI in the Xin’an River Basin, while Lu et al. [
26] analyzed the spatiotemporal changes in green land density in Gansu Province from 2000 to 2020. Internationally, scholars have examined the spatiotemporal variation in NDVI in regions such as the Baltic Sea, the wetlands of the Andes Mountains in Argentina, and the Great Plains of the United States [
27,
28]. Additionally, to explore the future trends of NDVI, some researchers have conducted predictive studies. For instance, Wu et al. utilized the Hurst exponent and coefficient of variation to investigate the spatio-temporal fluctuations of green density and its potential future pathways [
29]. However, traditional NDVI forecasting methods, such as the Hurst index analysis, have certain limitations in capturing the complexity of NDVI dynamics, and cannot fully account for its variations. Recently, the FLUS model, which integrates machine learning with multi-source data, has demonstrated great potential in improving the accuracy of vegetation coverage predictions [
30]. These studies contribute to understanding the trends in vegetation changes from a spatio-temporal perspective, thereby providing scientific support for vegetation conservation [
31,
32,
33,
34]. Regarding the study of factors influencing NDVI, domestic and international scholars have focused on the intrinsic relationships and response mechanisms between NDVI changes and precipitation (PRE) and temperature (TEM) [
35,
36,
37]. For example, Li et al. used variable separation methods to analyze the internal relationships and response mechanisms between NDVI variations and PRE and TEM [
38]. Wang’s investigation of the central Great Plains revealed that annual fluctuations in NDVI are primarily driven by the variance in PRE, and the overall geographical distribution of NDVI is closely related to the spatial patterns of mean annual PRE [
39]. Past researchers have primarily utilized techniques like partial analysis of correlation, regression modeling, and residual analysis in multiple regression to investigate the factors influencing changes in vegetation cover. These approaches operate under the presumption of a linear association between vegetation cover and environmental factors. The Geodetector framework, pioneered by Wang et al., adeptly tackles the challenge of multicol-linearity stemming from interactions among predictor variables [
40]. However, the Geodetector usually relies on preset parameters, and the selection of these parameters is often based on experience or trial and error, lacking a systematic approach and scientific rigor. To tackle the challenge of the Geodetector framework not being optimized for identifying levels of driving factors, Song et al. introduced a Geographical Detector model based on Optimal Parameters (OPGD) [
41]. This model incorporates a parameter optimization module that can select the optimal discretization method and the optimal number of breakpoints, thereby enhancing the significant differences among various categories and providing a more accurate study for driver analysis.
Based on these findings, several shortcomings in current NDVI research were identified. (1) Most studies focus on provincial or larger-scale regions, with limited detailed research at the urban scale (such as the Jinan section). (2) The classification of driving factors often relies on empirical methods, lacking optimization strategies. (3) There is limited research on the nonlinear response of NDVI to driving factors and lag effects. (4) NDVI predictions have not fully accounted for the dynamic interactions between climate change and human activities.
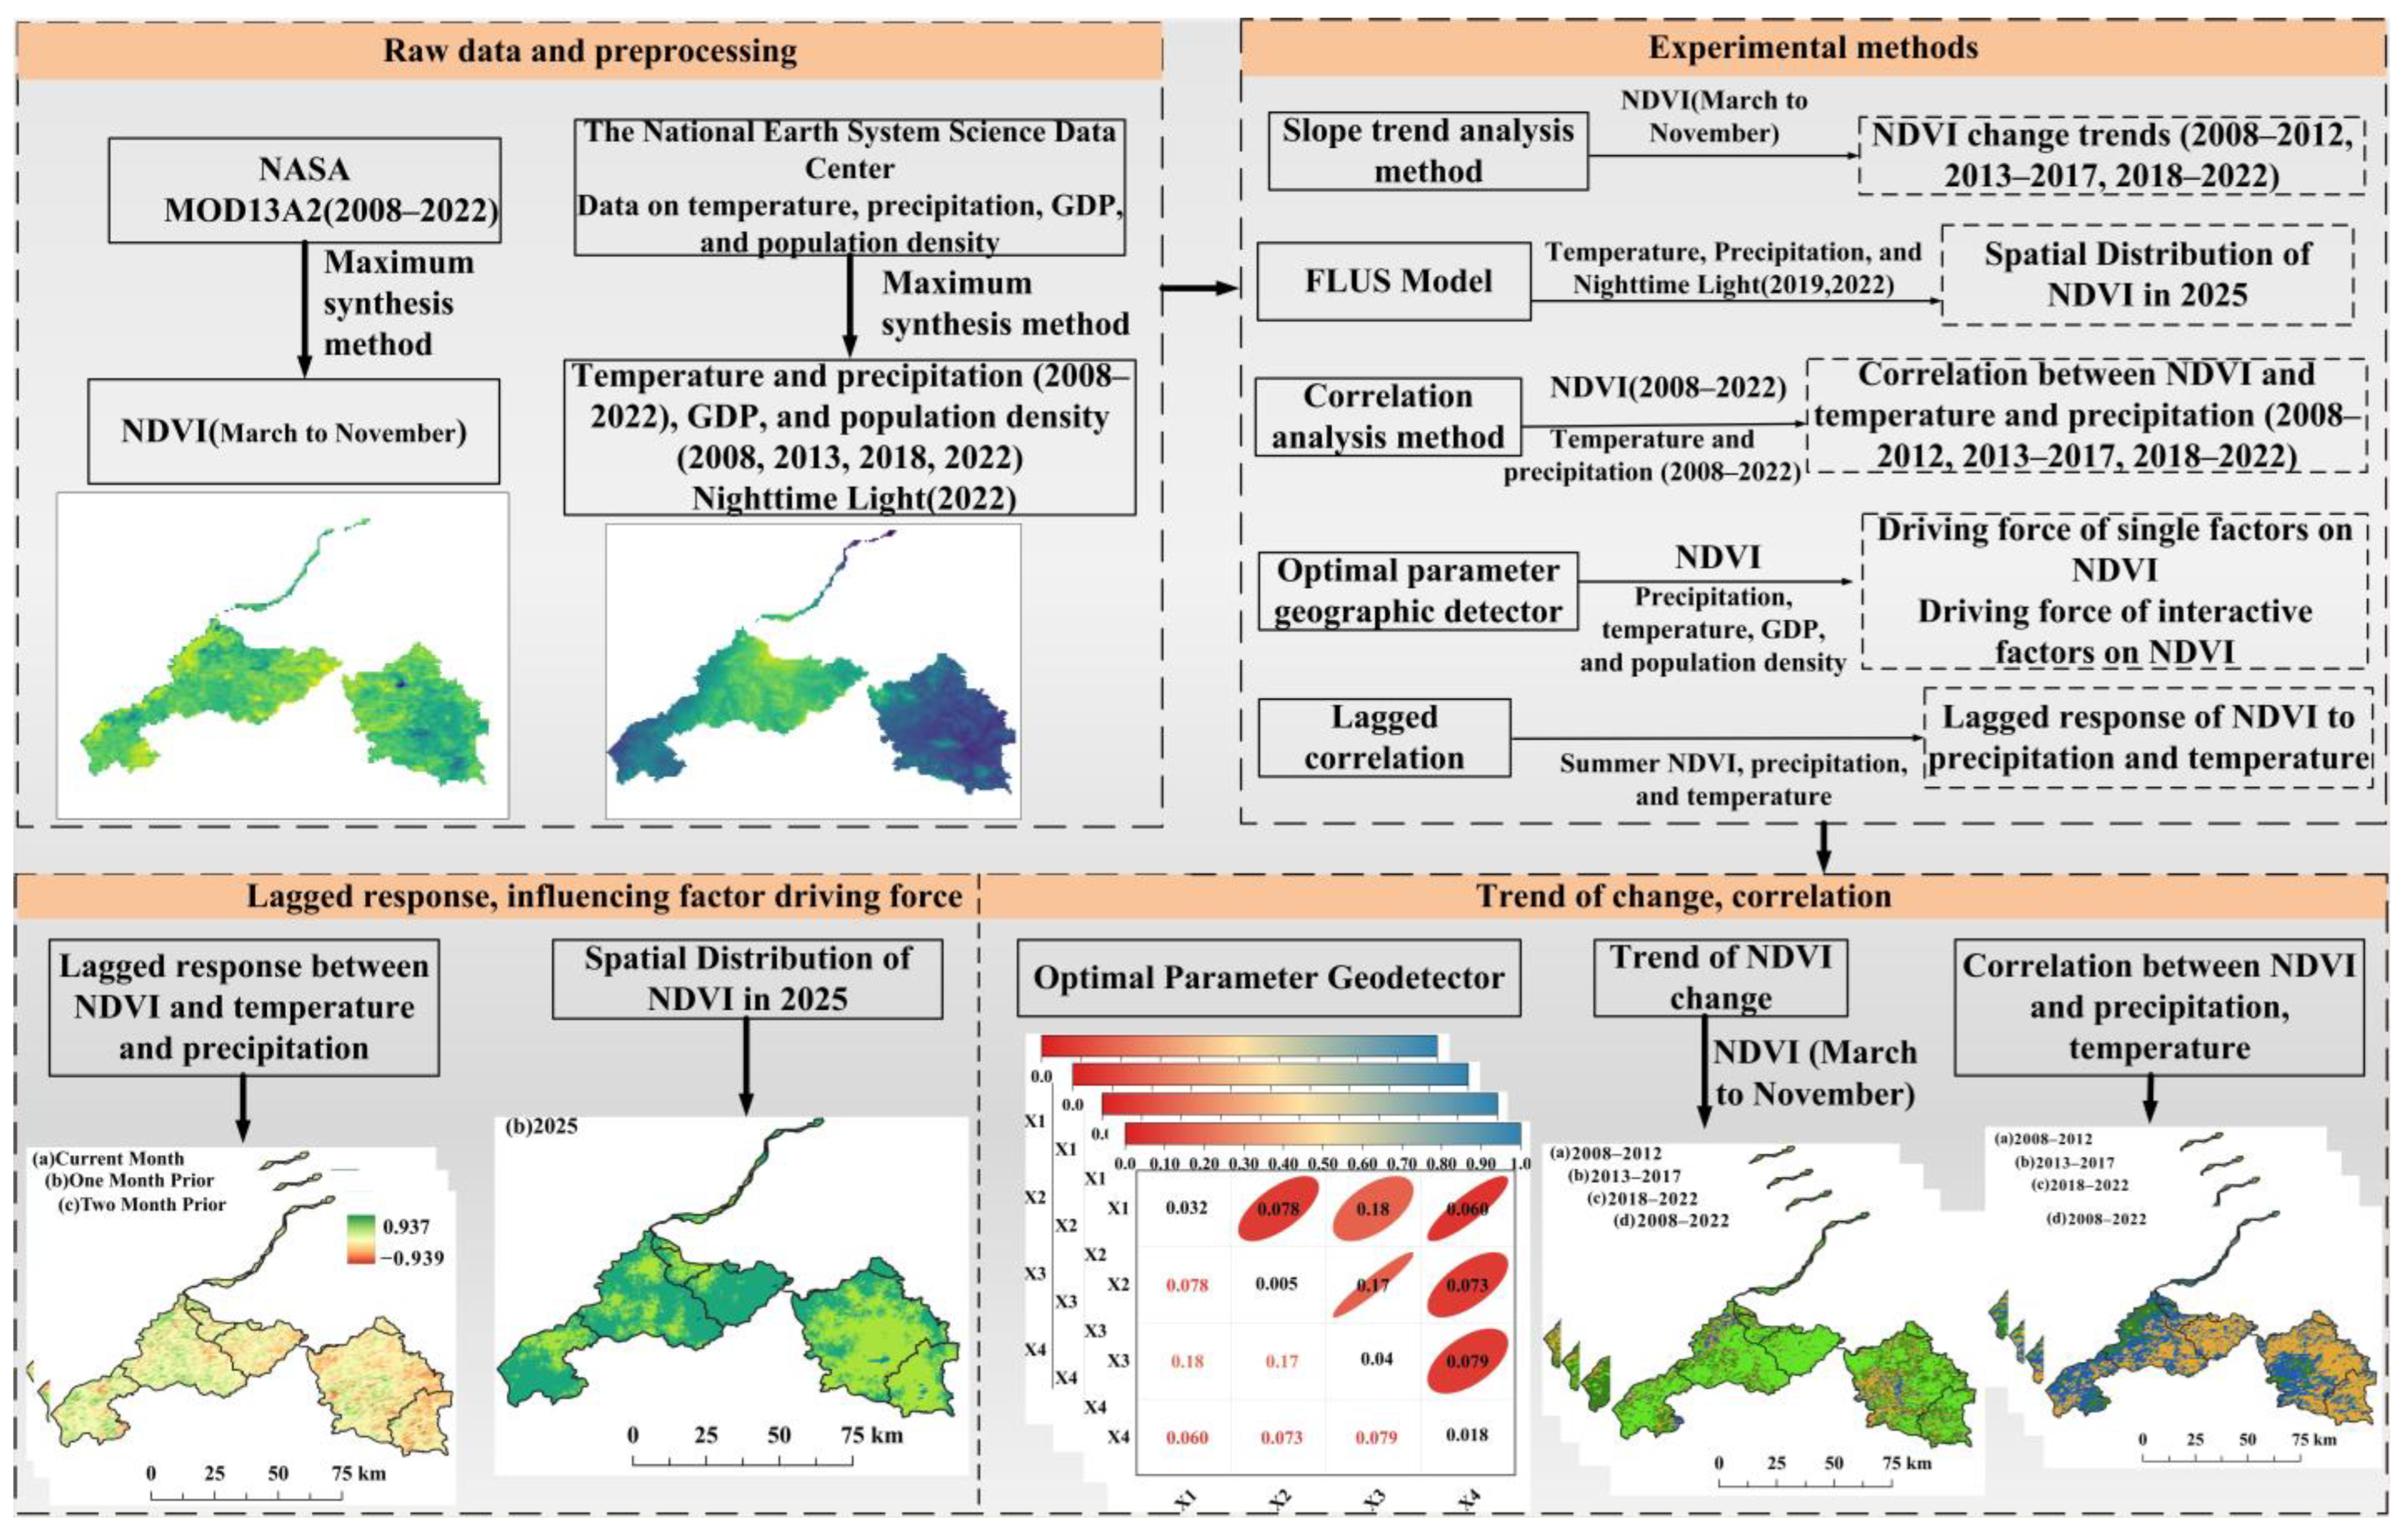
Therefore, this study focuses on the Jinan section of the Yellow River Basin, investigating the spatiotemporal dynamics and driving mechanisms of vegetation cover in this region. Specifically, the aims of this study are as follows. (1) Apply slope trend analysis to examine the spatiotemporal variation characteristics of NDVI. (2) Combine climate factors and human activities to predict the spatial distribution of NDVI in 2025 using the FLUS model, improving prediction accuracy. (3) Quantitatively assess the contribution of driving factors to vegetation coverage using the Optimal Parameter-based Geodetector model. (4) Explore the response relationship between NDVI, temperature (TEM), and precipitation (PRE) through correlation analysis and lag effect testing. Based on this, the following hypotheses are proposed:
(1) vegetation cover in the Jinan section is jointly driven by climate factors (TEM, PRE) and human activities, with significant differences in trends and spatial distribution; (2) the high-density spatial distribution of NDVI will significantly increase in 2025; (3) TEM and PRE have significant lag effects on NDVI, and the lag relationship can reveal the long-term impact of climate change on vegetation cover. This study can provide a scientific basis for regional ecological restoration and vegetation conservation, offering practical insights for addressing the impacts of climate change and human activities.
3. Results and Analysis
3.1. Inter-Annual Dynamic Changes in NDVI
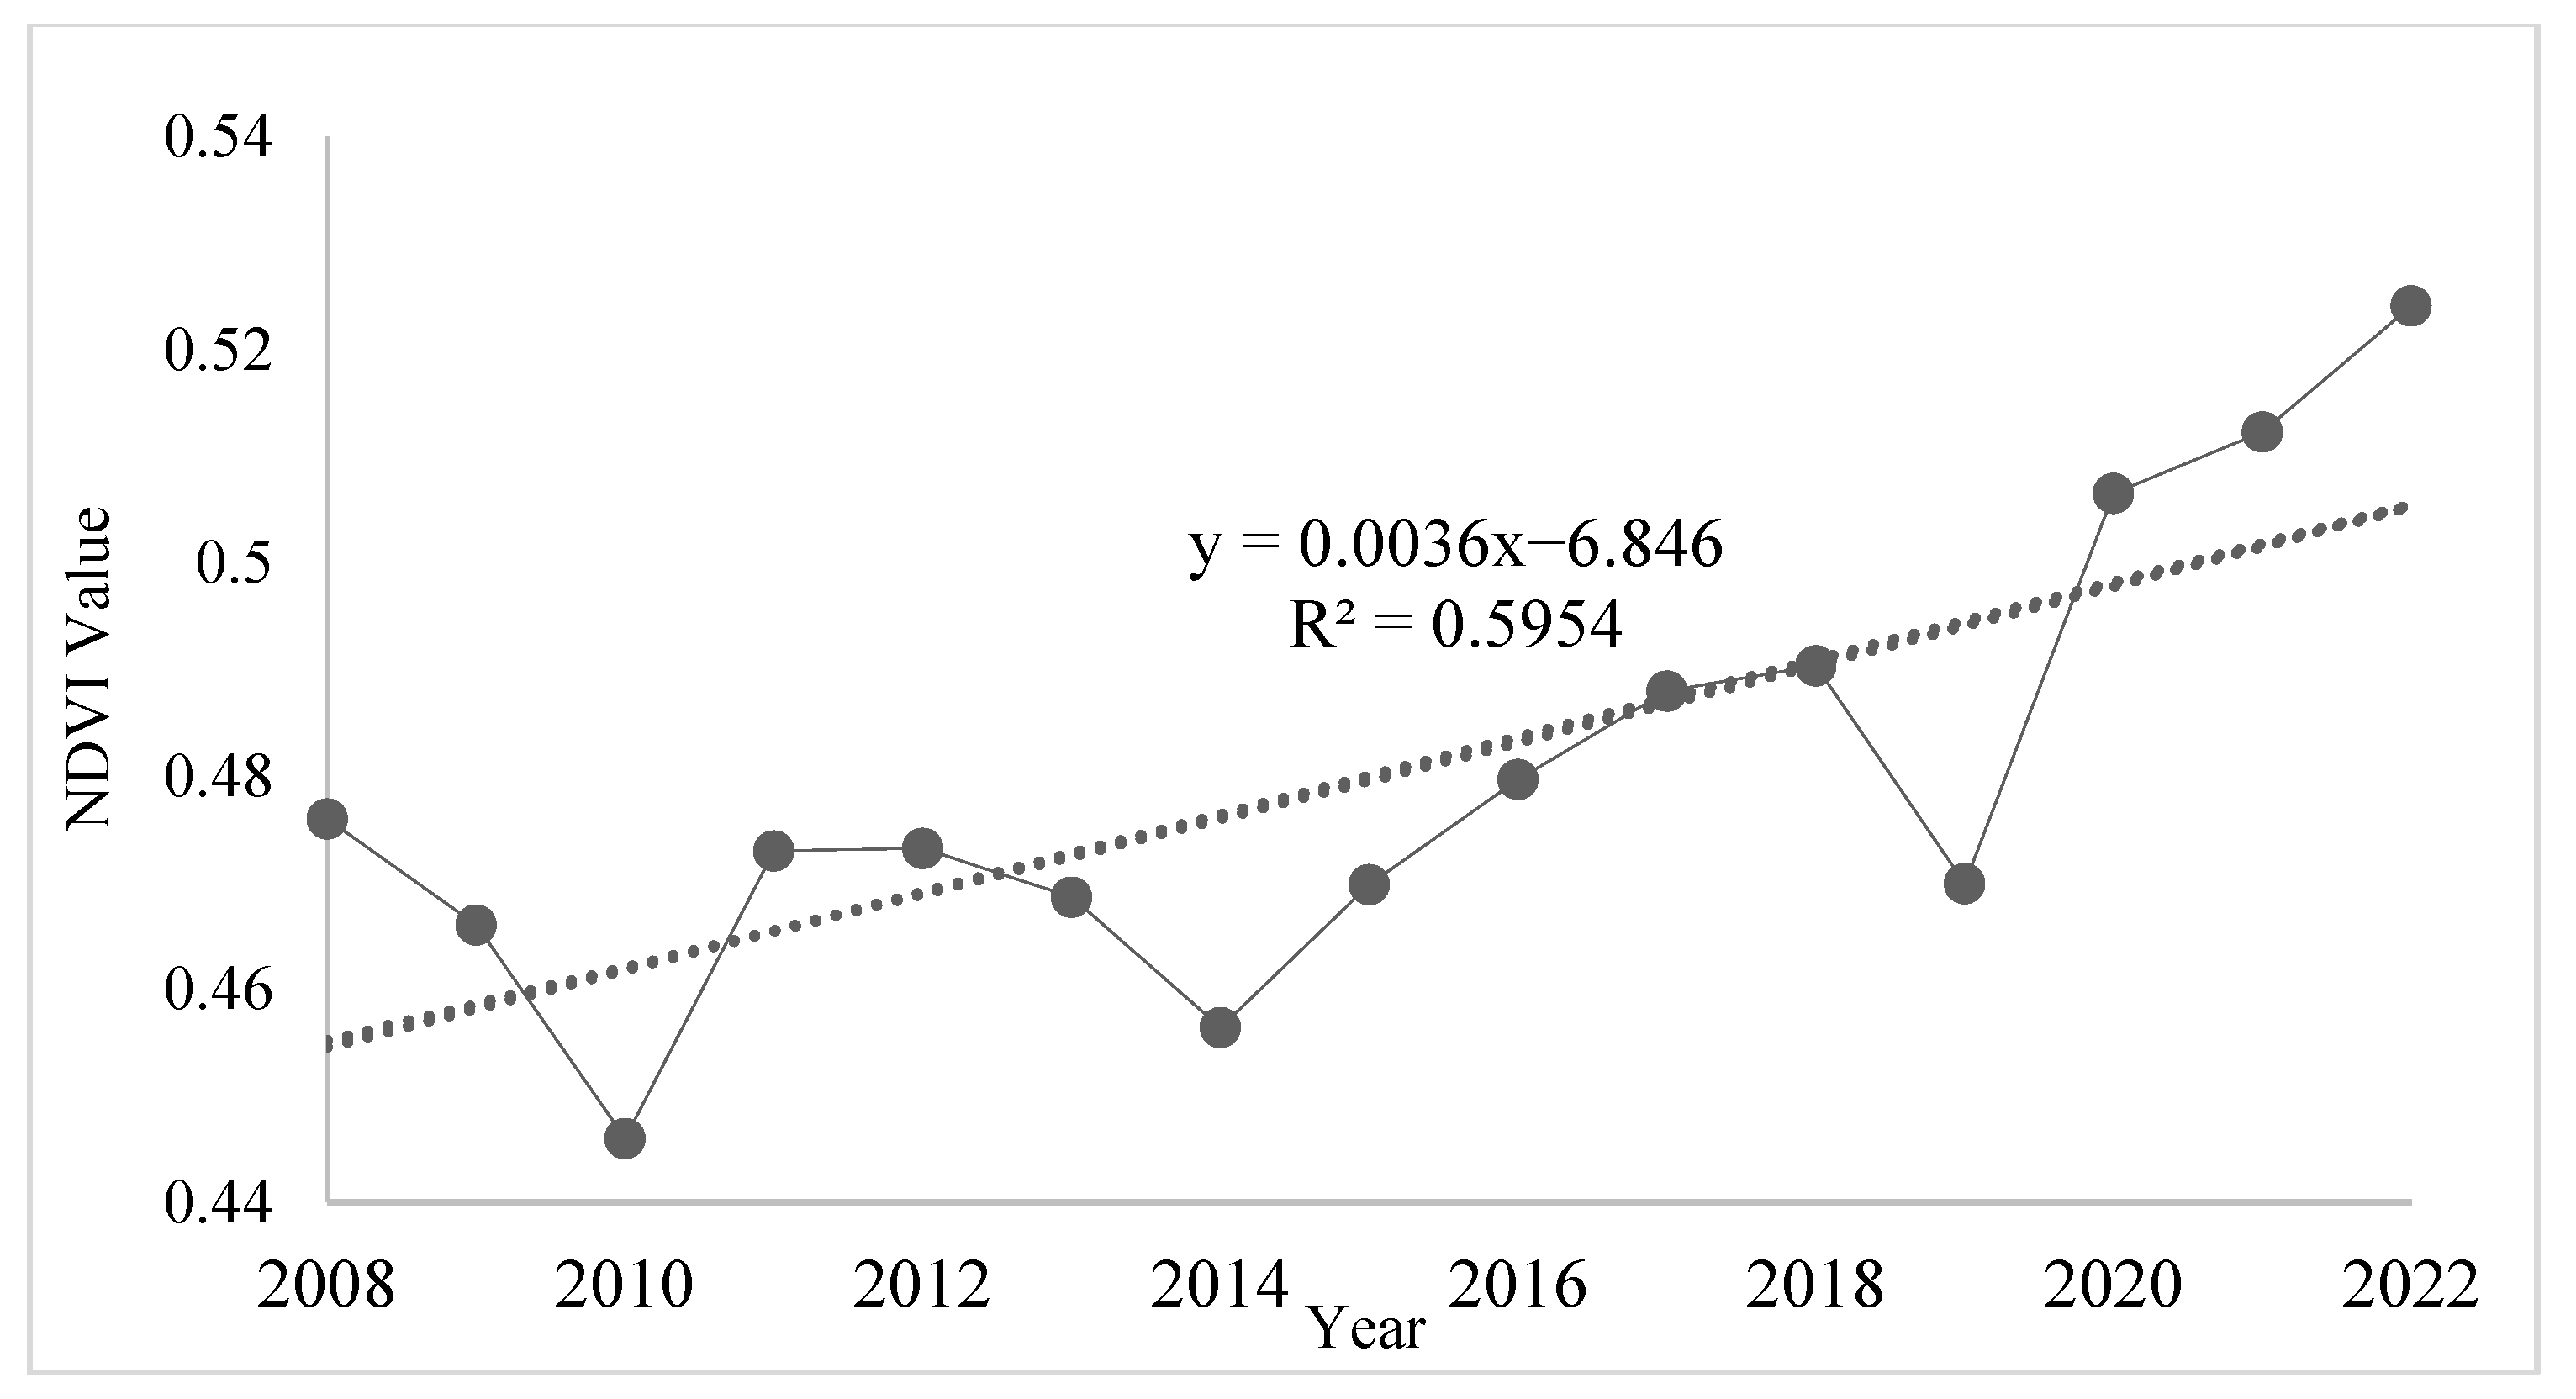
The values of NDVI in the Jinan section of the Yellow River Basin significantly increased from 0.476 in 2008 to 0.5241 in 2022, with an average increase of 0.095 (see
Table 3 and
Figure 3). This change reflects the gradual improvement in vegetation cover. Environmental protection measures implemented by the government, such as afforestation, returning farmland to forests and grasslands, wetland protection, and bans on grazing and hunting, have effectively reduced land degradation and desertification, promoting vegetation recovery. These measures have played a positive role in vegetation growth.
3.2. Spatio-Temporal Variation in Patterns of Vegetation Cover
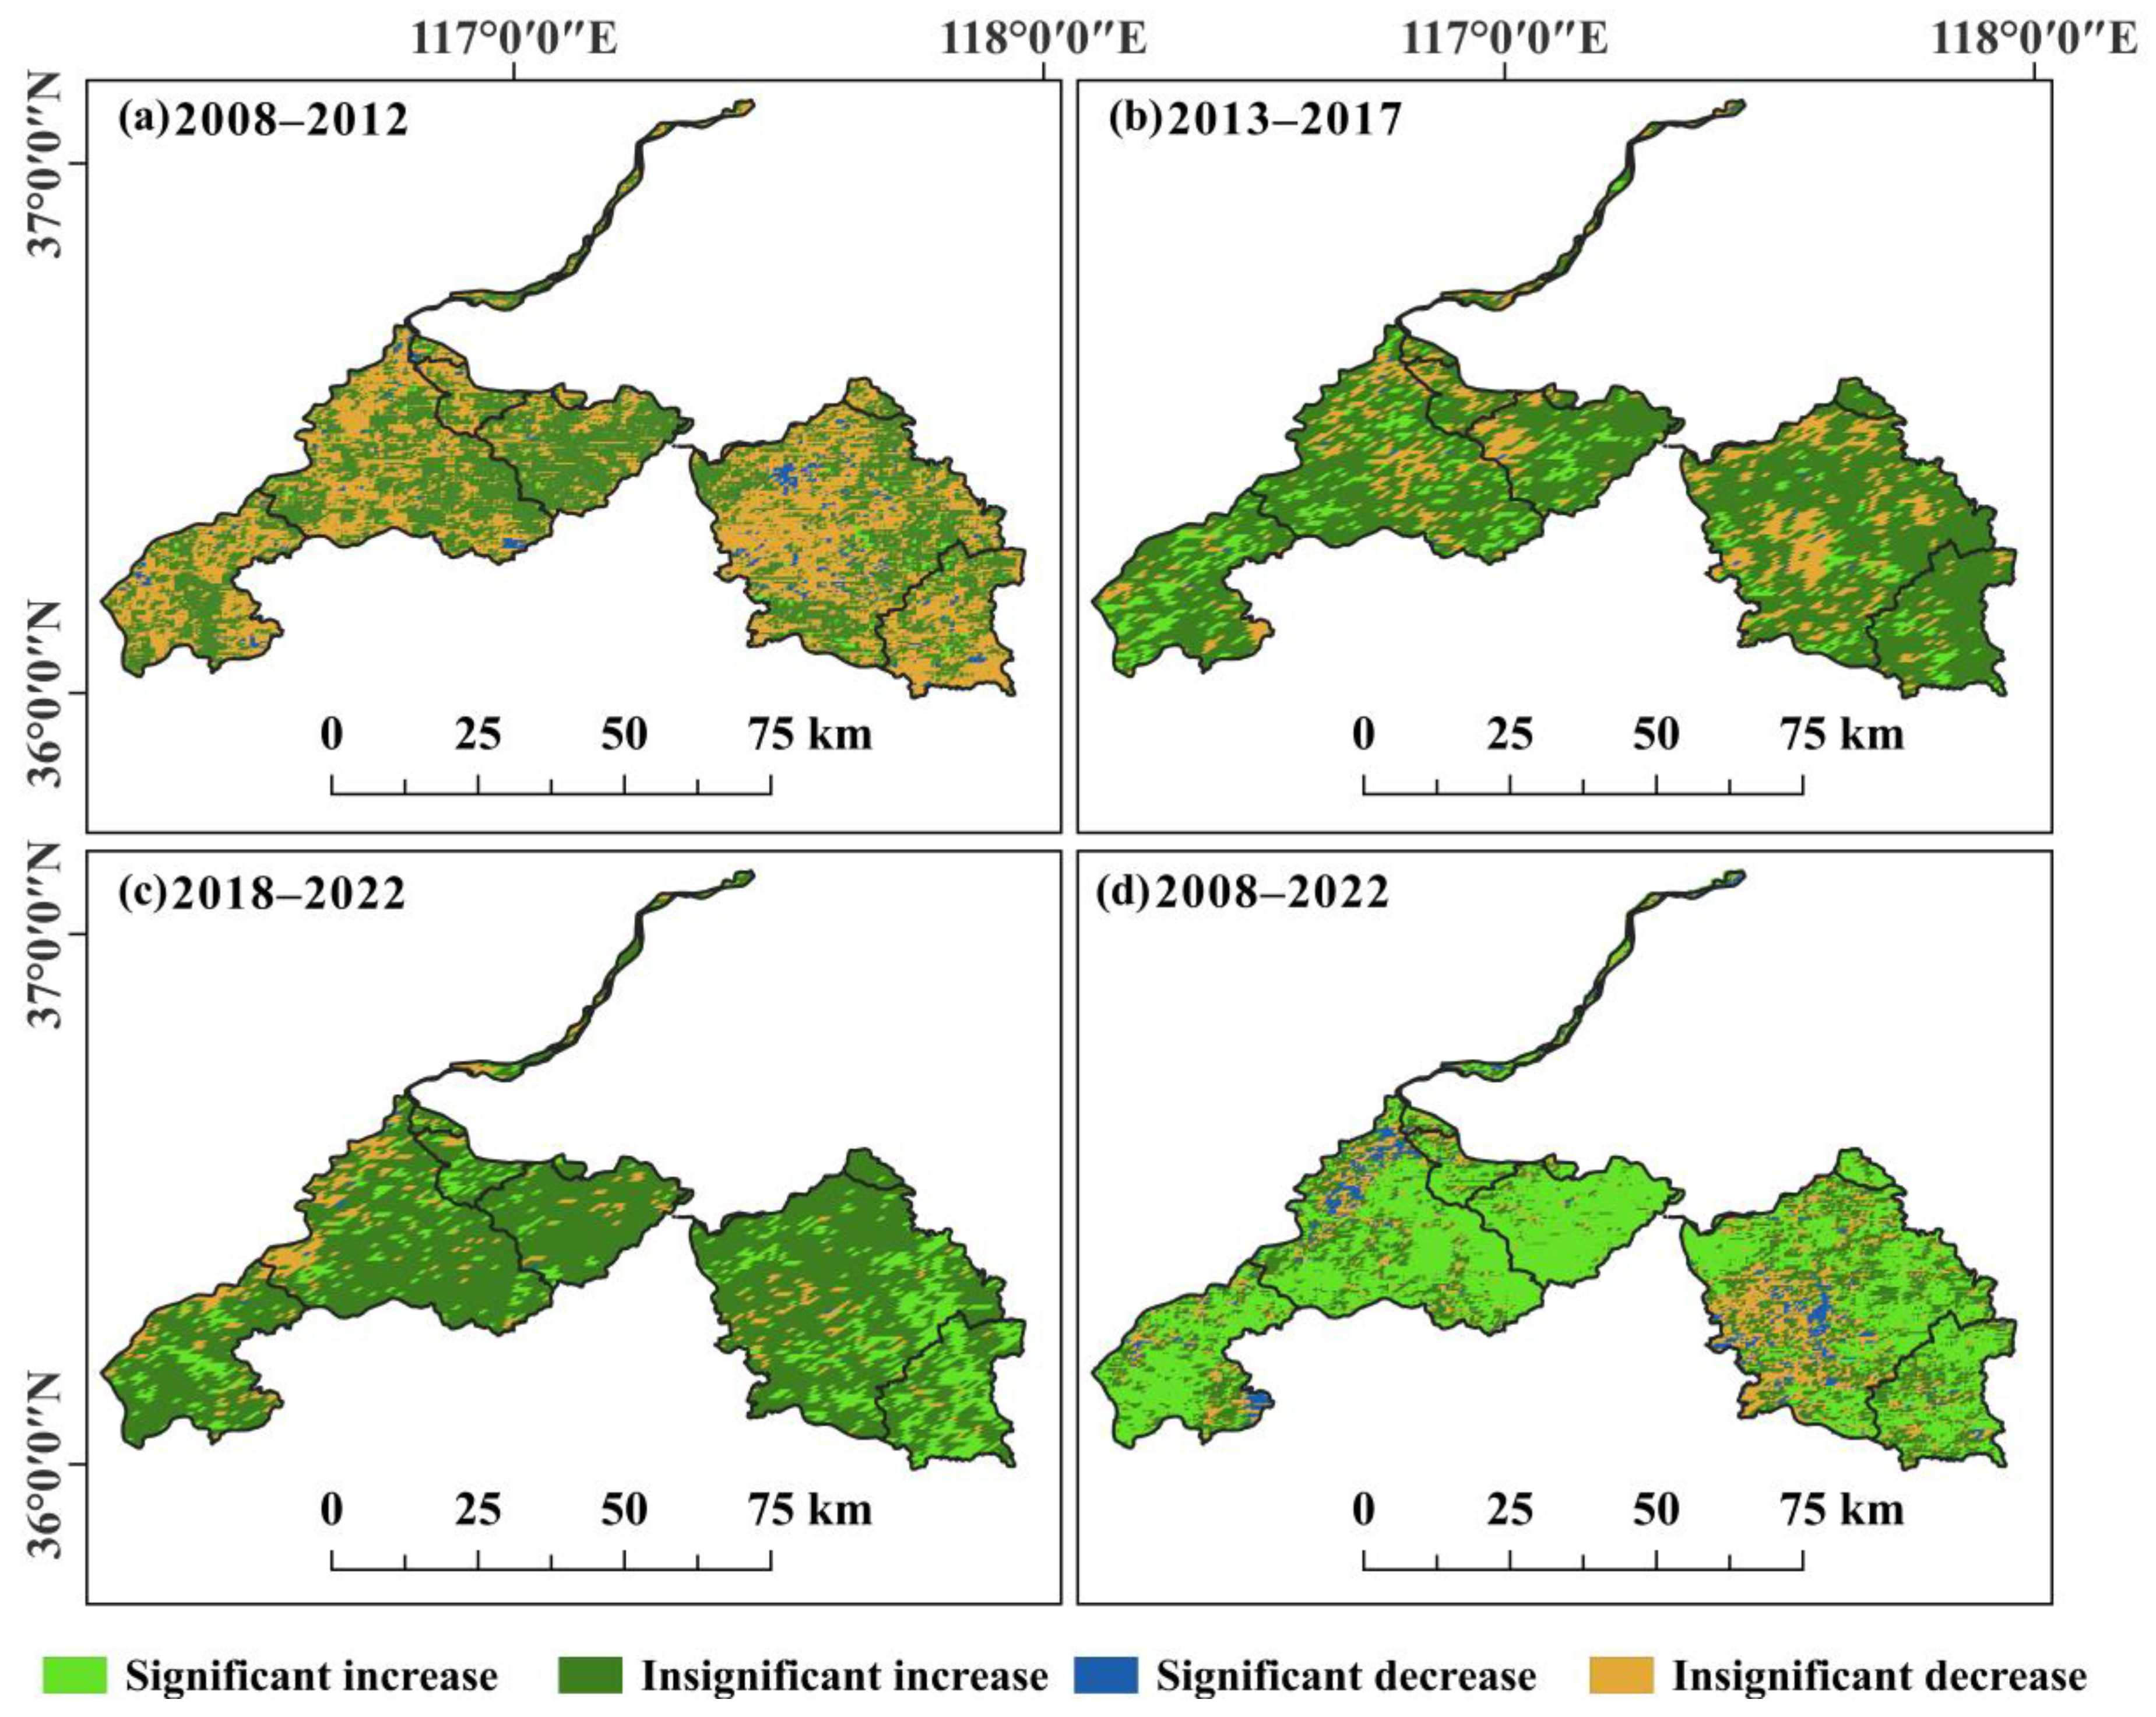
In order to clearly portray the changes in vegetation covering over the last 15 years in terms of both space and time, the data from this period were divided into three time periods (2008–2012, 2013–2017, and 2018–2022). A slope trend analysis was conducted on the NDVI data for these three groups of data to derive the trends in variation in NDVI (
Figure 4 and
Figure 5).
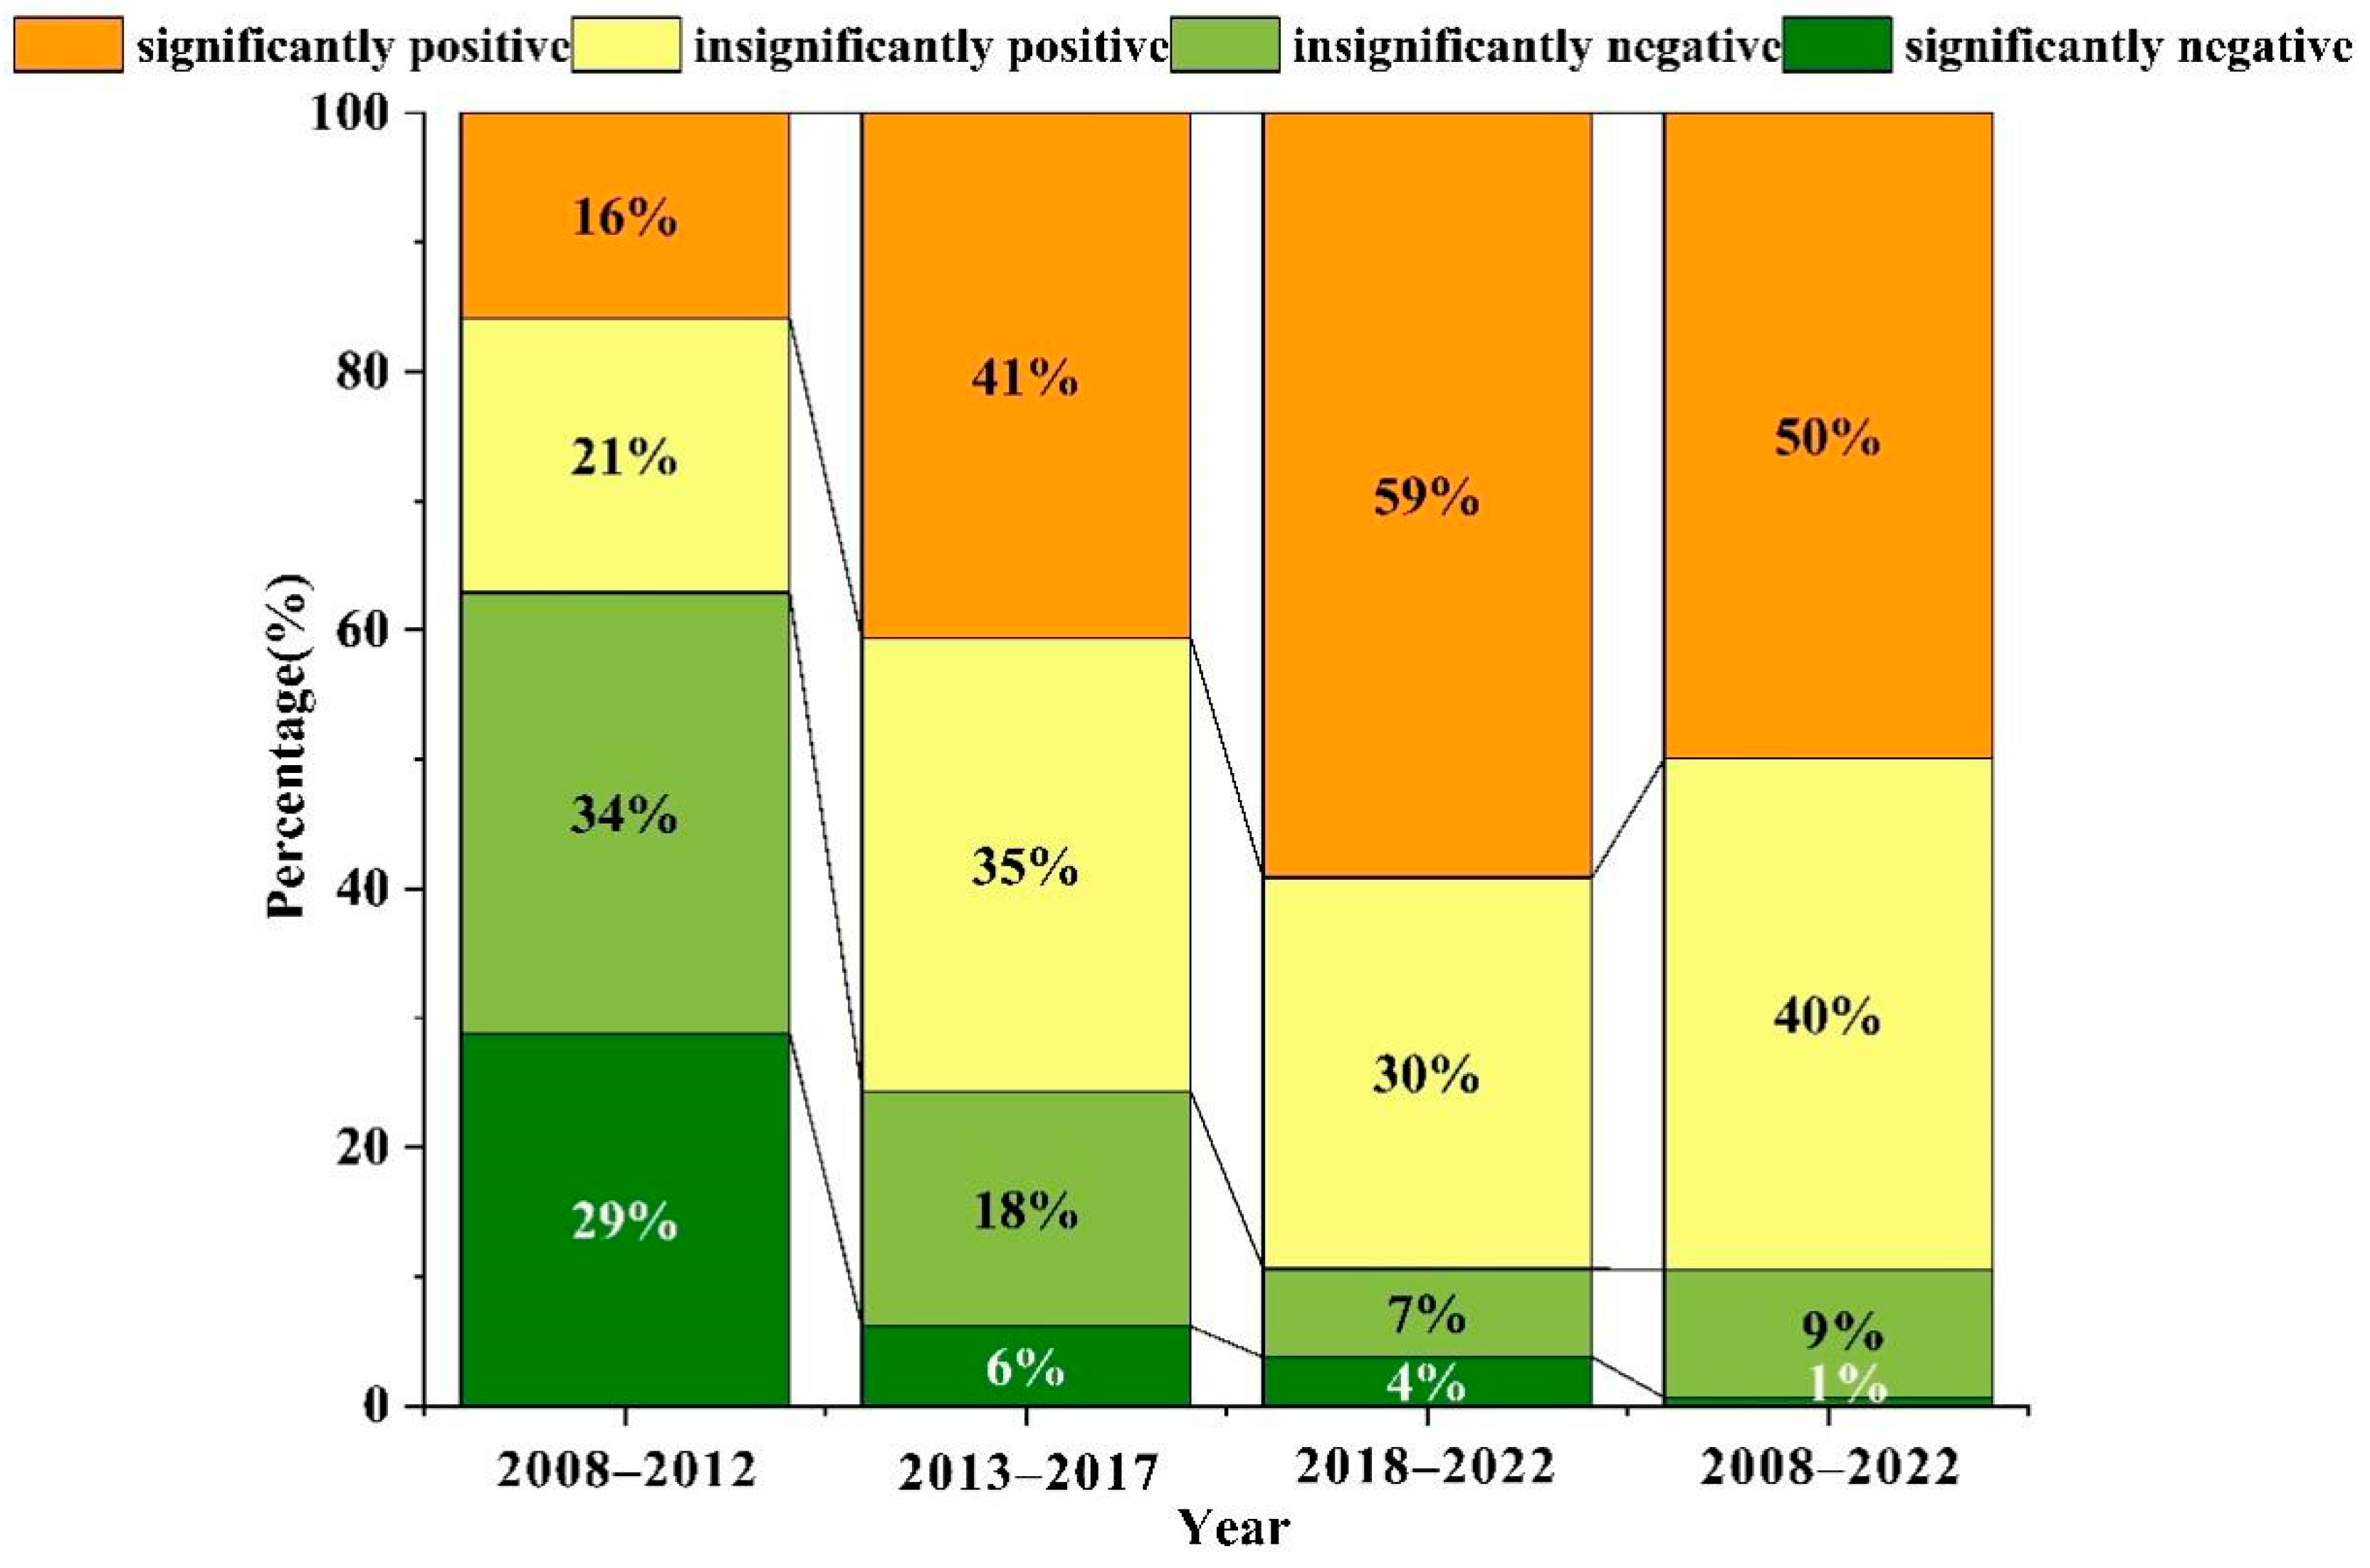
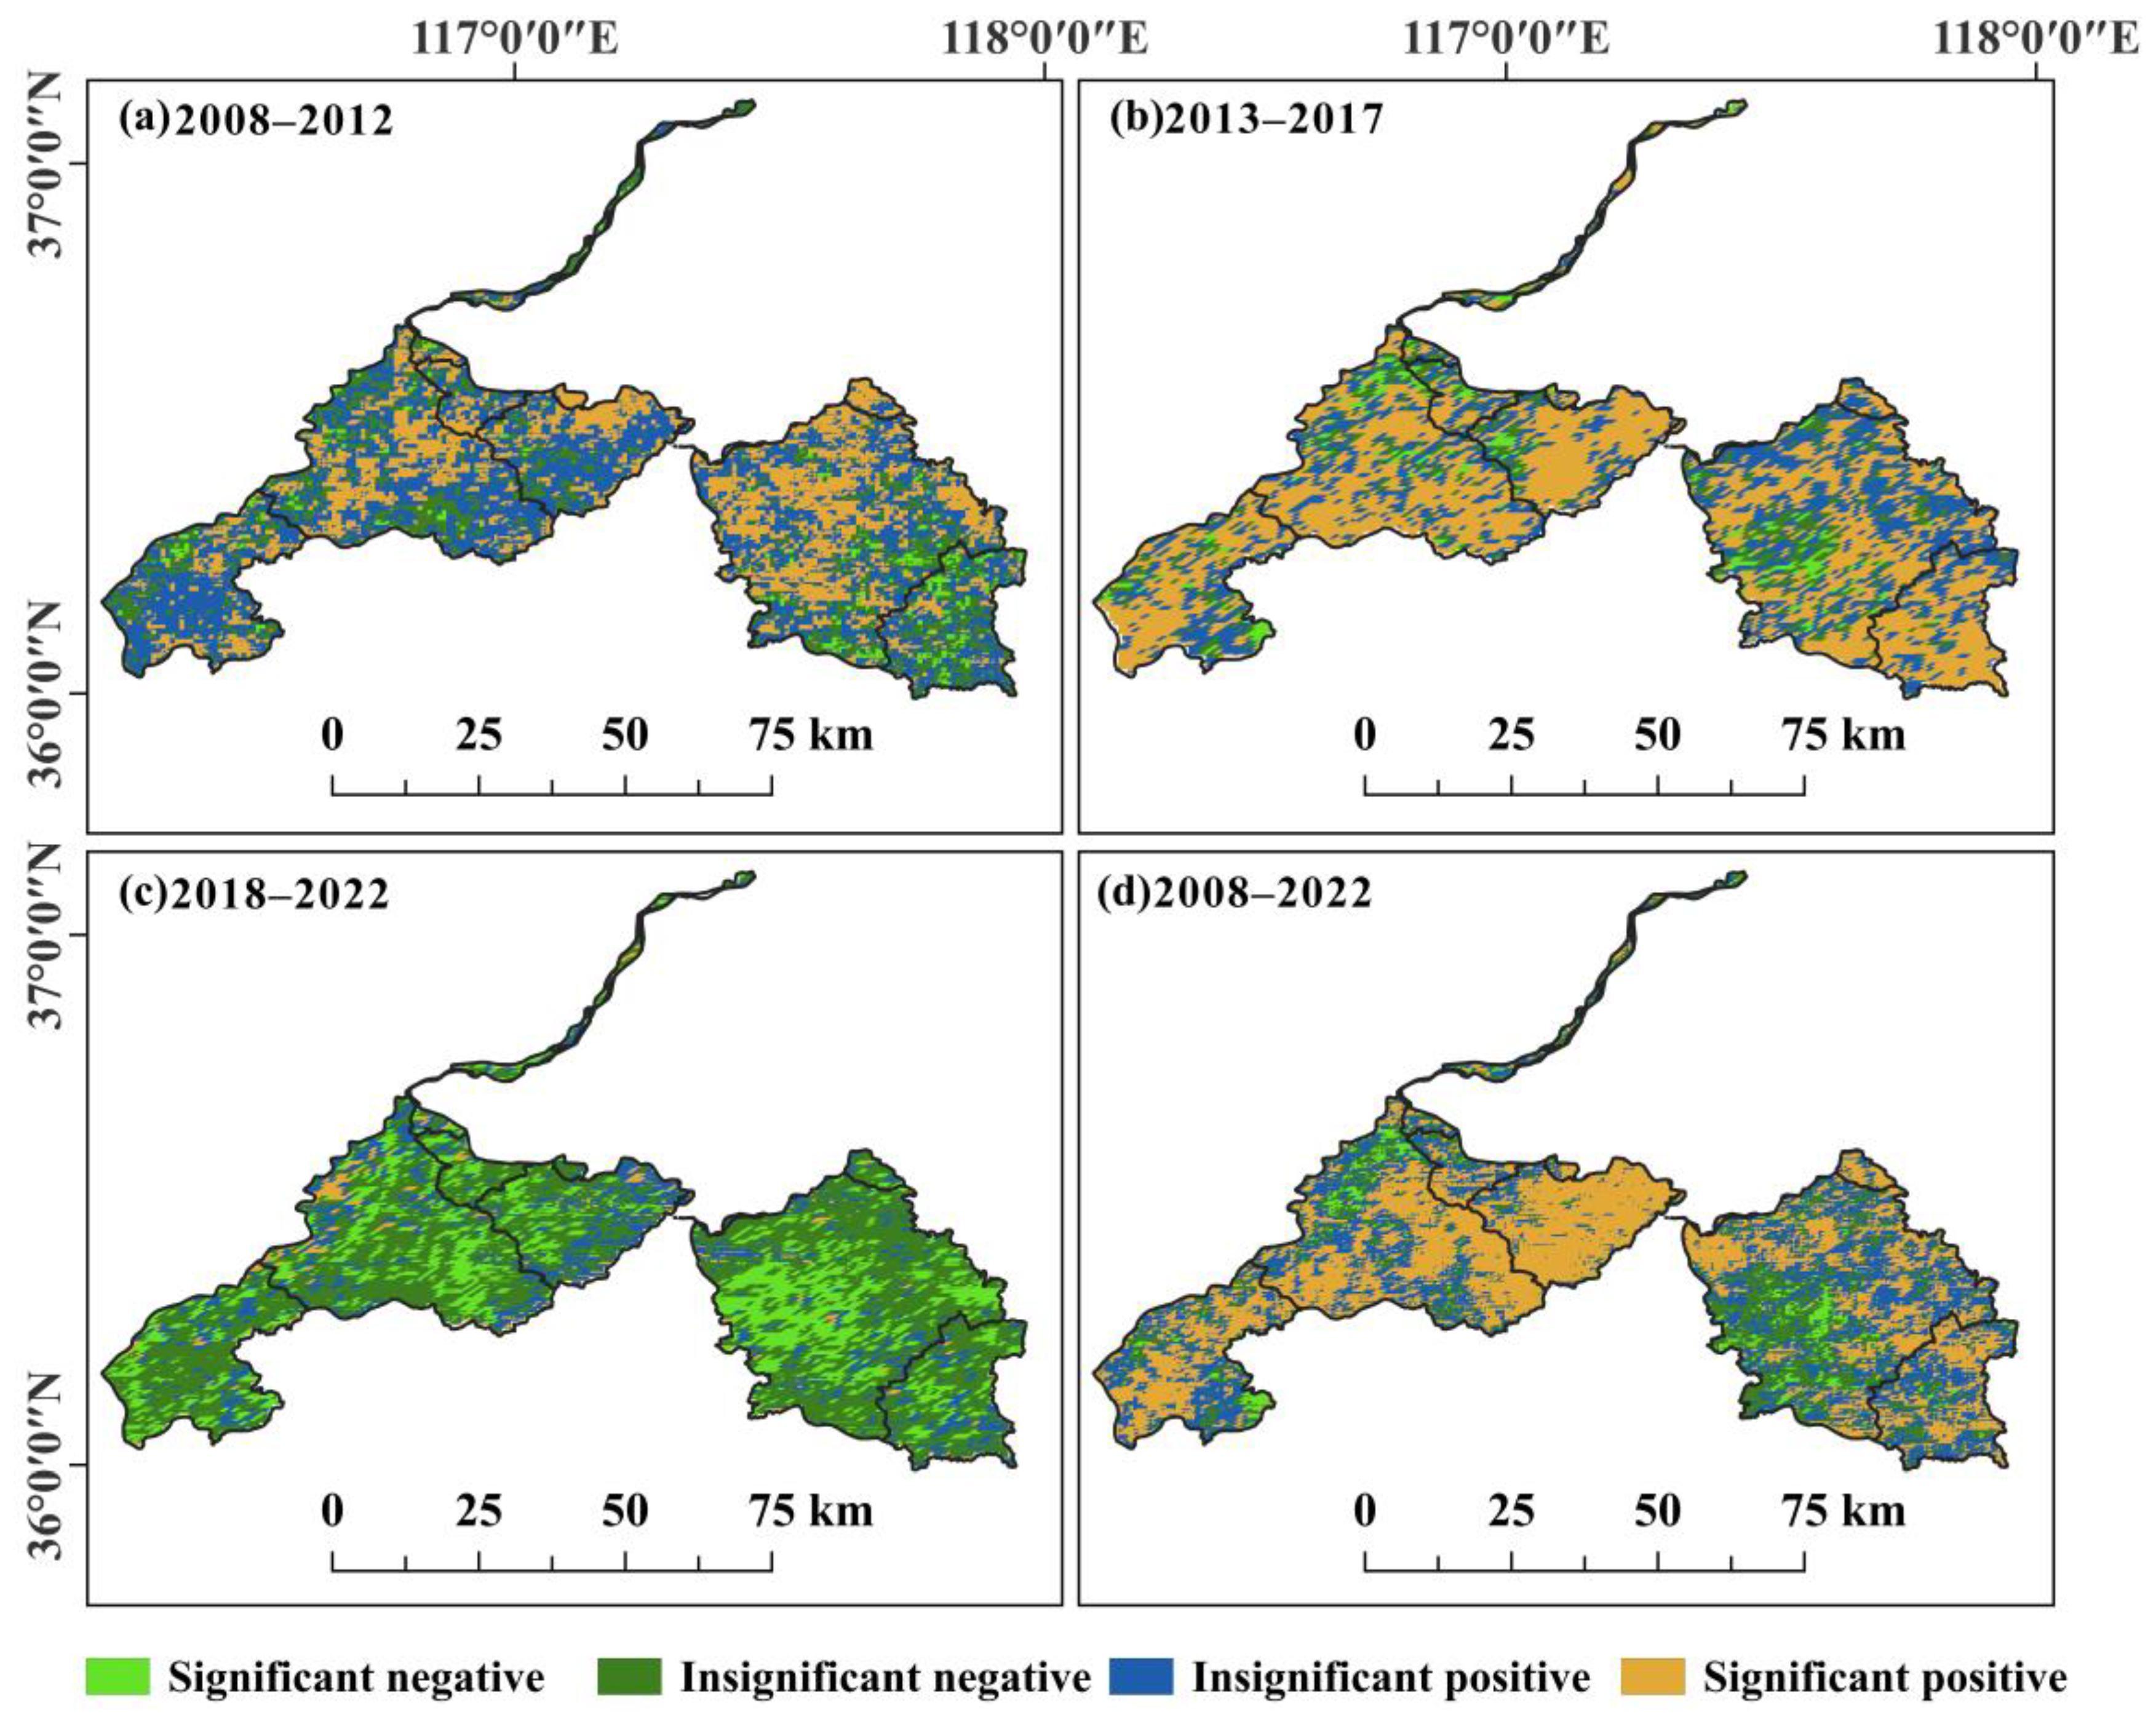
During the period of 2008–2012, 53% of the Jinan section of the Yellow River Basin showed an increasing vegetation trend, with 2% exhibiting a significant increase and 51% showing an insignificant increase. Conversely, 47% of the region displayed a decreasing trend, with 3% showing a significant decrease and 44% showing an insignificant decrease.
By 2013–2017, the area with an increasing vegetation trend rose significantly to 84%, with 11% experiencing a significant increase and 73% showing an insignificant increase. Areas with a decreasing trend declined to 16%, with no significant decreases observed and 16% showing an insignificant decrease. In 2018–2022, the area with an increasing vegetation trend further expanded to 92%, with a significant increase observed in 16% of the region and an insignificant increase in 76%. Areas with a decreasing trend dropped to 7%, with no significant decreases and 7% showing an insignificant decrease. These findings indicate that the trend of increasing vegetation cover has strengthened significantly in recent years, reflecting the effectiveness of national ecological governance and environmental protection policies, particularly in promoting ecological restoration. From a spatial perspective, the areas showing an increasing vegetation trend were primarily located in the mountainous regions of Changqing District, Pingyin County, and Laiwu District. These areas have benefited from ecological restoration projects and soil and water conservation efforts. In contrast, areas with a decreasing vegetation trend were mainly concentrated in urban areas, where the expansion of urban land use has resulted in the conversion of natural or semi-natural land, leading to reduced vegetation cover. Overall, between 2008 and 2022, 81% of the region exhibited an increasing vegetation trend, while 19% showed a decreasing trend. Suburban and mountainous areas demonstrated significant improvements in vegetation cover, indicating the success of ecological protection policies in these regions. Urban areas, however, showed a slight decline in vegetation cover, highlighting the localized environmental impact of urban development. The study reveals that ecological protection measures implemented by national and local governments in recent years, such as reforestation and soil and water conservation initiatives, have significantly improved vegetation cover in the Jinan section of the Yellow River Basin, particularly in mountainous regions. However, the observed reduction in vegetation cover in urban areas underscores the need to prioritize ecological principles during urbanization to achieve a balance between economic development and environmental protection.
3.3. NDVI Prediction for the Jinan Section of the Basin of the Yellow River in 2025
This study used the FLUS model based on 2019 NDVI data and related climate factors and human activity data to predict the distribution of NDVI in 2022. Compared with the actual distribution in 2022, the obtained Kappa coefficient is 0.655, which satisfies the standards for accuracy and can be applied to forecast the NDVI’s geographical distribution in the research region in 2025.
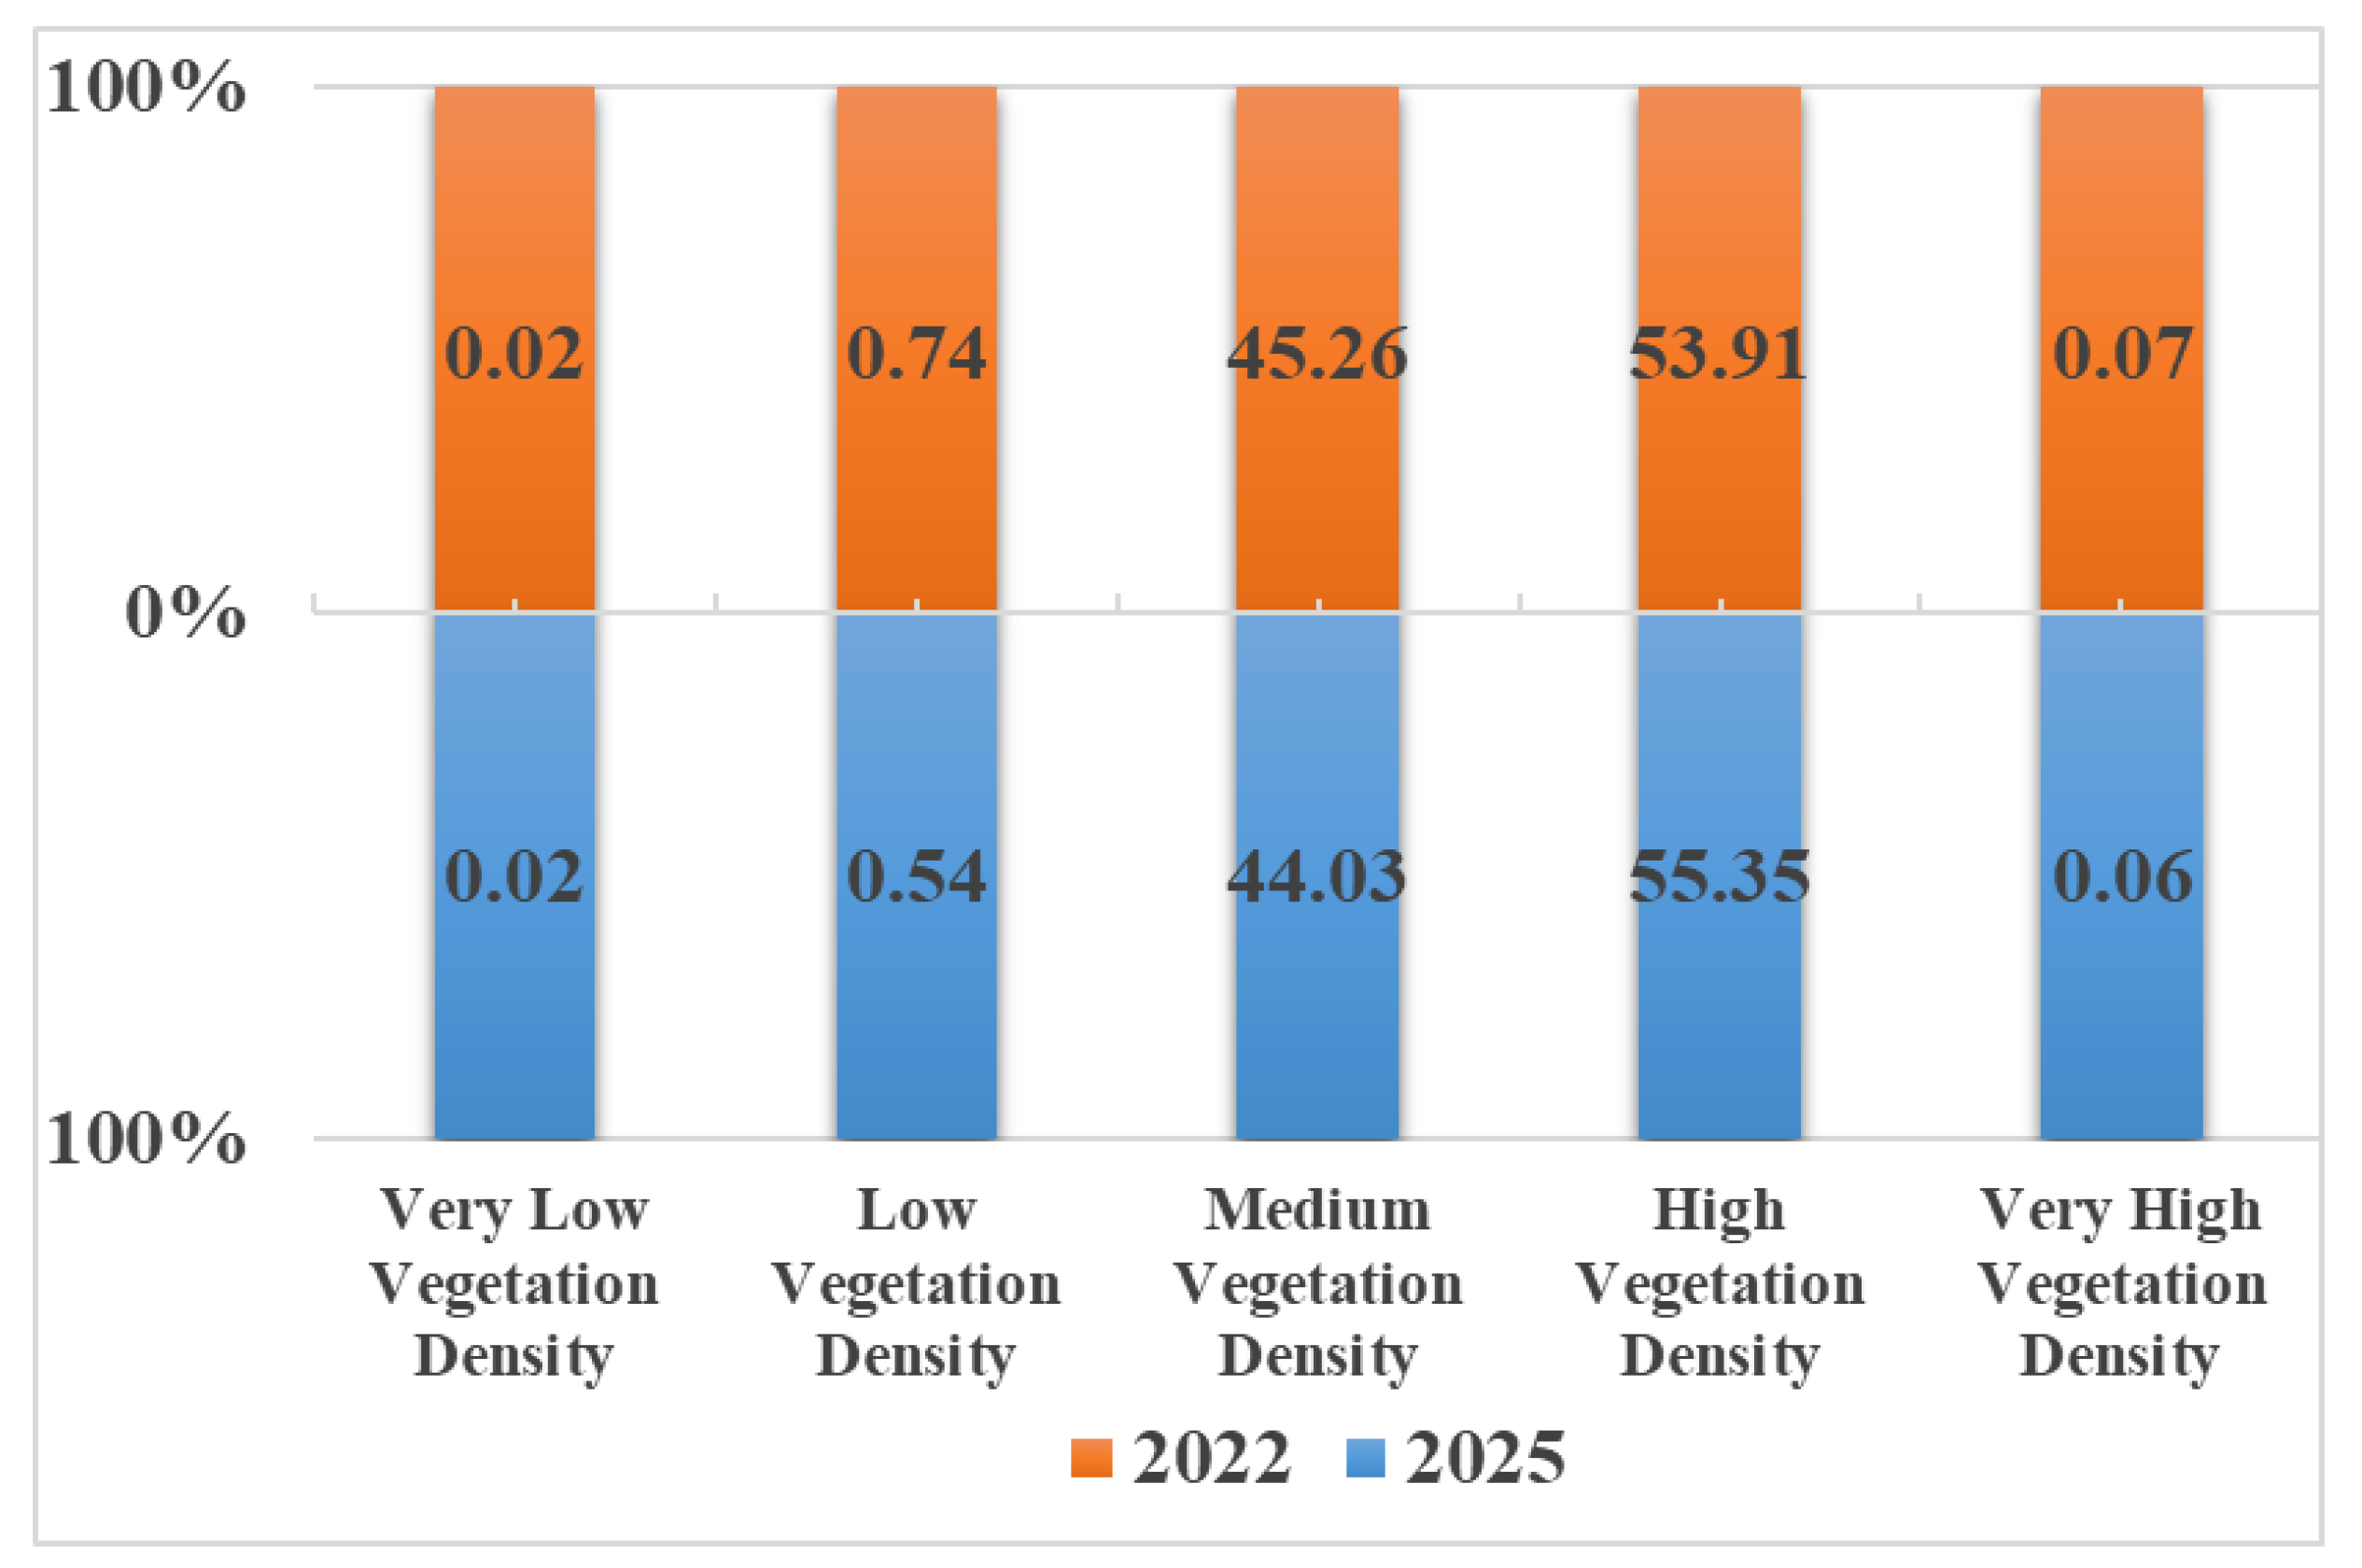
The predicted spatial distribution of NDVI in 2025 (
Figure 6 and
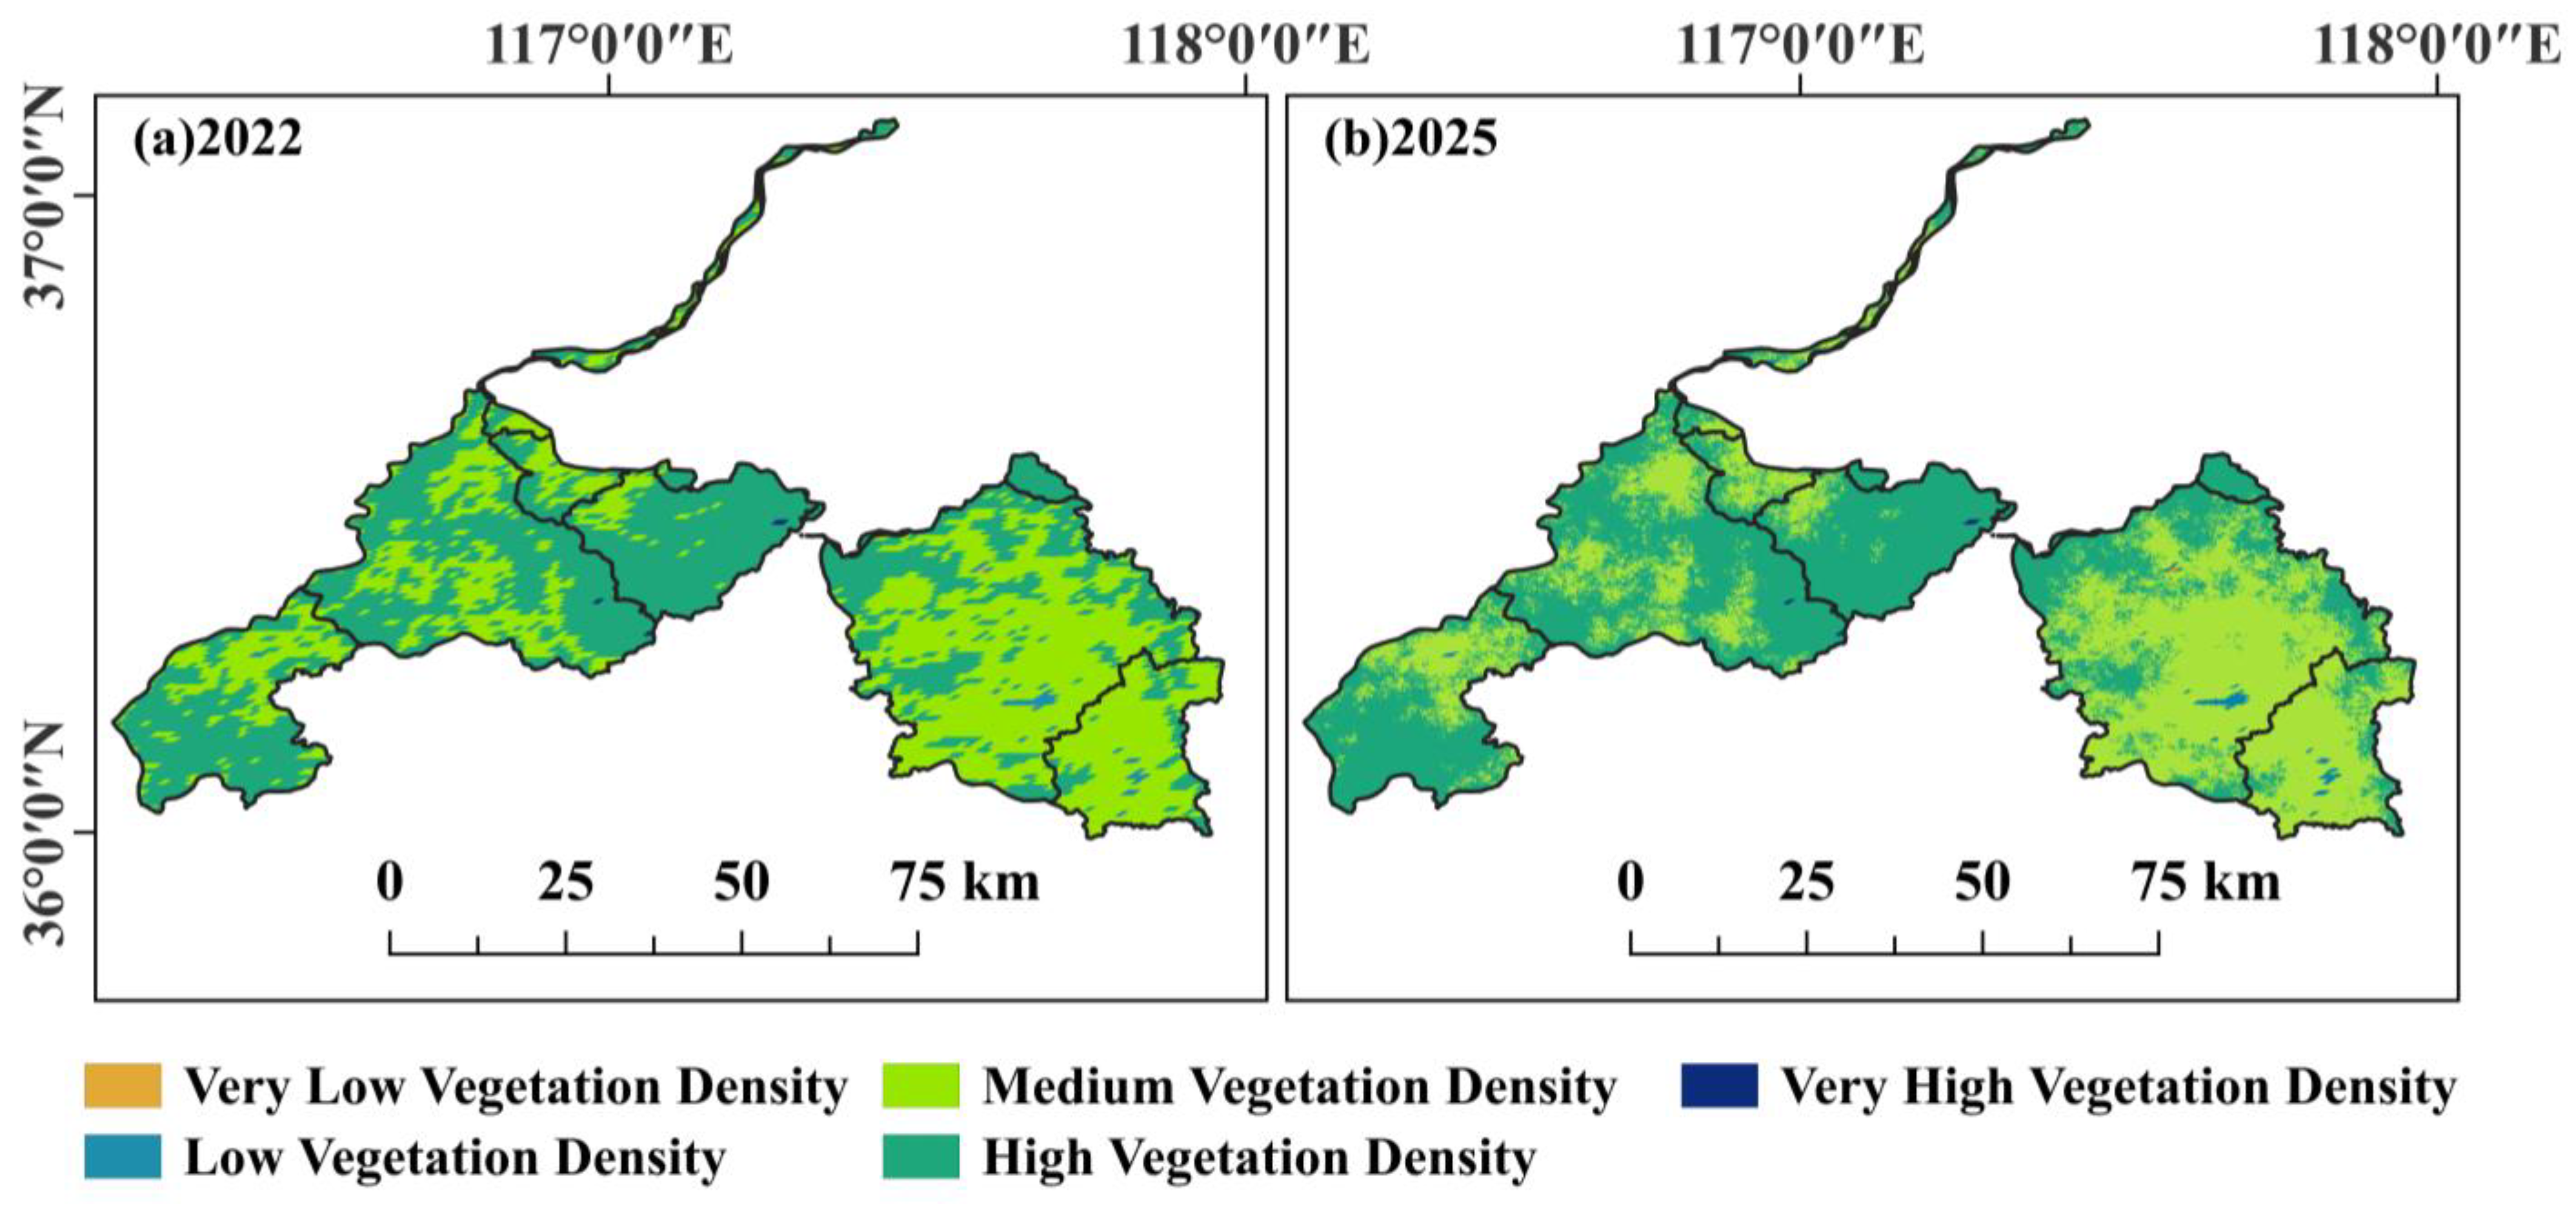
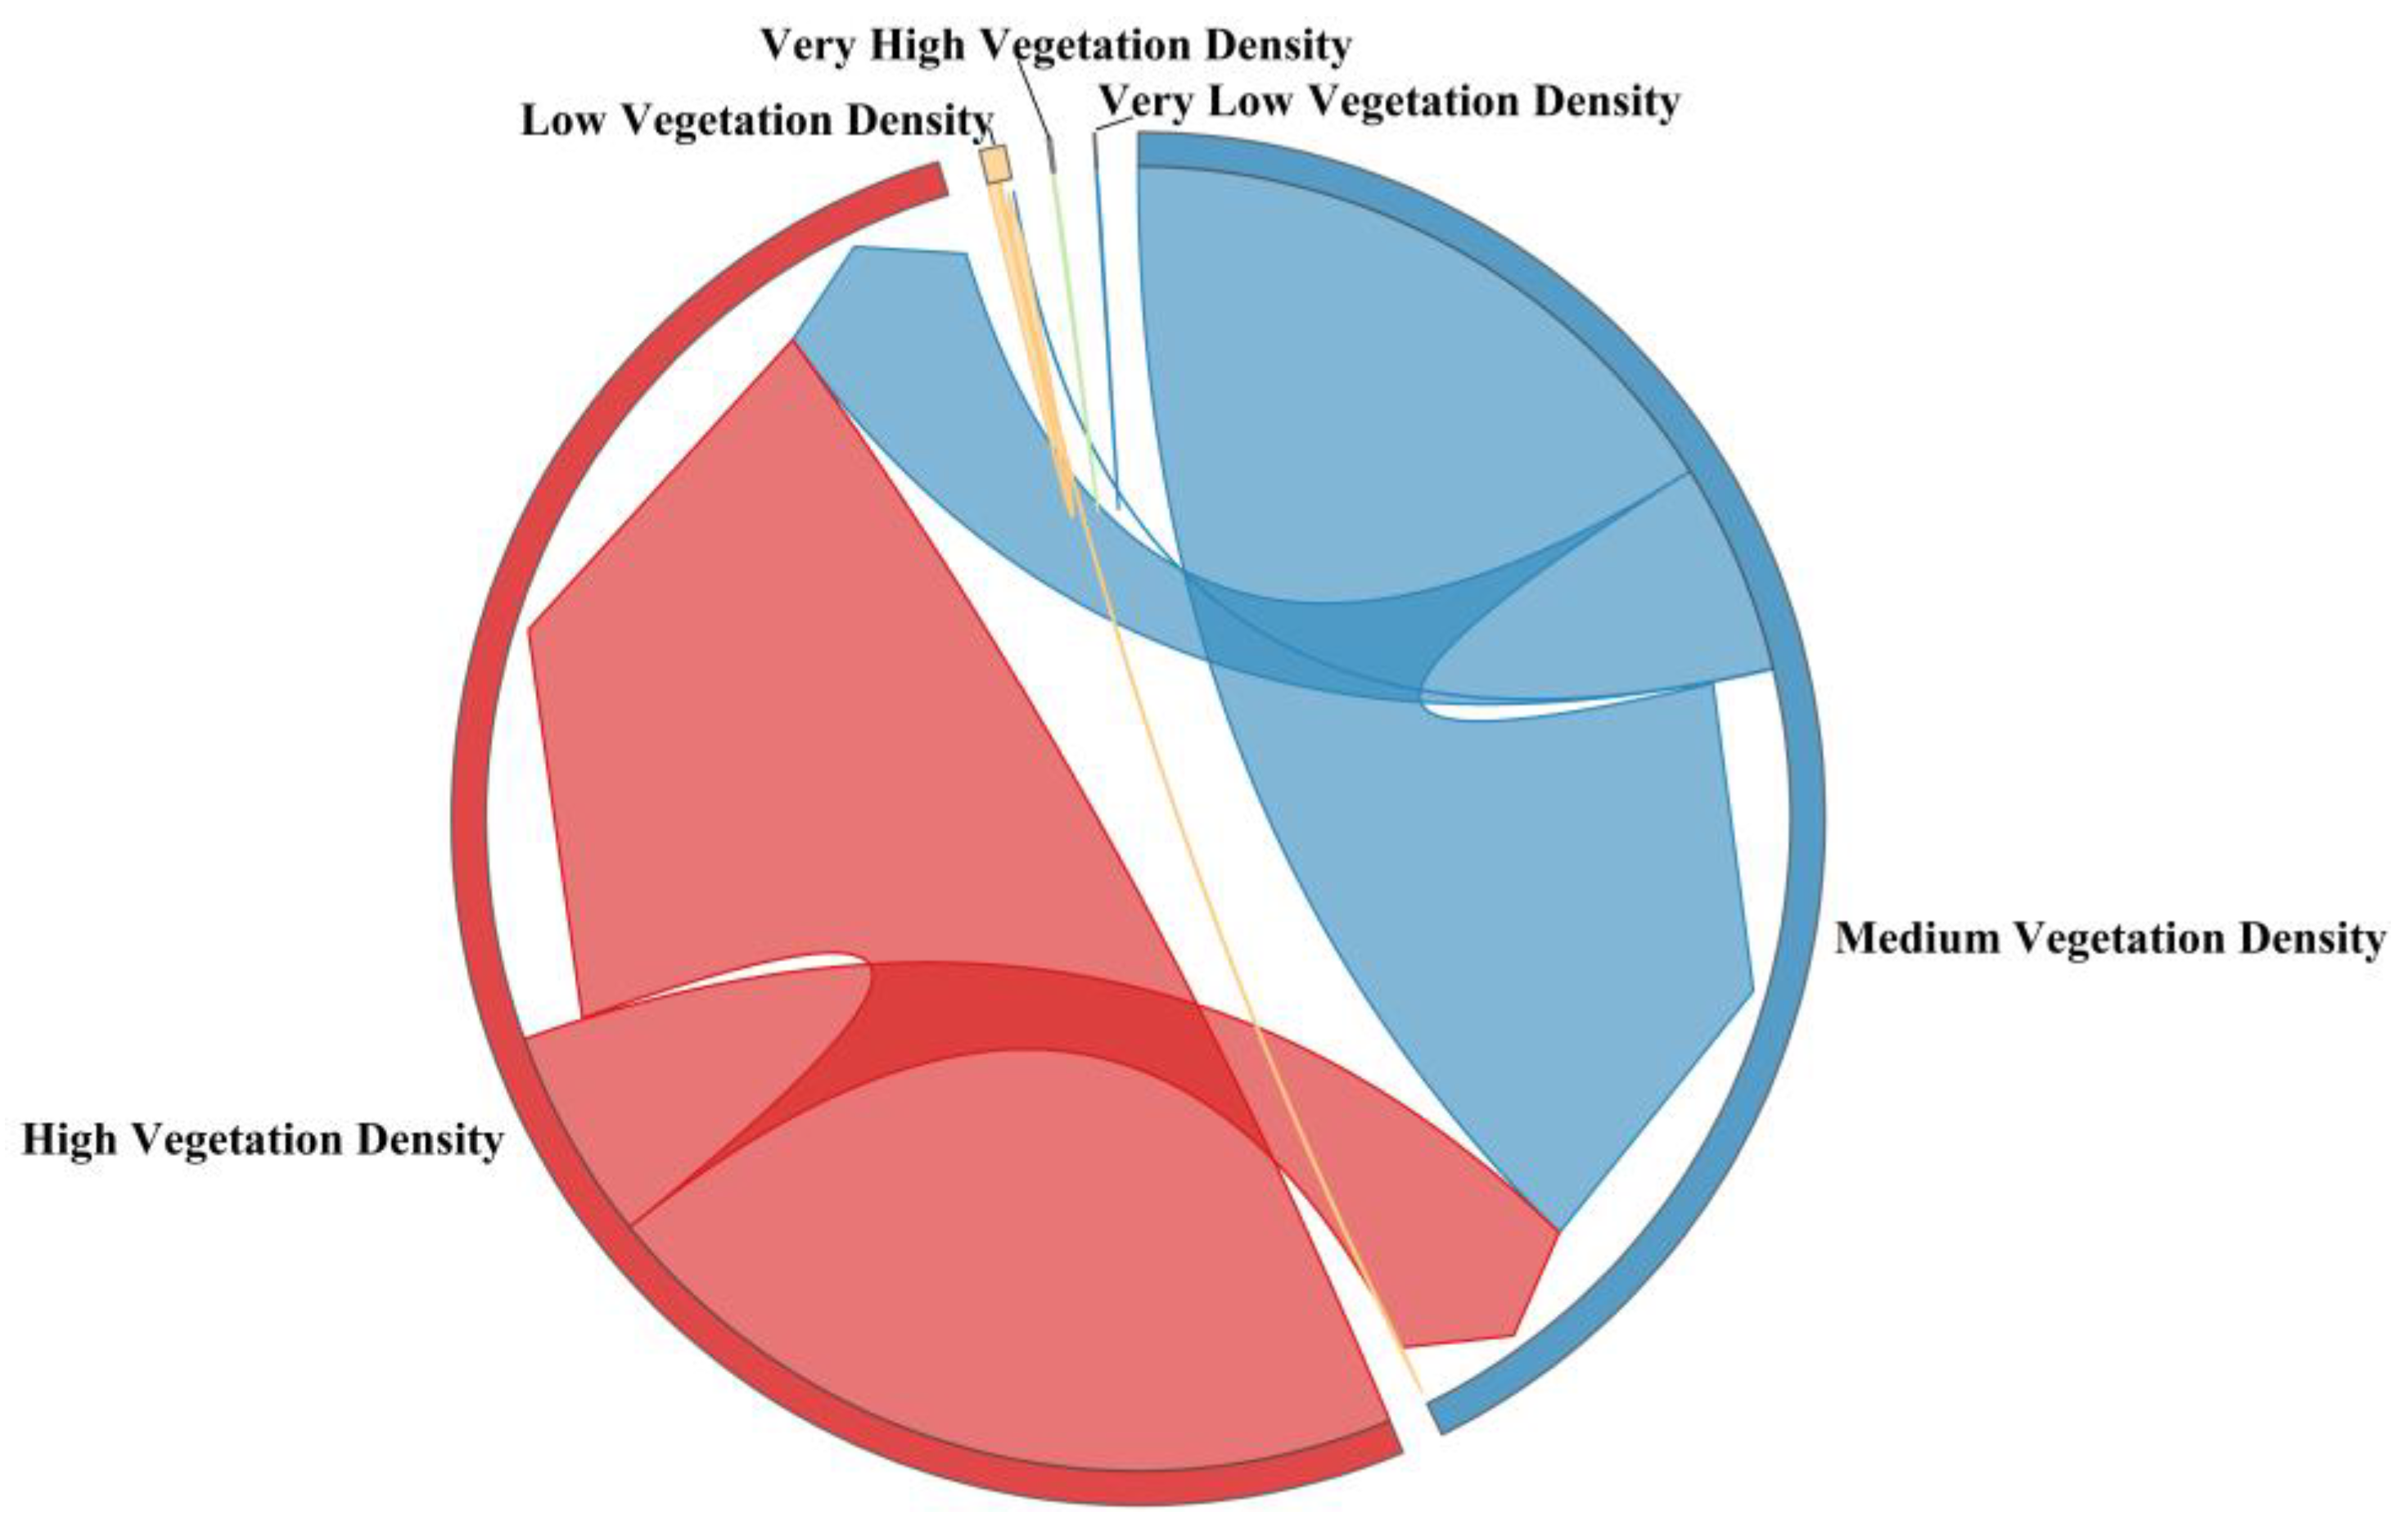
Figure 7) shows that, compared with 2022, the proportion of high-density coverage areas has increased, rising from 53.91% in 2022 to 55.35%. At the same time, the proportion of low coverage density areas decreased from 0.74% in 2022 to 0.54%, the percentage of areas with medium coverage density dropped from 44.26% to 44.03% and the change in extremely high coverage density areas was relatively small, from 0.07% to 0.06%. These changes are mainly reflected in the transformation of medium coverage density areas to high coverage density areas, as well as the reduction in low coverage density areas (
Figure 8). This trend can be attributed to several factors: firstly, the improvement of climate conditions in recent years (such as increased PRE and TEM changes) may have promoted vegetation growth, thereby increasing NDVI values. Second, some facets of human endeavors, such as those aimed at restoring vegetation and land management measures, may also have a positive impact on vegetation cover. The results suggest that vegetation cover in the study area will continue to improve, with a spatial distribution pattern tending towards higher coverage density. This provides a scientific basis for regional ecological protection and sustainable land management, while also highlighting the need to continue monitoring the impact of human activities on vegetation cover to ensure ecosystem stability and healthy development.
3.4. Assessment of Influencing Factors
3.4.1. Selection of Indicators
TEM and PRE are important factors affecting vegetation growth. Consequent to the phenomenon of global alterations in climatic conditions, resulting in deleterious effects on the vegetation’s growth environment and a marked reduction in vegetation coverage. GDP is a significant gauge to assess the economic advancement status of a locality, mirroring the level of productivity and economic activity within that region. An increase in GDP usually means that the region has more resources for environmental protection and vegetation construction, which may have a positive impact on NDVI. POP acts as a marker of the degree of congestion and the intensity of human activities within a given region. High POP areas may imply greater land use pressure and resource consumption, which could influence the development of plants and NDVI. At the same time, POP may also affect land utilization patterns and the execution of ecological and environmental protection measures, thereby indirectly affecting NDVI. Studying the impact of these elements on plant NDVI has important practical significance. Therefore, the above four types of data are selected as driving factors for our research.
3.4.2. Analysis of Factor Detection
Utilizing the factor detection outcomes of the Optimal Parameter-based Geographic Detector (
Table 4), we delved into the extent of influence exerted by various drivers on vegetation coverage. It can be observed that, given
p ≤ 0.05, the foremost three factors affecting NDVI in 2008 were POP (0.021), GDP (0.04), and PRE (0.019). In 2013, the three main variables influencing NDVI were POP (0.048), TEM (0.073), and GDP (0.046). In 2018, the three main variables influencing NDVI were POP (0.053), TEM (0.031), and GDP (0.024). In 2022, the three main variables influencing NDVI were POP (0.018), PRE (0.032), and GDP (0.04). From 2008 to 2022, POP consistently emerged as the most significant driver of NDVI, likely due to its close association with the intensity of human activities and changes in land use. The impact of TEM and PRE exhibited temporal fluctuations, indicating that climatic conditions exhibit spatial and temporal variability in their effects on vegetation coverage. The role of GDP reflects the potential of economic development to drive ecological system construction. These findings suggest that both natural and socio-economic factors should be considered comprehensively, with their varying influences over time, to provide a scientific basis for formulating regional ecological protection policies.
3.4.3. Examination of Interaction Identification
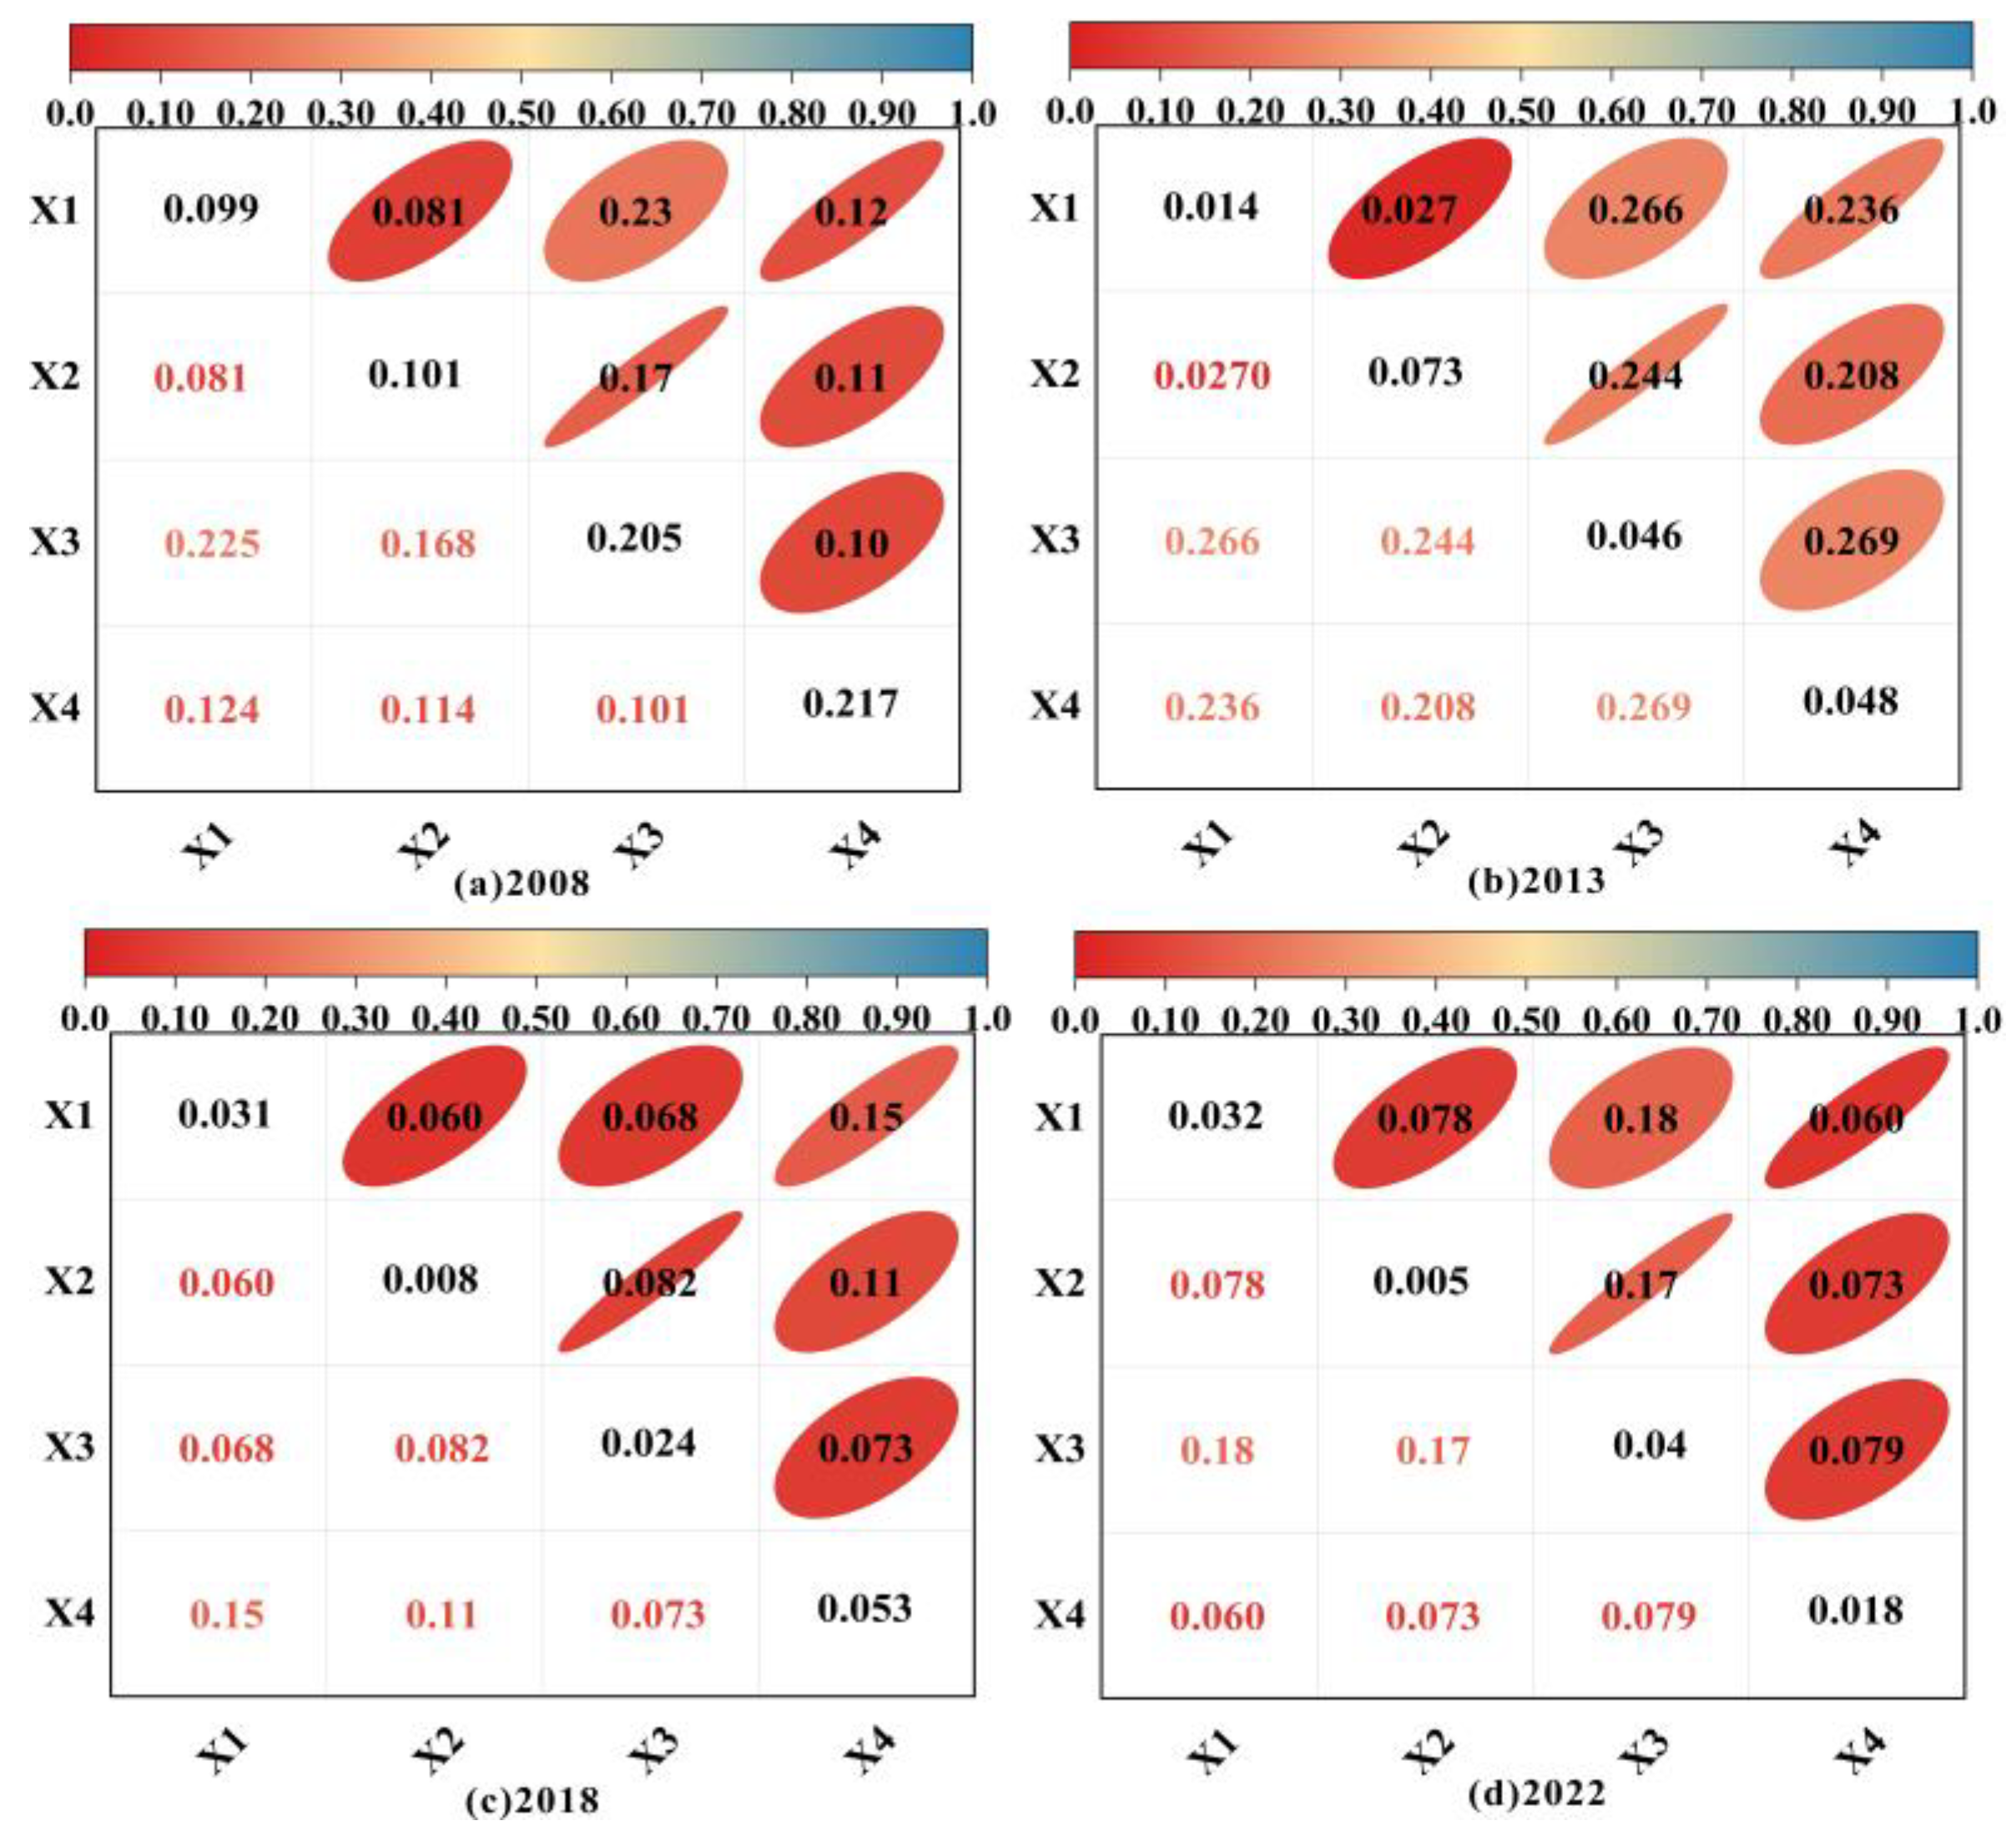
Detection of individual factors solely assesses the impact of individual drivers on vegetation coverage, as well as interaction detection offers a more nuanced analysis, examining how the interplay between these factors influences the spatiotemporal variations in vegetation coverage. Utilizing the Optimal Parameter-based Geospatial Detector (OPGD), we analyzed the interaction among driving factors. The results show that, in 2008, the factors with significant impacts on NDVI were TEM ∩ GDP (0.124), PRE ∩ GDP (0.168), and TEM ∩ POP (0.124). The factors that had a greater impact on NDVI in 2013 were PRE ∩ GDP (0.266), TEM ∩ GDP (0.266), and GDP ∩ POP (0.269). In 2018, the factors that had a greater impact on NDVI were PRE ∩ GDP (0.082), PRE ∩ POP (0.107), and TEM ∩ POP (0.152). In 2022, the major factors affecting NDVI were GDP ∩ TEM (0.175), PRE ∩ GDP (0.165), and POP ∩ GDP (0.079) (
Figure 9). These results indicate that the combined effects of driving factors have a significantly greater impact on vegetation coverage than the independent effects of individual factors, suggesting that vegetation coverage changes are the result of the interplay of multiple factors. In particular, interactions involving GDP repeatedly emerged as key factors, highlighting the regulatory role of economic development in influencing vegetation coverage when combined with natural factors. Additionally, the interactions between temperature, precipitation, and population demonstrated dynamic changes across different years. This suggests that when formulating ecological protection policies, it is essential to consider the synergistic effects of multiple factors, especially the mutually reinforcing relationship between economic development and the natural environment, in order to develop more comprehensive and science-based management strategies.
3.5. Correlation Exploration
Heat and moisture are essential conditions for plant growth, and appropriate PRE and TEM can promote rapid plant development. To reveal the association between NDVI, TEM, and PRE, we processed the NDVI information to ascertain the correlation analysis results among NDVI, TEM, and PRE, to understand the relationship between PRE, TEM, and NDVI in the Jinan section of the Yellow River Watershed throughout the previous fifteen years.
3.5.1. Association Between NDVI and PRE
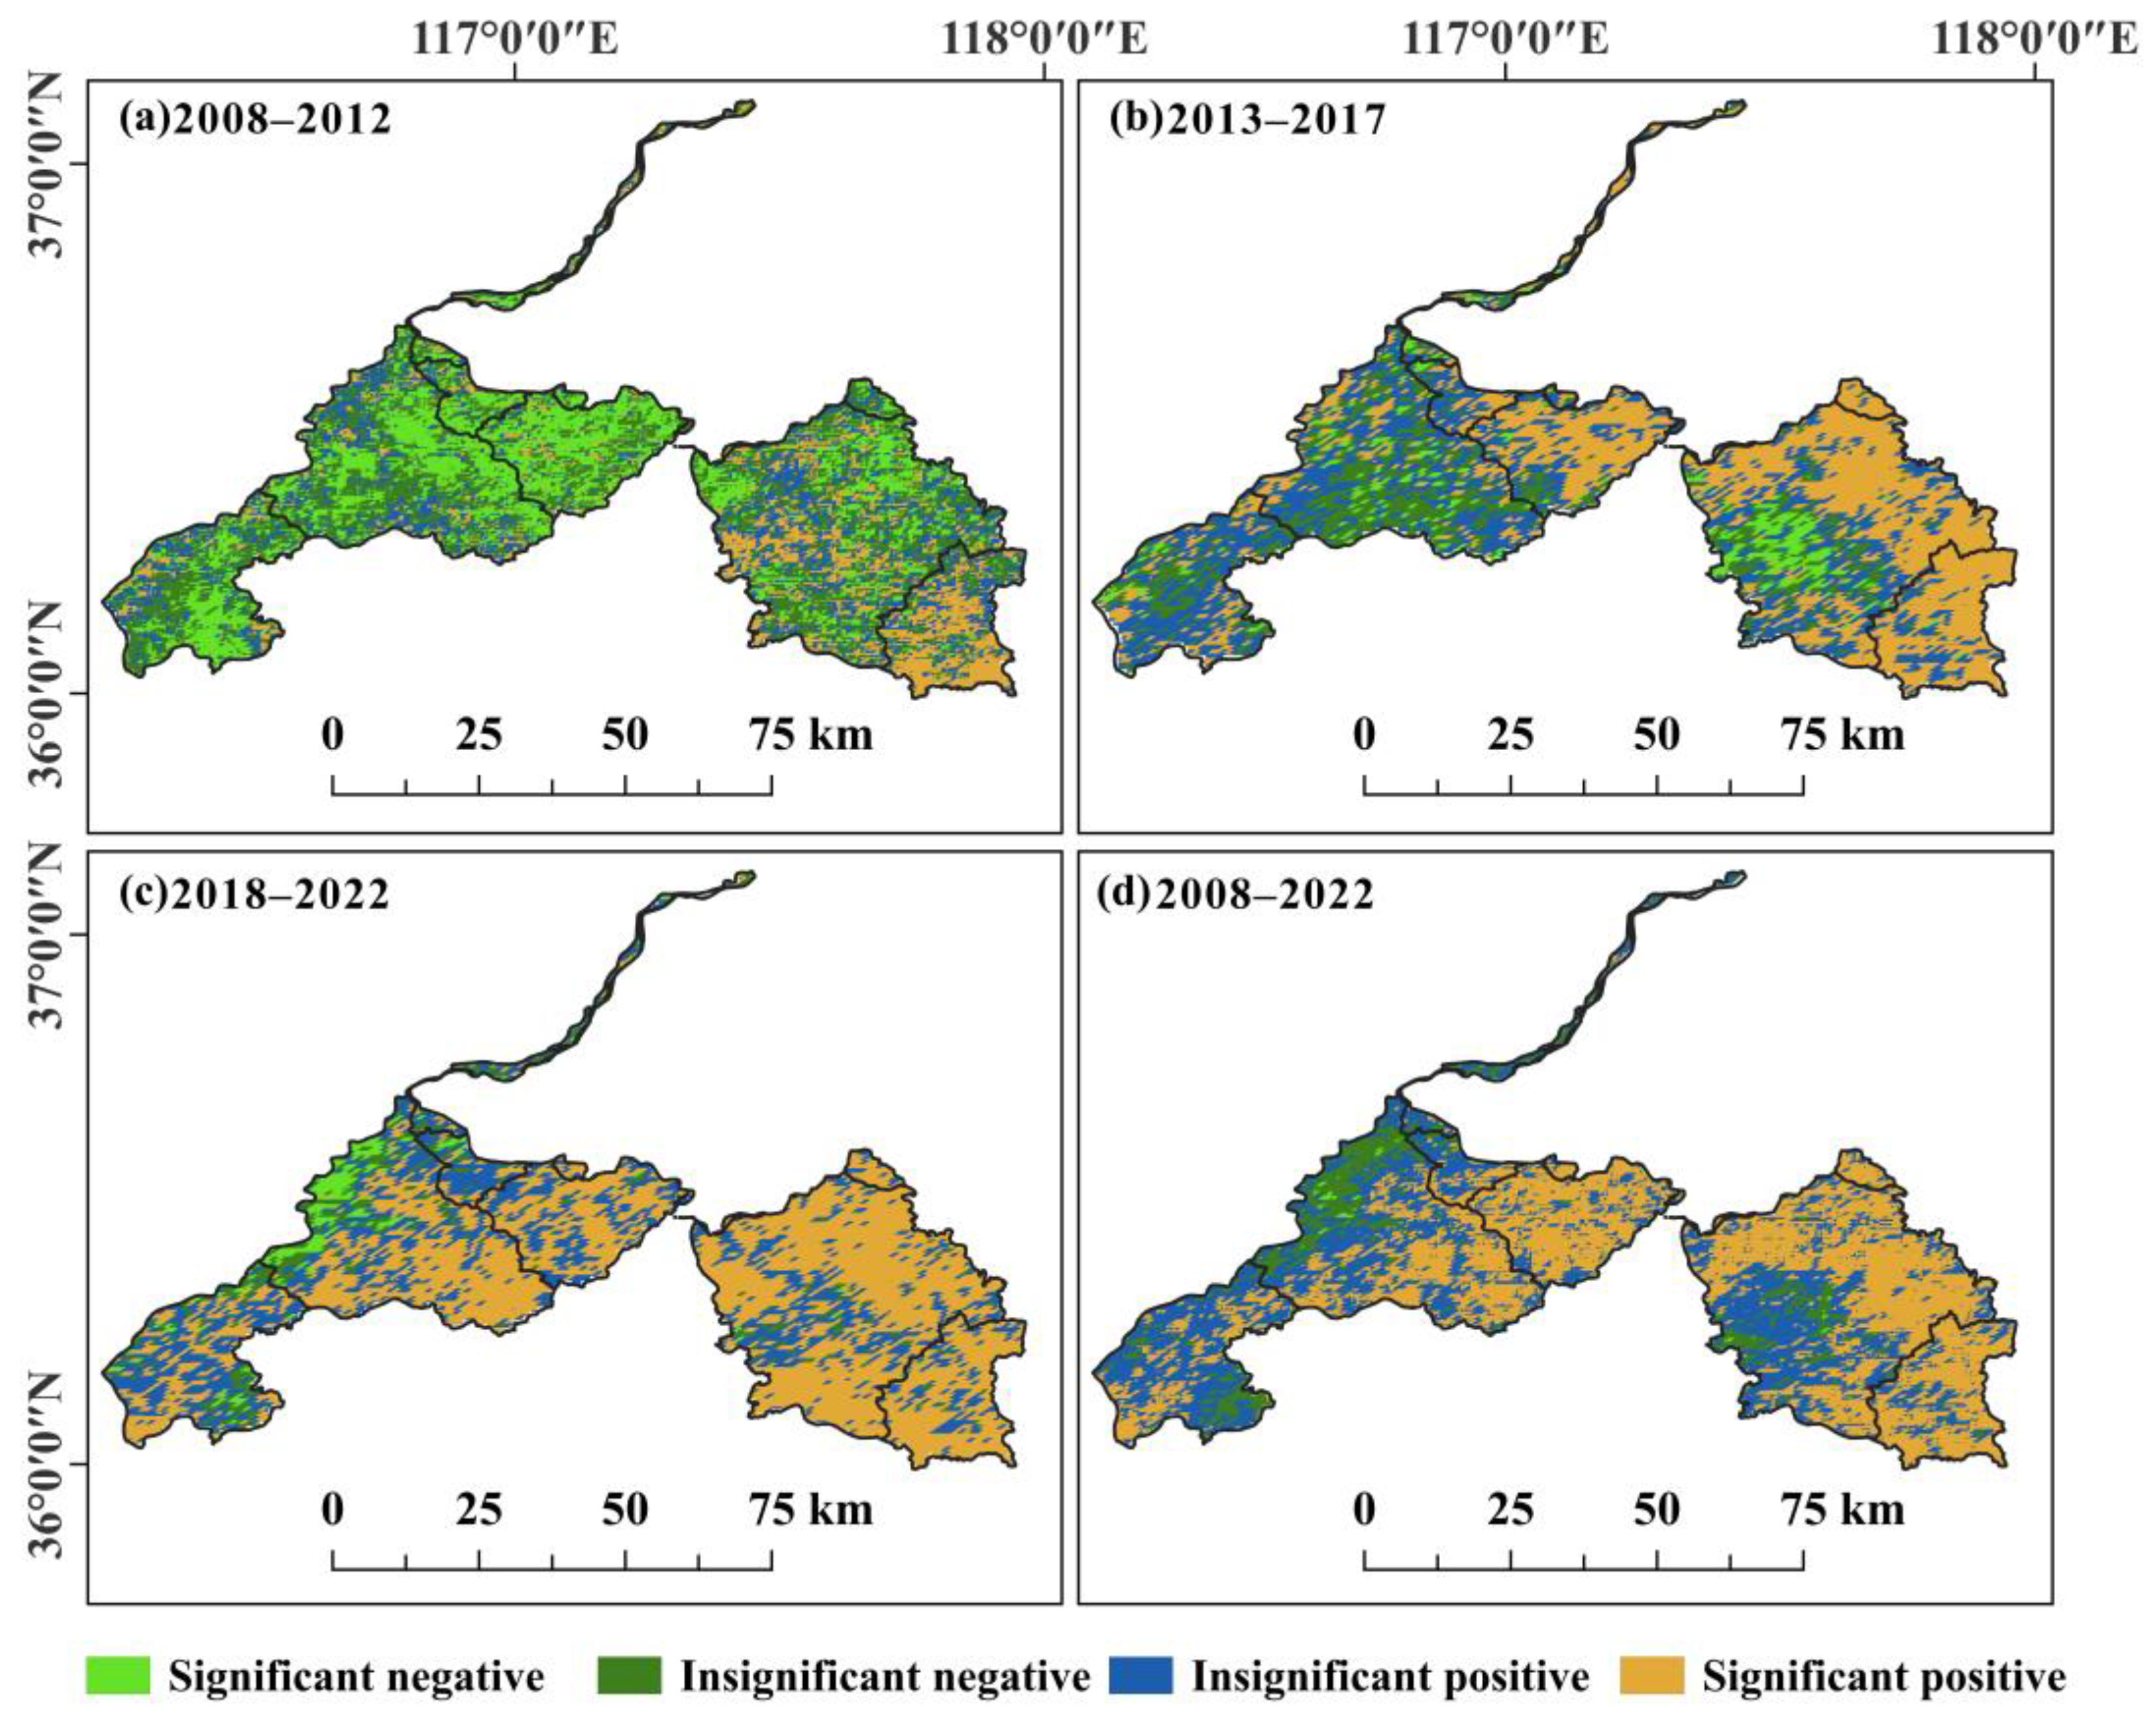
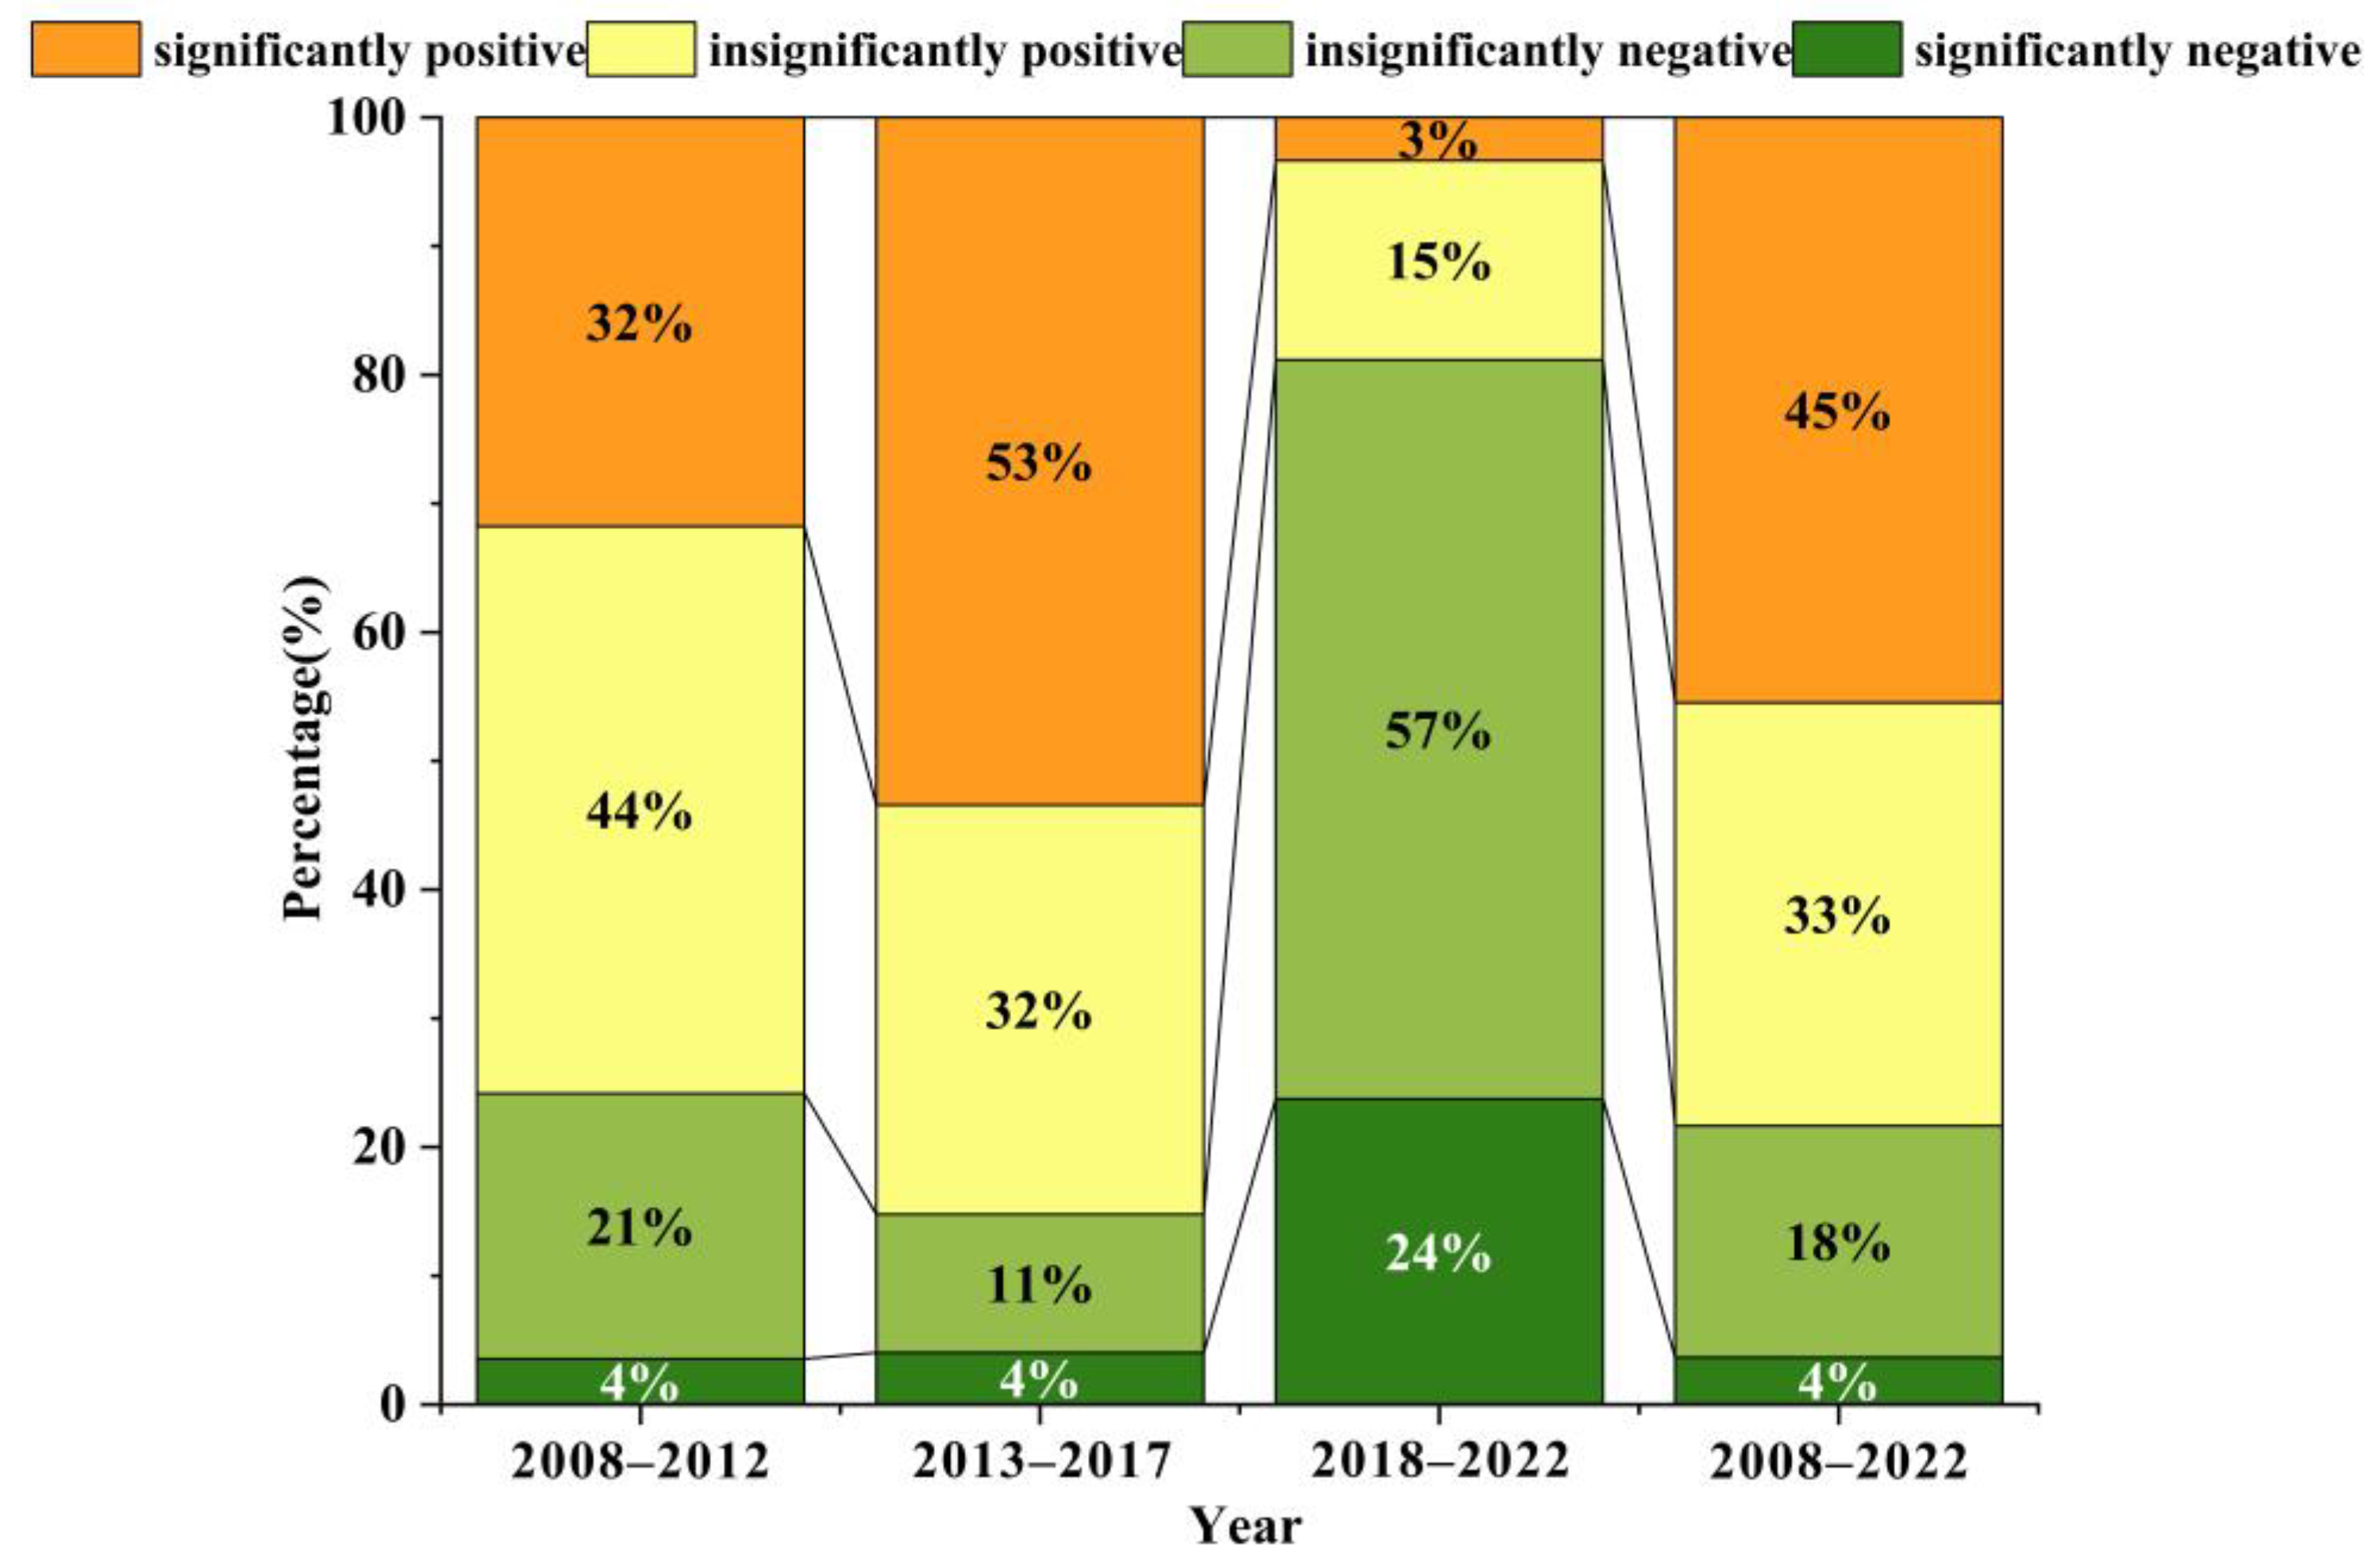
To fully reflect the spatio-temporal evolution of the correlation between NDVI and PRE, the past fifteen years were divided into three time periods (2008–2012, 2013–2017, and 2018–2022). As can be seen from
Figure 10 and
Figure 11, during these three time periods, the proportion of regions where there is a positive correlation between NDVI and PRE in the Jinan section of the basin of the Yellow River represented approximately 37%, 76%, and 89% of the entire region, respectively. These areas were mainly distributed in mountainous regions such as Changqing, Pingyin, Laiwu, Gangcheng. With the progress of urbanization, some originally non-vegetated areas may have been transformed into green spaces or agricultural land, and these changes have also contributed to increased vegetation coverage and have established a positive correlation with PRE. During these three time periods, the percentage of areas with a negative relationship between PRE and NDVI in the Jinan section of the basin of the Yellow River represented approximately 63%, 24%, and 11% of the entire region, respectively. The majority of these areas were found in urban agglomeration areas. Overall, during the period of 2008–2022, 90% of the areas showed positive correlation between NDVI and PRE over the past fifteen years, while 10% had showed negative correlation. With the development of urbanization, vegetation in urban agglomeration areas may have been damaged to some extent. The study indicates that PRE is a key factor influencing vegetation cover change in the Jinan section of the Yellow River Basin, particularly in mountainous areas, where its positive correlation with NDVI has significantly strengthened. This reflects the crucial role of natural factors in vegetation restoration. At the same time, the impact of urbanization on vegetation cover shows dynamic changes. Initially, urbanization may lead to vegetation degradation, but in the later stages, urban greening and ecological restoration efforts can effectively promote vegetation recovery. Future research should further optimize urban ecological management and strengthen the integrated study of the interaction between natural factors and human activities, providing a scientific basis for regional ecological protection and sustainable development.
3.5.2. Relationship Between NDVI and TEM
To fully reflect the spatio-temporal evolution of the correlation between NDVI and TEM, the past fifteen years were divided into three periods (2008–2012, 2013–2017, and 2018–2022). As can be seen from
Figure 12 and
Figure 13, during these three time periods, the regions where NDVI and TEM had a positive association in the Jinan section of the basin of the Yellow River represented approximately 76%, 85%, and 18% of the entire region, respectively. These areas were mainly distributed in the mountainous regions of Changqing, Pingyin, Laiwu, Gangcheng. During these three time periods, the areas with a negative correlation between NDVI and TEM in the Jinan section of the basin of the Yellow River represented approximately 25%, 15% and 81% of the entire region, respectively. These areas were mainly distributed in urban agglomeration areas. From 2018 to 2022, the percentage of regions where NDVI and TEM have a positive association dropped sharply to 18%, while the proportion of areas with a negative correlation rose to 81%. The acceleration of urbanization may have led to a significant increase in TEM in urban agglomeration areas, resulting in the “urban heat island effect”. This effect not only raises the TEM in urban areas but may also have a negative impact on vegetation growth, resulting in a negative relationship between TEM and vegetation covering. Overall, between 2008 and 2022, the proportion of regions in the Jinan section of the Yellow River Basin showing a positive correlation between vegetation cover and temperature was 78%, while the negative correlation regions accounted for 22%. Despite the significant impact of the “urban heat island effect” in urban areas, the relationship between NDVI and temperature showed phased changes. However, the positive correlation remained dominated, suggesting that the natural environmental conditions in the region have a positive effect on vegetation growth. Future management should particularly focus on the dual impact of urbanization on temperature and vegetation, developing targeted ecological regulation measures to mitigate the negative effects of urbanization while preserving and enhancing the stability of the regional ecosystem.
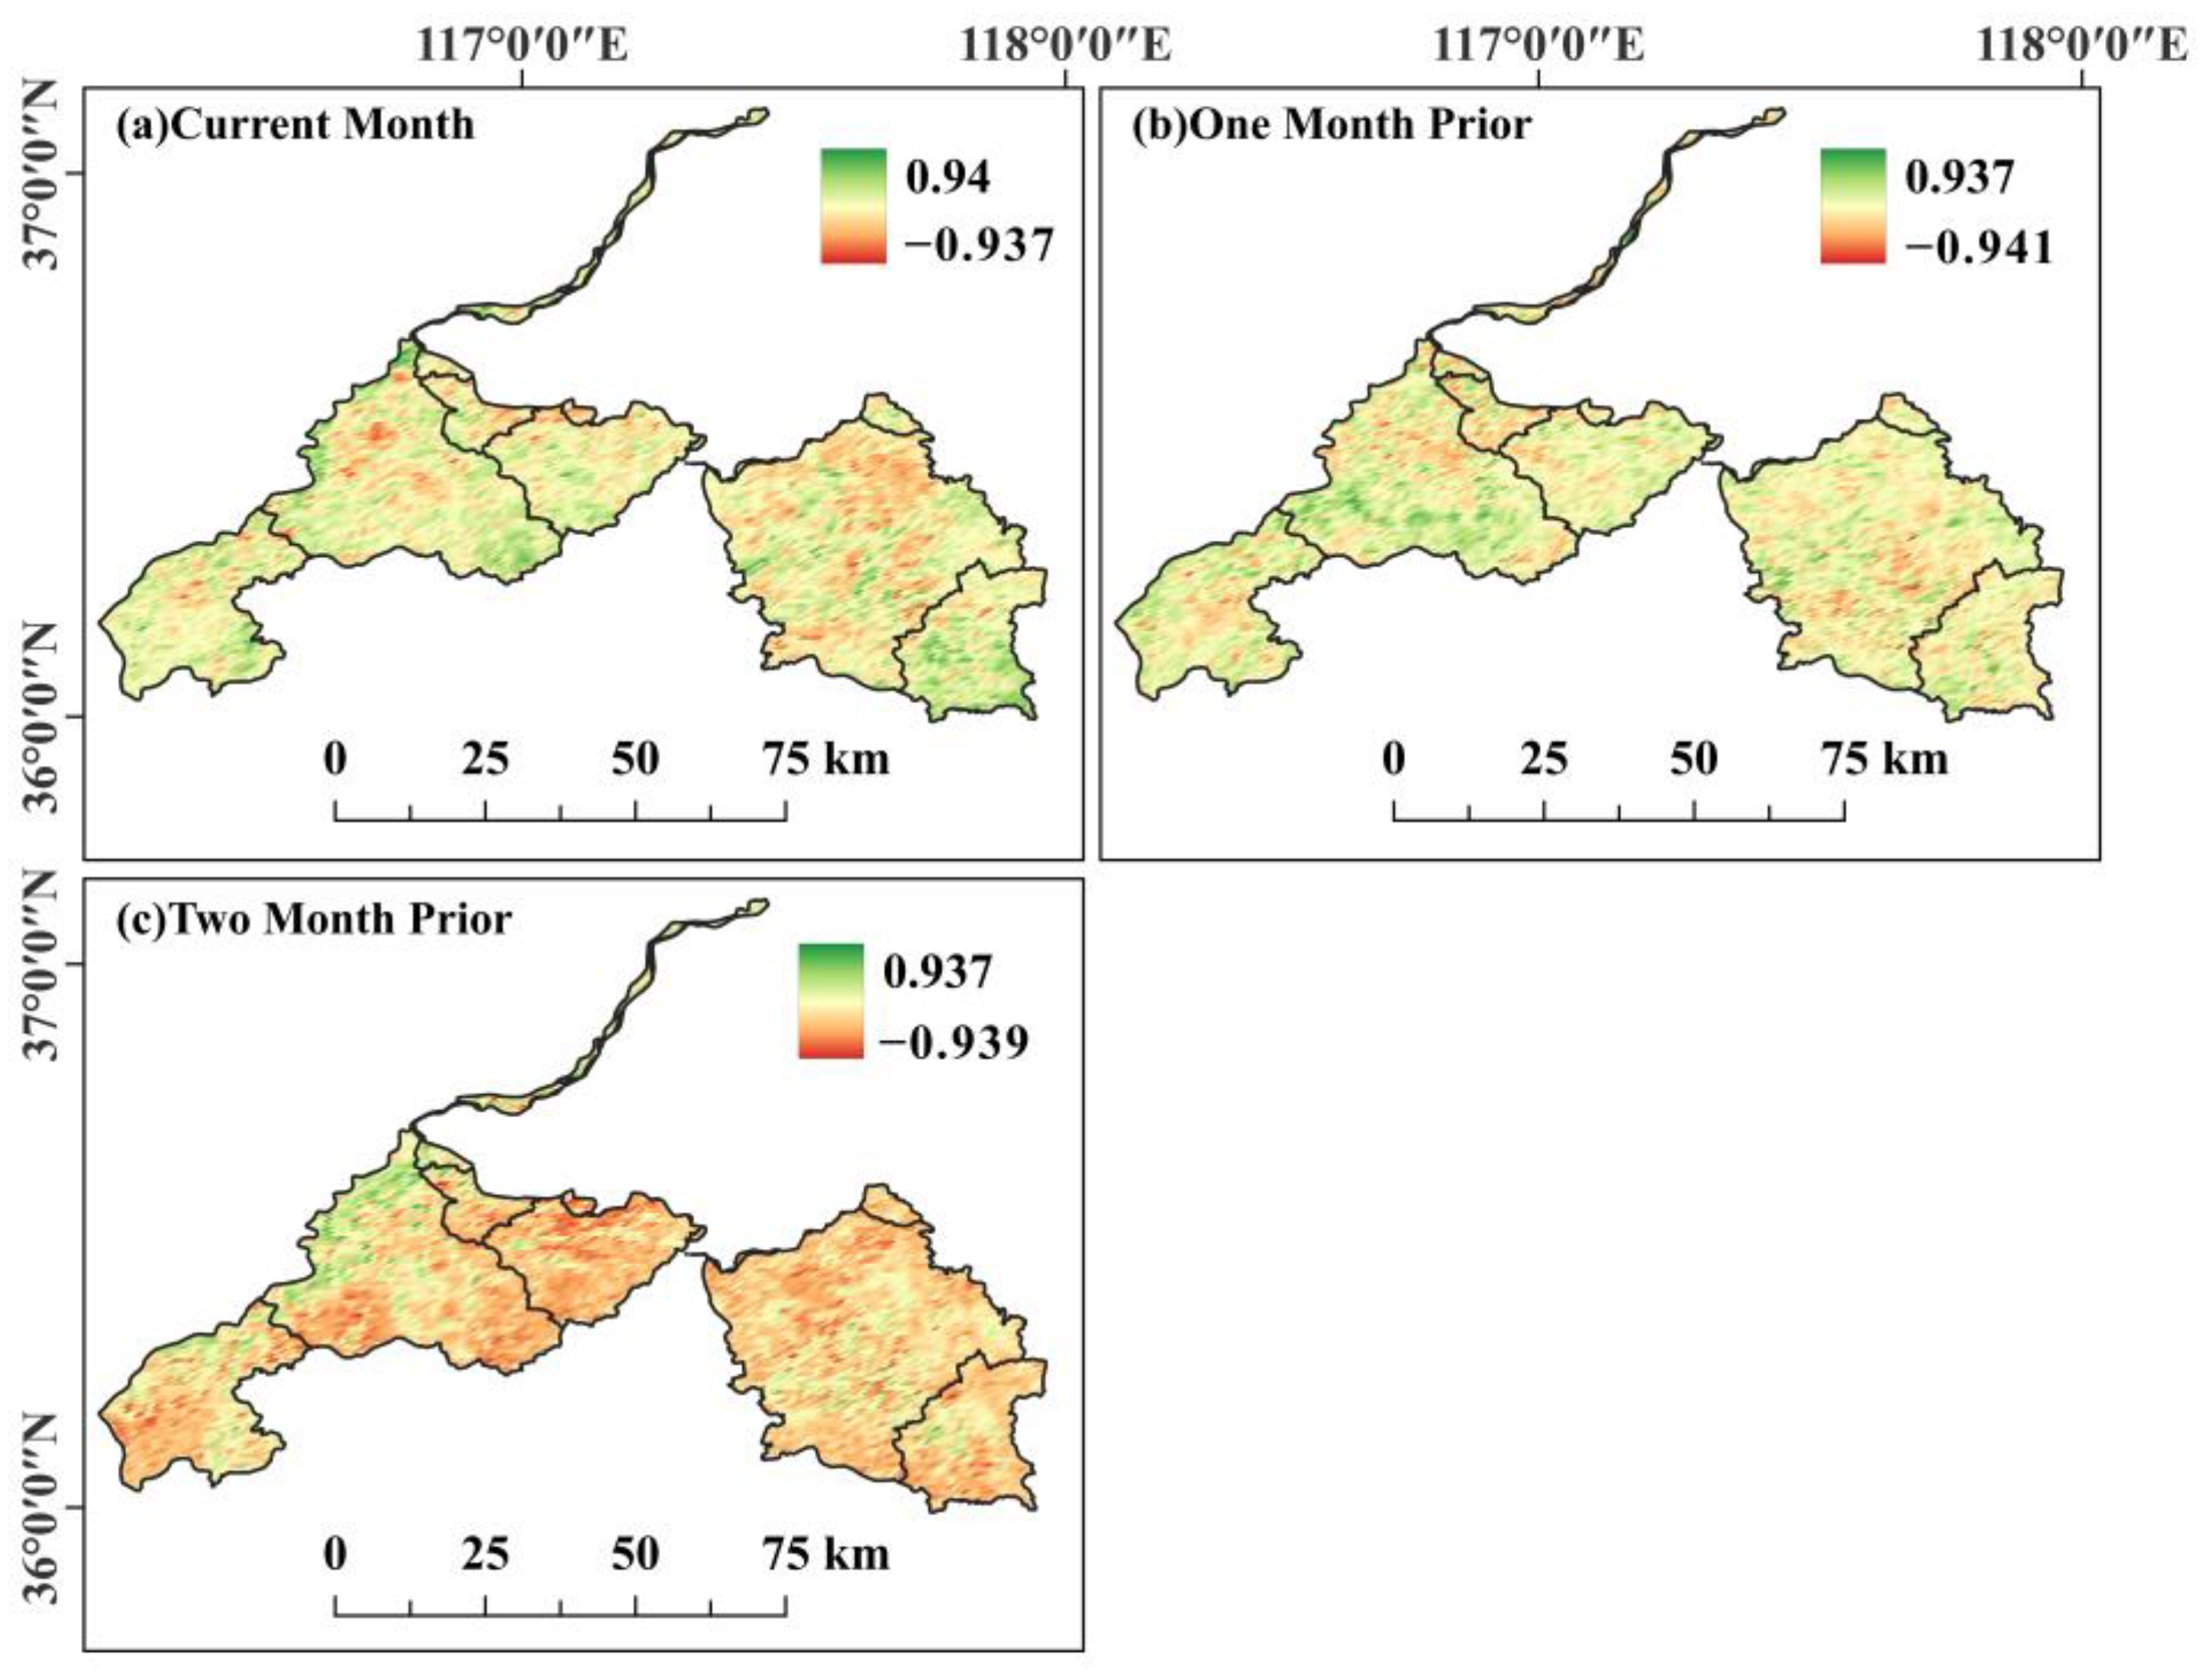
3.5.3. Temporal Delay of NDVI in Summer on TEM
Due to the significant characteristics of TEM in summer, we analyzed the correlation coefficients between NDVI in summer and TEM, TEM one month earlier, and TEM two months earlier in the Jinan section of the basin of the Yellow River from 2008 to 2022 based on NDVI data in summer, and analyzed the time-lagged response of NDVI to TEM.
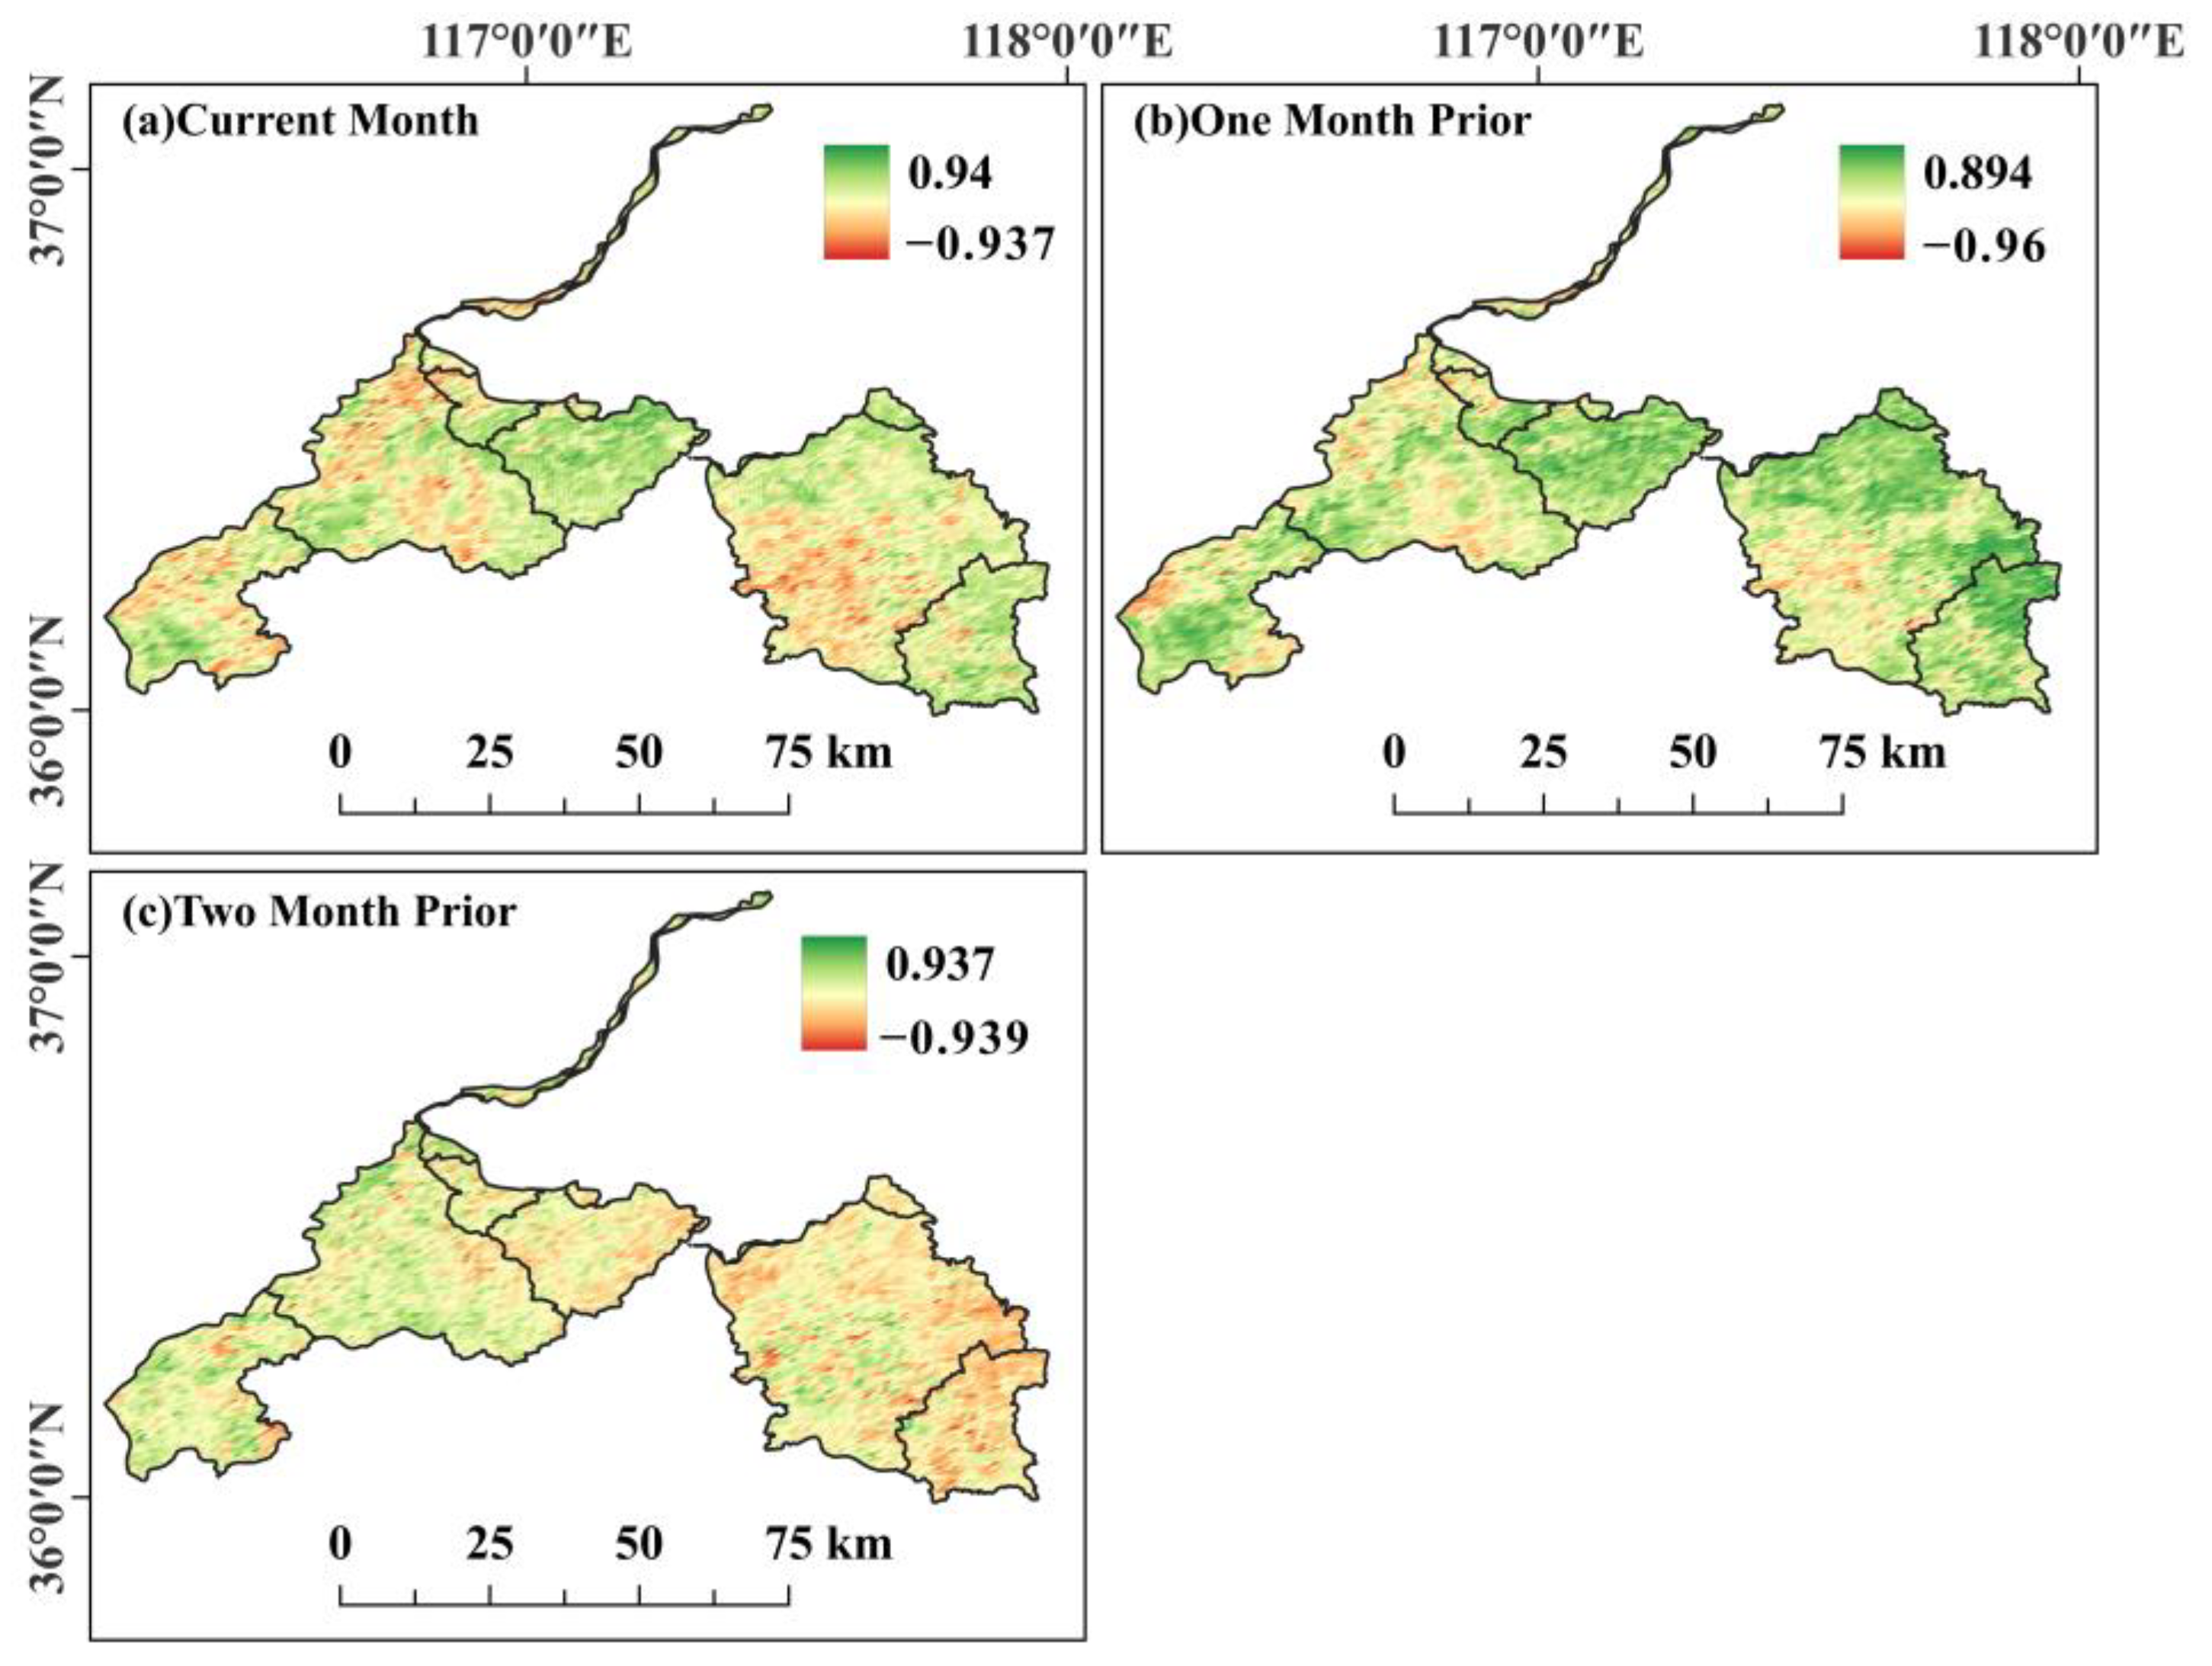
Figure 14 showed the distribution of correlation coefficients between NDVI and TEM at different lag times: June–August, May, and April.
As can be seen from
Figure 14, the lag effect of NDVI in summer on TEM was not strong in the Jinan section of the basin of the Yellow River. The areas with a positive correlation between NDVI in summer and TEM represented 63% of the entire region. The areas where NDVI is positively correlated with TEM in May and April account for 76% and 49% of the entire region, respectively. It can be observed that the proportions of the areas with different lag times between NDVI and TEM showing positive correlation coefficients were roughly similar. Among them, the area with a positive correlation between NDVI in summer and TEM in May was the largest, and the area with a significant positive correlation was also relatively large. Therefore, the lag time of NDVI’s response to TEM in summer was approximately one month.
In addition, spatially speaking, as shown in the analysis of the lag effect between NDVI in summer and TEM (
Figure 14a), the proportion of areas with a positive correlation between vegetation coverage and TEM in mountainous regions of the Jinan section of the basin of the Yellow River was relatively high. According to the analysis of the lag effect between summer NDVI and TEM lagged by one month (
Figure 14b), the proportion of areas with a positive correlation between vegetation coverage and TEM in mountainous regions of the Jinan section of the basin of the Yellow River was relatively high. The analysis of the lag effect between NDVI in summer and TEM lagged by two months (
Figure 14c) revealed that the proportion of areas with a positive correlation between vegetation coverage and TEM in urban areas of the Jinan section of the basin of the Yellow River was relatively high. The study indicates that the response of summer NDVI in the Jinan section of the Yellow River Basin to temperature changes exhibits a certain time-lag effect, with the lag time being approximately one month. Spatially, vegetation in urban areas shows a stronger time-lag response to temperature, while vegetation in mountainous regions is more sensitive to temperature changes with longer time lags. This result suggests that future studies should consider the temperature variation characteristics at different lag times to more accurately assess the dynamic impact of temperature on vegetation growth, providing scientific basis for urban greening and ecological protection in mountainous areas.
3.5.4. Time Delay of NDVI in Summer Regarding PRE
As PRE in summer is relatively abundant, it can better reflect the lag effect of NDVI on PRE. Therefore, based on the NDVI data in summer from 2008 to 2022 in the Jinan section of the basin of the Yellow River, we calculated the correlation coefficients between NDVI in summer (June–August) and PRE in summer, as well as PRE one month and two months earlier, respectively, to analyze the time-lagged response of NDVI to PRE.
Figure 15 shows the distribution of correlation coefficients between NDVI and PRE at different lag times: June–August, May, and April.
As can be seen from
Figure 15, the lag effect of NDVI in summer on PRE was not strong in the Jinan section of the basin of the Yellow River. The areas with a positive correlation between NDVI in summer and PRE represented 54% of the entire region. The areas where NDVI was positively correlated with PRE in May and April represented 55% and 20% of the entire region, respectively. From the analysis of the correlation between NDVI in summer and PRE at different lag times, it can be seen that there was no significant lag effect of summer NDVI on PRE.
Spatially speaking, as shown in the analysis of the lag effect between NDVI in summer and PRE (
Figure 15a), the proportion of areas with a positive correlation between vegetation coverage and PRE in the mountainous regions of the Jinan section of the basin of the Yellow River was relatively high. According to the analysis of the lag effect between NDVI in summer and PRE lagged by one month (
Figure 15b), the proportion of areas with a positive correlation between vegetation coverage and PRE in urban areas of the Jinan section of the basin of the Yellow River was relatively high. The analysis of the lag effect between NDVI in summer and PRE lagged by two months (
Figure 15c) revealed that the correlation between vegetation coverage and PRE in various regions of the Jinan section of the basin of the Yellow River was generally low. The spatial distribution of the correlation between NDVI in summer and PRE lagged by one month and two months was roughly the same. The areas with positive correlation with PRE lagged by two months were smaller. Additionally, there was a small lag effect of PRE on suburbs, mountainous areas, and urban areas. The study indicates that the lag effect of precipitation on summer NDVI in the Jinan section of the Yellow River Basin is relatively short, primarily concentrated in the same month or within one month of lag, while the effect with a two-month lag is not significant. Vegetation in mountainous areas shows a more direct dependence on precipitation, whereas urban green spaces exhibit higher sensitivity to lagged precipitation. This suggests that ecological management and greening measures should pay closer attention to current precipitation and climatic conditions within a one-month lag to more precisely optimize the positive impact of precipitation on vegetation coverage, thereby promoting the sustainable development of the regional ecological environment.
5. Conclusions and Suggestions
In this paper, the slope trend analysis method was used to explore the spatio-temporal evolution of vegetation coverage in the Jinan section of the basin of the Yellow River. The future trend of NDVI was then simulated and predicted based on the FLUS model. Then, combined with the improved optimal parameters of the geographic detector, the impact of driving factors on vegetation coverage was analyzed. Finally, correlation analysis and lag test methods were used to obtain the correlation between TEM, PRE meteorological factors, and vegetation coverage. The following conclusion can be drawn.
(1) Vegetation cover trends and hypothesis validation.
Over the past 15 years, the NDVI in the Jinan section of the Yellow River Basin has shown an overall increasing trend, rising from 0.476 in 2008 to 0.5241 in 2022, validating the hypothesis of continuous improvement in vegetation cover. However, this trend varies across regions, with vegetation cover in suburban and mountainous areas significantly increasing, while urban areas experience some degree of degradation due to expansion and land development. Projections indicate that by 2025, high-coverage areas will increase from 44.26% in 2022 to 55.35%, suggesting that the positive effects of ecological protection policies will continue.
(2) Dynamic changes in driving factors and hypothesis comparison.
The driving factors of NDVI exhibited dynamic changes across different years, confirming the hypothesis that climate factors and human activities jointly drive changes in vegetation cover. In the early years (2008), population and GDP were the primary driving factors. After 2013, temperature (TEM) became the key factor, and from 2018 onwards, the influence of precipitation (PRE) significantly increased, reflecting the gradually stronger dominance of climate factors in influencing vegetation cover.
(3) Correlation and lag effects of meteorological factors.
NDVI showed different correlations with PRE and TEM in different periods. From 2008 to 2017, there was a significant positive correlation with temperature and precipitation, particularly in mountainous areas. However, from 2018 onward, NDVI maintained a positive correlation with precipitation but shifted to a negative correlation with temperature, exhibiting a one-month lag effect, especially in urban areas. This suggests that the long-term impact of climate change on vegetation cover has regional differences.
This study provides a scientific basis for understanding the dynamics and driving mechanisms of vegetation cover in the Jinan section of the Yellow River Basin, offering support for regional ecological conservation and policymaking. Future research should focus on the following: (1) integrating remote sensing big data and higher-precision models to optimize NDVI prediction accuracy; and (2) assessing the long-term impacts of climate change on regional ecosystems to guide adaptive management strategies.
The above conclusion can provide several policy implications for environmental protection and sustainable development in the Jinan section of the basin of the Yellow River. We propose the following suggestions for ecological protection in the Jinan section of the basin of the Yellow River. (1) Climate adaptation strategy: conduct regional climate change risk assessment to understand the impact of climate change such as PRE, TEM changes, and extreme weather on the Jinan section of the basin of the Yellow River. Develop climate adaptation strategies to mitigate the negative impacts of climate change, such as improving water resource management, flood control measures, forest and grass vegetation restoration, and drought management plans. (2) Urban development: develop urban development plans to ensure coordination between urban expansion and farmland, wetlands, and nature reserves, promote sustainable development within the city, and improve the quality of urban life.


