Article

Landscape Characteristics Influencing the Spatiotemporal Dynamics of Soundscapes in Urban Forests

by
Zhu Chen
1,2,
Tian-Yuan Zhu
2,
Xuan Guo
2 and
Jiang Liu
1,3,*
1
School of Architecture and Urban-Rural Planning, Fuzhou University, Fuzhou 350108, China
2
Institute of Environmental Planning, Leibniz University Hannover, Herrenhäuser Str. 2, 30419 Hannover, Germany
3
Fujian Key Laboratory of Digital Technology for Territorial Space Analysis and Simulation, Fuzhou 350108, China
*
Author to whom correspondence should be addressed.
Forests 2024, 15(12), 2171; https://doi.org/10.3390/f15122171
Submission received: 14 November 2024 / Revised: 30 November 2024 / Accepted: 5 December 2024 / Published: 9 December 2024
(This article belongs to the Section Urban Forestry)

Abstract

:
The acoustic environment of urban forests is indispensable for urban residents’ nature-based recreation opportunities and experience of green spaces, and the perceptual and physical sound features in time and space serve as determinants during this process. However, their spatiotemporal variation mechanisms and influential landscape characteristics are still underexplored in urban forests. Thus, this study aims to explore the spatiotemporal variability of perceptual and physical sound features and their relationship with landscape characteristics in urban forests. For this purpose, we measured perceptual sound features using the indicators of the sound harmonious degree (SHD) and soundscape pleasantness and eventfulness. The physical acoustic features were determined using sound-level parameters for measuring the sound level intensity (LAeq, L10, L90) and fluctuation (L10–90). Perceptual and physical sound data collection was based on on-site questionnaire surveys and acoustic instrument measurements, respectively. The landscape characteristics were classified using the principal components of four main categories, including the terrain, area proportion of land cover types, distance to land cover types, and landscape patterns. The results showcase that significant spatiotemporal variation was found in most perceptual and physical sound features, whereas soundscape pleasantness and eventfulness did not vary significantly across time. In general, the variabilities of both perceptual and physical sound features were affected more by the types of spatial functions than by diurnal patterns. Human activities that generate sounds (e.g., hawking, playing, and exercise) may be the key drivers for spatiotemporal changes in physical acoustic features. The components of landscape patterns, including landscape structural diversity and shape complexity persistently, affected specific sound features in all periods. However, no landscape component had persistent cross-spatial influences on the sound features. This study offers critical insights into the spatiotemporal patterns of the acoustic environment and its relationship with landscape characteristics in urban forests. The findings underscore the practical importance and implications of integrating acoustic considerations into urban forest management. By providing a scientific foundation, these results can usefully inform dynamic resource management, functional zoning optimization, and sustainable landscape development in urban forests.

1. Introduction

Urban forests, as an indispensable form of public green space within urban areas, support the dwellers’ engagement with nature and contribute to people’s well-being and quality of life [1]. They perform a series of landscape and ecological functions for urban areas, such as mitigating the heat island effect [2], reducing air and noise pollution [3,4], sequestering carbon [5], and providing multisensory experiences [6]. These benefits also emphasize the importance and contribution of urban forests to the goal of healthy cities proposed by the World Health Organization [7]. The acoustic environmental features of urban forests have been identified as one of the most essential determinants for the various functions of urban forests [8,9]. They play a vital role, especially in people’s perception, experience, and understanding of a landscape, and are strongly associated with the benefits that people gain from the urban forest ecosystem [10,11]. They provide numerous recreational ecosystem services for visitors, such as landscape aesthetic values and nature-based recreation [12]. Such contributions can also promote human physiological and psychological health, for example, by heart rate reduction, mental restoration, and stress recovery [13,14]. Moreover, acoustic environmental features also reflect a series of ecological values; they are a necessary channel for daily communication between vocal creatures, especially the passerine bird species [15].
It is essential to combine the considerations of both physical and perceptual dimensions to achieve a holistic understanding of an acoustic environment [16]. The former refers to the physical sound level that is usually used to measure noise exposure [17]. It usefully captures the physical sound intensity exerted by the sound sources in an environment. The latter refers to the features of the acoustic environment, as perceived or experienced by a person or people in context, as stated in ISO 12913-1 [18], which highlights the perceived attributes of certain sound types and the overall sound environment [19]. Such perceptual sound features can help to understand the interaction between humans and the acoustic environment [20]. Thus, this measure is meaningful for understanding the changing mechanisms of both the physical and perceptual acoustic environments and the factors influencing them, allowing planners to obtain better results in the landscape planning, design, and management of urban forests [21,22]. These physical and perceptual sound features shape the distinct spatiotemporal patterns of the acoustic environment within urban forests [23]. They tend to be influenced by various landscape characteristics of urban forests because these sound features originally emerged from the landscape [24].
However, recent studies focusing on the acoustic environment in urban forested areas have mostly failed to consider the spatiotemporal pattern of both perceptual and physical dimensions simultaneously. Furthermore, they rarely addressed the various impacts of landscape characteristics on these two features across times and spaces. Most of the studies only concerned either the perceptual sound features (e.g., perceived sound frequency, intensity, and soundscape preference) [25,26,27,28] or the physical acoustic features (e.g., sound pressure levels) [29], and did not explore their spatial or temporal variability. There were some investigations considering spatiotemporal variations [9,30]. Still, the authors concentrated on physical acoustic features (indicated by, e.g., acoustic indices), and neglected perceptual sound features. Recently, a few studies have begun to take into account both the perceptual and physical features of the acoustic environment and the spatial and/or temporal variability of urban forested areas [21,31]. Bian et al. explored the relationship between the physical and perceptual features of the acoustic environments in urban forests, but they solely examined the temporal changes found in these two features [31]. Hong et al. studied the spatial and temporal variations of perceptual sound elements and sound pressure levels in an urban forest [21]. However, their analyses and results regarding spatial and temporal variabilities were only based on subjective observations instead of statistical calculations when establishing the significance of the changes. This flaw also exists in other, similar studies [32,33,34,35], which makes such results hard to adopt as a scientific reference for the practice because such variabilities may be caused by random fluctuations in the analyzed data [36]. More importantly, how urban forest landscape characteristics affect the perceived and physical sound characteristics at specific times or in specific spaces remains underexplored. Mostly, the existing studies have not comprehensively considered spatial and temporal factors in exploring the relationship between acoustic environmental features and landscape characteristics [32,33,35,37]. It is difficult to summarize those landscape characteristics that have a significant impact on the acoustic environment at a specific time or space in urban forests, solely based on such results. This would give an insufficient scientific basis to support the prioritization of influential landscape characteristics in landscape planning and design at specific times or spaces, for proposing concrete measures for the dynamic management and sustainable development of sound resources, or for implementing spatiotemporal acoustic environment impact assessments.
To fill these research gaps, this study aims to explore the spatiotemporal dynamics of perceptual and physical soundscapes and their relationships with spatial landscape characteristics in urban forests. For this purpose, the present study examines whether there are significant variabilities in both the perceptual and physical features of the acoustic environment in urban forests and also identifies how landscape characteristics influence spatiotemporal perceptual and physical sound features, based on a case study of Fuzhou National Forest Park, China. The perceptual and physical sound features were measured separately at different periods and functional zones within urban forests. The measured data were first processed and then used to examine the significance of spatial and temporal variabilities in the perceptual and physical sound features, using statistical methods. A series of multiple stepwise regression models were employed to identify the impact of landscape characteristics on perceptual and physical sound features in different times and spaces. This study will advance the understanding of the spatiotemporal mechanisms of the acoustic environment in urban forests and their relationship with landscape characteristics, which can usefully inform both landscape planning and design as well as dynamic resource management in urban forested areas.

2. Materials and Methods

2.1. Study Area

The study area (covering 218 ha) is located within the Fuzhou National Forest Park, a famous tourist destination in Fuzhou, China. The park experiences a subtropical maritime climate with mild temperatures and abundant rainfall, and its ecosystem is dominated by subtropical evergreen broadleaf forests with over 1700 tree species. The park also shares rich ecological and cultural resources that serve as tourism assets, aligning with the themes of forest tourism and promoting natural education and ecological awareness to the public. These inherent conditions bestow its status as a representative example of an urban forest, allowing the current study to provide useful results and instructive information that can contribute to urban forest research.
Before the formal field survey, a pilot field investigation in the study area was conducted to predetermine the functional zoning, sampling sites, and sound source categories. The functional zoning process was based on the resources, features, and main functions of the areas that are described in Table 1. A total of 21 sampling sites were selected in the four functional zones of the study area (Figure 1). The selection of sampling sites was based on three main aspects: (1) being spatially accessible to ensure ease of visitor movement within the selected areas; (2) areas with relatively high visitor flow and density or long stay durations; and (3) representative high-interest areas in each functional zone (e.g., landscape nodes and scenic spots). This selection process ensured that each sampling site had enough potential participants to take part in the survey and that the sites adequately reflected the spatiotemporal variations of the soundscape features experienced by visitors in the urban forests. The number of sampling sites was set with reference to previous studies [34,38], ensuring that the sampling size was sufficient to capture the spatiotemporal variability of sound features in the area. Afterward, 21 common sound sources were identified around all the selected sampling sites and were then categorized into natural sounds, human activity, and mechanical sounds (Table 2), based on the taxonomy of sound sources in ISO 12913-2 [19].

2.2. Data Collection and Processing

2.2.1. Field Survey

The formal field surveys were conducted during the weekends in October and November 2020, specifically on 24, 25, and 31 October, and 1, 7, 8, 14, 15, 21, and 22 November, for a total of 10 days. October and November were chosen because the weather in Fuzhou during these months is relatively stable, with mild temperatures compared to the summer or winter months, which is favorable for people engaging in outdoor activities and is, thus, also conducive to on-site data collection and measurement. Each survey was conducted over three time periods: morning, 8:00–11:00 (P1); afternoon, 12:00–15:00 (P2); and evening, 16:00–19:00 (P3). These periods have been used in previous studies to present the temporal variations in sound features effectively [21,31,33]. The specific time points of each period were slightly adjusted to better align with the actual conditions (e.g., the flow of visitors) in the study area. The surveys were systematically organized by the second author and two master’s degree students and were collaboratively conducted with the assistance of six additional master’s degree students. All of them majored in landscape architecture and had expertise in the soundscape field. The observers were divided into four groups for data collection purposes, with one three-person group located in the recreation zone and three two-person groups in the other three zones, divided according to the number of sampling sites and the flow of visitors. Each group moved to each sampling site within the responsible functional zone across the three sampling periods within the same day, to collect perceptual and physical sound data simultaneously.

2.2.2. Perceptual Sound Features

This study considers the perceptual acoustic environment in sound source perceptions and overall soundscape perceptions. The sound source perceptions were measured using a seven-point scale, scoring the perceived occurrences (POS) (1—never to 7—very frequently), the perceived loudness (PLS) (1—extremely quiet to 7—extremely loud), and preferences (PRE) (1—extremely dislike to 7—extremely like) [28,39]. The overall soundscape perceptions were evaluated using the semantic differential method, also using a seven-point scale (1—extremely disagree to 7—extremely agree) for six perceptual attributes: pleasant, harmonious, comfortable, eventful, diverse, and vivid [32,39].
The perceptual sound data were collected by conducting questionnaire surveys on-site. The surveys were voluntary and anonymous and were taken with the consent of all participants. The visitors appearing around the sampling points would be asked if they would like to participate in this survey. The maximum distance around these points was approximately 150 m because the areas farther away were limited in accessibility and were not used for human activities (e.g., without trail facilities or with extreme terrain or high-density vegetation), especially the sampling sites in the forest landscape zone. This ensured that the data collected reflected the perceptual sound features that were accessible in the sampling areas. The participants were asked to fill out the questionnaires depending on their current feelings. Each participant could stop the survey and leave at any time without giving any reason. Finally, 814 valid questionnaires were returned after eliminating any invalid ones (e.g., incomplete answers or questionnaires with all the same answers). The results of the reliability and validity tests were good for perceived sound sources and overall soundscape perception. Specifically, the Cronbach’s alpha coefficients were 0.827 (>0.7) and 0.953 (>0.8), respectively, which was considered acceptable for reliability [40]. The values from the Kaiser–Meyer–Olkin (KMO) calculations were 0.761 (>0.6) and 0.744 (>0.6), respectively, showing an acceptable level in terms of the adequacy of the sample size in factor analysis [41]. The p-values of Bartlett’s sphericity test were 0.000 (<0.01), suggesting that the collected data were appropriate for factor analysis [42].
The sound harmonious degree (SHD) indicator in Equation (1) was employed to comprehensively analyze the perceptual features of sound sources in this study. SHD is a two-dimensional indicator that was further developed based on a previous indicator [28]. Its rationality and effectiveness for reflecting and evaluating perceptual sound features have been indicated when used in urban green spaces in previous studies [39,43]. SHD integrates the sound dominant degree (SDD) and the orientation of PRE. SDD refers to the dominance of a specific sound source in the acoustic environment, which depends on POS and PLS, as shown in Equation (2). The orientation of PRE describes the degree to which the dominance of a sound source matches people’s preferences, calculated by Equation (3):
S H D j i = 1 e x p P R E j i + 1 0.5 × S D D j i
S D D j i = P O S j i × P L S j i
P R E j i = 1 n j = 1 n P R E j i P R E j i
where j is the jth sample, i is the ith source, and n is the total sample size. The values for SDD and SHD in each main category sound were the mean values for SDD and SHD in all sub-category sounds, respectively [32,43]. Eventually, the SHDs of natural sounds (SHD_NS), human-activity sounds (SHD_HS), and mechanical sounds (SHD_MS) were included in the analyses.

2.2.3. Physical Acoustic Features

The features of the physical acoustic environment were examined using four acoustic parameters: LAeq, L10, L90, and L10–90. These physical parameters have been used in past studies for measuring and presenting the different aspects of sound pressure levels [33,43]. LAeq is the A-weighted sound pressure level (SPL), which represents the sound intensity of the acoustic environment. L10 indicates the foreground sound of the acoustic environment, indicating that the sound level exceeds this value for 10% of the sampling time. L90 represents the sound level that exceeds this value 90% of the sampling time, which can be understood as the background sound. L10–90 is the fluctuating differences in sound levels between L10 and L90, which can quantify the dynamic variability of the acoustic environment of urban forests. L10–90 was calculated based on the values of L10 and L90.
The physical acoustic features (LAeq, L10, and L90) were measured directly, based on a series of 3-min recordings. This recording duration aligns with the optimal timeframe for people’s psychological engagement and stability in response to environmental conditions, as referenced in prior studies [44,45], making this duration suitable for reflecting the physical features of the acoustic environment that people will experience and focus on. These recordings were obtained simultaneously with the perceptual sound data noted by the group members. The measurement device was placed at a height of around 1.5 m above the ground, which is consistent with the average height of the human ear [46]. The field measurements utilized BSWA308 sound level meters, which are octave sound level meters that use a single-chip ARM. The device updates all fixed-point calculations to a float-point, thereby usefully improving the accuracy and stability of measurement. It has a single range covering the 123 dB/122 dB dynamic range for general environmental noise measurements, a linearity range between 20 dBA and 134 dBA for Class 1 measurements, and between 25 dBA and 136 dBA for Class 2 measurements.

2.2.4. Landscape Characteristics

The indicators of landscape characteristics include four aspects: terrain, area proportion of land cover types, distance to land cover types, and spatial landscape patterns, as referred to in previous studies concerning the relationship between landscape characteristics and acoustic environmental features [47,48]. The study terrain was characterized by elevation, slope, and aspect, which were calculated based on the digital elevation model. The area proportion of and distance to land cover types were calculated directly based on the raster data of vegetation cover type and the vector data of road networks in Fuzhou city. The spatial landscape patterns were indicated by eight landscape metrics, the concrete description and formula of which are listed in Table S1 in the Supplementary Materials. These metrics were also measured based on the raster data of vegetation cover types. All data were processed and analyzed in ArcGIS 10.7 and Fragstats 4.2. More details about the data source and processing steps of each landscape indicator are shown in Table S2 in the Supplementary Materials.

2.3. Statistical Analysis

Principal component analysis (PCA) was utilized to tackle the problem of multicollinearity among the variables and to summarize the information gathered on the variables of overall soundscape perception and each category of landscape characteristics, using the varimax rotation method. The value of each principal component was calculated through the regression method (Table 3).
A multivariate analysis of variance (MANOVA) was used to explore the main and interactive effects of time and space on perceptual and physical sound features. The three sampling periods and four functional zones were set as the categorical independent variables, including SHD_NS, SHD_HS and SHD_MS, PLE, and EVE, as well as LAeq, L10, L90, and L10–90, which were the continuous dependent variables. Multivariate tests for the main and interaction effects of time and space were all significant (Tables S6 and S7, Supplementary Materials). Partial eta squared values of 0.01 to 0.06, 0.06 to 0.14, and greater than 0.14 indicate small, medium, and large effects, respectively [49], highlighting the ability of the factor to explain the variance of the dependent variables. The Games–Howell post hoc test using a Bonferroni correction was employed to conduct pairwise comparisons of each dependent variable between the different sampling periods and functional zones, respectively. Bonferroni correction is a commonly used correction method for multiple comparisons, which can effectively decrease the probability of false positive results (type I errors) in multiple pairwise comparisons [50].
Stepwise multiple linear regression analysis was employed to develop a series of models across times and spaces to examine the impacts of landscape characteristics on the spatiotemporal variability of the sound features. The perceptual and physical sound features were dependent variables, while the landscape characteristics were independent variables. The tolerance (TOL) and variance inflation factor (VIF) methods were applied to conduct collinearity diagnostics and reduce the collinearity issue of the independent variables [51]. TOL > 0.1 and VIF < 10 indicate that there is no collinearity issue [32,52]. The calculations are shown in Equations (4) and (5):
T O L = 1 R j 2
V I F = 1 1 R j 2
where R j 2 represents the coefficient of determination for the regression models on all independent variables, except for the examined jth variable. The collinearity independent variables (TOL < 0.1 or VIF > 10) in stepwise regression were removed to ensure the validity of the results. All the data were normalized using the Z-score method before analysis. The statistical analyses were performed with the IBM SPSS Statistics software package version 24.0 (IBM Corp., Armonk, NY, USA).

3. Results

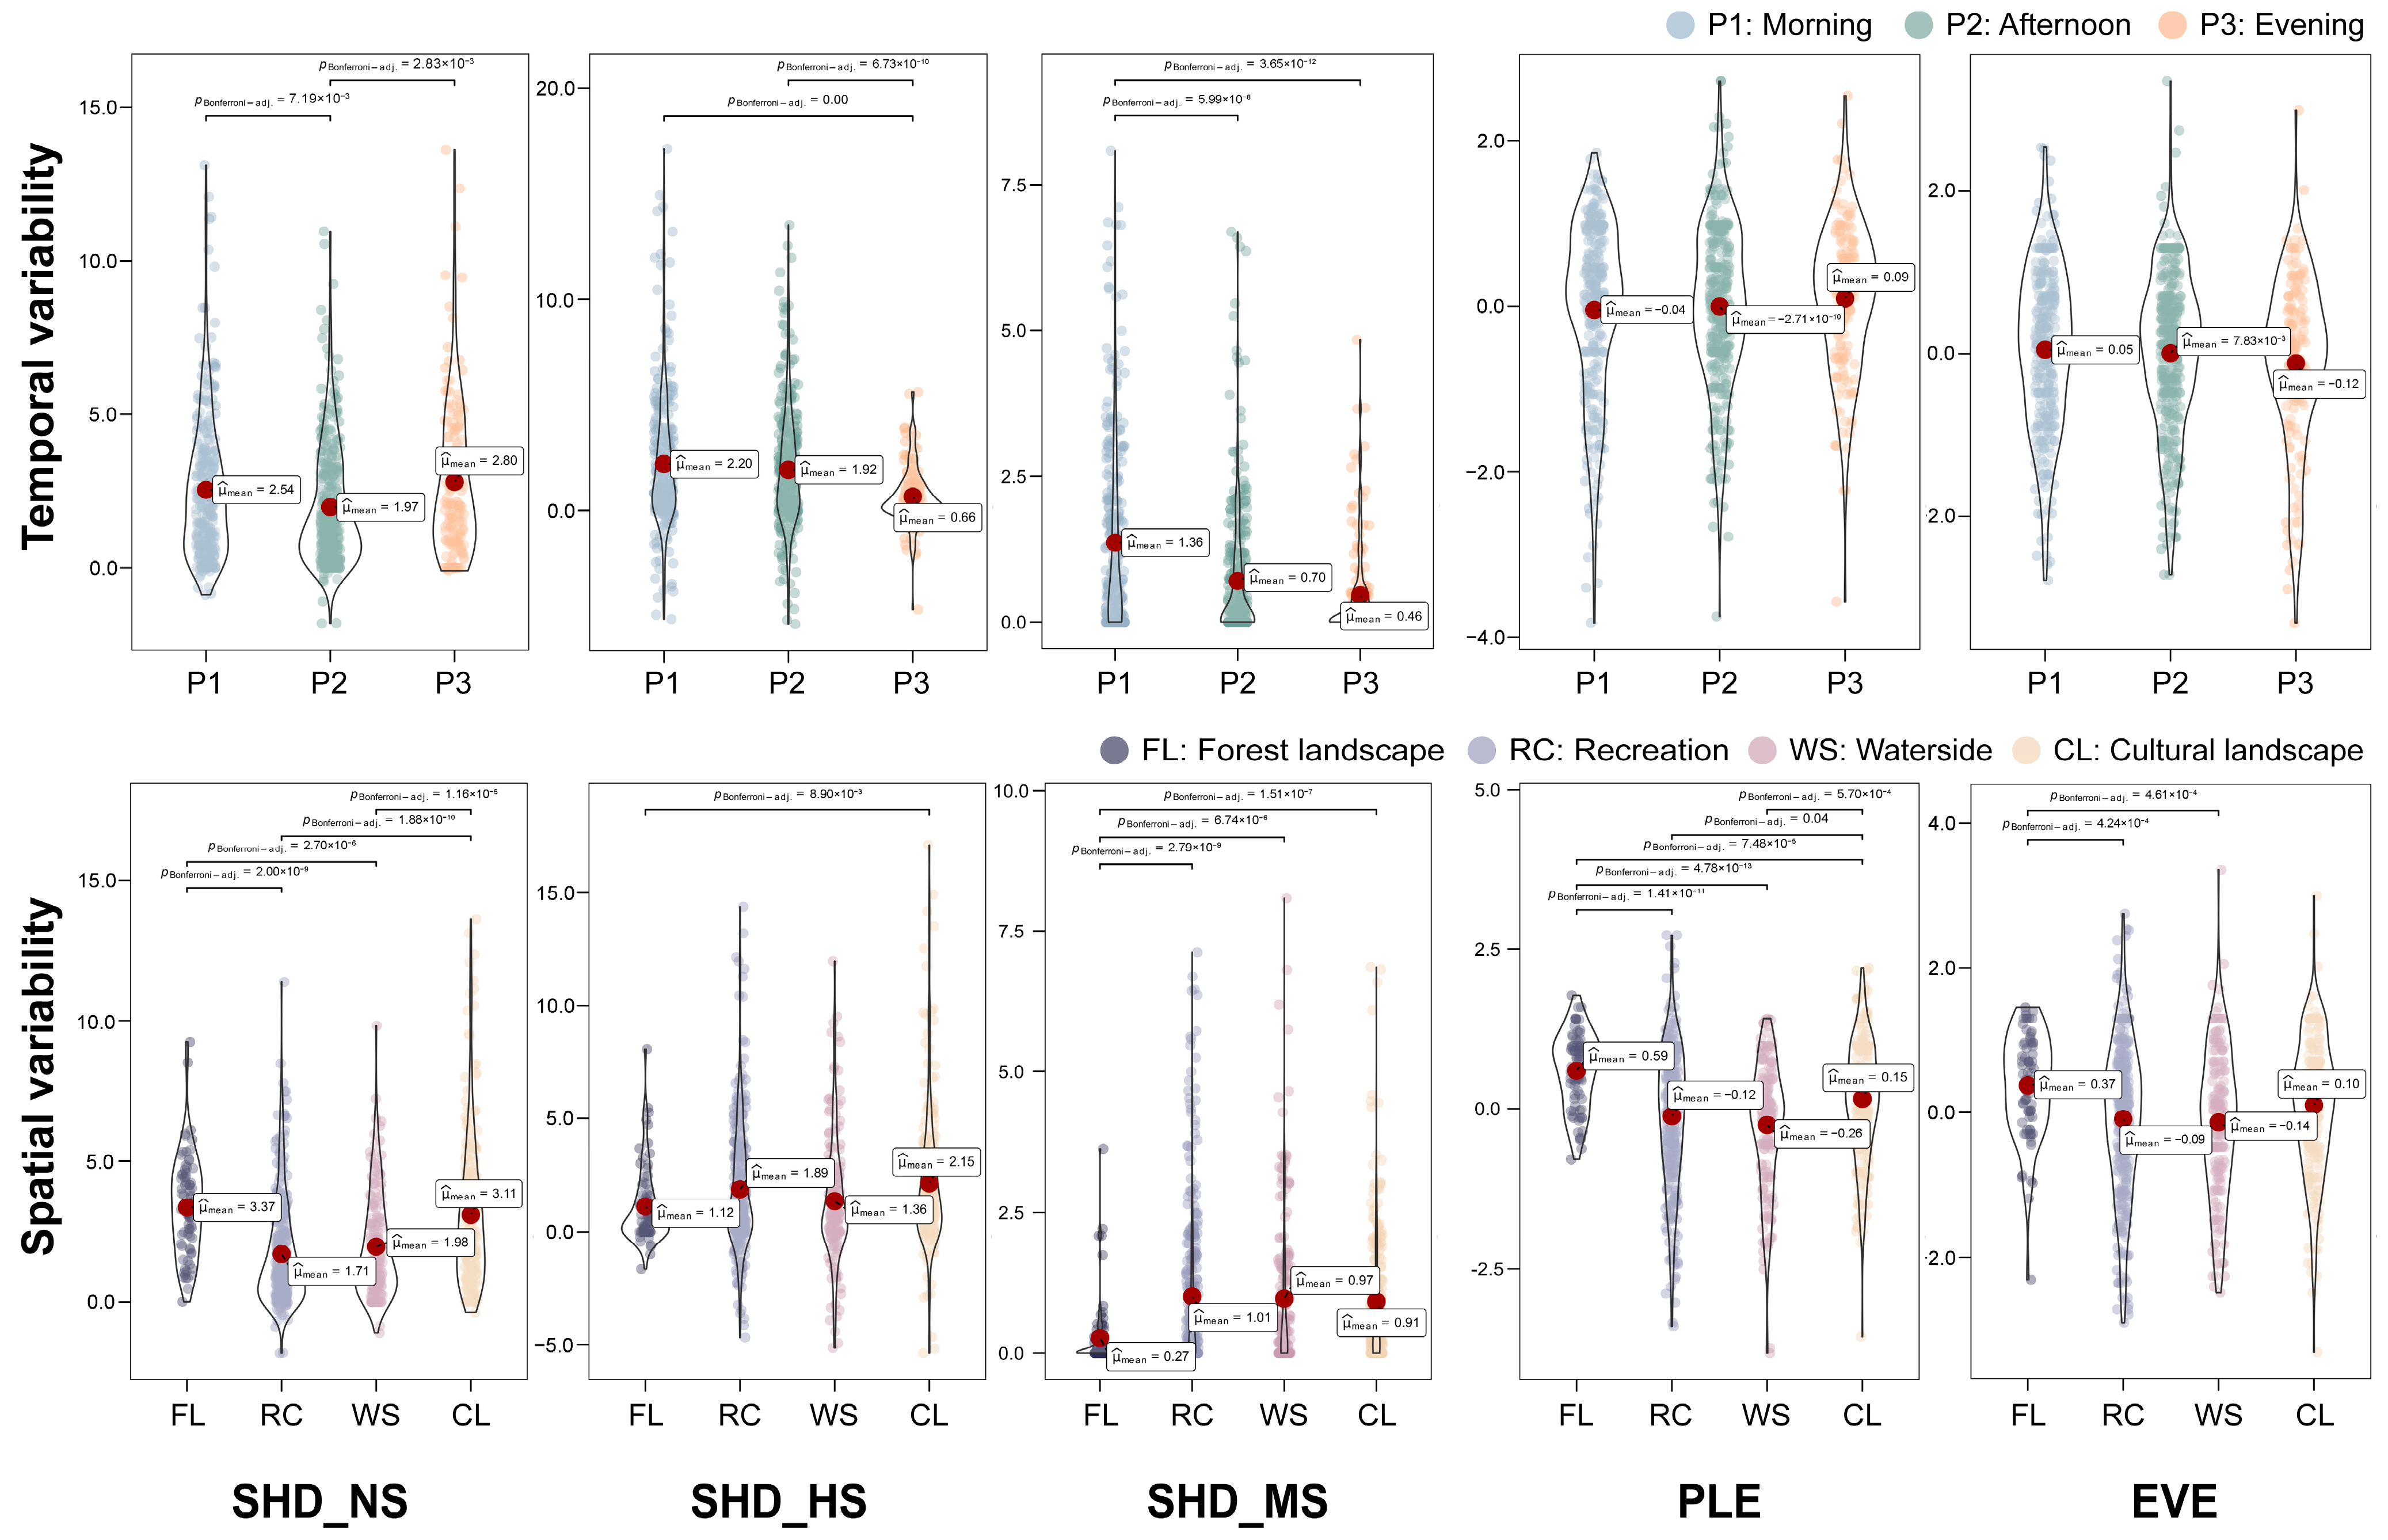
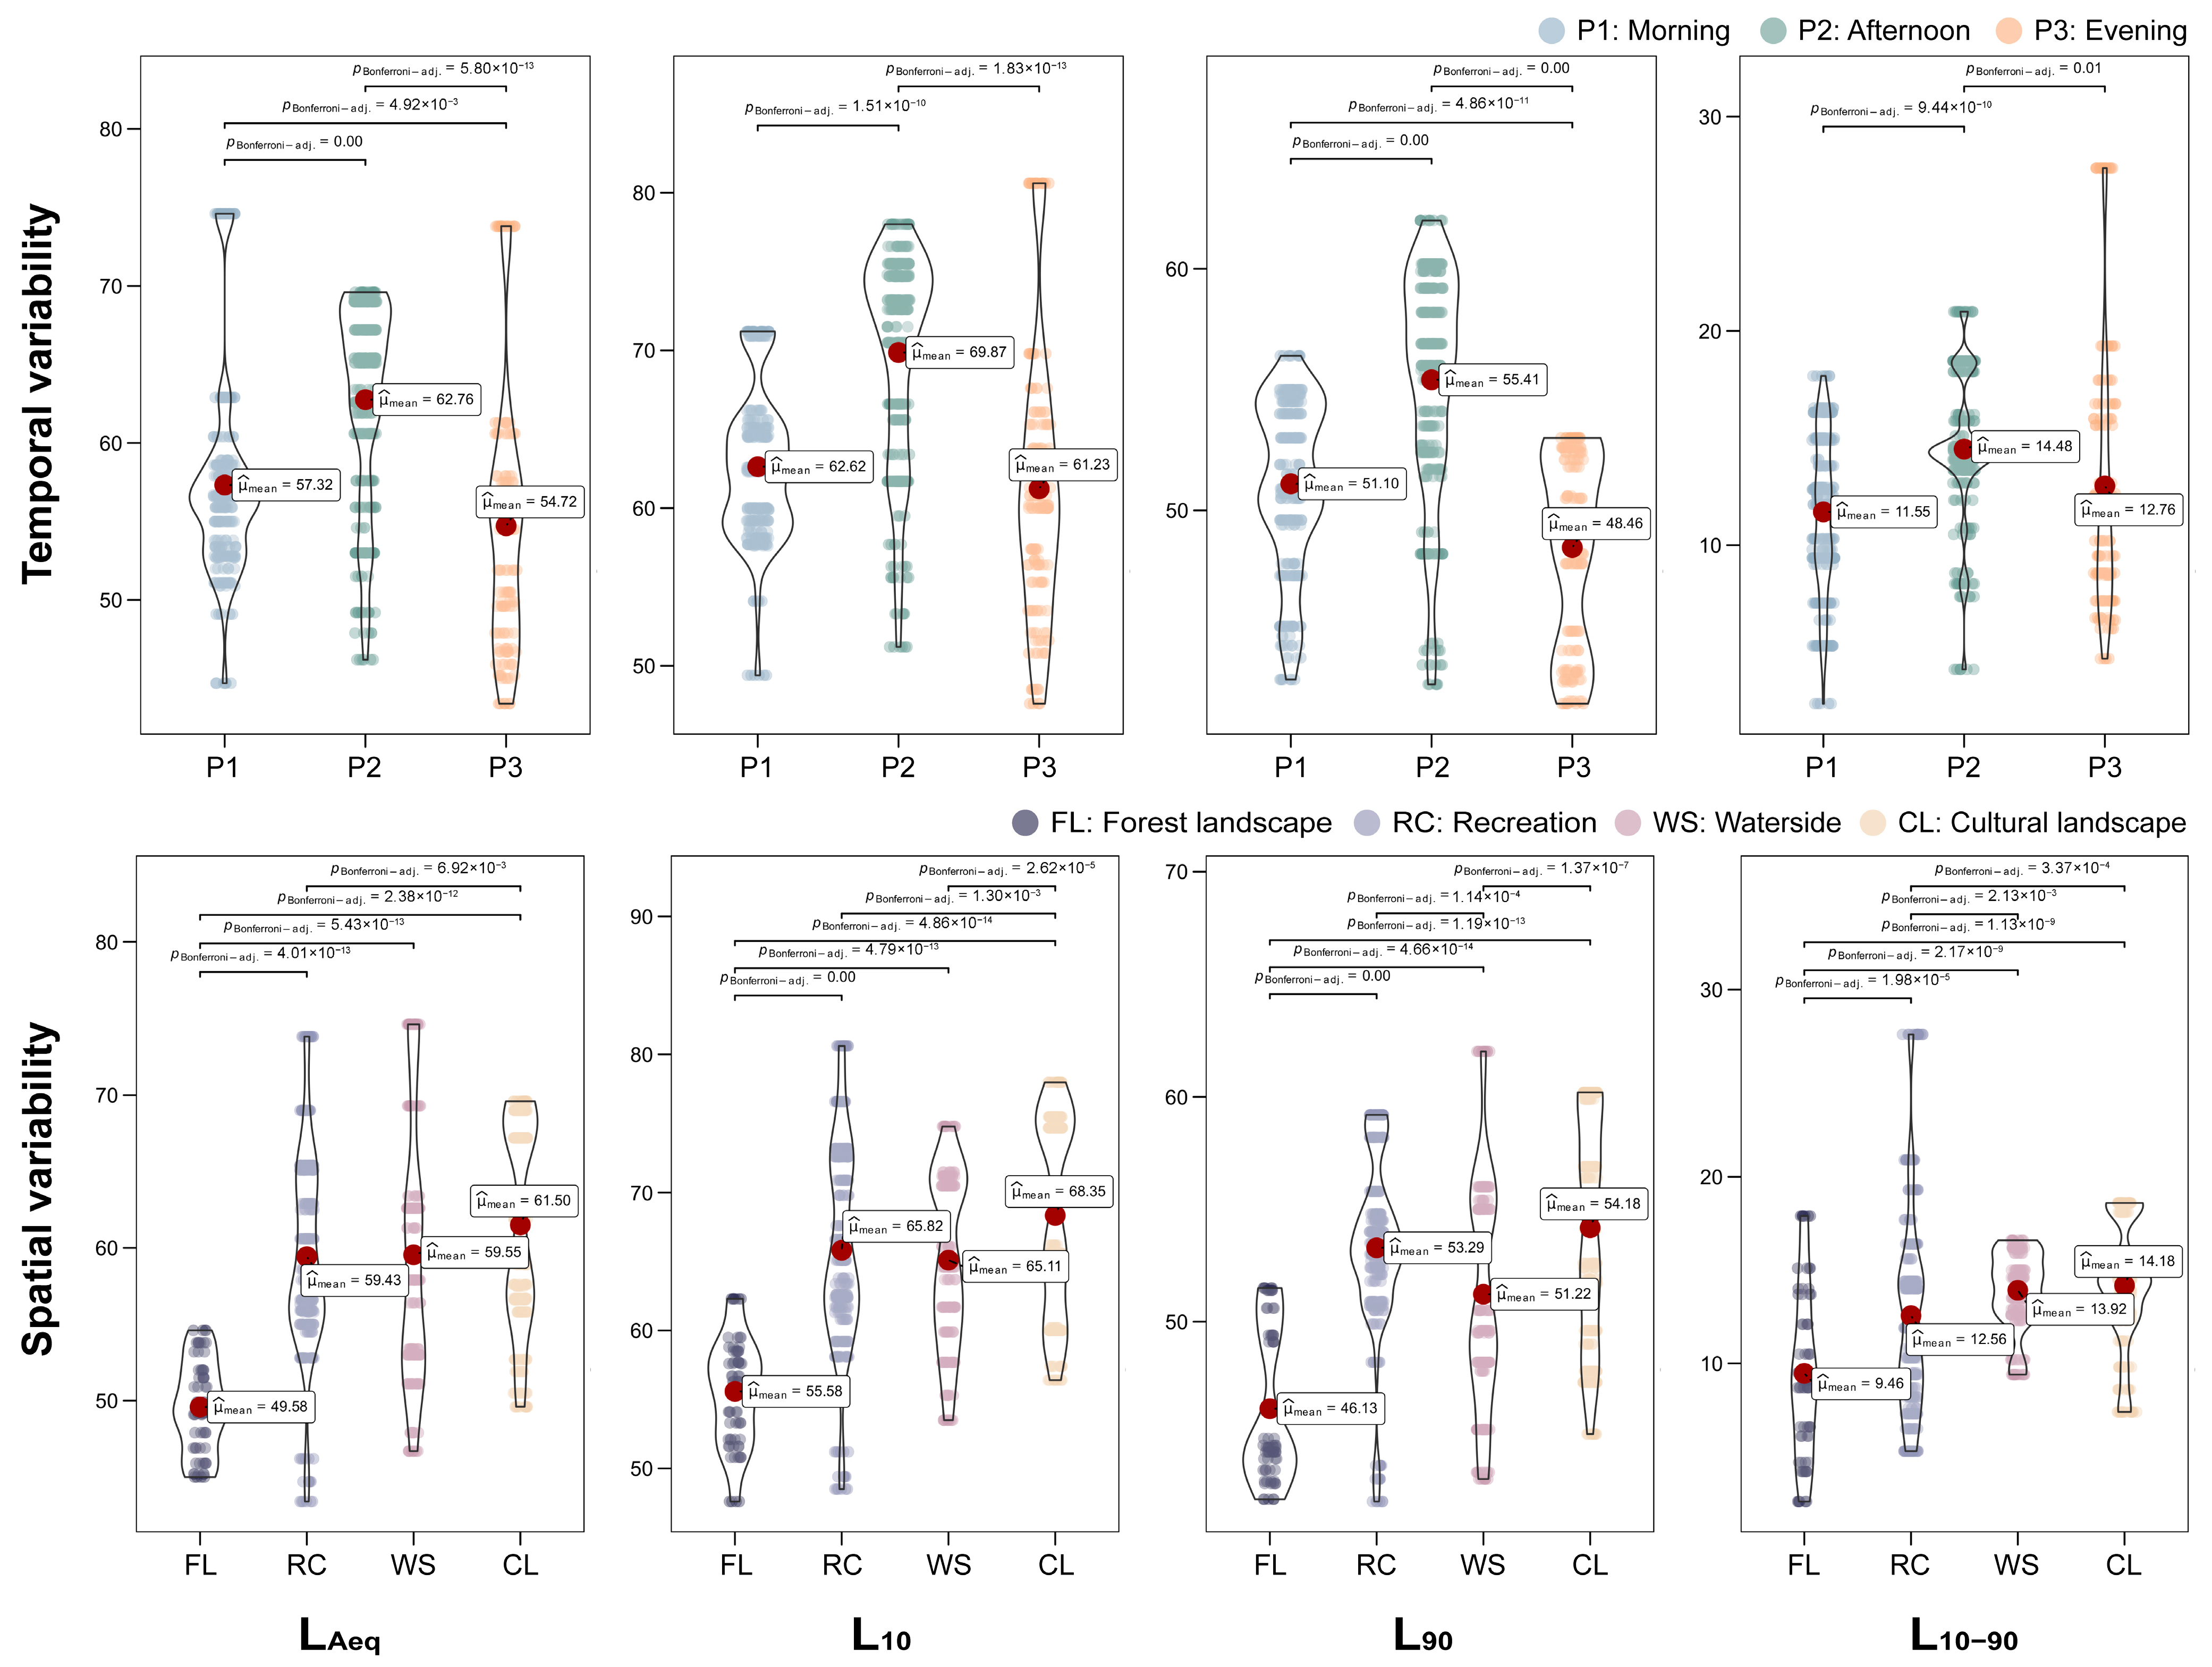
3.1. Spatiotemporal Variability of the Perceptual and Physical Sound Features in Urban Forests

The results of the MANOVA in Table 4 show that only the SHDs of three sound types varied significantly across the times, while all perceptual sound features exhibited evident variations across spaces. This shows that the overall soundscape perception tended to be more stable than the SHDs across time. In addition, the differences in the types of spatial functions could make the perceptual sound features more variable than diurnal changes generally. The interaction effect between time and space was significant for the variations of SHD_NS, SHD_MS, and EVE, but not for the changes in SHD_HS and PLE. This means that SHD_NS, SHD_MS, and EVE may be affected by time and space simultaneously.
The main and interaction effects of time and space were significant for all physical acoustic features with mostly large effect sizes (partial eta squared > 0.14) (Table 5), indicating that the physical acoustic features were more amenable to changes in space and time than the perceptual sound features, especially in terms of temporal effect. The main effect of time had the largest effect size on the variations of LAeq and L10, and the main effect of space had the largest effect size on L90, while the effect size of interaction on L10–90 was the highest. This implies that the individual temporal or spatial factor has a better ability to explain the sound intensity, while the interaction effect accounts more notably for the dynamic changes in sound levels.
Figure 2 shows that, in general, more significant spatial variabilities of the perceptual sound features were detected than temporal variabilities, except for SHD_HS. This echoes the results of the MANOVA to some extent, showing the more influential role of spatial function types. Temporally speaking, SHD_NS was significantly low in P2, and SHD_MS was significantly high in P1. SHD_HS was significantly high in P1 and P2, showing that people performed more daytime exercises, such as walking, running, or tai chi, in the study area. Spatially speaking, SHD_NS was considerably increased in the FL and CL zones than in the RC and WS zones. This is because the flow of visitors was more concentrated in the RC and WS zones, offering more opportunities for people to experience natural sounds, so as to increase the SHD_NS in the FL and CL zones. SHD_MS was visibly decreased in the FL zone than in other zones, which may be associated with the relatively high density of vegetation in the FL zone, thereby reducing the intensity of MS. The results show that diurnal changes did not cause significant variability in PLE and EVE, showing a stable temporal pattern of overall soundscape perception, as found in the MANOVA (Table 5). However, PLE significantly improved in the FL zone compared to other zones, and EVE was also evidently higher in the FL zone than in the RC and WS zones. This is associated with more natural features and elements in the FL zone than in the other three zones, providing more natural and diverse sound compositions, thereby constituting a more pleasant and eventful soundscape.
Similarly, LAeq, L10, L90, and L10–90 also showed more significant variability across spaces than across times (Figure 3), indicating the important role of the type of spatial function in the variability of physical acoustic features. The mean differences in the physical acoustic features in P2 were all found to be significantly higher than in P1 and P3, indicating that the overall sound events in the urban forests were most intense and changeable in the afternoon. This offered an overall perspective from which to understand the sound activities in urban forests compared to the perception of individual sound sources. In addition, all physical acoustic features in the FL zone were significantly lower than in other zones. This also reflects the same information as the results of perceptual sound features from a different perspective, which can also indicate that the FL zone contains relatively good ecological conditions (e.g., a high density and variety of vegetation) and less intensity concerning human activities. All of these features provide the premise for a quieter and more stable acoustic environment existing in the FL zone than the other zones. Interestingly, the means of four features were even slightly higher in the CL zone than in the RC and WS zones. This may be because the sound compositions in the CL zone were more complicated; the sound compositions here were dominated by natural and human activities, while the sound compositions in the other three zones were either nature-dominated or human-dominated.

3.2. Influences of Landscape Characteristics on the Perceptual and Physical Sound Features Across Time and Space

All the significant (p < 0.05) and non-collinearity (TOL > 0.1 and VIF < 10) independent variables with their standardized coefficients (Beta) from each model are listed in Table 6, Table 7, Table 8 and Table 9. Generally, the model results show the complex and varied impacts of landscape components on the sound features in different times and spaces. Considering the space limitations, and to avoid redundant elaboration, this section mainly concentrates on the results that are representative, interesting, or capable of reflecting overall patterns.
Table 6 shows that LSD had continuous impacts on SHD_NS and PLE in all sampling periods; however, for different functional zones, no specific landscape components were detected to consistently influence the perceptual sound features (Table 7). This phenomenon may be associated with the differences between the temporal and spatial variabilities of perceptual sound features. When combining the results in Section 3.1, this further indicates that the greater variabilities in the perceptual sound features may lead to less possibility of the persistent influence of landscape characteristics in urban forests. In addition, EVE was negatively affected by Prop_StA in P1 and P2 but positively influenced by Prop_AtF in P3. These results exhibit the positive correlations found between EVE and the area proportion of artificial land cover, which implies that the area proportion of artificial land cover is one of the main drivers of creating eventful soundscapes.
Although the cross-spatial impacts of landscape characteristics on the perceptual sound features were more complicated and changeable than the cross-temporal impacts, there are still some similarities regarding the impacts of the main categories of landscape characteristics among perceptual sound features within a specific functional zone. For instance, the SHDs of the three main category sounds were affected more by the distance to land cover types in the RC zone and by the area proportion of land cover types in the CL zone. The overall soundscape perceptions were influenced more by the distance to land cover types in both the WS and CL zones. This informs the choice of management measures for the acoustic environment in urban forests, which can prioritize these categories of landscape characteristics in the development of the overarching framework; however, during implementation, adaptive and explicit adjustments should be made according to the type of spatial function, especially for those areas with frequent human activities.
Table 8 indicates that in the different periods, LAeq was consistently affected by LSD, Prop_StA, and Dist_UT, L10 and L10–90 were consistently influenced by LSC, and L90 was consistently affected by Dist_UT. These findings imply that the influence of landscape components on the physical acoustic features may be more regular and stable than the perceptual features across sampling periods. It is a reasonable assumption because both the acoustic features and landscape characteristics share the same nature of physicality and objectivity.
Similar to the perceptual sound features, there was no specific landscape component that consistently affected the physical sound features in all spaces (Table 9). However, it is interesting that L10 and L90 were affected by the same components of the area proportion of land cover types within the same functional zones. Specifically, they were affected by Prop_StA in the FL, RC, and CL zones, and by Prop_AtF in the WS zone. This reveals that the ratio between natural and artificial land cover is one of the essential determinants for both foreground and background sounds. Generally, in open spaces, the foreground sounds are more related to human sounds, while the background sounds are composed of more natural sounds [53], so that they also reflect the activity patterns of vocal organisms and people in some way.
Overall, the temporal and spatial regression models of physical acoustic features had higher R2 values than those of perceptual sound features. This is also associated with their same inherent attributes; therefore, objective landscape characteristics can better capture the variance of physical acoustic features. This also implies that the operating landscape measures used in the regulation and management of the acoustic environment in urban forests may be more effective for capturing the physical aspects.

4. Discussion

4.1. Spatiotemporal Variation Mechanisms of the Perceptual and Physical Soundscape Features in Urban Forests

The study results indicate that the spatiotemporal variabilities of most perceptual and physical sound features were generally significant. In addition, there were always more significant variabilities found between the different functional zones than between different sampling periods for both perceptual and physical sound features, except for SHD_HS (Figure 2 and Figure 3). This echoes the finding that the spatial factor generally had a better explanatory ability for the variance in sound features than for the temporal factors (Table 4 and Table 5). This also indicates that both the perceptual and physical acoustic environments in urban forests are influenced more strongly by the spatial function type than by the diurnal pattern. Such findings suggest that during the processes of landscape planning, design, and management, spatiotemporal patterns of the sound features should be considered to better support decision-making regarding the construction and maintenance of a good-quality acoustic environment in urban forests. The type of spatial or landscape function should be prioritized over diurnal variations.
The results of SDD and SHD calculations of natural and human sounds reveal the spatiotemporal patterns of the behaviors of vocal organisms and humans in urban forests. The significantly high SDD_NS and SHD_NS values recorded in the morning and evening may be attributed to vocal activities, especially of passerine bird species, as in the “dawn chorus” or “dusk chorus” [54,55]. Therefore, it is suggested that the measures for protecting natural sound resources should focus on the morning and evening periods when vocal animals are generally more active, especially by minimizing human interference during these periods. In addition, both SDD_HS and SHD_HS values were significantly high in the morning, which may be associated with people’s morning exercise, such as walking, tai chi, or dancing [34,56]. However, this did not result in obvious reductions in SDD_NS and SHD_NS (Figure 2 and Figure S1). This finding essentially reveals the importance of appropriate functional zoning planning in urban forests, which is useful for reducing the conflict between natural and human-activity sounds and for maintaining their respective harmony in the environment. The reasonable allocation of public open spaces (e.g., recreational and waterside areas) within urban forests can help guide the flow of people, provide tourists with suitable activity venues, and mitigate excessive human disturbance in nature-dominated areas (e.g., forest landscape areas).
In addition, we found that human activity and mechanical sounds were considered relatively harmonious across times and spaces (Figure 2), although they were generally not thought to be positive in previous studies [33,57,58]. We infer that the sound harmonious degree shares a similar core of subjective landscape preferences, which also depends on the use that people make of the landscape [59]. It strongly relates to the appropriateness of sound type and spatial function within the areas. Most of the human and mechanical sounds were incidental elements of human activities, such as the sounds of hawking, playing, broadcasting, and playing musical instruments, so the users were more likely to accept them [60]. This indicator of the harmonious degree of sound reflects similar information to that in the soundscape to some extent [61], but with more focus on individual sound sources. The harmonious degree of sound shows more than simply pleasant or unpleasant feelings from the sounds and is a combination of sound dominance and preference. Using this indicator can comprehensively record the perceived quality of sound sources at a specific time or space, usefully informing planners and decision-makers to better consider people’s well-being, as offered by the acoustic environment of urban forests.
The result of there being no significant temporal variability of soundscape pleasantness and eventfulness is different, in some way, from previous studies [32,33,34], but we also found similar spatiotemporal trends between pleasantness and eventfulness that were consistent with previous evidence [32,33]. The different result regarding significant temporal variability was found because our study employed statistical methods to quantitatively examine the significance of the variations, while previous studies identified significant variations solely based on subjective visual observation, as we mentioned in Section 1. Such “significant” results may be caused by fluctuations in the measured data that are not sufficiently scientific and reference-based to contribute to planning and management practice. [36]. In contrast, our statistically tested results can make acoustic or soundscape research more rigorous by controlling erroneous inferences, reducing subjective biases, and providing reliable and evidence-based references for soundscape planning and acoustic environment management. They can also contribute to a deeper understanding of the spatiotemporal variations in overall soundscape perception.
We found that both the temporal and spatial variabilities of the physical acoustic environment in the studied urban forests were closely associated with the patterns of human activities because they were similar to those of SDD_HS (Figure S1). This implies that the significantly high values for the physical sound feature may be attributed temporally to increased human flow and activities, especially in the afternoon, and, spatially, to those human activities chiefly concentrated in the recreation, waterside, and cultural landscape zones, such as hawking, playing, walking, and exercise. These associations indicate the dominant role of human-related sounds in the spatiotemporal pattern of the physical acoustic environment in urban forests. Such dominance was also found in previous studies [34,62]. This suggests that the implementation of noise management measures in urban forests, if necessary, should focus on areas such as diverting or limiting the flow of tourists, especially in the afternoon and in those areas with recreational and sightseeing functions.

4.2. Understanding the Influence of Landscape Characteristics on Spatiotemporal Sound Features for Landscape Planning and Management in Urban Forests

The temporal and spatial model results can be understood from the global and local perspectives, respectively. The cross-temporal results essentially reflect the influence of the landscape characteristics of the studied urban forests on sound features in different sampling periods at the global level. The cross-spatial results present the impacts of landscape characteristics on the sound features of specific functional zones within urban forests, which tend to reflect the local relationships. This implies that a sound feature was inevitably affected by varied landscape characteristics; sometimes, the directions of influence were even different. Such findings were difficult to detect in previous studies that did not consider both temporal and spatial factors, which also highlights the innovation and significance of our study to some extent. Both global and local results can be combined to better develop specific planning objectives and management measures in practice. In the temporal models, we found that some of the main components of landscape characteristics had persistent effects on perceptual and physical sound features. However, no landscape component had a persistent effect on the sound features across spaces. This is because the acoustic environmental features varied significantly across times and spaces, as presented in our results above, while the landscape characteristics commonly showed significant differences only between spaces, and they did not vary considerably in the short term (e.g., in one day) [63].
Temporally, LSD negatively influenced SHD_NS and PLE but positively affected LAeq in all periods. This result suggests that the low diversity of landscape structures in urban forests can usefully improve the diurnal natural harmonious degree of sound and the soundscape pleasantness, while reducing the sound levels simultaneously. This is because a landscape with a simple arrangement and typology of composition can provide more room for natural sound propagation and exposure [15], which is also useful for promoting the overall soundscape pleasantness [8,12]. Also, such a landscape structure is often relatively even and contiguous, which may effectively reduce the impact of the reflection and diffraction of sound waves [64], so it is difficult to gather high sound pressure levels within the selected areas. Similarly, past evidence also indicated that a landscaped area with a uniform structure or on a large scale can usefully reduce the perception of traffic sounds [33,35]. In addition, LSC also had persistent impacts on L10 and L10–90 across times. Interestingly, the impacts on these two features were negative in the morning but positive in the afternoon and evening. This may be related to the varied composition of the high-intensity sound sources. This speculation can be supported by the results of SDDs to a large extent. Each main category sound had a unique temporal trend of SDD (Figure S1), which means they can combine into different dominant sound compositions at each period. Both L10 and L10–90 contain information about foreground sounds that are highly related to the dominant sounds, so they were affected by the landscape components in different directions across time.
Spatially, Dist_NLC was found to negatively affect SHD_NS and PLE in the recreation zone but to positively affect SHD_NS and EVE in the cultural landscape zone. These results suggest that within the recreational area, those human-activity spaces close to natural land cover can usefully improve the visitors’ perceived harmony of natural sounds and soundscape pleasantness when they are performing their activities. However, a different measure should be applied in those areas with cultural elements. According to the results, we found that people may generally prefer culture- or history-related elements compared to natural components in such areas, and they consider the peaceful and comfortable attributes to be more important [65]. Accordingly, for those areas with cultural resources, it is suggested to keep the cultural elements a suitable distance from the natural land cover, to maintain the harmony of natural sounds and create a calm soundscape. Furthermore, both L10 and L90 were positively affected by Prop_StA in the forest landscape, recreation, and cultural landscape zones, while they were negatively influenced by Prop_AtF in the waterside zone. Combining our analysis of the physical acoustic features in Section 4.1, these results indicate that for those areas with recreational functions, waterside spaces, or cultural and historical elements, increasing the area ratio of shrubs or forests to pavements may attract more human gatherings and activities. We speculate that this attraction is associated with the thermal comfort of the environment. Although the temperatures during survey periods were lower than in the summer, the weather at that time in Fuzhou city was still relatively sultry. Vegetation coverage can effectively reduce the ambient temperature, thus offering a more comfortable environment [66]. For those areas containing a high proportion of vegetation, the results suggest that an increase in the ratio of shrubs to pavements can lead to an improved intensity of natural sounds because natural sounds dominated (L10) in the forest landscape zone (Figure S1). In addition, the results illustrate that an increase in the area of shrubs or forests can also significantly increase the intensity of background sounds (L90). This is because the increase in vegetation coverage can generate more subtle natural sounds (e.g., wind-induced vegetation sounds), which are key components of background sounds. Such increases can serve as useful measures for improving the overall soundscape quality in landscape planning and design in urban forests.

4.3. Limitations and Suggested Research Topics in the Future

There are still some limitations that can be addressed in future studies. First, the findings of this study were only derived from the Fuzhou National Forest Park, China, so that future studies are encouraged to conduct more comparative investigations in different countries. As such, people’s perceptual outcomes in these studies may also differ from those in the present research due to differentiated social and cultural backgrounds. This raises a second flaw, in that demographic characteristics (e.g., gender, age, education, or occupation) were not included in the analyses. Future research is expected to explore the main effects of demographic characteristics and their interactions with other factors on perceptual sound attributes in urban forests. Despite these limitations, this study successfully followed the research objective and addressed the research questions, exploring the spatiotemporal variability and influential landscape characteristics of perceptual and physical features in urban forests. The study findings offer a deeper understanding of the spatiotemporal pattern of the perceptual and physical acoustic environment and advance the state of knowledge of both temporal and spatial relationships between the sound features and landscape characteristics seen in urban forests. They also provide statistical evidence and scientific references to usefully inform landscape planning and management in urban forests.

5. Conclusions

This study statistically examined the spatiotemporal variability of perceptual and physical sound features and identified the cross-temporal and cross-spatial impacts of landscape characteristics on these sound features. The results reveal that the variabilities of perceptual and physical sound features were both affected more strongly by spatial function types than diurnal patterns. Most sound features varied significantly across times and spaces, while soundscape pleasantness and eventfulness did not show significant temporal variation. We found that the harmonious degree of sound is largely associated with the appropriateness of the sound type and spatial functions. In addition, those human activities that generate sounds were the main drivers for the spatiotemporal variation of physical acoustic features in urban forests. The results of the temporal and spatial regression models essentially reflect the global and local relationships between landscape characteristics and the acoustic environment in urban forests. The main components of landscape patterns (i.e., landscape structural diversity and landscape shape complexity) persistently influenced the sound features across all times, but no cross-spatial impact of the landscape component was found. This study helps improve the understanding of the mechanism of spatiotemporal variations in acoustic environments and their relationship with landscape characteristics, which informs landscape planning and management in urban forests. The study findings can provide scientific references and empirical evidence to support the development of management measures for spatiotemporal dynamic acoustic environmental quality, and to emphasize the priority given to their most influential landscape characteristics in urban forests. The findings can also inform the appropriate arrangement of landscape types and functional zoning planning, usefully promoting the coordination of acoustic environment quality and spatial function types in urban forests. Future research could incorporate more case studies of urban forests from different regions or countries for comparison and consider the influence of the public’s demographic features on the perception of urban forest soundscapes.

Supplementary Materials

The following supporting information can be downloaded at: https://www.mdpi.com/article/10.3390/f15122171/s1, Table S1. Description and formulae of the selected landscape indices [67,68,69]; Table S2. Data sources and the processing of the included indicators of landscape characteristics [68,70]; Table S3. PCA-rotated component matrix of the overall soundscape perception, based on the data for semantic attributes (the numbers in parentheses represent explained variance); Table S4. PCA-rotated component matrices for the four categories of landscape characteristics; Table S5. PCA-rotated component matrix of the area proportion of land cover types without the Prop_WB variable; Table S6. Multivariate tests for the multivariate analysis of variance (MANOVA) of the perceptual sound attributes; Table S7. Multivariate tests for the multivariate analysis of variance (MANOVA) of the physical acoustic features; Figure S1. Pairwise comparisons of the temporal and spatial variability of the sound dominance degree (SDD). NS—natural sound, HS—human activity sound, MS—mechanical sound.

Author Contributions

Conceptualization, Z.C., T.-Y.Z. and J.L.; methodology, Z.C. and J.L.; software, Z.C. and T.-Y.Z.; validation, Z.C., T.-Y.Z., X.G. and J.L.; formal analysis, Z.C. and T.-Y.Z.; investigation, Z.C., T.-Y.Z. and X.G.; resources, Z.C. and T.-Y.Z.; data curation, Z.C. and T.-Y.Z.; writing—original draft preparation, Z.C. and T.-Y.Z.; writing—review and editing, Z.C., T.-Y.Z. and J.L.; visualization, Z.C. and T.-Y.Z.; supervision, J.L.; project administration, J.L.; funding acquisition, J.L. All authors have read and agreed to the published version of the manuscript.

Funding

This research was funded by the National Natural Science Foundation of China (grant number: 52378049).

Data Availability Statement

Data are contained within the article.

Acknowledgments

The first author also would like to thank the China Scholarship Council (grant number: 202108080105) for its support.

Conflicts of Interest

The authors declare no conflicts of interest.

References

  1. Baumeister, C.F.; Gerstenberg, T.; Plieninger, T.; Schraml, U. Exploring cultural ecosystem service hotspots: Linking multiple urban forest features with public participation mapping data. Urban For. Urban Green. 2020, 48, 126561. [Google Scholar] [CrossRef]
  2. Rahman, M.A.; Stratopoulos, L.M.F.; Moser-Reischl, A.; Zölch, T.; Häberle, K.-H.; Rötzer, T.; Pretzsch, H.; Pauleit, S. Traits of trees for cooling urban heat islands: A meta-analysis. Build. Environ. 2020, 170, 106606. [Google Scholar] [CrossRef]
  3. Nowak, D.J.; Hirabayashi, S.; Doyle, M.; McGovern, M.; Pasher, J. Air pollution removal by urban forests in Canada and its effect on air quality and human health. Urban For. Urban Green. 2018, 29, 40–48. [Google Scholar] [CrossRef]
  4. Klingberg, J.; Broberg, M.; Strandberg, B.; Thorsson, P.; Pleijel, H. Influence of urban vegetation on air pollution and noise exposure–a case study in Gothenburg, Sweden. Sci. Total Environ. 2017, 599, 1728–1739. [Google Scholar] [CrossRef] [PubMed]
  5. Bherwani, H.; Banerji, T.; Menon, R. Role and value of urban forests in carbon sequestration: Review and assessment in Indian context. Environ. Dev. Sustain. 2024, 26, 603–626. [Google Scholar] [CrossRef]
  6. He, M.; Wang, Y.; Wang, W.J.; Xie, Z. Therapeutic plant landscape design of urban forest parks based on the Five Senses Theory: A case study of Stanley Park in Canada. Int. J. Geoheritage Parks 2022, 10, 97–112. [Google Scholar] [CrossRef]
  7. Kamel Boulos, M.N.; Al-Shorbaji, N.M. On the Internet of Things, Smart Cities and the WHO Healthy Cities; Springer: Berlin/Heidelberg, Germany, 2014; Volume 13. [Google Scholar]
  8. Levenhagen, M.J.; Miller, Z.D.; Petrelli, A.R.; Ferguson, L.A.; Shr, Y.-H.; Gomes, D.G.E.; Taff, B.D.; White, C.; Fristrup, K.; Monz, C. Ecosystem services enhanced through soundscape management link people and wildlife. People Nat. 2020, 3, 176–189. [Google Scholar] [CrossRef]
  9. Bian, Q.; Wang, C.; Sun, Z.; Yin, L.; Jiang, S.; Cheng, H.; Zhao, Y. Research on spatiotemporal variation characteristics of soundscapes in a newly established suburban forest park. Urban For. Urban Green. 2022, 78, 127766. [Google Scholar] [CrossRef]
  10. Sun, K.; de Coensel, B.; Filipan, K.; Aletta, F.; van Renterghem, T.; de Pessemier, T.; Joseph, W.; Botteldooren, D. Classification of soundscapes of urban public open spaces. Landsc. Urban Plan. 2019, 189, 139–155. [Google Scholar] [CrossRef]
  11. Chen, Z.; Hermes, J.; Liu, J.; von Haaren, C. How to integrate the soundscape resource into landscape planning? A perspective from ecosystem services. Ecol. Indic. 2022, 141, 109156. [Google Scholar] [CrossRef]
  12. Mohammadzadeh, N.; Mohammadzadeh, R. The assessment of soundscape quality in historic urban parks: A case study of El-Goli Park of Tabriz, Iran. Noise Vib. Worldw. 2023, 54, 248–260. [Google Scholar] [CrossRef]
  13. Ratcliffe, E. Sound and soundscape in restorative natural environments: A narrative literature review. Front. Psychol. 2021, 12, 963. [Google Scholar] [CrossRef] [PubMed]
  14. Hedblom, M.; Gunnarsson, B.; Schaefer, M.; Knez, I.; Thorsson, P.; Lundström, J.N. Sounds of nature in the city: No evidence of bird song improving stress recovery. Int. J. Environ. Res. Public Health 2019, 16, 1390. [Google Scholar] [CrossRef] [PubMed]
  15. Richards, D.G.; Wiley, R.H. Reverberations and amplitude fluctuations in the propagation of sound in a forest: Implications for animal communication. Am. Nat. 1980, 115, 381–399. [Google Scholar] [CrossRef]
  16. Schulte-Fortkamp, B.; Jordan, P. Soundscape: The holistic understanding of acoustic environments. In Soundscapes: Humans and Their Acoustic Environment; Springer: Berlin/Heidelberg, Germany, 2023; pp. 49–79. [Google Scholar]
  17. Lam, B.; Gan, W.-S.; Shi, D.; Nishimura, M.; Elliott, S. Ten questions concerning active noise control in the built environment. Build. Environ. 2021, 200, 107928. [Google Scholar] [CrossRef]
  18. ISO 12913-1; Acoustics-Soundscape—Part 1: Definition and Conceptual Framework. International Organization for Standardization: Geneva, Switzerland, 2014.
  19. ISO 12913-2; Acoustics-Soundscape—Part 2: Data Collection and Reporting Requirements. International Organization for Standardization: Geneva, Switzerland, 2018.
  20. Brown, A.L.; Gjestland, T.; Dubois, D. Acoustic environments and soundscapes. In Soundscape Built Environ; CRC Press: Boca Raton, FL, USA, 2016; pp. 1–16. [Google Scholar]
  21. Hong, X.-C.; Cheng, S.; Liu, J.; Guo, L.-H.; Dang, E.; Wang, J.-B.; Cheng, Y. How should soundscape optimization from perceived soundscape elements in Urban forests by the riverside be performed? Land 2023, 12, 1929. [Google Scholar] [CrossRef]
  22. Aletta, F.; Kang, J.; Axelsson, Ö. Soundscape descriptors and a conceptual framework for developing predictive soundscape models. Landsc. Urban Plan. 2016, 149, 65–74. [Google Scholar] [CrossRef]
  23. Pijanowski, B.C.; Farina, A.; Gage, S.H.; Dumyahn, S.L.; Krause, B.L. What is soundscape ecology? An introduction and overview of an emerging new science. Landsc. Ecol. 2011, 26, 1213–1232. [Google Scholar] [CrossRef]
  24. Pijanowski, B.C.; Villanueva-Rivera, L.J.; Dumyahn, S.L.; Farina, A.; Krause, B.L.; Napoletano, B.M.; Gage, S.H.; Pieretti, N. Soundscape ecology: The science of sound in the landscape. BioScience 2011, 61, 203–216. [Google Scholar] [CrossRef]
  25. Guo, Y.; Wang, K.; Zhang, H.; Jiang, Z. Soundscape Perception Preference in an Urban Forest Park: Evidence from Moon Island Forest Park in Lu’an City. Sustainability 2022, 14, 16132. [Google Scholar] [CrossRef]
  26. Li, N.; Wen, Y.; Wang, Y.; Li, Y.; Chen, Q.; Li, X.; Lv, B. Does Soundscape Perception Lead to Environmentally Responsible Behavior? A Case Study in Longcanggou Forest Park, China. Land 2022, 11, 1505. [Google Scholar] [CrossRef]
  27. Guo, Y.; Jiang, X.; Zhang, L.; Zhang, H.; Jiang, Z. Effects of sound source landscape in urban forest park on alleviating mental stress of visitors: Evidence from Huolu Mountain Forest Park, Guangzhou. Sustainability 2022, 14, 15125. [Google Scholar] [CrossRef]
  28. Liu, J.; Xiong, Y.; Wang, Y.; Luo, T. Soundscape effects on visiting experience in city park: A case study in Fuzhou, China. Urban For. Urban Green. 2018, 31, 38–47. [Google Scholar] [CrossRef]
  29. Arsalan, M.; Chamani, A.; Zamani-Ahmadmahmoodi, R. Sustaining tranquility in small urban green parks: A modeling approach to identify noise pollution contributors. Sustain. Cities Soc. 2024, 113, 105655. [Google Scholar] [CrossRef]
  30. Hao, Z.; Wang, C.; Sun, Z.; van den Bosch, C.K.; Zhao, D.; Sun, B.; Xu, X.; Bian, Q.; Bai, Z.; Wei, K. Soundscape mapping for spatial-temporal estimate on bird activities in urban forests. Urban For. Urban Green. 2021, 57, 126822. [Google Scholar] [CrossRef]
  31. Bian, Q.; Zhang, C.; Wang, C.; Yin, L.; Han, W.; Zhang, S. Evaluation of soundscape perception in urban forests using acoustic indices: A case study in Beijing. Forests 2023, 14, 1435. [Google Scholar] [CrossRef]
  32. Chen, Z.; Zhu, T.-Y.; Liu, J.; Hong, X.-C. Before Becoming a World Heritage: Spatiotemporal Dynamics and Spatial Dependency of the Soundscapes in Kulangsu Scenic Area, China. Forests 2022, 13, 1526. [Google Scholar] [CrossRef]
  33. Hong, J.Y.; Jeon, J.Y. Relationship between spatiotemporal variability of soundscape and urban morphology in a multifunctional urban area: A case study in Seoul, Korea. Build. Environ. 2017, 126, 382–395. [Google Scholar] [CrossRef]
  34. Song, X.; Lv, X.; Yu, D.; Wu, Q. Spatial-temporal change analysis of plant soundscapes and their design methods. Urban For. Urban Green. 2018, 29, 96–105. [Google Scholar] [CrossRef]
  35. Liu, J.; Kang, J.; Luo, T.; Behm, H.; Coppack, T. Spatiotemporal variability of soundscapes in a multiple functional urban area. Landsc. Urban Plan. 2013, 115, 1–9. [Google Scholar] [CrossRef]
  36. Cox, D.R. Statistical significance tests. Br. J. Clin. Pharmacol. 1982, 14, 325. [Google Scholar] [CrossRef] [PubMed]
  37. Mazaris, A.D.; Kallimanis, A.S.; Chatzigianidis, G.; Papadimitriou, K.; Pantis, J.D. Spatiotemporal analysis of an acoustic environment: Interactions between landscape features and sounds. Landsc. Ecol. 2009, 24, 817–831. [Google Scholar] [CrossRef]
  38. Sacchelli, S.; Favaro, M. A Virtual-Reality and Soundscape-Based Approach for Assessment and Management of Cultural Ecosystem Services in Urban Forest. Forests 2019, 10, 731. [Google Scholar] [CrossRef]
  39. Guo, X.; Liu, J.; Chen, Z.; Hong, X.-C. Harmonious Degree of Sound Sources Influencing Visiting Experience in Kulangsu Scenic Area, China. Forests 2023, 14, 138. [Google Scholar] [CrossRef]
  40. Christmann, A.; van Aelst, S. Robust estimation of Cronbach’s alpha. J. Multivar. Anal. 2006, 97, 1660–1674. [Google Scholar] [CrossRef]
  41. Shrestha, N. Factor analysis as a tool for survey analysis. Am. J. Appl. Math. Stat. 2021, 9, 4–11. [Google Scholar] [CrossRef]
  42. Tobias, S.; Carlson, J.E. Brief report: Bartlett’s test of sphericity and chance findings in factor analysis. Multivar. Behav. Res. 1969, 4, 375–377. [Google Scholar] [CrossRef]
  43. Wu, L.; Zhang, Q.; Yan, Y.; Lan, T.; Hu, Y.; Zhang, Y.; He, T.; Ye, J. A Study on Spatiotemporal Dynamics and Spatial Dependence of Sound Source Perception in Fuzhou Historical and Cultural Districts. Buildings 2024, 14, 1753. [Google Scholar] [CrossRef]
  44. Wenyan, X.U.; Huaqing, W.; Hua, S.U.; Sullivan, W.C.; Guangsi, L.I.; Pryor, M.; Jiang, B. Impacts of sights and sounds on anxiety relief in the high-density city. Landsc. Urban Plan. 2024, 241, 104927. [Google Scholar]
  45. Yuan, S.; Tao, F.; Li, Y. The restorative effects of virtual reality forests on elderly individuals during the COVID-19 lockdown. J. Organ. End User Comput. (JOEUC) 2022, 34, 22. [Google Scholar] [CrossRef]
  46. Akdağ, N.Y.; Gedik, G.Z.; Kiraz, F.; Şener, B. Effect of mass housing settlement type on the comfortable open areas in terms of noise. Environ. Monit. Assess. 2017, 189, 504. [Google Scholar] [CrossRef] [PubMed]
  47. Ge, J.; Lu, J.; Morotomi, K.; Hokao, K. Developing soundscapegraphy for the notation of urban soundscape: Its concept, method, analysis and application. Acta Acust. United Acust. 2009, 95, 65–75. [Google Scholar] [CrossRef]
  48. Hong, J.Y.; Jeon, J.Y. Exploring spatial relationships among soundscape variables in urban areas: A spatial statistical modelling approach. Landsc. Urban Plan. 2017, 157, 352–364. [Google Scholar] [CrossRef]
  49. Cohen, J. Eta-squared and partial eta-squared in fixed factor ANOVA designs. Educ. Psychol. Meas. 1973, 33, 107–112. [Google Scholar] [CrossRef]
  50. Napierala, M.A. What is the Bonferroni correction? Aaos Now 2012, 40–41. Available online: https://docs.ufpr.br/~giolo/CE073/Dados/Apendice/Bonferroni%20Correction.pdf (accessed on 8 December 2024).
  51. Miles, J. Tolerance and variance inflation factor. In Encyclopedia of Statistics in Behavioral Science; John Wiley and Sons, Ltd.: Hoboken, NJ, USA, 2005. [Google Scholar]
  52. Chen, W.; Li, H.; Hou, E.; Wang, S.; Wang, G.; Panahi, M.; Li, T.; Peng, T.; Guo, C.; Niu, C. GIS-based groundwater potential analysis using novel ensemble weights-of-evidence with logistic regression and functional tree models. Sci. Total Environ. 2018, 634, 853–867. [Google Scholar] [CrossRef]
  53. Han, Z.; Kang, J.; Meng, Q. The effect of foreground and background of soundscape sequence on emotion in urban open spaces. Appl. Acoust. 2022, 199, 109039. [Google Scholar] [CrossRef]
  54. Jain, M.; Diwakar, S.; Bahuleyan, J.; Deb, R.; Balakrishnan, R. A rain forest dusk chorus: Cacophony or sounds of silence? Evol. Ecol. 2014, 28, 1–22. [Google Scholar] [CrossRef]
  55. Staicer, C.A.; Spector, D.A.; Horn, A.G. The dawn chorus and other diel patterns in acoustic signaling. In Ecology and Evolution of Acoustic Communication in Birds; Cornell University Press: Ithaca, NY, USA, 1996; pp. 426–453. [Google Scholar]
  56. Li, H.; Xie, H.; Woodward, G. Soundscape components, perceptions, and EEG reactions in typical mountainous urban parks. Urban For. Urban Green. 2021, 64, 127269. [Google Scholar] [CrossRef]
  57. Hong, J.Y.; Jeon, J.Y. Comparing associations among sound sources, human behaviors, and soundscapes on central business and commercial streets in Seoul, Korea. Build. Environ. 2020, 186, 107327. [Google Scholar] [CrossRef]
  58. Li, W.; Zhai, J.; Zhu, M. Characteristics and perception evaluation of the soundscapes of public spaces on both sides of the elevated road: A case study in Suzhou, China. Sustain. Cities Soc. 2022, 84, 103996. [Google Scholar] [CrossRef]
  59. Carvalho Ribeiro, S.; Schroth, O.; Konkoly-Gyuró, E.; Hermes, J.; Boll, T.; von Haaren, C. Landscape aesthetics capacity as a cultural ecosystem service. In Landscape Planning with Ecosystem Services: Theories and Methods for Application in Europe; Springer: Dordrecht, The Nederlands, 2019; pp. 221–252. [Google Scholar]
  60. Meng, Q.; Kang, J. Effect of sound-related activities on human behaviours and acoustic comfort in urban open spaces. Sci. Total Environ. 2016, 573, 481–493. [Google Scholar] [CrossRef] [PubMed]
  61. Axelsson, Ö. How to Measure Soundscape Quality. In Proceedings of the EuroNoise 2015 Conference, Maastricht, The Nederlands, 31 May–3 June 2015. [Google Scholar]
  62. Zhao, Y.; Xu, S.; Huang, Z.; Fang, W.; Huang, S.; Huang, P.; Zheng, D.; Dong, J.; Chen, Z.; Yan, C. Temporal and spatial characteristics of Soundscape ecology in urban forest areas and its landscape spatial influencing factors. Forests 2022, 13, 1751. [Google Scholar] [CrossRef]
  63. Turner, M.G. Landscape ecology: The effect of pattern on process. Annu. Rev. Ecol. Syst. 1989, 20, 171–197. [Google Scholar] [CrossRef]
  64. Piechowicz, J. Sound wave diffraction at the edge of a sound barrier. Acta Phys. Pol. A 2011, 119, 1040–1045. [Google Scholar] [CrossRef]
  65. Pérez-Martínez, G.; Torija, A.J.; Ruiz, D.P. Soundscape assessment of a monumental place: A methodology based on the perception of dominant sounds. Landsc. Urban Plan. 2018, 169, 12–21. [Google Scholar] [CrossRef]
  66. Mohammadzadeh, N.; Karimi, A.; Brown, R.D. The influence of outdoor thermal comfort on acoustic comfort of urban parks based on plant communities. Build. Environ. 2023, 228, 109884. [Google Scholar] [CrossRef]
  67. Li, Y.; Xue, C.; Shao, H.; Shi, G.; Jiang, N. Study of the spatiotemporal variation characteristics of forest landscape patterns in Shanghai from 2004 to 2014 based on multisource remote sensing data. Sustainability 2018, 10, 4397. [Google Scholar] [CrossRef]
  68. Liu, J.; Kang, J.; Behm, H.; Luo, T. Landscape spatial pattern indices and soundscape perception in a multi-functional urban area, Germany. J. Environ. Eng. Landsc. Manag. 2014, 22, 208–218. [Google Scholar] [CrossRef]
  69. Ren, Y.; Wei, X.; Wang, D.; Luo, Y.; Song, X.; Wang, Y.; Yang, Y.; Hua, L. Linking landscape patterns with ecological functions: A case study examining the interaction between landscape heterogeneity and carbon stock of urban forests in Xiamen, China. For. Ecol. Manag. 2013, 293, 122–131. [Google Scholar] [CrossRef]
  70. Dzhambov, A.M.; Markevych, I.; Tilov, B.; Arabadzhiev, Z.; Stoyanov, D.; Gatseva, P.; Dimitrova, D.D. Lower noise annoyance associated with GIS-derived greenspace: Pathways through perceived greenspace and residential noise. Int. J. Environ. Res. Public Health 2018, 15, 1533. [Google Scholar] [CrossRef]
Figure 1. The location, functional zoning, land cover types, and sampling sites of the study area. The land cover types were extracted from the raster data of the vegetation cover type of Fuzhou city, obtained from the Resource and Environment Science and Data Center, Chinese Academy of Sciences (http://www.resdc.cn, accessed on 6 January 2022). The remote sensing image was derived from the computer network information center (geospatial data cloud) of the Chinese Academy of Sciences (https://www.gscloud.cn, accessed on 13 December 2021).
Forests 15 02171 g001
Figure 2. Pairwise comparisons of the temporal and spatial variability of the perceptual sound attributes of sound harmonious degree (SHD) and overall soundscape perception.
Forests 15 02171 g002
Figure 3. Pairwise comparisons of the temporal and spatial variability of the physical acoustic features: LAeq, L10, L90, and L10–90.
Forests 15 02171 g003
Table 1. Information on the functional zones and sampling sites within the study area.
Functional ZoneCodeArea (ha)Number of Sampling SitesBrief Description
Forest landscapeFL755This area is full of natural resources, especially forest landscapes.
RecreationRC377This area contains several specialized botanical gardens, places for outdoor activities (e.g., barbecues, picnics, and children playing), and a few museums.
WatersideWS474This area is centered on the “Bayi” Reservoir, a famous reservoir in Fuzhou, and its surrounding waterfront landscapes.
Cultural landscapeCL595This area is characterized by rich historical elements and cultural landscapes, such as historical temples and monumental sites.
Table 2. Common sounds identified in the study area.
Main Category SoundCodeSub-Category Sound
Natural soundsNSBirds, insects, frogs, wind-induced vegetation, wind, waterfall, stream, water drops
Human activity soundsHSTalking, footsteps, hawking, recreational activity, playing, exercise
Mechanical soundsMSBroadcasting, phones ringing, alarms, construction, traffic, musical instruments, music on the radio
Table 3. The extracted components of overall soundscape perception and the four categories of landscape characteristics. More detailed results are shown in Tables S3 and S4 in the Supplementary Materials.
Main CategoryExtracted Principal ComponentsCodeExplained Variance (%)Cumulative Variance (%)
Overall soundscape perceptionPleasantnessPLE45.891.1
EventfulnessEVE45.3
TerrainComposite terrain featuresCTF66.866.8
Area proportion of land cover typeArea ratio of artificial land cover to forestsProp_AtF72.692.2
Area ratio of shrublands to artificial land coverProp_StA19.6
Distance to land cover typeDistance to natural land coverDist_NLC22.583.5
Distance to artificial land coverDist_ALC35.8
Distance to urban transportationDist_UT25.2
Landscape: spatial patternsLandscape structural diversityLSD63.192.5
Landscape shape complexityLSC29.4
Table 4. Tests of the between-subject effects of the MANOVA used for assessing temporal and spatial effects on the perceptual sound attributes.
Sound AttributeEffectType III Sum of SquaresdfMean SquareFSig.Partial Eta Squared
SHD_NS aTime55.238227.626.38 **0.0020.016
Space392.1863130.7330.19 ***0.0000.101
Time × Space56.86969.482.19 *0.0420.016
SHD_HS bTime196.259298.1313.15 ***0.0000.032
Space67.604322.533.02 *0.0290.011
Time × Space39.92766.650.890.5000.007
SHD_MS cTime144.527272.2625.91 ***0.0000.061
Space52.605317.546.29 ***0.0000.023
Time × Space75.964612.664.54 ***0.0000.033
PLE dTime0.24420.120.130.8780.000
Space43.258314.4215.35 ***0.0000.054
Time × Space10.85461.811.930.0740.014
EVE eTime0.68120.340.350.7020.001
Space22.70837.577.86 ***0.0000.029
Time × Space16.66362.782.88 **0.0090.021
a Adjusted R2 = 0.127; b adjusted R2 = 0.050; c adjusted R2 = 0.117; d adjusted R2 = 0.061; e adjusted R2 = 0.037. * p < 0.05, ** p < 0.01, and *** p < 0.001.
Table 5. Tests of the between-subject effects from the MANOVA regarding temporal and spatial effects on the physical acoustic features: time-sampling period and space-functional zone.
Acoustic FeatureEffectType III Sum of SquaresdfMean SquareFSig.Partial Eta Squared
LAeq aTime3925.76721962.8864.13 ***0.0000.138
Space6450.61932150.2170.24 ***0.0000.208
Time × Space5618.2136936.3730.59 ***0.0000.186
L10 bTime5228.18022614.0998.62 ***0.0000.197
Space7269.51832423.1791.42 ***0.0000.255
Time × Space5190.3326865.0632.64 ***0.0000.196
L90 cTime3274.57921637.29144.31 ***0.0000.265
Space3117.91331039.3091.60 ***0.0000.255
Time × Space1055.6486175.9415.51 ***0.0000.104
L10–90 dTime266.1062133.0511.53 ***0.0000.028
Space1149.7173383.2433.21 ***0.0000.110
Time × Space3185.3776530.9046.00 ***0.0000.256
a Adjusted R2 = 0.454; b adjusted R2 = 0.532; c adjusted R2 = 0.531; d adjusted R2 = 0.380. *** p < 0.001.
Table 6. Results of the regression models for perceptual sound attributes in the different sampling periods.
Dependent VariableSampling PeriodIndependent VariableBetaToleranceVIFAdjusted R2F
SHD_NSP1Dist_UT0.202 ***0.8731.1450.15427.403 ***
LSD−0.415 ***0.8731.145
P2CTF0.214 **0.4222.3680.17324.259 ***
LSD−0.213 **0.4252.351
LSC−0.128 *0.9691.032
P3Prop_AtF0.466 *0.1496.7190.22614.862 ***
LSD−0.735 ***0.1456.899
LSC−0.208 **0.8501.177
SHD_HSP1CTF0.407 ***0.2444.0930.0956.245 ***
Prop_StA−0.264 **0.4022.490
Dist_UT0.526 ***0.3073.261
LSC0.156 *0.7171.394
LSD0.257 **0.3213.120
P2None-----
P3Prop_StA0.207 *0.9491.0530.0867.253 ***
LSD0.166 *0.9491.053
SHD_MSP1Dist_ALC0.262 *0.1865.3870.06811.069 ***
LSD0.472 ***0.1865.387
P2Prop_AtF−0.366 **0.2264.4340.0376.673 ***
LSD0.241 *0.2264.434
P3None-----
PLEP1LSD−0.287 ***1.0001.0000.08227.148 ***
P2Prop_AtF0.373 **0.2264.4340.07514.236 ***
LSD−0.538 ***0.2264.434
P3LSD−0.170 *1.0001.0000.0294.596 *
EVEP1Prop_StA−0.190 ***1.0001.0000.03611.325 ***
P2CTF0.108 *1.0001.0000.0244.201 ***
Prop_StA−0.11 *1.0001.000
P3Prop_AtF0.571 **0.1715.8620.14713.230 ***
LSD−0.821 ***0.1715.862
* p < 0.05, ** p < 0.01, *** p < 0.001.
Table 7. Results of the regression models for perceptual sound attributes in different functional zones. Only the significant independent variables are listed.
Dependent VariableFunctional ZoneIndependent VariableBetaToleranceVIFAdjusted R2F-Statistic
SHD_NSFLNone-----
RCDist_NLC−0.525 ***0.7451.3420.21142.195 ***
LSD0.343 ***0.7451.342
WSDist_ALC−0.350 ***1.0001.0000.12224.096 ***
CLProp_StA0.272 *0.2054.8720.17425.595 ***
Dist_NLC0.641 ***0.2054.872
SHD_HSFLDist_ALC0.267 *1.0001.0000.0715.607 *
RCDist_UT0.142 *1.0001.0000.0206.506 *
WSProp_StA−0.166 *1.0001.0000.0284.910 *
CLProp_AtF0.264 ***1.0001.0000.07018.235 ***
SHD_MSFLNone-----
RCProp_StA0.410 **0.1198.3930.17716.818 ***
Prop_AtF1.059 ***0.1069.398
Dist_UT−0.569 ***0.1248.062
LSD−0.935 ***0.1347.480
WSDist_NLC−0.316 ***1.0001.0000.10019.226 ***
CLProp_AtF0.229 ***1.0001.0000.05313.548 ***
PLEFLProp_StA0.269 *1.0001.0000.0725.702 *
RCCTF−0.320 ***0.8191.2200.09416.267 ***
Dist_NLC−0.235 ***0.8191.220
WSDist_ALC−0.496 ***1.0001.0000.24656.586 ***
CLDist_UT−0.239 ***1.0001.0000.05714.721 ***
EVEFLNone-----
RCLSD0.175 **1.0001.0000.03110.019 **
WSProp_StA−0.324 **0.4172.3970.29135.278 ***
Dist_NLC0.250 *0.4172.397
CLDist_NLC0.133 *1.0001.0000.0184.415 *
* p < 0.05, ** p < 0.01, *** p < 0.001.
Table 8. Results of the regression models for physical acoustic features in different sampling periods. Only the significant independent variables are listed.
Dependent VariableSampling PeriodIndependent VariableBetaToleranceVIFAdjusted R2F-Statistic
LAeqP1Prop_StA0.250 ***0.4672.1400.38337.160 ***
Prop_AtF−0.599 ***0.1079.344
Dist_UT−0.173 *0.3572.802
LSD0.735 ***0.1029.838
LSC−0.519 ***0.3872.584
P2Prop_StA0.268 ***0.2993.3480.55471.300 ***
Dist_NLC0.496 ***0.2943.401
Dist_ALC0.810 ***0.1109.090
Dist_UT0.490 ***0.3692.711
LSD0.631 ***0.1099.208
LSC0.629 ***0.3822.618
P3Prop_StA−0.368 ***0.3852.5970.50731.052 ***
Dist_NLC0.489 ***0.3293.040
Dist_UT0.329 ***0.5251.904
LSD0.188 **0.8111.233
LSC0.638 ***0.3183.149
L10P1CTF−0.135 *0.9511.0520.16319.566 ***
Prop_StA0.275 ***0.7601.316
LSC−0.126 *0.7621.312
P2Dist_NLC0.462 ***0.5561.7970.46466.458 ***
Dist_ALC0.225 ***0.9301.076
Dist_UT0.732 ***0.7851.275
LSC0.532 ***0.5111.956
P3CTF−0.281 ***0.9111.0980.50451.760 ***
Dist_NLC0.615 ***0.5521.812
LSC0.764 ***0.5931.686
L90P1Prop_AtF−0.535 ***0.1995.0260.25133.674 ***
Dist_UT0.216 ***0.7801.282
LSD0.731 ***0.1795.590
P2Dist_NLC0.284 ***0.5561.7970.47779.097 ***
Dist_ALC0.130 **0.9301.076
Dist_UT0.768 ***0.7851.275
LSC0.391 ***0.5111.956
P3Prop_AtF−0.255 ***0.8411.1890.51932.557 ***
Prop_StA−0.322 **0.3722.688
Dist_NLC0.599 ***0.2923.419
Dist_UT0.546 ***0.5431.843
LSC0.686 ***0.3283.051
L10–90P1Prop_StA0.380 ***0.5041.9850.18222.323 ***
Dist_UT−0.320 ***0.4952.018
LSC−0.296 ***0.7211.387
P2CTF−0.596 ***0.5941.6840.25138.890 ***
Dist_ALC0.571 ***0.5881.700
LSC0.194 ***0.9341.071
P3Dist_NLC0.568 ***0.6011.6650.52355.818 ***
LSD0.411 ***0.9741.027
LSC0.694 ***0.5901.694
* p < 0.05, ** p < 0.01, *** p < 0.001.
Table 9. Results of the regression models for physical acoustic features in different functional zones. Only the significant independent variables are listed.
Dependent VariableFunctional ZoneIndependent VariableBetaToleranceVIFAdjusted R2F-Statistic
LAeqFLDist_ALC0.551 *0.1407.1400.23611.094 ***
LSC0.951 **0.1407.140
RCCTF0.543 ***0.3193.1320.682133.712 ***
Prop_StA0.364 ***0.1486.760
Dist_NLC0.747 ***0.2633.796
Dist_ALC−0.451 ***0.4512.216
Dist_UT−0.442 ***0.1975.085
WSDist_UT0.782 ***1.0001.0000.612272.430 ***
CLProp_StA0.254 ***1.0001.0000.06516.894 ***
L10FLProp_StA0.264 *0.8181.2220.26312.817 ***
Dist_UT−0.566 ***0.8181.222
RCCTF0.606 ***0.3193.1320.686136.417 ***
Prop_StA0.38 ***0.1486.760
Dist_NLC0.784 ***0.2633.796
Dist_ALC−0.409 ***0.4512.216
Dist_UT−0.412 ***0.1975.085
WSProp_AtF−0.68 ***1.0001.0000.462148.835 ***
CLProp_StA0.301 ***1.0001.0000.09124.301 ***
L90FLProp_StA0.333 **1.0001.0000.1119.081 **
RCCTF−0.513 ***0.5241.9070.760197.947 ***
Prop_StA0.871 ***0.2474.046
Dist_ALC−0.905 ***0.4952.020
Dist_UT0.523 ***0.1825.482
LSC0.672 ***0.2583.878
WSCTF−0.159 *0.8571.1660.44067.537 ***
Prop_AtF−0.587 ***0.8571.166
CLProp_StA0.127 *1.0001.0000.0163.999 *
L10–90FLDist_ALC1.587 ***0.1407.1480.58233.014 ***
Dist_UT−0.467 ***0.4842.067
LSC1.470 ***0.1198.384
RCDist_ALC−0.702 ***0.5691.7580.44282.941 ***
Dist_UT−0.694 ***0.6891.452
LSD−0.353 ***0.7751.290
WSLSD0.647 ***0.6691.4940.29536.068 ***
LSC0.250 **0.6691.494
CLCTF0.463 ***0.3692.7090.28849.134 ***
LSD0.825 ***0.3692.709
* p < 0.05, ** p < 0.01, *** p < 0.001.
Disclaimer/Publisher’s Note: The statements, opinions and data contained in all publications are solely those of the individual author(s) and contributor(s) and not of MDPI and/or the editor(s). MDPI and/or the editor(s) disclaim responsibility for any injury to people or property resulting from any ideas, methods, instructions or products referred to in the content.

