1. Introduction
Extreme events such as wildfires, insect outbreaks, storms, and floods are causing increasing damage to forest populations globally, with significant impacts in Europe, including the Alps [
1,
2]. This situation has encouraged discussions, suggesting that forest ecosystems will have to deal with such extreme events more frequently in the future [
1,
3,
4]. With the increasing incidence of these extreme events, there is a corresponding rise in the amount of damaged timber that must be salvaged. This situation necessitates rapid interventions to prevent the loss of timber value and to mitigate further damage to the ecosystem [
5,
6,
7,
8,
9]. Salvage logging operations are common post-disturbance interventions that consist of the removal of damaged trees. The recovery of damaged trees is the subject of ongoing discussions and research, aiming to mitigate the impact that the high intensity and scale of interventions have on soil conservation [
10] and on the regeneration capacity of forest stands [
11,
12]. At the same time, when taking into account best practices for soil protection, such as leaving branches or, in general, logging residues along extraction trails [
13] and avoiding operations on water-saturated soils [
14], operation efficiency in terms of fuel consumption and production remains a key concern to ensure the competitiveness of forestry operations.
However, the application of Precision Forestry (PF) and Industry 4.0 (Fourth Industrial Revolution) concepts and tools, combined with a Big Data (BD) approach, has proven to be very useful in recent years, supporting the decision-making process for both forest managers and forest industry stakeholders [
15,
16,
17,
18,
19,
20]. More precisely, regarding Forest Operations (FO), this situation has led to a co-evolution between the forest management and FO machines manufacturers and operators, resulting in the development of a wide variety of improvements for all parties [
21]. Many developments have increased the ability to successfully harvest on steep terrain with slopes of 75%–85%, using ground-based equipment. Improvements have included additions such as self-leveling cabins [
22], harvesters equipped with independently suspended tracks or wheels mounted on hydraulically driven arms [
23], or forwarders with heavy-duty portal bogie axles with a balancing system and significant modifications of carrier bases to improve traction and stability. Additionally, a major step change has been the development of cable-assisted technology; this system can significantly increase the ability to operate on steep slopes and avoid soil-damaging slips [
24].
As a result of this co-evolution over the years, highly mechanized systems, like Cut-To-Length (CTL) and Whole-Tree (WT) systems, gained popularity, becoming some of the most used harvesting systems, especially the CTL system in Europe [
25,
26,
27]. In the CTL system, the tree felling, processing (delimbing and bucking the tree stem), and measuring of the resulting logs (front-end diameter and length) is performed through the use of harvesters, while the woody material extracting process, from the forest to the roadside or to the landing areas, is carried out using forwarders [
15,
20]. However, the gained popularity and spread use of the CTL system come mainly from the fact that all the technological improvements mentioned above and many more (depending on each machine manufacturer) result in fewer but more specialized forest operators needed, with lower occupational hazards and lower harvesting costs and time, leading to an overall higher productivity and fuel efficiency [
26]. Moreover, the CTL system has proven to be one of the most suitable harvesting systems, also in the case of salvage logging operations [
28,
29,
30]. Despite the fact that salvage logging interventions have their benefits and drawbacks [
6,
31,
32,
33]. When the site-specific characteristics are suitable for its implementation, fully mechanized systems (especially CTL systems) are the most suitable technological alternative to carry on the recovery operation. The increasing volume of damaged timber necessitates not only swift recovery solutions but also heightened attention to fuel efficiency. In fact, while there is considerable knowledge about the fuel efficiency of timber recovery in normal conditions, less is understood about the fuel efficiency and safety of large-scale and intensive salvage logging operations under extraordinary conditions, particularly when these operations resemble complex, large-scale sites.
Productivity and fuel efficiency assessments of CTL systems are usually driven from the effective time and fuel consumption analysis of the machines involved in the harvesting operation. Realistic models developed from these variables can be applied to optimize harvesting operations with a future-oriented ultimate objective of increasing the resilience and resistance of the forest ecosystem against the challenges of climate change [
34]. Timber extraction phase (from the forest to the landing areas) is the most time-consuming and expensive operation in the majority of the harvesting systems [
35]. When it comes to CTL systems, the productivity and fuel efficiency of the forwarders are typically more complex to predict than for harvesters, due to the several additional independent variables involved, such as extraction distance, machine payload, total log concentration, or number of products assortments being harvested [
24,
34,
36,
37,
38]. Nevertheless, the latest technological advances have the potential to help foresters overcome these challenges through the implementation of follow-up studies and Automatic Work-Element Detection (AWED) [
17]. Traditionally there has been a trade-off between representativeness and work element-specificity when compiling forwarding datasets, with follow-up studies and standardized experiments representing the two extremes. However, follow-up-based studies using the forest machines’ On-Board Computers (OBC) and automated data loggers attached to the machines’ Controller Area Network (CAN)-bus currently offer minor to non-significant differences for main work elements detection, thus becoming the automated data collection method increasingly common in harvesting productivity studies [
16,
17,
39,
40,
41,
42]. Although the number of assortments is already established as one of the most influential variables when estimating forwarders’ productivity [
26,
38], very few studies focused on the analysis of this variable [
36], and none using the advantages of follow-up-based studies or AWED. The AWED methodology takes into account the OBC data to diagnose the engine status and running parameters. Thus, by analyzing how the registered parameters and additional sensors (GNSS, accelerometers, etc.) readings change, the different work elements can be detected almost automatically through the use of BD tools and methodologies. The influence of the number of assortments extracted plays an important role, especially in the case of salvage logging operations in which there are many types of assortments, and each type has a different impact on the overall efficiency of the operation.
In order to fill this gap of knowledge and take advantage of the current accurate available data and exploitation of the AWED method, this work aims to evaluate the effect of the assortment on a large, damaged site in the alpine context. With the final objectives of (i) identifying the influence of multiple product assortments over forwarder performance and (ii) evaluating the most significant variables affecting forwarding productivity and fuel efficiency in salvage logging operations and under real working conditions.
2. Materials and Methods
2.1. Case Study
This study was conducted in September 2023 in the northeastern Italian Alps. The study area, (
Figure 1) located in Trento province and bordering the Paneveggio Pale di San Martino Natural Park, was affected by a bark beetle outbreak damaging the entire homogeneous, even-aged spruce (
Picea abies (L.) Karst.) stand. Further stand and site characteristics are described in
Table 1.
2.2. Machine Description
Forwarders can be classified into three different groups according to their loading capacity: (i) light, under 10 t; (ii) medium, from 10 up to 14 t; and (iii) heavy, over 14 t [
43]. The forwarder used in this study was a John Deere model 1210 E (Moline, IL, USA), and it falls into the medium size category with a loading capacity of 13 t. It was equipped with an integrated synchronized winch, used by operator choice and usually on slopes over 27%–30%, and it also featured Olofsforst ECO™ tracks (Nordmaling, Sweden) on the front bogies and Olofsforst Baltic™ tracks (Nordmaling, Sweden) on the rear bogies. Further machine details in
Table 2.
2.3. Data Analysis
This study was carried out between 8 September and 3 October 2023, comprising a total of 15.5 effective workdays, during which period a CAN-bus data logger was connected to the OBC plug of the machine in order to record and store all available engine working parameters under the SAE J1939 standard [
44]. From all the machine parameters recorded, those considered useful for this study are shown in
Table 3, and the sampling frequency for all of them was one second. The data logger used in this study was the CANedge2 manufactured by CSS Electronics (Aabyhoej, Denmark) (“CAN Bus Data Loggers—Simple. Pro. Interoperable—CSS Electronics”, n.d.). The CANedge2 enables stand-alone logging of the data from the CAN-bus of the machine to an SD memory card and offers a range of configuration options such as message filtering, pre-scaling, transmit messages, cyclic logging, among others. Another advantage derived from the use of this technology is that it is a modular data logger, meaning that it is possible to connect different extension modules (sensors) to the main unit. In this study, a CANmode.gps extension module was used in order to capture the position information of the machine while working. The CANmod.gps is a combined Global Navigation Satellite System (GNSS) and 3D Inertial Measurement Unit (IMU) sensor module, and it records the best possible positioning information by combining a variety of GNSS signals (GPS, GLONASS, Galileo, BeiDou).
Simultaneously, a manual time and motion study was carried out with the aim of (i) identifying the type of assortment extracted during each cycle, (ii) each cycle duration, and (iii) estimation of the load volume through the use of photogrammetry. Individual load volume of the forwarder was estimated using a rear-end picture of the complete load before unloading, and the diameter estimation was carried out by using Autodesk AutoCAD 2024 [
45]. To perform the diameter calibration of each load, two scaled poles were attached to the back of the forwarder loading space on a similar plane to the logs end (
Figure 2). The manual study performed also included as a categorical (yes or no) variable the use of the synchronized winch.
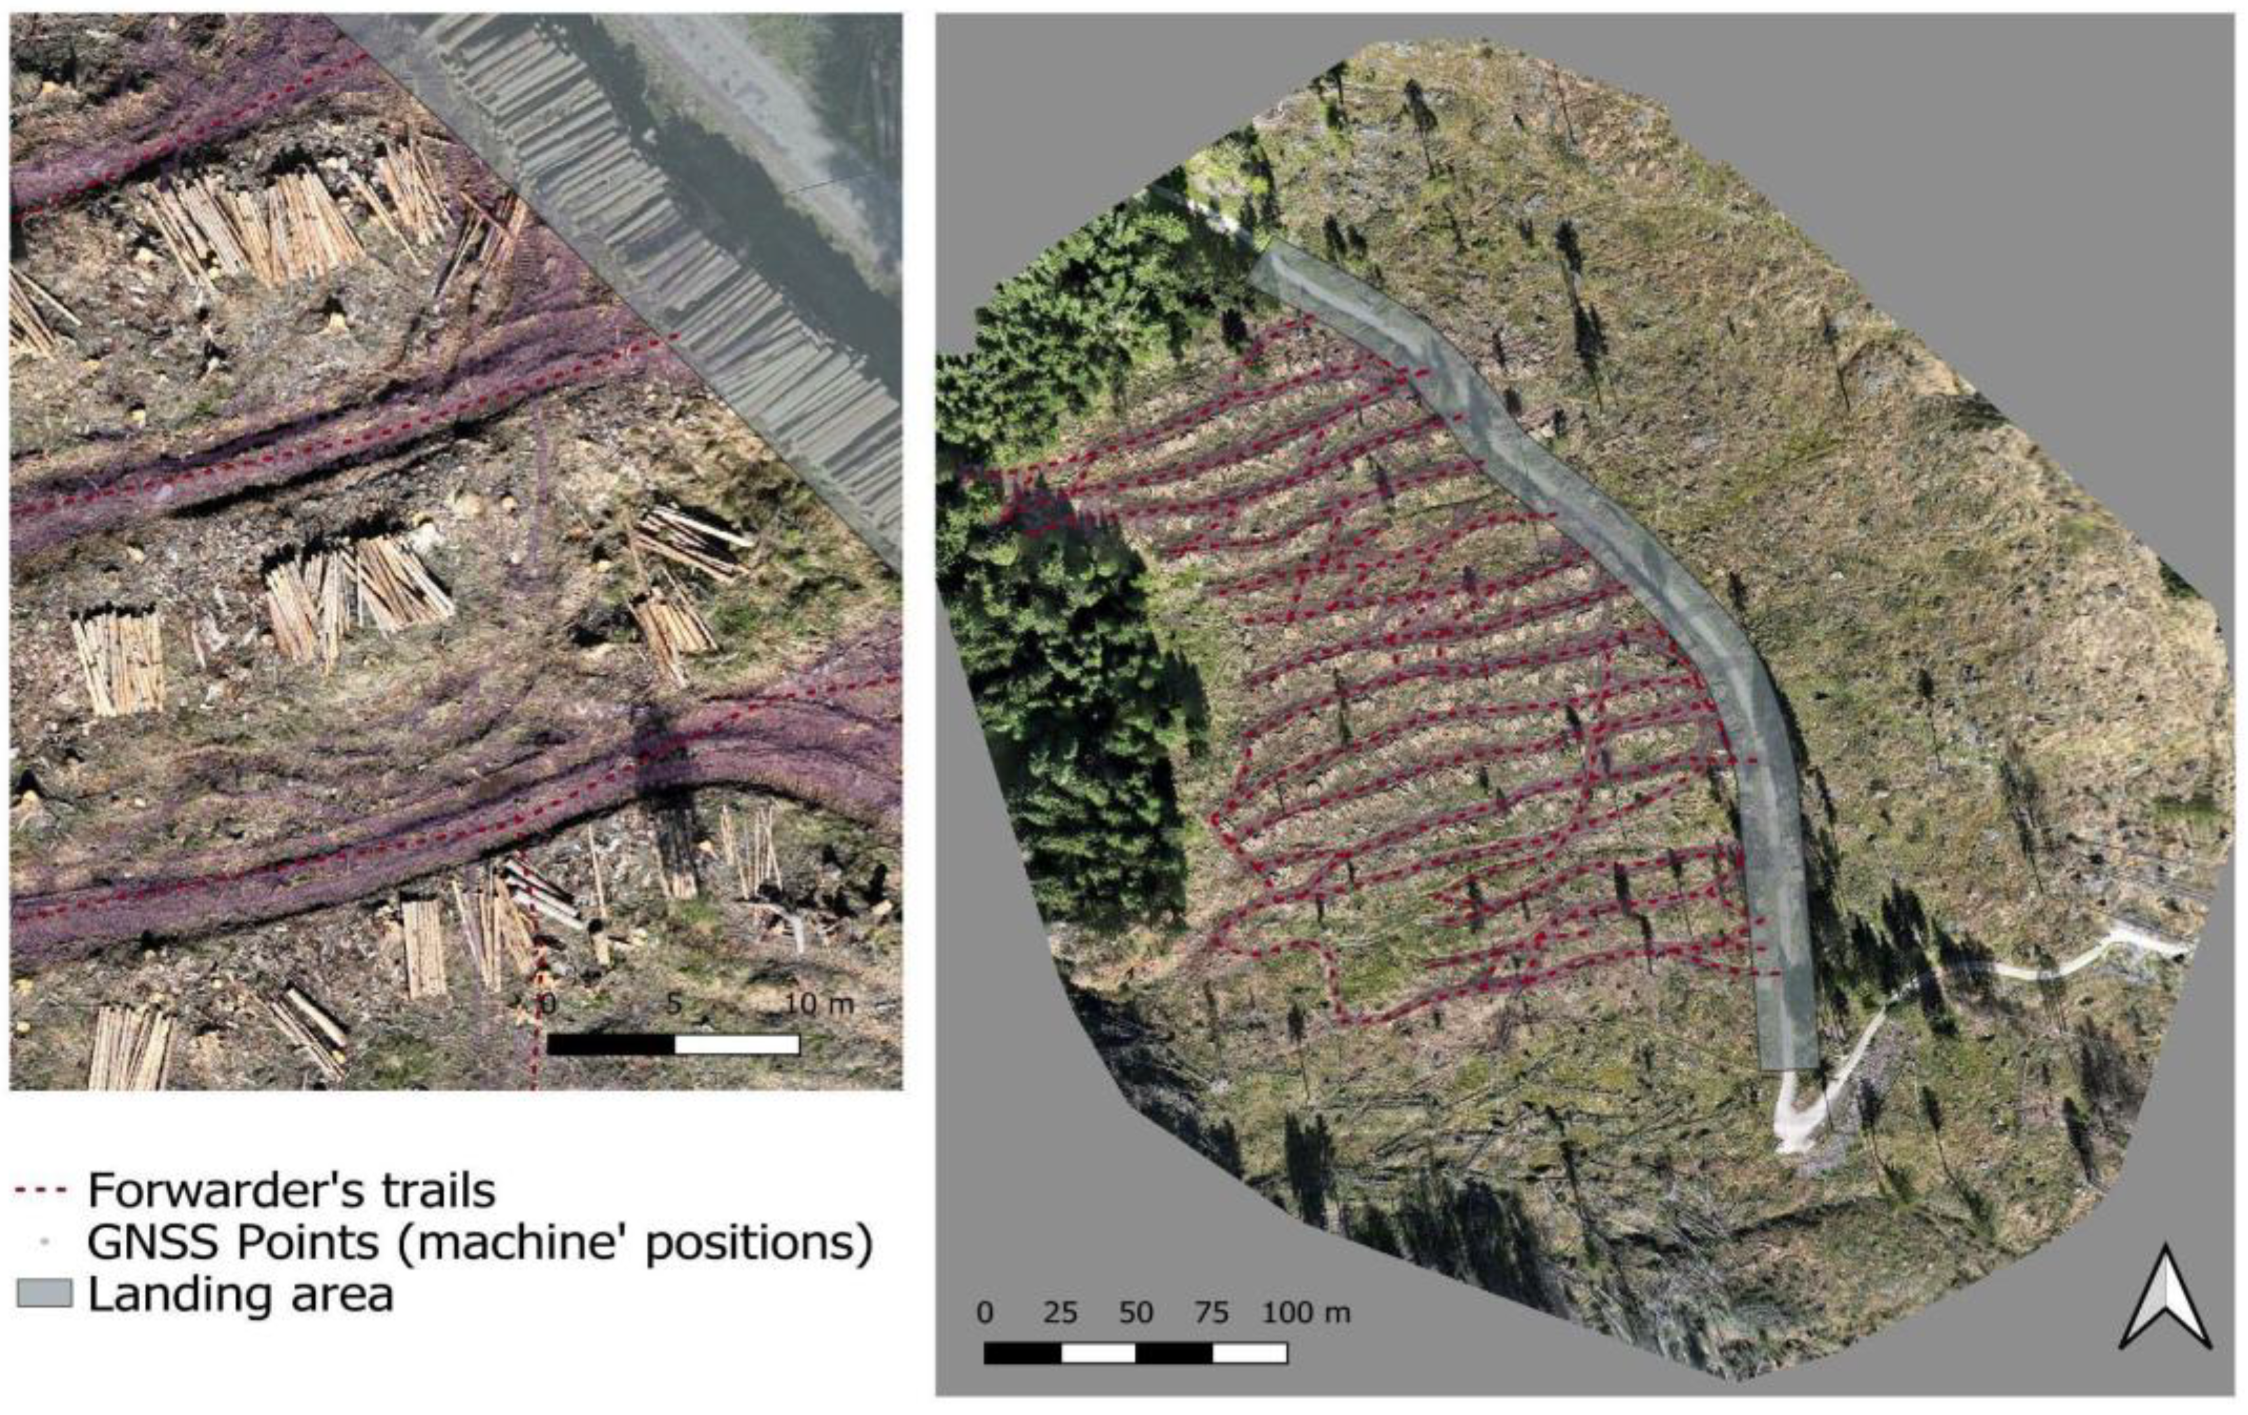
The observational unit established for the statistical analysis was the working cycle. In addition, using QGIS 3.18.0 Zurich [
46] software, the landing area was delimited by a 20 m buffer area from the center of the road in order to cover all the piles of material extracted (
Figure 3).
Thus, adapting the R [
47] code developed by ref. [
48], it was possible to automatically identify the different working elements within 195 out of 223 registered cycles (
Table 4). The work elements classification was performed based on similar studies classifications and well-accepted [
15,
16,
26,
38]. Moreover, the implementation of this AWED methodology enables the elimination of all non-productive periods (PMH
0), which might have occurred, and allows an accurate estimation of time usage and fuel consumed.
Due to forwarding only one assortment type per cycle, changing skid trails to complete loads, and loading both going uphill and downhill, the Travel Unloaded and Travel Loaded, often described work elements in time studies, was considered in this study as one: machine traveling, in order to avoid possible time or fuel estimation errors. The same was applied to the extraction distance variable, which was studied as distance traveled by cycle instead.
The influence of the assortment was studied on the different working cycles and working elements, time and fuel consumption, as well as on the distance traveled by cycle, the average speed, and the payload per cycle. The different wood assortments were extracted and classified based on the different characteristics of the destination industry demands, and their characteristics are as shown in
Table 5.
Furthermore, consulting the meteorological data of the study area, for the effective workdays recorded, it was possible to establish a new variable defined as dry or wet soil. The wet soil condition was considered when the forwarder was operating during rainfall exceeding 2 mm/h and on the day following a rain event with more than 10 mm in total. The identification of work cycles under wet conditions was confirmed through direct field observations, while rainfall data with a 30-min interval were obtained from the Paneveggio weather station, located 500 m east of the worksite. The influence of this new variable was also studied over the same parameters as in the case of the assortment.
Finally, the average slope percentage per cycle was calculated (23.67%), as the result of the slope value of the 5-square-meter-cell Digital Terrestrial Model (DTM) intersected with the machine positions registered for each cycle. From all the working cycles considered in this study, those with an average slope value equal to or higher than 27% were isolated, and within this subset, the effect of the synchronized winch use was studied over the same parameters as in the case of the assortment and the dry/wet soil variables.
Ultimately, productivity and fuel efficiency models were calculated based on the higher significant variables registered influencing the overall productivity (m3/PMH0) and fuel efficiency (L/m3 ∗ 100 m).
2.4. Statistical Analysis
The statistical analysis was carried out using the free software R (Version 4.1.2) [
47], interfaced with RStudio (version 2021.09.0) (RStudio, PBC, Boston, MA, USA). In the case of the assortment type and other variables (moisture of the soil and use of the synchronized winch), the normal distribution of the residuals was tested using the Shapiro–Wilk normality test. Since the normality distribution hypothesis was rejected in all cases, to perform the comparison between the different groups within the different variables, the Kruskal–Wallis test for non-parametric data was applied. When the test showed significant differences, a Dunn’s test was used to pinpoint which specific means were significant from the others.
Delay-free productivity and fuel efficiency models were performed, and ANCOVA (Analysis Of Covariance) was conducted to evaluate how categorical factors (assortment, soil moisture, and cable use) affect productivity and fuel efficiency while controlling for the effect of continuous variables (average log volume, slope, traveled distance per cycle, and payload). Average log volume in productivity studies is a fundamental predictor; however, the relationship between this predictor and productivity may be complex and often non-linear. This is known as the “piece-size law” [
49,
50], and power transformation of the parameter is well-accepted in order to deal with the nonlinearity. Implementing the “Box-Cox” function from the RStudio “MASS” package, the most suitable power value will be estimated and applied to the variable before developing the corresponding models. An F test was conducted to examine the goodness of fit of the models and to test the co-significance of the independent variables, which were also tested using a
t test with a significant threshold settled at a 95% interval of confidence. Once the proper models have been established, sensitivity analysis will be included in order to highlight the effects found.
To cover the possible nested effect that the assortment variable may have over the productivity and the fuel efficiency predictive models, mixed-effect models formulation will consider this variable as a “dummy” or random-effect variable in order to capture the possible group-level variation within the assortment. This analysis will be performed using the Rstudio “lme4” package.
3. Results
A total of 5337 min, or approximately 89 PMH0, were recorded during the 195 considered cycles, on average 27.4 min per cycle, with the machine consuming a total of 962 L of fuel, 4.9 L on average per cycle, and extracting a total volume of woody material of 2290 m3. The average machine traveling time was 11.5 min per cycle with an average fuel consumption of 2.4 L of fuel; meanwhile, the average machine loading time was 7.9 min per cycle with an average fuel consumption of 1.4 L per cycle, and the average unloading time was 5 min per cycle with an average fuel consumption of 0.9 L per cycle. The average overall productivity registered was 11.7 m3 per cycle or 31.6 m3 per PMH0, with an overall fuel efficiency of 0.5 L per m3 and cycle and 0.2 L per m3 and 100 m traveled. Furthermore, the average distance traveled per cycle was 241.3 m, with an average traveling speed of 0.15 m per second.
3.1. Assortment and Other Variables Influence
Within the 195 cycles recorded and the 4 assortments extracted, 111 cycles were identified as standard sawlogs, 41 cycles as biomass, 22 cycles as small sawlogs, and 21 cycles as short sawlogs.
Table 6 compiles some basic descriptive statistics regarding the variables recorded specific to each assortment.
Regarding the influence (significance at a 95% interval of confidence) of the assortment type over the variables measured, the following results were obtained (
Table 7). For those variables in which a significant difference was observed either at a 95% or 90% interval of confidence (time loading, time unloading, fuel loading, fuel unloading, speed, payload, and average log volume), a Dunn test using Bonferroni adjustment was performed, aiming to identify which assortments register the most significant difference on each variable.
By analyzing the assortment type over the time consumed loading per cycle, significant differences were found between small and standard sawlogs vs. short sawlogs type of assortment, with adjusted p-values of 0.009 and 0.032, respectively. In the case of the time consumed unloading per cycle, the only significant difference was observed between biomass and small sawlogs vs. short sawlog assortments, with a corresponding adjusted p-value of 0.053, although an adjusted p-value of 0.057 was observed between small vs. short sawlogs unloading times comparison.
In the case of the fuel consumption comparison among assortments, when analyzing the fuel consumption while loading per cycle, significant differences were found between small vs. short sawlogs with an adjusted p-value of 0.028, and no significant differences among assortments were observed when analyzing the fuel consumption per cycle while unloading.
In the case of the total distance traveled by cycle analysis, no significant differences were observed between the different assortments, with the only mentionable difference being the biomass vs. standard sawlogs analysis, which reported an adjusted p-value of 0.065. Two comparisons, biomass and short sawlogs vs. standard sawlogs, were the only ones registering significant differences, with adjusted p-values of 0.009 and 0.03, respectively, when performing the comparative analysis of the speed variable. Finally, when performing the payload and average log volume analysis, very strong significant differences were found between the standard sawlogs vs. the rest of the assortments with adjusted p-values less than 0.001 in the case of the payload; moreover, it was also found that there were very strong significant differences between biomass vs. small sawlog assortments with an adjusted p-value less than 0.001. Significant differences were found among all assortment levels in the case of the average log volume, except for the biomass vs. small sawlogs and standard vs. short sawlogs.
Additionally, visual representations were performed (
Figure 4) of the distribution of the productivity (m
3/PMH
0) and fuel efficiency (L/m
3 ∗ 100 m) among the different assortments’ levels.
When analyzing the wet/dry soil influence, it was possible to differentiate from the total 195 cycles, 54 as performed on wet soil and 141 as performed on dry soil. Its influence was studied over the same variables used above (except for the time and fuel consumption during the loading and unloading working phases). The results obtained were as shown in
Table 8, where it can be observed that all variables studied are significantly influenced by the moisture of the soil except for the payload.
Finally, the effect of the synchronized winch use was studied by analyzing the average slope when the winch was used (34.36%) and establishing a lower slope filter of 27% on all cycles performed. Aiming in this way to achieve a more accurate comparison between the cycles when the winch was used and the cycles when it was not. This resulted in a total of 48 cycles, of which 17 corresponded to the ones where the winch was used and 31 to those cycles where it was not. As seen in
Table 9, no significant differences were found except for the influence over the payload, which was always higher when the winch was used.
3.2. Productivity and Fuel Efficiency Analysis
Regarding the productivity and the fuel efficiency modeling, the independent variables considered while fitting the models and performing the ANCOVA test were as shown in
Table 10. In order to test the “piece-size law”, power transformation was applied to the average log volume, obtaining an optimal power of e = 0.71. When fitting the productivity model, the transformed average log volume returns similar R
2 and adjusted R
2 values (0.64 and 0.63, respectively) to the non-transformed average log volume (0.64 and 0.63, respectively); thus, in this case, the power transformation of the average log volume does not imply a significantly better fitting of the productivity model.
A linear productivity model was formulated (
Table 11) considering only the significant independent variables in order to avoid overfitting of the model. The resulting R
2 was 0.64, and the adjusted R
2 was 0.63. Additionally, the RSE (Residual Standard Error) was 10 on 189 degrees of freedom, and the AIC (Akaike’s Information Criterion) returned a value of 1460.5.
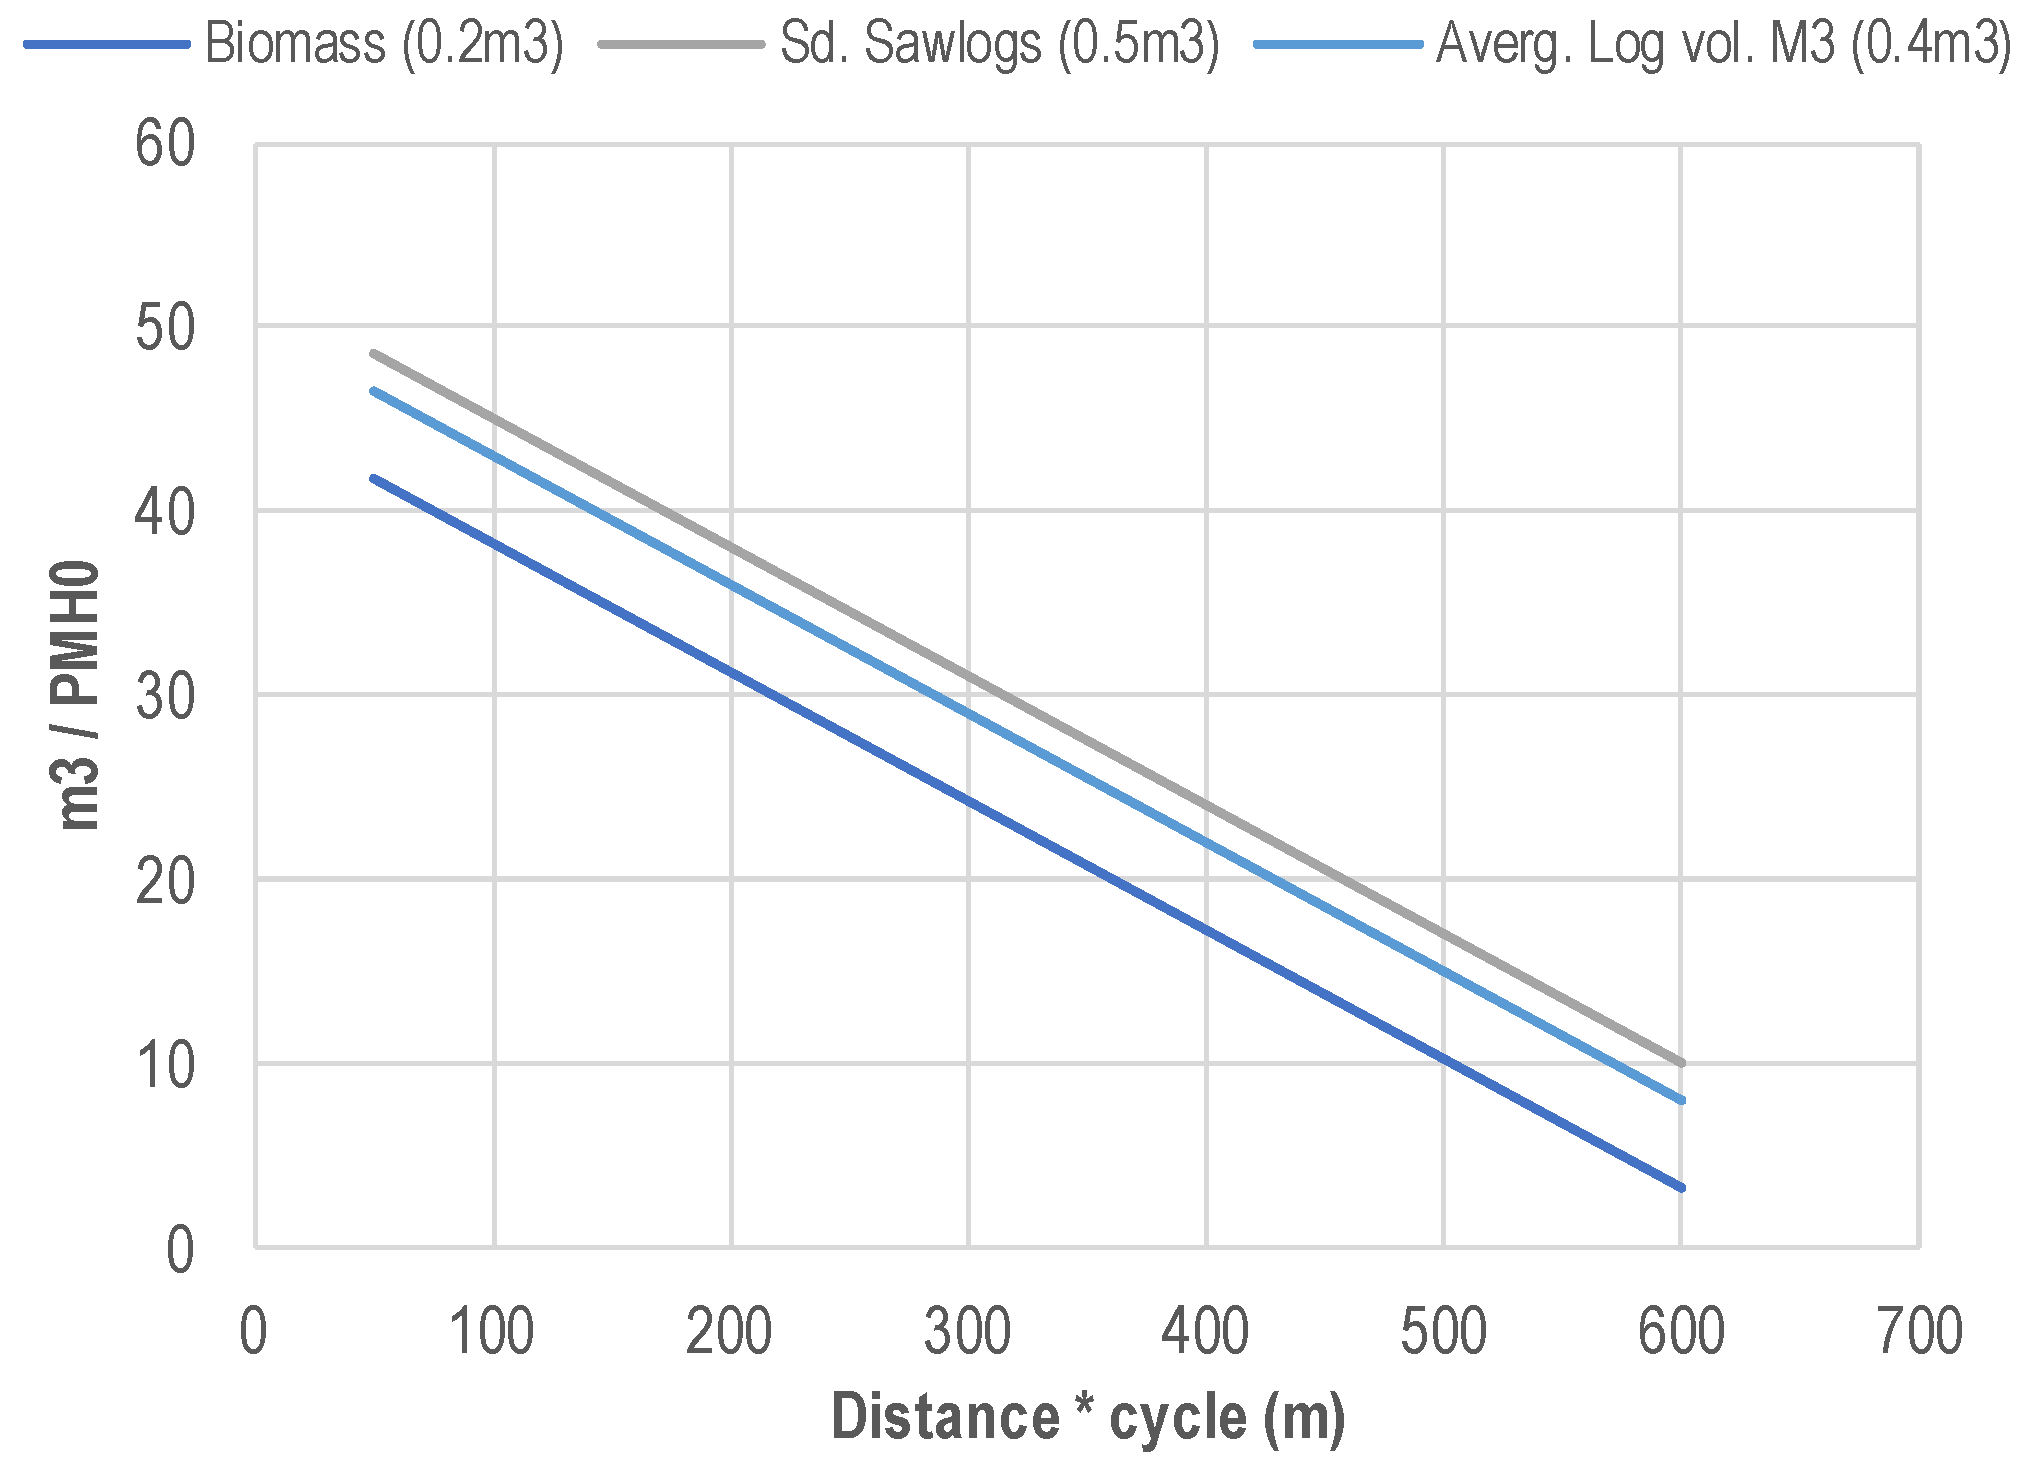
Performing a sensitivity analysis on the productivity linear model, maintaining the mean values of all independent variables, except for the average log volume, which value was replaced with the net average log volume (0.4 m
3), the average biomass log volume (0.2 m
3), and the average standard log volume (0.5 m
3), it can be observed how this last variable responds accurately to the observed productivity (
Figure 5). With the developed model, it was also possible to analyze the influence of the average log volume over the rest of the variables considered over productivity (
Figure 6).
In the case of the linear fuel efficiency model (
Table 12), the same independent variables as in the linear productivity model (
Table 10) were tested to fit the model. In this case, power transformation of the average log volume was unnecessary, firstly because when fitting the model, this variable has no significant influence over the predicted one, and secondly due to even using the power-transformed variable, the R
2 and the adjusted R
2 of the model did not improve. In fact, the significant independent variables found for the fuel efficiency model prediction were the traveled distance, the use of the synchronized cable, the assortment (when extracting short sawlogs), and the payload.
The obtained R2 and adjusted R2 after fitting the fuel efficiency model were 0.7 and 0.69, respectively, and the RSE (Residual Standard Error) was 0.07 on 188 degrees of freedom. The AIC (Akaike’s Information Criterion) returned a value of −448.7.
In order to test the possible nested effect of the assortment variable, productivity and fuel efficiency linear mixed-effects models were formulated considering the assortment variable as a “dummy” or random-effect variable. In the case of the productivity linear mixed-effect model, the use of the power transformation of the average log volume slightly increases (approx. 1%–2%) the fitting of the model compared with the use of the non-transformed average log volume. Additional metrics assessing the performance of the model were calculated (
Table 13 and
Table 14).
Finally, regarding the fuel efficiency mixed-effect model (
Table 15 and
Table 16), it can be observed how there are no significant differences concerning the fitting of the model compared with the linear fuel efficiency model. When comparing the AIC of both linear and mixed-effect models of fuel efficiency, it can be observed how in the case of the mixed-effect fuel model, the AIC is lower than in the case of the linear model (−400.6 and −448.7).
4. Discussion
Considering all the cycles analyzed in this study (without considering the assortment type extracted), it can be observed that the average time recorded per cycle was 27.4 min, with an average fuel consumption of 4.9 L per cycle. The average traveled distance per cycle was 241.3 m, and the average volume extracted per cycle was 11.7 m
3. This result leads to an overall productivity of the extraction operation of 31.6 m
3 per PMH0, with an average fuel efficiency of 0.5 L per m
3 and per cycle or 0.2 L per m
3 and per 100 m. These results, considering the site and machine-specific characteristics, are in line with those reflected in other studies [
15,
36,
51], being slightly different from ref. [
26], which reported 18.9 m
3 per PMH0 for the same loading capacity forwarder; nevertheless, this could be a consequence of the operation type carried on (selective cut in comparison with clear-cut salvage logging).
When the analysis focused on the work element level, the main finding shows that the most time- and fuel-demanding work element was machine traveling, with an average of 11.5 min and 2.4 L per cycle, followed by the machine loading work element with an average time and fuel consumption registered of 7.9 min and 1.4 L per cycle. The least time- and fuel-consuming work element was machine unloading, with an average of 5 min and 0.9 L per cycle registered. These results differ from those reported in similar studies where the main time- and fuel-demanding work element was machine loading [
18,
26,
36]. This difference could be a result of the working process carried out by the machine in this study, as ref. [
38] stated, the different work elements time consumption is significantly influenced by the number of assortments in a load, with a lower number of assortments per load incurring a higher time consumption. Since in this study the machine focused on loading only one assortment per cycle, thus having to travel longer distances to complete a full load, the time and fuel consumption during the loading work element was smaller than the time and fuel consumption during the traveling work element.
4.1. Assortment and Other Variables Influence
Regarding the assortment type’s influence over the time consumption per cycle and work element, loading time per cycle showed significant differences between small and standard sawlogs vs. short sawlog types of assortments. This difference could be explained by the characteristics of the short sawlogs themselves, since their diameters were usually above 60 cm, being usually the bottom part of the stems; it took less time completing a load of this assortment type than completing a full loading cycle of the others, due to the reduced loading cycles required in the first case. In the case of the time consumed unloading per cycle, the only significant differences were observed between biomass and small sawlogs vs. short sawlog assortments. This difference could be explained, as in the previous case, by the reduced crane cycles required while unloading a biomass or a small sawlogs load in comparison with unloading a short sawlogs load, higher in the last case.
In the case of the fuel consumption comparison among assortments, when analyzing the fuel consumption while loading per cycle, significant differences were found between small vs. short sawlogs, and no significant differences among assortments were observed when analyzing the fuel consumption per cycle while unloading or traveling work elements. The fuel consumption difference found while loading is a direct consequence of the higher crane cycles required to complete a load in the case of the short sawlogs compared to the other assortments (higher crane cycles per load incur higher time and thus higher fuel consumption). However, the fuel consumption difference was only significant between short vs. small sawlogs and not as in the time consumption while loading comparison, in which case there were significant differences between loading short sawlogs and the other assortments.
Regarding the total distance traveled by cycle analysis, no significant differences were observed between the different assortments, with the only mentionable difference being the biomass vs. standard sawlogs analysis. The same comparison (biomass vs. standard sawlogs) and short sawlogs vs. standard sawlogs were the only ones registering a significant difference when performing the comparative analysis of the speed variable. These differences could be a result of the lower density of a full load of biomass or the short sawlogs, when compared with the density of a full load of standard sawlogs, the difference being the highest between these two assortment types. A lower density for the same load volume represents a lower weight of the payload, thus also allowing us to achieve higher speeds while traveling due to the smaller engine power and grip required and the smaller impact exerted on the skid trails.
Finally, when performing the payload analysis, very strong, significant differences were found between the standard sawlogs vs. the rest of the assortments. Moreover, it was also found that there were very strong significant differences, in the case of the payload, between biomass vs. small sawlog assortments with an adjusted p-value less than 0.001. Again, as in the previous case, the reason behind these differences could be explained by the different density of the different assortments.
In the case of the moisture of the soil influence, the results showed that the moisture had a significant influence over all parameters studied except for the payload. In fact, all parameters’ values were higher when the soil was dry, except in the case of the payload. This could be explained by the individual choice of the operator that, in the case of wet soil and to avoid greater impact on the soil, he prioritized collecting the material closest to the landing point. However, this result contrasts with the guidelines provided in [
13] for forest soil protection, which recommend reducing payload loads in the case of wet soils.
Finally, regarding the influence of the use of the synchronized winch, it can be observed how the only significant influence was registered in the case of the payload, this last one being significantly higher when the winch was used. However, non-significant differences were observed also in the case of the time and fuel consumption while loading, these ones also being higher in the case of the cycles where the winch was used. This could be a result of the higher fuel efficiency achieved in the case of the use of the winch. This result is in line with those obtained by ref. [
52]; nevertheless, there are several additional safety aspects that are needed to be considered, such as the maximum allowed tensile force for the winch or the maximum tilt angle of the machine [
53].
Considering the average log volume, it could be observed how significant differences were detected in all levels of comparison, except for the biomass vs. small sawlogs and standard vs. short sawlogs. This could be justified by analyzing the measurements of the different assortments that do not show any significant difference between them, because despite having similar average log volumes, the different assortments have different shapes and measures.
4.2. Productivity and Fuel Efficiency
In the case of the productivity prediction model, the most suitable independent variables found to explain the highest part of the variability were the slope, power-transformed average log volume, traveled distance, payload, and the moisture condition of the soil (when working in wet conditions, productivity drops approx. 4 m
3). This result is in line with other productivity studies carried out [
15,
26,
36]. However, the independent variables that were found to be the best predictors in the case of the fuel efficiency prediction were the traveled distance, payload, the use of the synchronized winch (which increases the fuel efficiency when used by approx. 0.05 L/m
3 and per 100 m), and extracting short sawlogs (when extracting this type of assortment, the fuel efficiency drops by approx.0.07).
The use of the assortment type as a random effect in the case of the mixed-effect models in productivity despite having a slightly better fit in the mixed-effect model, on average, there was no significant difference between considering or not the assortment nested effect. This result may be associated with the low numbers of samples and their combinations; thus, further analysis is needed for a deeper understanding of the assortment effect over productivity models. Nevertheless, the fitting level of the model is more or less in line with those published by other authors [
49,
50].
Considering the use of the assortment variable as a dummy, it does improve slightly the overall fitting of the fuel efficiency model (lower AIC in the mixed-effect model than in the linear model), also achieving R2 values over 65% in all cases.


