
Response of Larix sibirica Radial Growth to Climate Change in Kanas, Northern Xinjiang, China

Abstract
1. Introduction
2. Materials and Methods
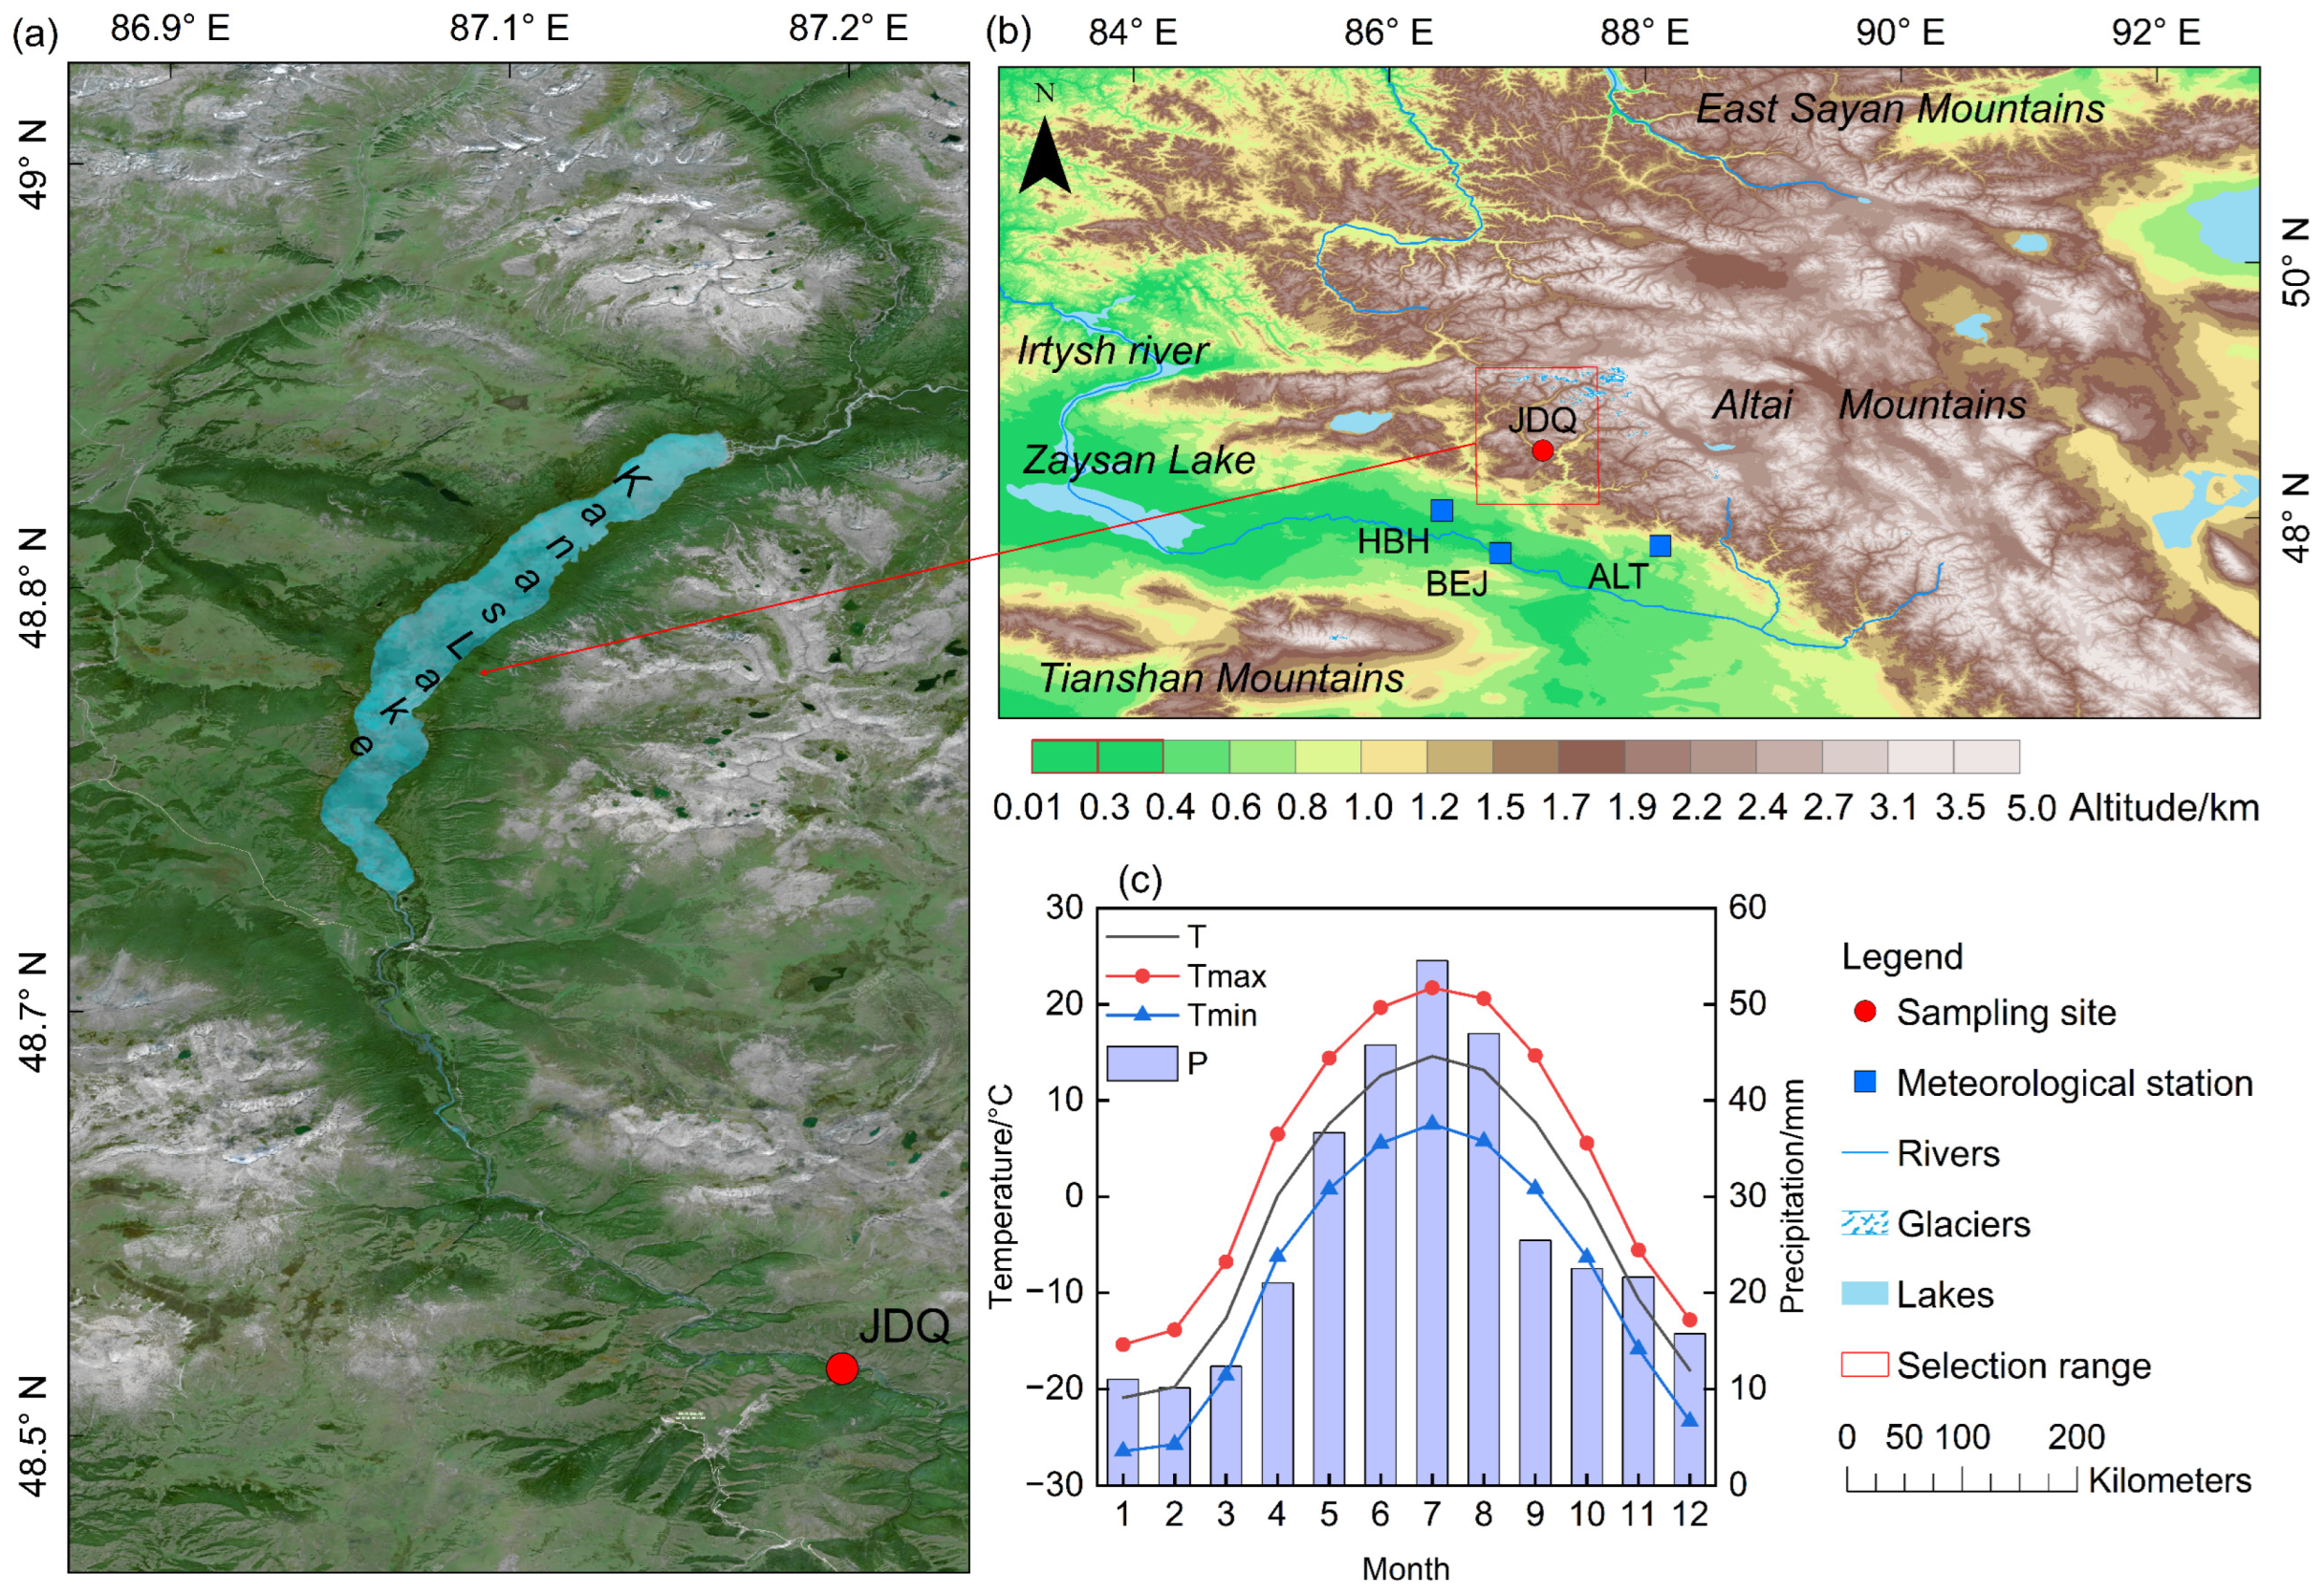
2.1. Research Area Description
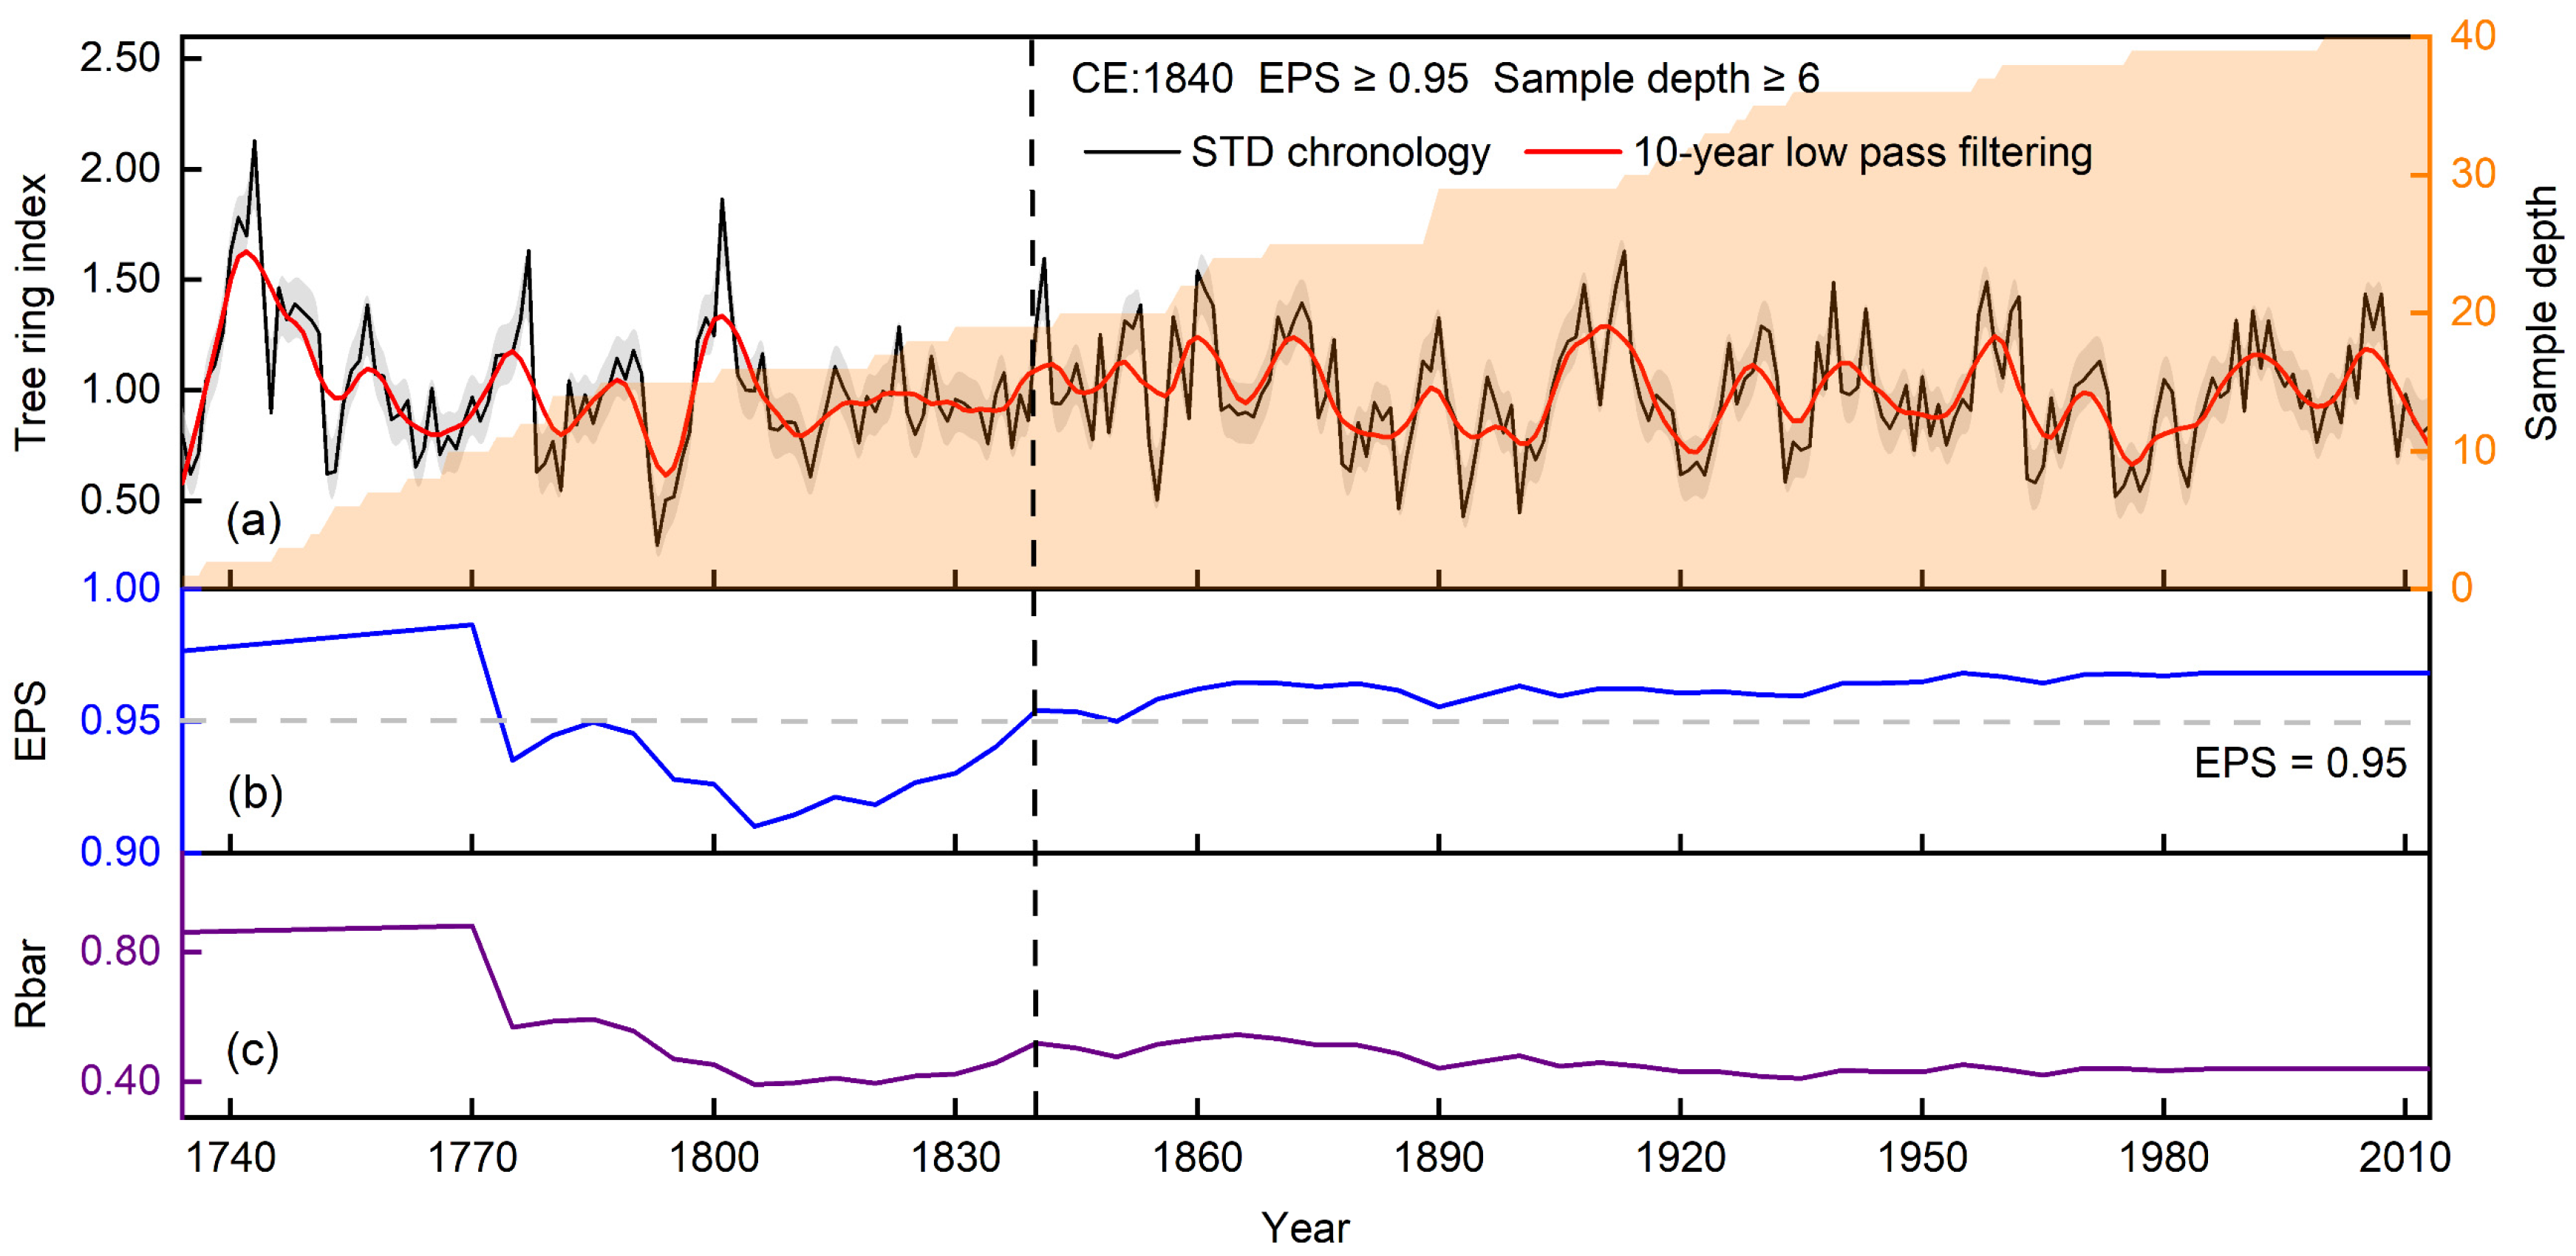
2.2. Tree-Ring Data
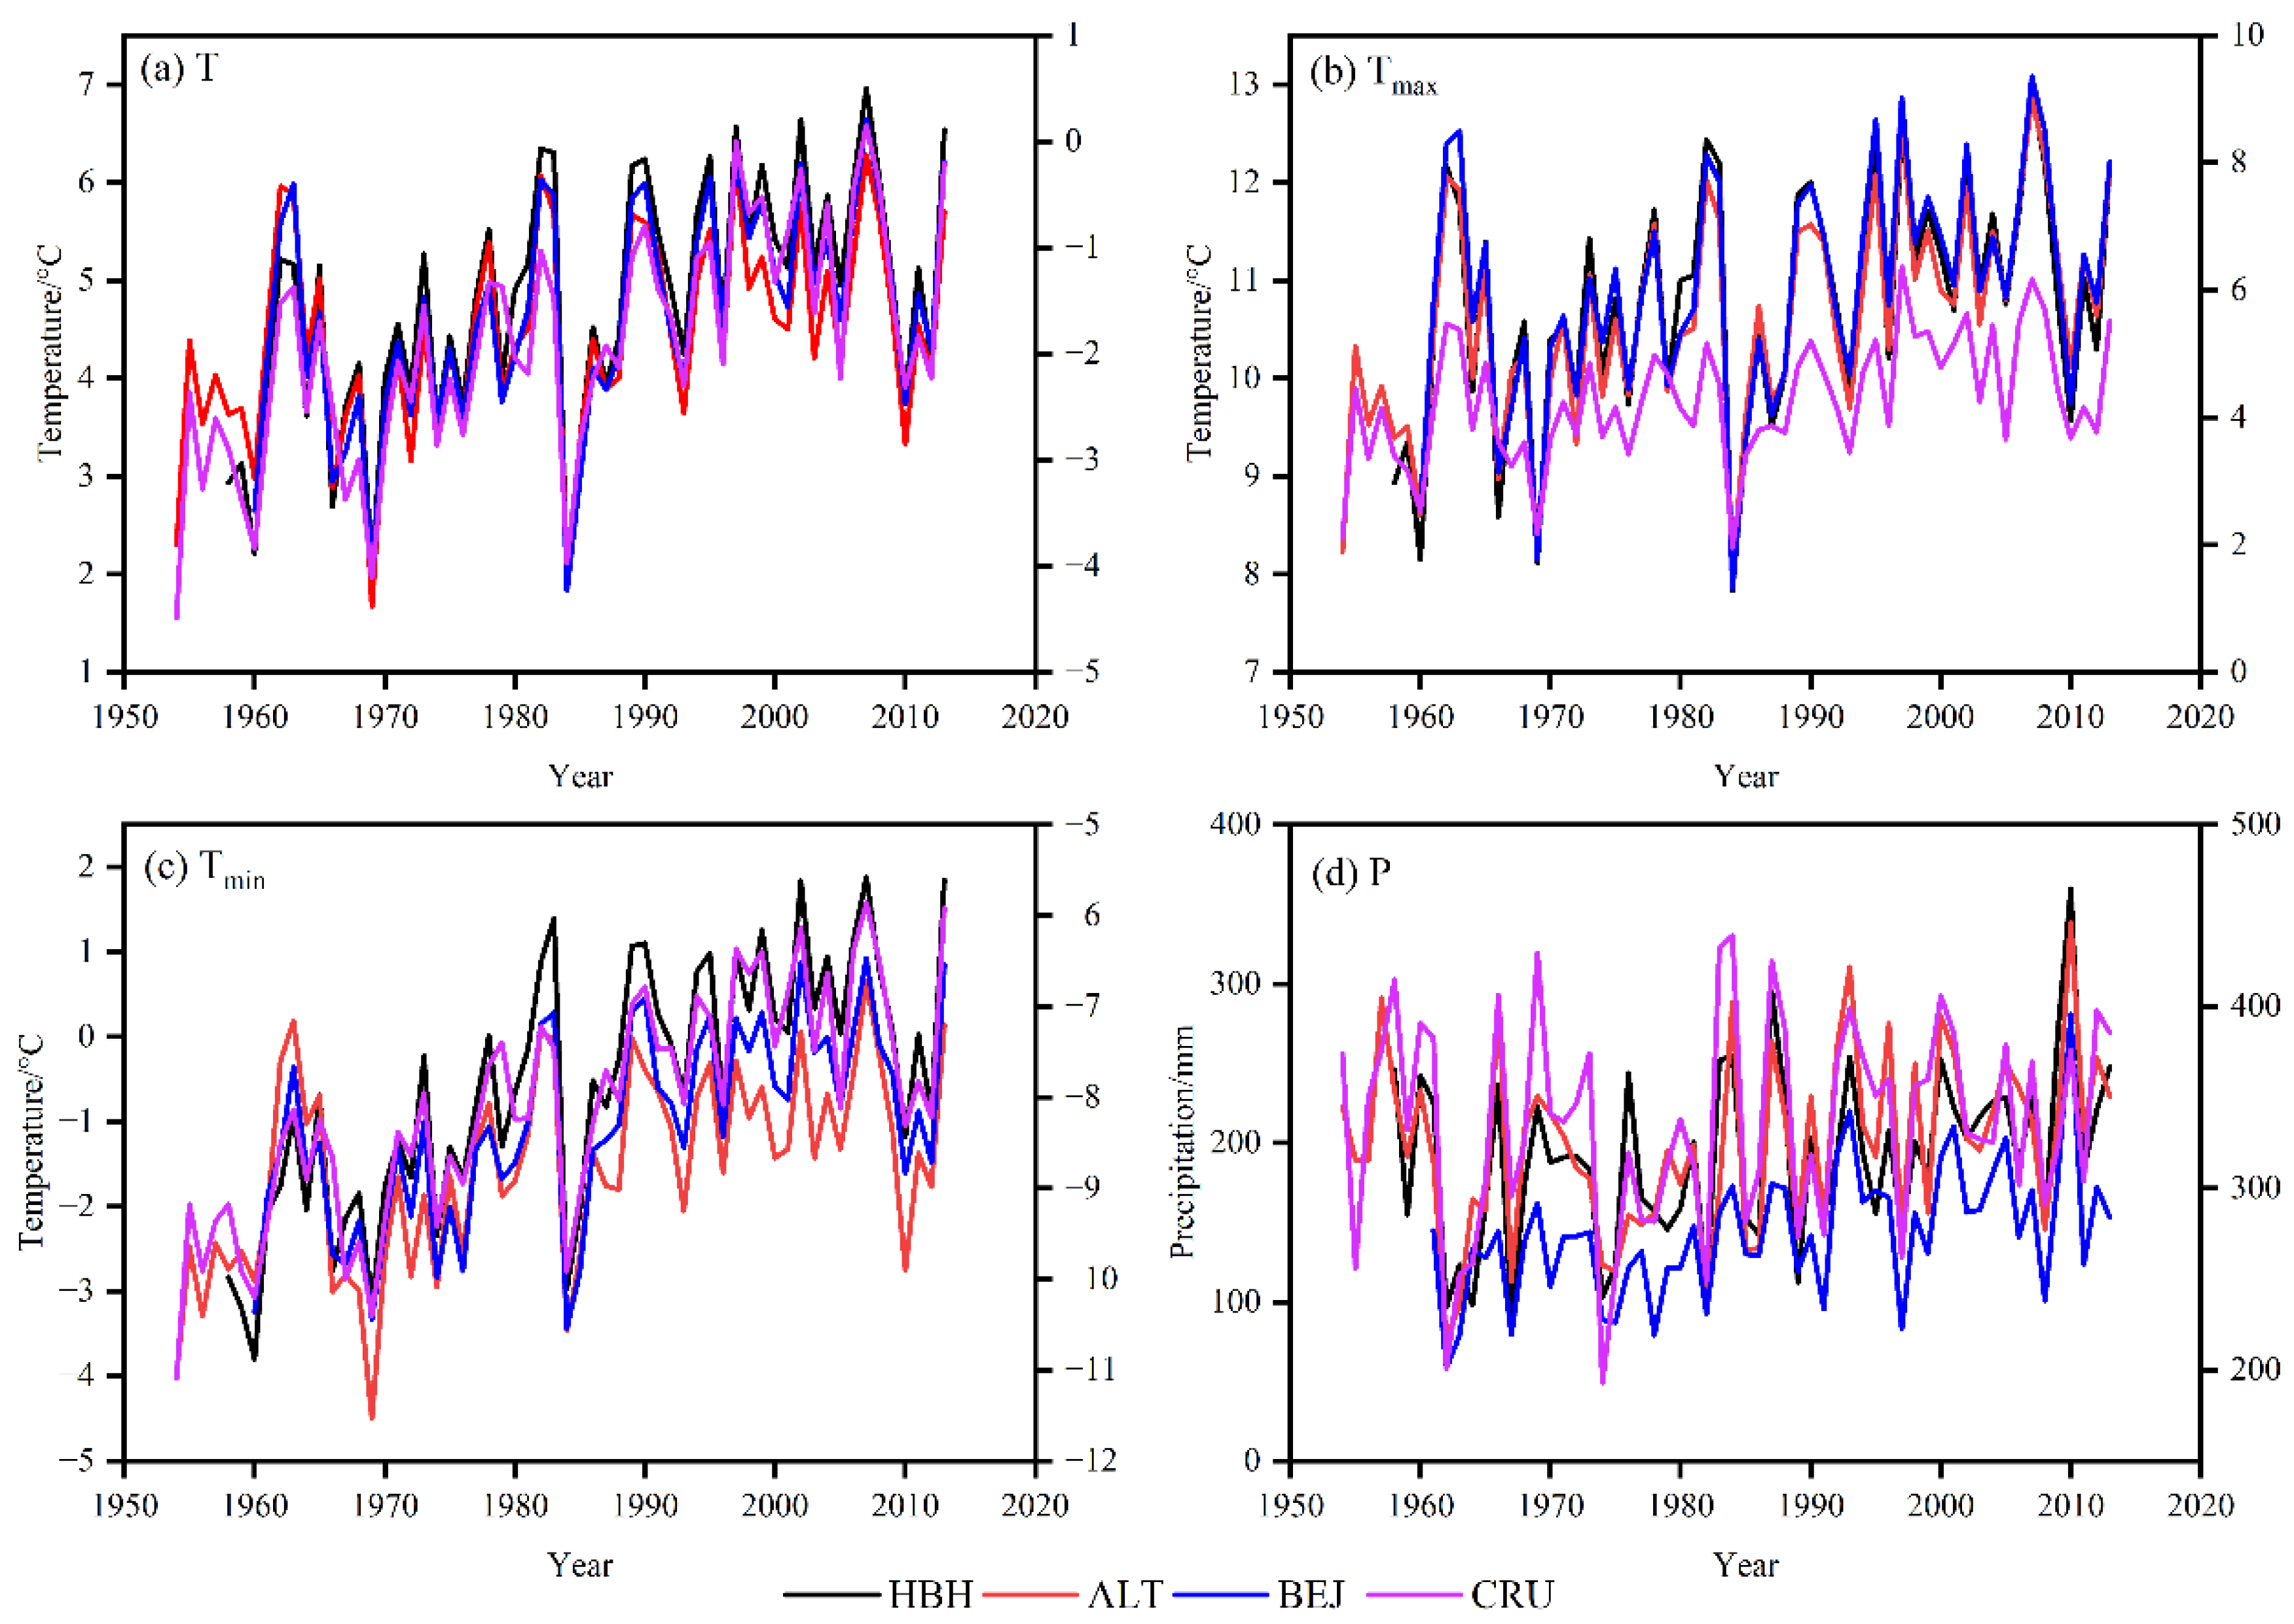
2.3. Data Sources
2.4. Methods
3. Results
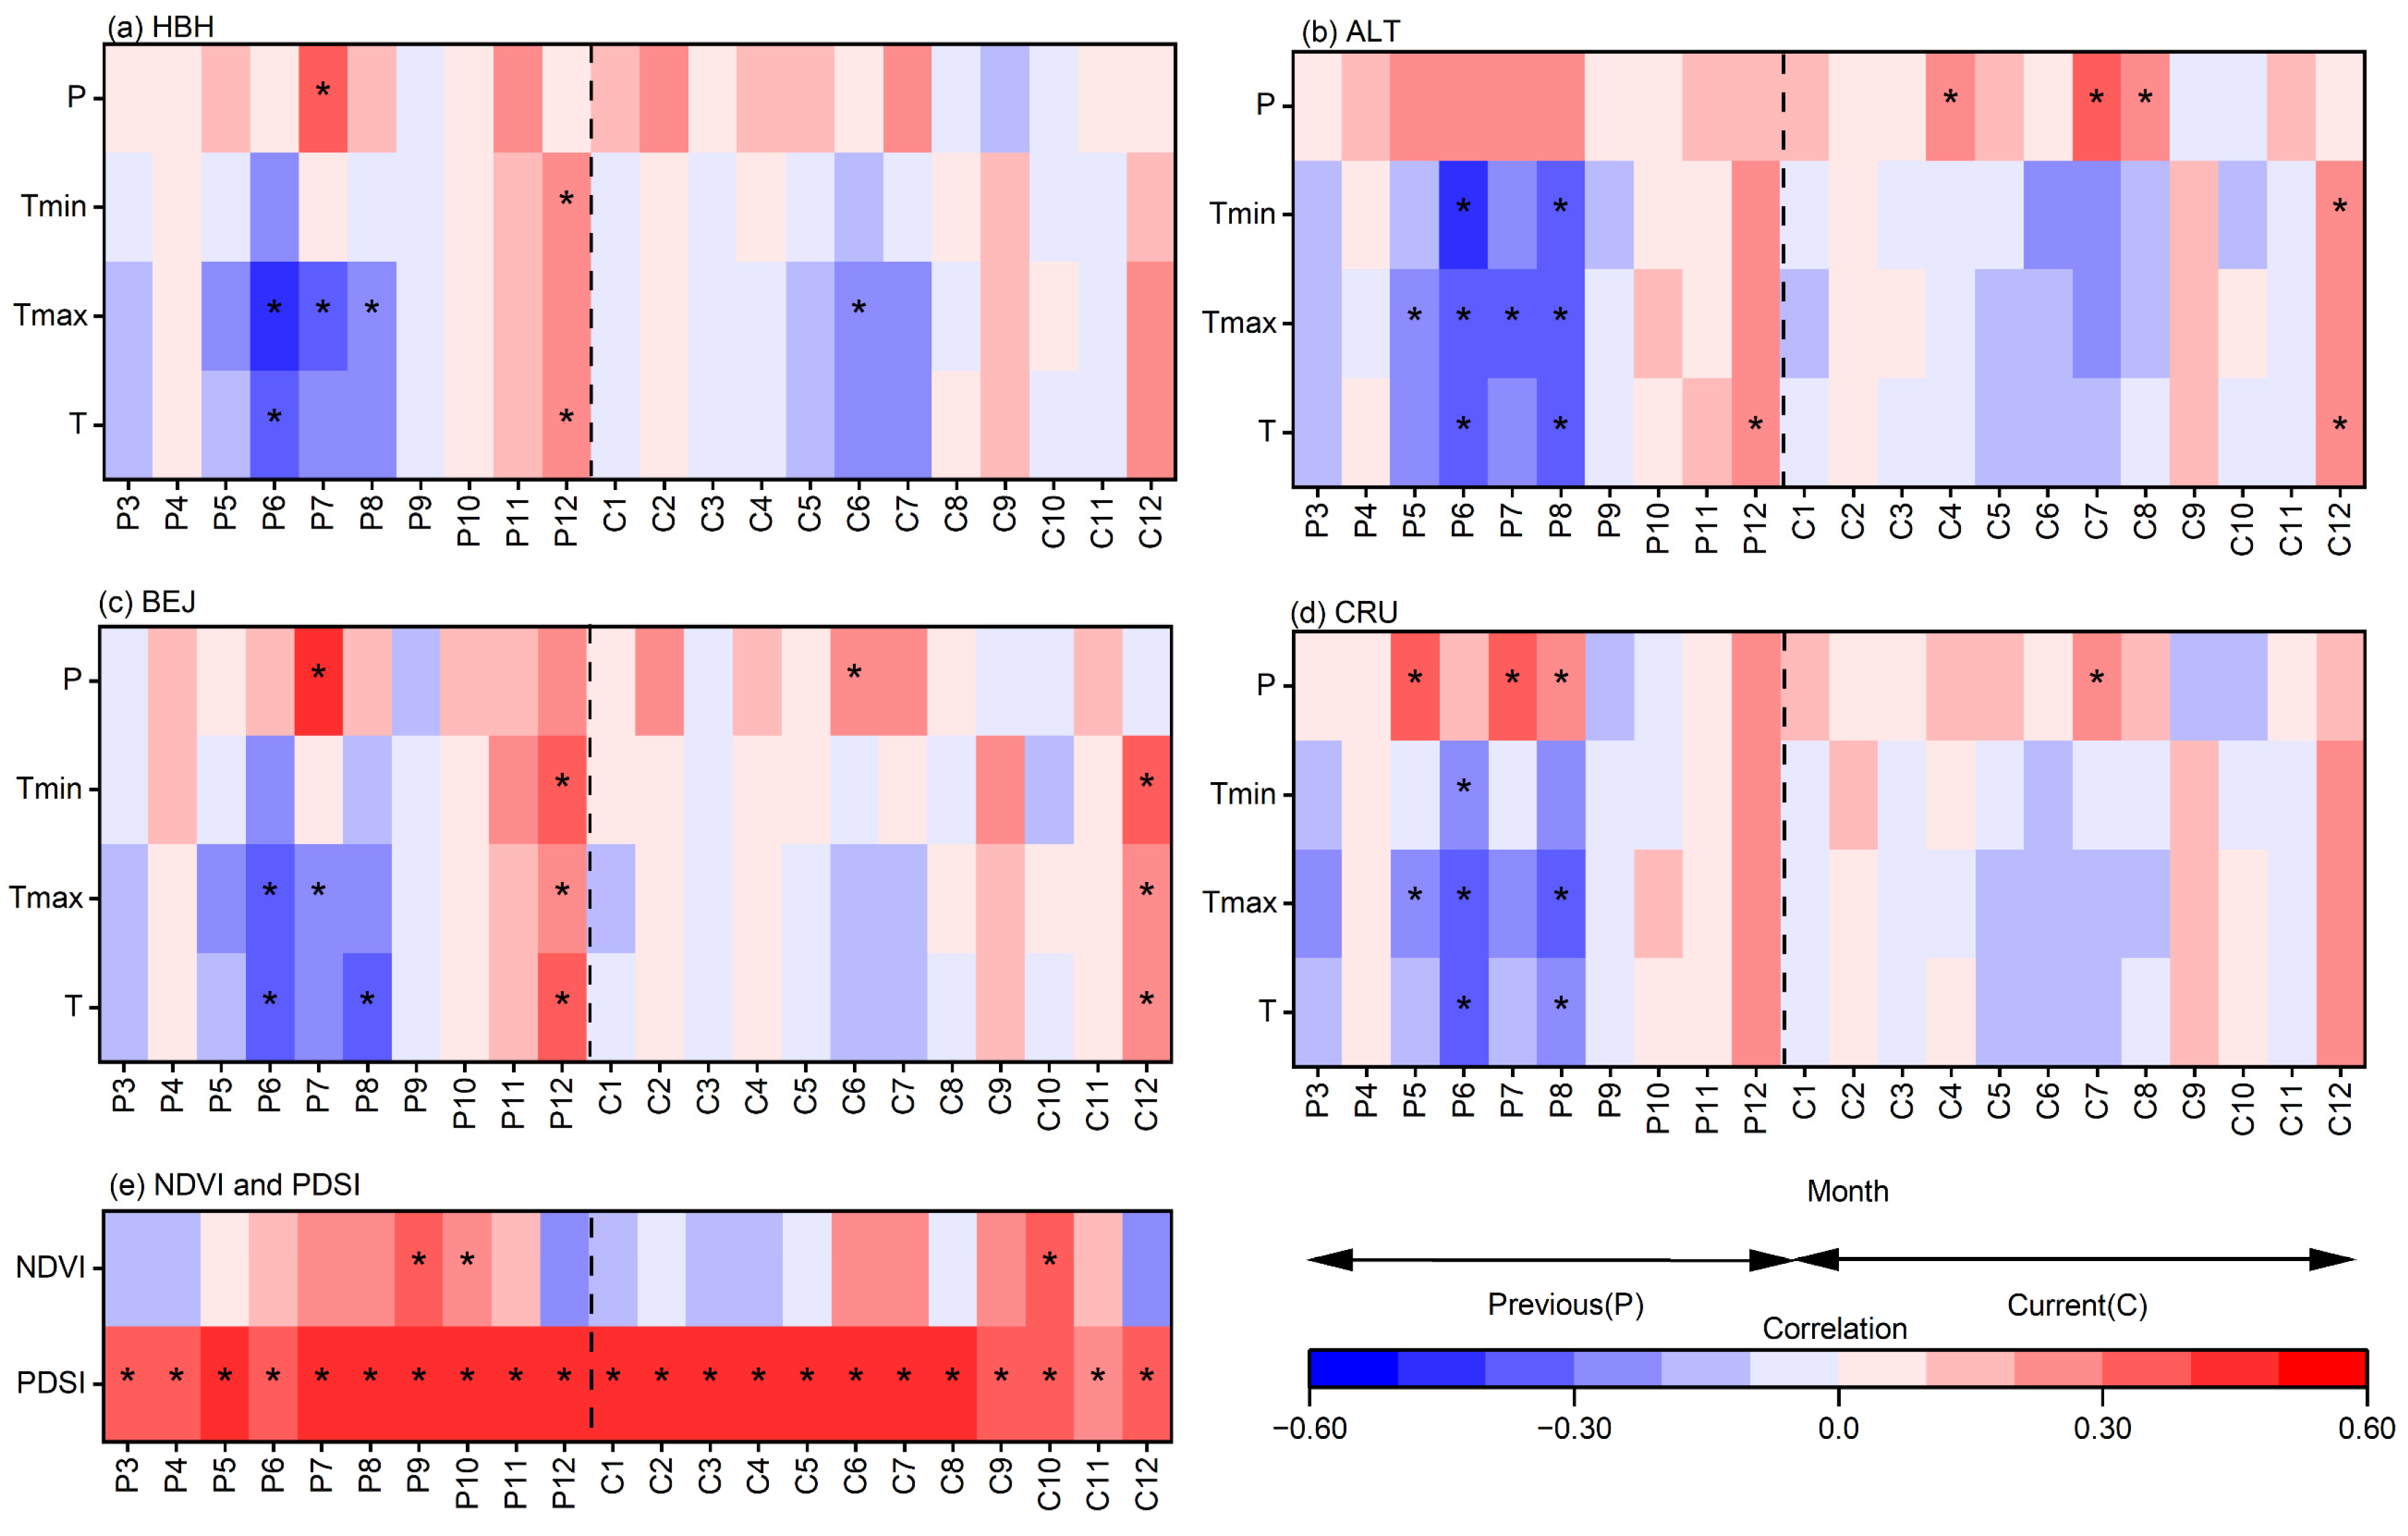
3.1. Response of Tree-Ring Width Index to Climate Factors
3.2. Atmospheric Circulation Driving Mechanisms
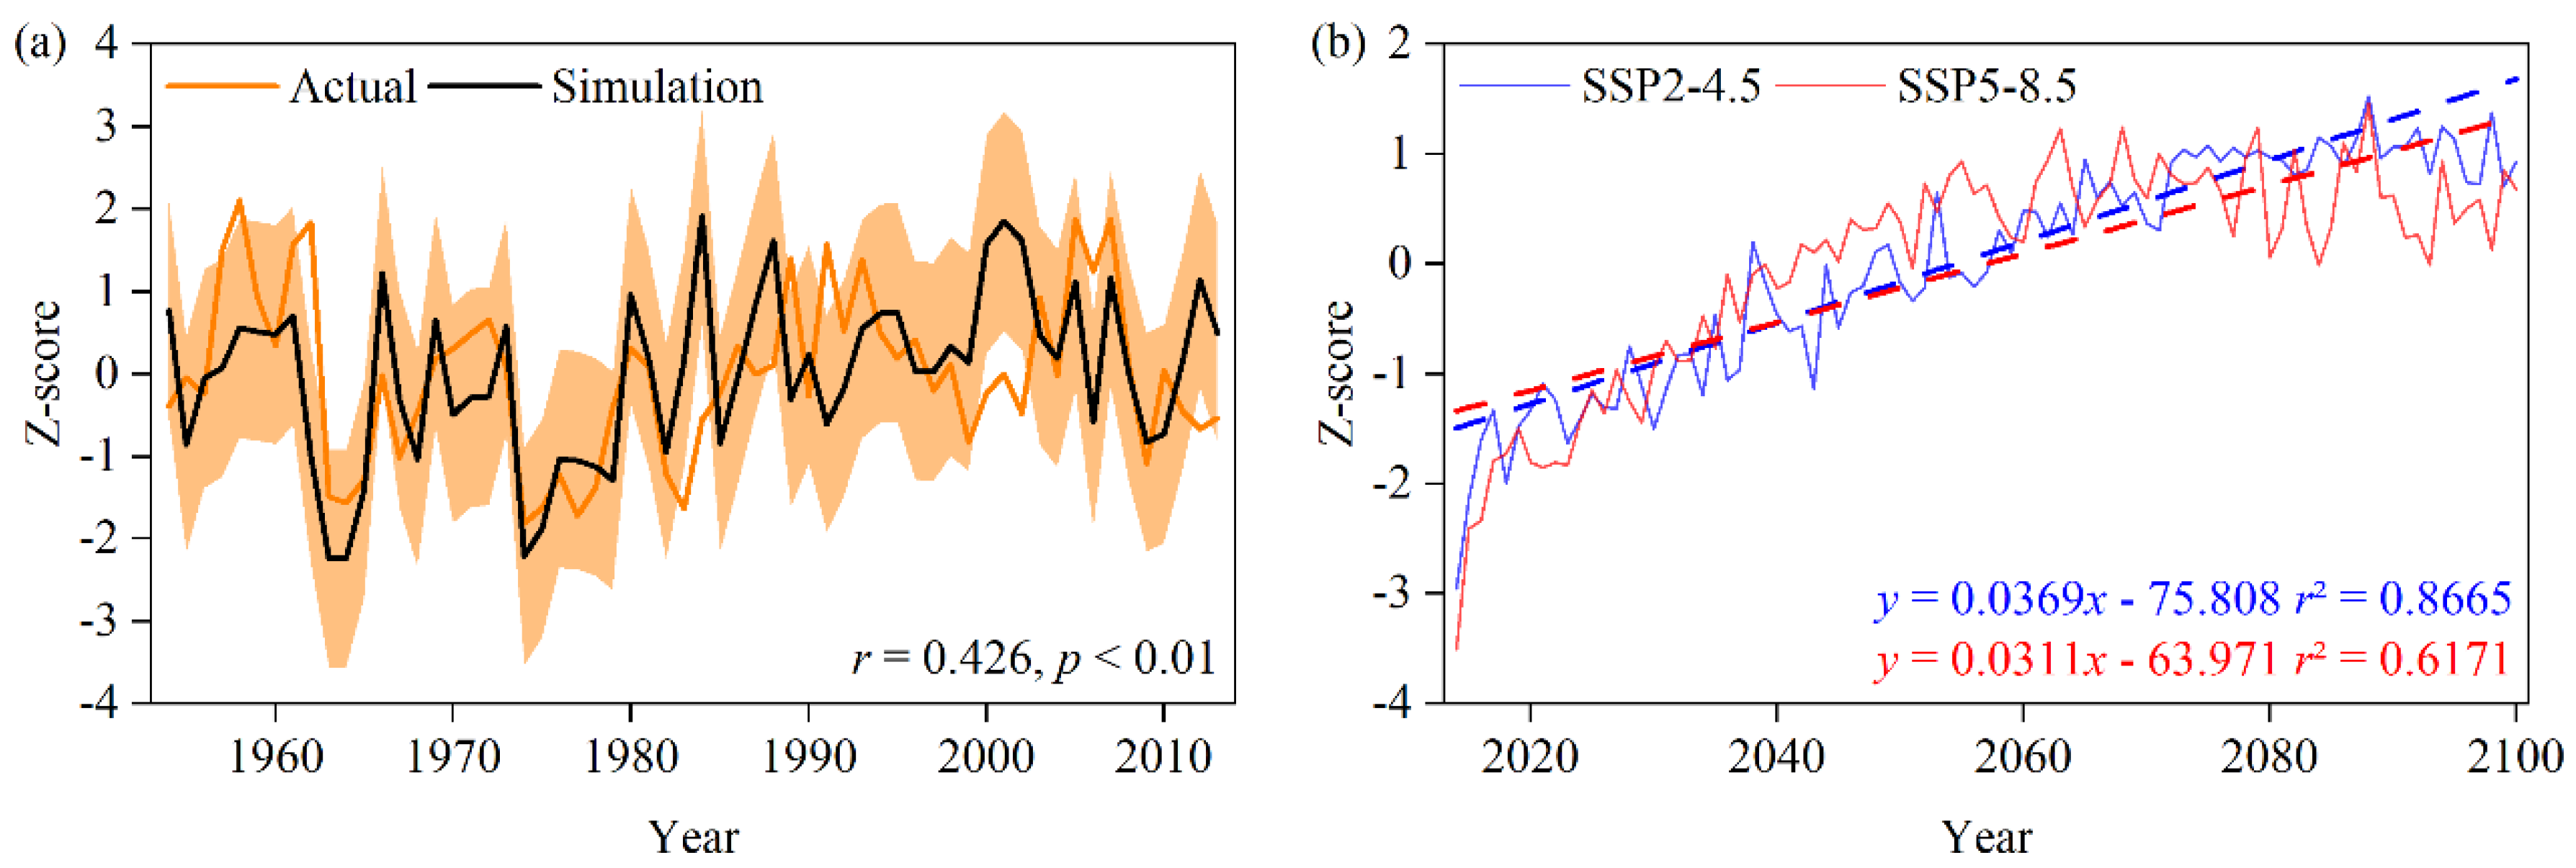
3.3. Future Growth Simulation
4. Discussion
4.1. Climate Impacts on Larix sibirica Growth
4.2. Atmospheric Circulation’s Impact on Tree Growth
4.3. Implications of Future Climate Scenarios for Larix sibirica Growth
5. Conclusions
Author Contributions
Funding
Data Availability Statement
Conflicts of Interest
References
- Tripathy, K.P.; Mukherjee, S.; Mishra, A.K.; Mann, M.E.; Williams, A.P. Climate Change Will Accelerate the High-End Risk of Compound Drought and Heatwave Events. Proc. Natl. Acad. Sci. USA 2023, 120, e2219825120. [Google Scholar] [CrossRef] [PubMed]
- Fernández-Martínez, M.; Vicca, S.; Janssens, I.A.; Sardans, J.; Luyssaert, S.; Campioli, M.; Chapin Iii, F.S.; Ciais, P.; Malhi, Y.; Obersteiner, M.; et al. Nutrient Availability as the Key Regulator of Global Forest Carbon Balance. Nat. Clim. Chang. 2014, 4, 471–476. [Google Scholar] [CrossRef]
- Weiskopf, S.R.; Rubenstein, M.A.; Crozier, L.G.; Gaichas, S.; Griffis, R.; Halofsky, J.E.; Hyde, K.J.W.; Morelli, T.L.; Morisette, J.T.; Muñoz, R.C.; et al. Climate Change Effects on Biodiversity, Ecosystems, Ecosystem Services, and Natural Resource Management in the United States. Sci. Total Environ. 2020, 733, 137782. [Google Scholar] [CrossRef] [PubMed]
- Aber, J.; Neilson, R.P.; McNulty, S.; Lenihan, J.M.; Bachelet, D.; Drapek, R.J. Forest Processes and Global Environmental Change: Predicting the Effects of Individual and Multiple Stressors. BioScience 2001, 51, 735–751. [Google Scholar] [CrossRef]
- Chen, F.; Yuan, Y.; Trouet, V.; Büntgen, U.; Esper, J.; Chen, F.; Yu, S.; Shen, M.; Zhang, R.; Shang, H. Ecological and Societal Effects of Central Asian Streamflow Variation over the Past Eight Centuries. npj Clim. Atmos. Sci. 2022, 5, 27. [Google Scholar] [CrossRef]
- Wu, Y.; Liu, Y.; Li, Q.; Cai, Q.; Ren, M.; Song, H.; Sun, C.; Zhang, T.; Ye, M. Drought Variations in the Yili Basin, Northwest China since AD 1673 Based on Tree-Ring Width. Forests 2023, 14, 2127. [Google Scholar] [CrossRef]
- Jiang, S.; Zhang, T.; Yuan, Y.; Yu, S.; Shang, H.; Zhang, R. Drought Reconstruction Based on Tree-Ring Earlywood of Picea Obovata Ledeb. for the Southern Altay Mountains. Geogr. Ann. Ser. Phys. Geogr. 2020, 102, 267–286. [Google Scholar] [CrossRef]
- Peng, Z.; Qin, L.; Li, X.; Zhang, H.; Chen, Y.; Liu, R.; Zhang, R. Tree-Ring-Based Temperature Reconstruction since 1766 CE in the Eastern Tianshan Mountains, Arid Central Asia. Theor. Appl. Climatol. 2020, 142, 687–699. [Google Scholar] [CrossRef]
- Zhang, T.; Liu, K.; Fan, Y.; Yu, S.; Zhang, R.; Shang, H.; Yuan, Y.; Wei, W.; He, Q.; Zhang, H.; et al. Status and Prospects of Tree-Ring Research in Central Asia. Dendrochronologia 2023, 78, 126069. [Google Scholar] [CrossRef]
- Zhou, P.; Huang, J.-G.; Liang, H.; Rossi, S.; Bergeron, Y.; Shishov, V.V.; Jiang, S.; Kang, J.; Zhu, H.; Dong, Z. Radial Growth of Larix sibirica Was More Sensitive to Climate at Low than High Altitudes in the Altai Mountains, China. Agric. For. Meteorol. 2021, 304–305, 108392. [Google Scholar] [CrossRef]
- Ren, M.; Liu, Y.; Cai, Q.; Li, Q.; Song, H.; Sun, C. Climate Warming Is Significantly Influenced by Rising Summer Maximum Temperatures: Insights from Tree-Ring Evidence of the Western Tianshan Mountains, China. J. For. Res. 2024, 35, 63. [Google Scholar] [CrossRef]
- Chen, F.; Man, W.; Wang, S.; Esper, J.; Meko, D.; Büntgen, U.; Yuan, Y.; Hadad, M.; Hu, M.; Zhao, X. Southeast Asian Ecological Dependency on Tibetan Plateau Streamflow over the Last Millennium. Nat. Geosci. 2023, 16, 1151–1158. [Google Scholar] [CrossRef]
- Zhang, R.; Yuan, Y.; Gou, X.; He, Q.; Shang, H.; Zhang, T.; Chen, F.; Ermenbaev, B.; Yu, S.; Qin, L.; et al. Tree-Ring-Based Moisture Variability in Western Tianshan Mountains since A.D. 1882 and Its Possible Driving Mechanism. Agric. For. Meteorol. 2016, 218–219, 267–276. [Google Scholar] [CrossRef]
- Fan, Y.; Shang, H.; Wu, Y.; Li, Q. Tree-Ring Width and Carbon Isotope Chronologies Track Temperature, Humidity, and Baseflow in the Tianshan Mountains, Central Asia. Forests 2020, 11, 1308. [Google Scholar] [CrossRef]
- Sun, B.; Liu, Y.; Lei, Y.; Guo, L. Warm-Induced Aridification in Eastern Inner Mongolia Evidenced by Tree Rings. Dendrochronologia 2017, 42, 73–79. [Google Scholar] [CrossRef]
- Wang, S.; Jiao, L.; Jiang, Y.; Liu, X.; Chen, K.; Liu, X. Tree-Ring-Based Drought-Pluvial Variation in the Tianshan Mountains of Northwestern China. Theor. Appl. Climatol. 2022, 148, 1727–1740. [Google Scholar] [CrossRef]
- Li, Y.; Huang, X.; Xiang, L.; Zhang, J.; Xu, Y.; Jeppesen, E. Influence of Lateglacial Meltwater Influx from Alpine Glaciers on the Aquatic Ecosystem of Kanas Lake in the Altai Mountains, China. Palaeogeogr. Palaeoclim. Palaeoecol. 2022, 604, 111214. [Google Scholar] [CrossRef]
- Wang, Y.; Huang, X.; Peng, W.; Zhou, G.; Zhang, J.; Du, X. Temperature variations over the past 600 years documented by a δ13C record from terrestrial plant remains from Kanas Lake, Altai Mountains, Northwestern China. Chin. Sci. Bull. 2017, 62, 2829–2839. [Google Scholar] [CrossRef]
- Li, Y.; Huang, X.; Xiang, L.; Zhang, J.; Xu, Y.; Tian, L.; Jin, Y.; Jin, X.; Zhao, Y.; Ren, L.; et al. Holocene Hydroclimatic Change in the Altai Mountains and Its Impact on Human Migration. Catena 2022, 219, 106617. [Google Scholar] [CrossRef]
- Holmes, R.L. Computer-Assisted Quality Control in Tree-Ring Dating and Measurement. Tree-Ring Bull. 1983, 43, 51–67. [Google Scholar]
- Cook, E.R. A Time Series Approach to Tree-Ring Standardization. Ph.D. Thesis, University of Arizona, Tucson, AZ, USA, 1985. [Google Scholar]
- Fritts, H.C. Tree Rings and Climate; Academic Press: Cambridge, MA, USA, 1976. [Google Scholar]
- Osborn, T.J.; Biffa, K.R.; Jones, P.D. Adjusting Variance for Sample-Size in Tree-Ring Chronologies and Other Regional Mean Timeseries. Dendrochronologia 1997, 15, 89–99. [Google Scholar]
- Wigley, T.M.; Briffa, K.R.; Jones, P.D. On the Average Value of Correlated Time Series, with Applications in Dendroclimatology and Hydrometeorology. J. Appl. Meteorol. Climatol. 1984, 23, 201–213. [Google Scholar] [CrossRef]
- Harris, I.; Osborn, T.J.; Jones, P.; Lister, D. Version 4 of the CRU TS Monthly High-Resolution Gridded Multivariate Climate Dataset. Sci. Data 2020, 7, 109. [Google Scholar] [CrossRef] [PubMed]
- Van Der Schrier, G.; Barichivich, J.; Briffa, K.R.; Jones, P.D. A scPDSI-based Global Data Set of Dry and Wet Spells for 1901–2009. J. Geophys. Res. Atmos. 2013, 118, 4025–4048. [Google Scholar] [CrossRef]
- Tucker, C.J.; Pinzon, J.E.; Brown, M.E.; Slayback, D.A.; Pak, E.W.; Mahoney, R.; Vermote, E.F.; El Saleous, N. An Extended AVHRR 8-km NDVI Dataset Compatible with MODIS and SPOT Vegetation NDVI Data. Int. J. Remote Sens. 2005, 26, 4485–4498. [Google Scholar] [CrossRef]
- Rayner, N.A.; Parker, D.E.; Horton, E.B.; Folland, C.K.; Alexander, L.V.; Rowell, D.P.; Kent, E.C.; Kaplan, A. Global Analyses of Sea Surface Temperature, Sea Ice, and Night Marine Air Temperature since the Late Nineteenth Century. J. Geophys. Res. Atmos. 2003, 108, 2002JD002670. [Google Scholar] [CrossRef]
- Huang, B.; Thorne, P.W.; Banzon, V.F.; Boyer, T.; Chepurin, G.; Lawrimore, J.H.; Menne, M.J.; Smith, T.M.; Vose, R.S.; Zhang, H.-M. Extended Reconstructed Sea Surface Temperature, Version 5 (ERSSTv5): Upgrades, Validations, and Intercomparisons. J. Clim. 2017, 30, 8179–8205. [Google Scholar] [CrossRef]
- Eyring, V.; Bony, S.; Meehl, G.A.; Senior, C.A.; Stevens, B.; Stouffer, R.J.; Taylor, K.E. Overview of the Coupled Model Intercomparison Project Phase 6 (CMIP6) Experimental Design and Organization. Geosci. Model Dev. 2016, 9, 1937–1958. [Google Scholar] [CrossRef]
- O’Neill, B.C.; Kriegler, E.; Ebi, K.L.; Kemp-Benedict, E.; Riahi, K.; Rothman, D.S.; Van Ruijven, B.J.; Van Vuuren, D.P.; Birkmann, J.; Kok, K. The Roads Ahead: Narratives for Shared Socioeconomic Pathways Describing World Futures in the 21st Century. Glob. Environ. Chang. 2017, 42, 169–180. [Google Scholar] [CrossRef]
- Trouet, V.; Taylor, A.H. Multi-Century Variability in the Pacific North American Circulation Pattern Reconstructed from Tree Rings. Clim. Dyn. 2010, 35, 953–963. [Google Scholar] [CrossRef]
- Mann, M.E.; Lees, J.M. Robust Estimation of Background Noise and Signal Detection in Climatic Time Series. Clim. Chang. 1996, 33, 409–445. [Google Scholar] [CrossRef]
- Stein, A.F.; Draxler, R.R.; Rolph, G.D.; Stunder, B.J.; Cohen, M.D.; Ngan, F. NOAA’s HYSPLIT Atmospheric Transport and Dispersion Modeling System. Bull. Am. Meteorol. Soc. 2015, 96, 2059–2077. [Google Scholar] [CrossRef]
- Tolwinski-Ward, S.E.; Evans, M.N.; Hughes, M.K.; Anchukaitis, K.J. An Efficient Forward Model of the Climate Controls on Interannual Variation in Tree-Ring Width. Clim. Dyn. 2011, 36, 2419–2439. [Google Scholar] [CrossRef]
- Tolwinski-Ward, S.E.; Tingley, M.P.; Evans, M.N.; Hughes, M.K.; Nychka, D.W. Probabilistic Reconstructions of Local Temperature and Soil Moisture from Tree-Ring Data with Potentially Time-Varying Climatic Response. Clim. Dyn. 2015, 44, 791–806. [Google Scholar] [CrossRef]
- Kirdyanov, A.V.; Arzac, A.; Kirdyanova, A.A.; Arosio, T.; Ovchinnikov, D.V.; Ganyushkin, D.A.; Katjutin, P.N.; Myglan, V.S.; Nazarov, A.N.; Slyusarenko, I.Y.; et al. Tree-Ring Chronologies from the Upper Treeline in the Russian Altai Mountains Reveal Strong and Stable Summer Temperature Signals. Forests 2024, 15, 1402. [Google Scholar] [CrossRef]
- Jiao, L.; Chen, K.; Liu, X.; Qi, C.; Xue, R. Comparison of the Response Stability of Siberian Larch to Climate Change in the Altai and Tianshan. Ecol. Indic. 2021, 128, 107823. [Google Scholar] [CrossRef]
- Pang, W.; Li, Q.; Liu, Y.; Song, H.; Sun, C.; Wang, J.; Yan, Y.; Cai, Q.; Ren, M. Precipitation Variations in China’s Altay Mountains Detected from Tree Rings Dating Back to AD 1615. Forests 2023, 14, 1496. [Google Scholar] [CrossRef]
- Shah, S.; Yu, J.; Liu, Q.; Shi, J.; Ahmad, A.; Khan, D.; Mannan, A. Climate Growth Response of Pinus Sibirica (Siberian Pine) in the Altai Mountains, Northwestern China. Pak. J. Bot. 2020, 52, 593–600. [Google Scholar] [CrossRef]
- Chen, F.; Zhang, T.; Seim, A.; Yu, S.; Zhang, R.; Linderholm, H.W.; Kobuliev, Z.V.; Ahmadov, A.; Kodirov, A. Juniper Tree-Ring Data from the Kuramin Range (Northern Tajikistan) Reveals Changing Summer Drought Signals in Western Central Asia. Forests 2019, 10, 505. [Google Scholar] [CrossRef]
- Wang, T.; Li, T.-Y.; Zhang, J.; Wu, Y.; Chen, C.-J.; Huang, R.; Li, J.-Y.; Xiao, S.-Y.; Artemevna Blyakharchuk, T. A Climatological Interpretation of Precipitation δ18O across Siberia and Central Asia. Water 2020, 12, 2132. [Google Scholar] [CrossRef]
- Xiao, S.; Peng, X.; Tian, Q.; Ding, A.; Xie, J.; Su, J. Interaction between the East Asian Summer Monsoon and Westerlies as Shown by Tree-Ring Records. Clim. Past 2024, 20, 1687–1701. [Google Scholar] [CrossRef]
- Tychkov, I.I.; Sviderskaya, I.V.; Babushkina, E.A.; Popkova, M.I.; Vaganov, E.A.; Shishov, V.V. How Can the Parameterization of a Process-Based Model Help Us Understand Real Tree-Ring Growth? Trees 2019, 33, 345–357. [Google Scholar] [CrossRef]
- Zhao, X.; Chen, F.; Seim, A.; Hu, M.; Akkemik, Ü.; Kopabayeva, A.; Mazarzhanova, K.; Zhang, R.; Maisupova, B.; Kirillov, V.; et al. Global Warming Leads to Growth Increase in Pinus sylvestris in the Kazakh Steppe. For. Ecol. Manag. 2024, 553, 121635. [Google Scholar] [CrossRef]
- Zhong, S.; Wang, Z.; Zhang, D.; Luo, T.; Wang, X.; Mi, T. Simulation of Radial Growth of Mongolian Pine (Pinus sylvestris Var. mongolica) and Dahurian Larch (Larix gmelinii) Using the Vaganov–Shashkin Model in the Greater Khingan Range, Northeast China. Forests 2024, 15, 243. [Google Scholar] [CrossRef]
- Rezsöhazy, J.; Gennaretti, F.; Goosse, H.; Guiot, J. Testing the Performance of Dendroclimatic Process-Based Models at Global Scale with the PAGES2k Tree-Ring Width Database. Clim. Dyn. 2021, 57, 2005–2020. [Google Scholar] [CrossRef]
- Yan, H.; Zeng, X.; Xue, Y.; Liu, X. Research Progress on Physiological Processes-based Tree-ring Width Models of Vaganov⁃Shashkin (VS) and VS-Lite. Chin. J. Appl. Ecol. 2024, 35, 2256–2266. [Google Scholar]


| Code | Lat. (N) | Lon. (E) | Elevation (m) | Cores/Trees | Period |
|---|---|---|---|---|---|
| JDQ | 87.21 | 48.52 | 1490 | 40/20 | 1734–2013 |
| HBH | 86.04 | 48.05 | 532.6 | 1958–2013 | |
| ALT | 88.03 | 47.73 | 735.3 | 1954–2013 | |
| BEJ | 86.87 | 47.70 | 473.9 | 1961–2013 | |
| CRU | 86.5–87.5 | 47–48 | 1954–2013 | ||
| PDSI | 86.5–87.5 | 47–48 | 1954–2013 | ||
| NDVI | 86.5–87.5 | 47–48 | 1981–2013 |
| Model | Source | Accuracy (Lat × Lon) | Model | Source | Accuracy (Lat × Lon) |
|---|---|---|---|---|---|
| ACCESS-CM2 | Australia | 144 × 192 | GFDL-ESM4 | America | 180 × 288 |
| ACCESS-ESM1-5 | Australia | 145 × 192 | GISS-E2-1-G | America | 90 × 144 |
| AWI-CM-1-1-MR | German | 96 × 192 | HadGEM3-GC31-LL | England | 144 × 192 |
| BCC-CSM2-MR | China | 160 × 320 | INM-CM4-8 | Russia | 120 × 180 |
| CanESM5 | Canada | 64 × 128 | INM-CM5-0 | Russia | 120 × 180 |
| CanESM5-CanOE | Canada | 64 × 128 | IPSL-CM6A-LR | Europe | 143 × 144 |
| CESM2-WACCM | America | 192 × 288 | KACE-1-0-G | Korea | 80 × 96 |
| CESM2 | America | 192 × 288 | MIROC6 | Japan | 128 × 256 |
| CIESM | China | 384 × 320 | MIROC-ES2L | Japan | 64 × 128 |
| CMCC-CM2-SR5 | Italy | 192 × 288 | MPI-ESM1-2-HR | German | 192 × 384 |
| CNRM-CM6-1 | France | 128 × 256 | MPI-ESM1-2-LR | German | 96 × 192 |
| CNRM-CM6-1-HR | France | 360 × 720 | MRI-ESM2-0 | Japan | 160 × 320 |
| CNRM-ESM2-1 | France | 128 × 256 | NESM3 | China | 96 × 192 |
| EC-Earth3 | Europe | 256 × 512 | NorESM2-LM | Norway | 96 × 144 |
| EC-Earth3-Veg | Europe | 256 × 512 | NorESM2-MM | Norway | 192 × 288 |
| FGOALS-f3-L | China | 192 × 288 | UKESM1-0-LL | England | 144 × 192 |
| FGOALS-g3 | China | 80 × 180 |
Disclaimer/Publisher’s Note: The statements, opinions and data contained in all publications are solely those of the individual author(s) and contributor(s) and not of MDPI and/or the editor(s). MDPI and/or the editor(s) disclaim responsibility for any injury to people or property resulting from any ideas, methods, instructions or products referred to in the content. |
© 2024 by the authors. Licensee MDPI, Basel, Switzerland. This article is an open access article distributed under the terms and conditions of the Creative Commons Attribution (CC BY) license (https://creativecommons.org/licenses/by/4.0/).
Share and Cite
Hou, J.; Chen, F.; Li, J. Response of Larix sibirica Radial Growth to Climate Change in Kanas, Northern Xinjiang, China. Forests 2024, 15, 2137. https://doi.org/10.3390/f15122137
Hou J, Chen F, Li J. Response of Larix sibirica Radial Growth to Climate Change in Kanas, Northern Xinjiang, China. Forests. 2024; 15(12):2137. https://doi.org/10.3390/f15122137
Chicago/Turabian StyleHou, Jiannan, Feng Chen, and Jianrong Li. 2024. "Response of Larix sibirica Radial Growth to Climate Change in Kanas, Northern Xinjiang, China" Forests 15, no. 12: 2137. https://doi.org/10.3390/f15122137
APA StyleHou, J., Chen, F., & Li, J. (2024). Response of Larix sibirica Radial Growth to Climate Change in Kanas, Northern Xinjiang, China. Forests, 15(12), 2137. https://doi.org/10.3390/f15122137