1. Introduction
UHI is a climatic phenomenon characterized by significantly higher temperatures in rapidly developing urban areas compared to neighboring rural areas. Climate change and rapid urbanization intensify the UHI effect [
1], leading to adverse environmental consequences, including deteriorating air quality, increased cooling energy consumption, and negative impacts on public health [
2,
3]. Consequently, reducing UHI effects and increasing the resilience of urban areas have garnered widespread attention [
4].
Research on urban heat islands typically distinguishes between two primary types: surface urban heat islands (SUHIs) and canopy urban heat islands (CUHIs). SUHIs are defined as the temperature differences between urban surfaces and their surrounding rural areas, which are primarily influenced by materials such as concrete and asphalt, especially during daytime hours [
5]. In contrast, CUHIs focus on variations in air temperature within the urban canopy, which significantly impact human thermal comfort and are influenced by factors such as building density, vegetation, and anthropogenic heat [
6]. These concepts provide a foundation for developing strategies to mitigate urban heat, including urban greening initiatives and the application of reflective materials for cooling purposes. This study investigates the mitigation effects on surface urban heat islands, with the cooling intensity of urban green spaces being contingent upon the temperature differential between the green space and its surrounding environment, thereby categorizing it as an effective method for reducing surface urban heat islands.
Previous studies have shown that urban green and blue infrastructure can mitigate UHI, and the morphological characteristics of these spaces are closely associated with urban cooling effects [
7]. In terms of the cooling effect of UGS, trees exert the strongest influence, followed by shrubs and grasslands. Through evapotranspiration and shading, urban vegetation reduces temperatures by selectively absorbing and reflecting incoming radiation, while also regulating latent and sensible heat exchange. UGS reduces temperatures and forms cool zones in urban areas, thereby lowering the temperatures of surrounding areas [
7,
8,
9]. In London, green patches can decrease nighttime temperatures by 1.1 to 4 °C, at distances ranging from 20 to 440 m [
10]. Simultaneously, research has shown that in Beijing, cooling intensity (CI) declines when green space size exceeds 16 hectares. Generally, this may occur due to the cooling distance becoming too large, thus diminishing the influence on surrounding area temperatures of UGS. Previous studies have consistently demonstrated that UGS size is positively correlated with cooling intensity, a relationship that is frequently nonlinear [
7,
11]. This relationship suggests that our research should examine the gradual transition of this nonlinear pattern to identify the optimal area threshold for achieving maximum cooling efficiency.
Specifically, blue-green spaces require a minimum area to maintain optimal cooling effects; however, when this area exceeds the threshold, cooling efficiency decreases [
12]. This indicates that the cooling effect of UGS is influenced by scaling factors. CI increases nonlinearly with patch size, implying that a minimum UGS area is required to achieve maximum cooling efficiency (CE), which is of great significance for the design and management of UGS [
13,
14,
15]. However, when exploring the threshold area of UGS for maximum CE, reported threshold sizes vary across studies, likely due to differences in urban climate environments and vegetation coverage. It is worth noting that inconsistencies in threshold results pose significant challenges for urban planners and managers, particularly when determining the ideal cooling threshold and optimizing the cooling potential of existing UGS to mitigate UHI [
16]. Due to the variations across studies, planners struggle to obtain consistent scientific guidance, which impacts the development of urban cooling strategies and hinders the effective allocation of resources. In summary, investigating the scale dependence of UGS cooling effects is essential for determining the minimum UGS size required to achieve maximum CE.
In general, the importance of landscape composition (types and quantities) and configuration (spatial layout) in mitigating urban heat is well-established, particularly with regard to the spatial layout of urban green spaces, which has gained increasing recognition over the past decade [
17,
18,
19,
20]. Numerous studies have demonstrated that large, continuous, and compact green patches exhibit stronger cooling island effects [
21,
22,
23], while other studies suggest that evenly distributed and irregularly shaped green patches are more efficient in reducing urban heat [
24,
25]. The influence of landscape structure on urban temperature is not always linear, and there is an optimal tree canopy coverage or UGS size that maximizes CE [
26]. Therefore, this study will explore the potential landscape factors affecting CE. Given the complexity of urban systems, this study selects representative landscape indicators to summarize both internal and external factors, determining the optimal scale and spatial configuration of UGS to mitigate heat island effects and contribute to the sustainable development of Xi’an.
Canopy cover serves as a representation of the three-dimensional structure of urban forests and directly influences photosynthesis, transpiration, and carbon absorption capacity. An increased canopy cover signifies a larger coverage area of urban forests within three-dimensional space, thereby facilitating a broader range of ecological services. Previous studies have indicated that the transpiration and canopy shading provided by UGS and blue spaces can effectively cool the environment by directly blocking solar radiation and preventing the heating of surfaces and air, a phenomenon referred to as the cooling island effect of UGS [
27,
28]. Transpiration facilitates the removal of heat from the surrounding air through the evaporation of moisture from plants, which further lowers air temperature; concurrently, the shading effect diminishes direct sunlight exposure on the ground, thereby reducing surface heat accumulation [
29]. Kong et al. [
30] found that green spaces in Nanjing, China, with a forest cover of 60% possess the potential to mitigate the urban heat island effect. Li et al. [
23] reported that for every 10% increase in green space coverage in Beijing, surface temperatures decrease by approximately 0.86 °C. Consequently, it is evident that both the direct and indirect cooling effects of green spaces significantly contribute to the cooling capacity of UGS, as reflected in metrics of canopy cover [
31]. Canopy cover is not only a critical indicator for assessing the cooling capacity of urban green spaces but is also closely associated with the configuration of these spaces and the types of functional areas, thereby impacting the overall microclimate and thermal comfort of urban environments. This study aims to investigate the influence of factors such as canopy cover on the cooling capacity of UGS, seeking to explore the cooling efficiency of UGS at a similar scale to ascertain the extent of their cooling potential. Canopy coverage is integral to the three-dimensional structure of UGS and forests. It not only serves as a direct indicator of the ecological service capacity of green spaces and forests, but also influences carbon absorption, climate regulation, and biodiversity maintenance through its interaction with the height and density of urban forests. This study incorporates indicators of the three-dimensional structure of urban forests to explore the cooling effects of UGS and strives to balance ecological, economic, and social benefits.
A significant body of research has primarily focused on investigating the cooling effects of urban green spaces at various scales [
12,
32]. However, spatial variations in cooling intensity and efficiency across different functional zones—such as roads, industrial areas, public service facilities, commercial districts, and residential areas—have often been neglected. To achieve a more comprehensive understanding of UGS cooling characteristics, future studies should emphasize the importance of incorporating regional characteristics when quantifying cooling effects. In this study, a power-law relationship was applied to analyze the distribution patterns of cooling intensity. Importantly, from an urban planning perspective, this study examined potential factors influencing optimal cooling effects, particularly in relation to green space area, with the goal of identifying ideal landscape layout strategies for UGS in each functional zone. The findings provide valuable insights for maximizing the cooling benefits of urban complexes.
Higher-resolution drone data were not employed in this research, primarily due to the unique topography of Xi’an, which would have required extensive data collection and involved complex processing steps, potentially impacting the feasibility of the study. As a result, satellite images with slightly lower resolution were used for data analysis.
To address the identified research gaps, a new model was developed to evaluate the potential contributions of UGS to regional climate adaptation strategies. By combining a cooling effect quantification method based on a power-law function with the land-use classification of Xi’an, 25,594 UGS patches were analyzed, ranging in size from 11.8 square meters to 343 hectares. This analysis aimed to explore the impact of patch size on CE across different functional zones and spatial scales. Data were sourced from Google Earth and Landsat 8, and a new framework was introduced that incorporates both a CI and CE to facilitate comprehensive measurement.
Our study aims to answer several questions: (1) How does the CI of UGS evolve with increasing area? (2) Is there a relationship between CE and patch size that varies with scale? If so, what is the minimum UGS area where CE reaches its peak? (3) What landscape factors potentially impact the cooling effect, and which are most significant? (4) If an optimal threshold exists for CE, what are the primary influencing factors within this range for each functional zone? Furthermore, how can we enhance the arrangement of these functional zones to improve CE?
2. Method
This study is structured into seven sequential methods that progressively enhance the exploration process. Attention is directed towards six central areas of Xi’an, where the spatial distribution of 25,594 UGS patches and land surface temperature (LST) data are extracted using high-resolution Google Earth images and Landsat 8 satellite data. Subsequently, the UGS patches are classified into small-scale (<0.1 ha), medium-scale (0.1–16 ha), and large-scale (>16 ha). A temperature inversion method grounded in the radiative transfer equation (RTE) is employed to calculate cooling intensity (CI) and cooling efficiency (CE). Additionally, multifactor stepwise regression analysis is utilized to evaluate the potential landscape factors influencing the cooling effects of UGS, including UGS area, canopy cover, and vegetation index. Finally, the UGS is categorized into five functional zones to analyze the cooling characteristics and dominant factors within each zone, with the aim of providing scientific evidence for the spatial configuration and landscape design of UGS.
2.1. Research Area and Data Collection
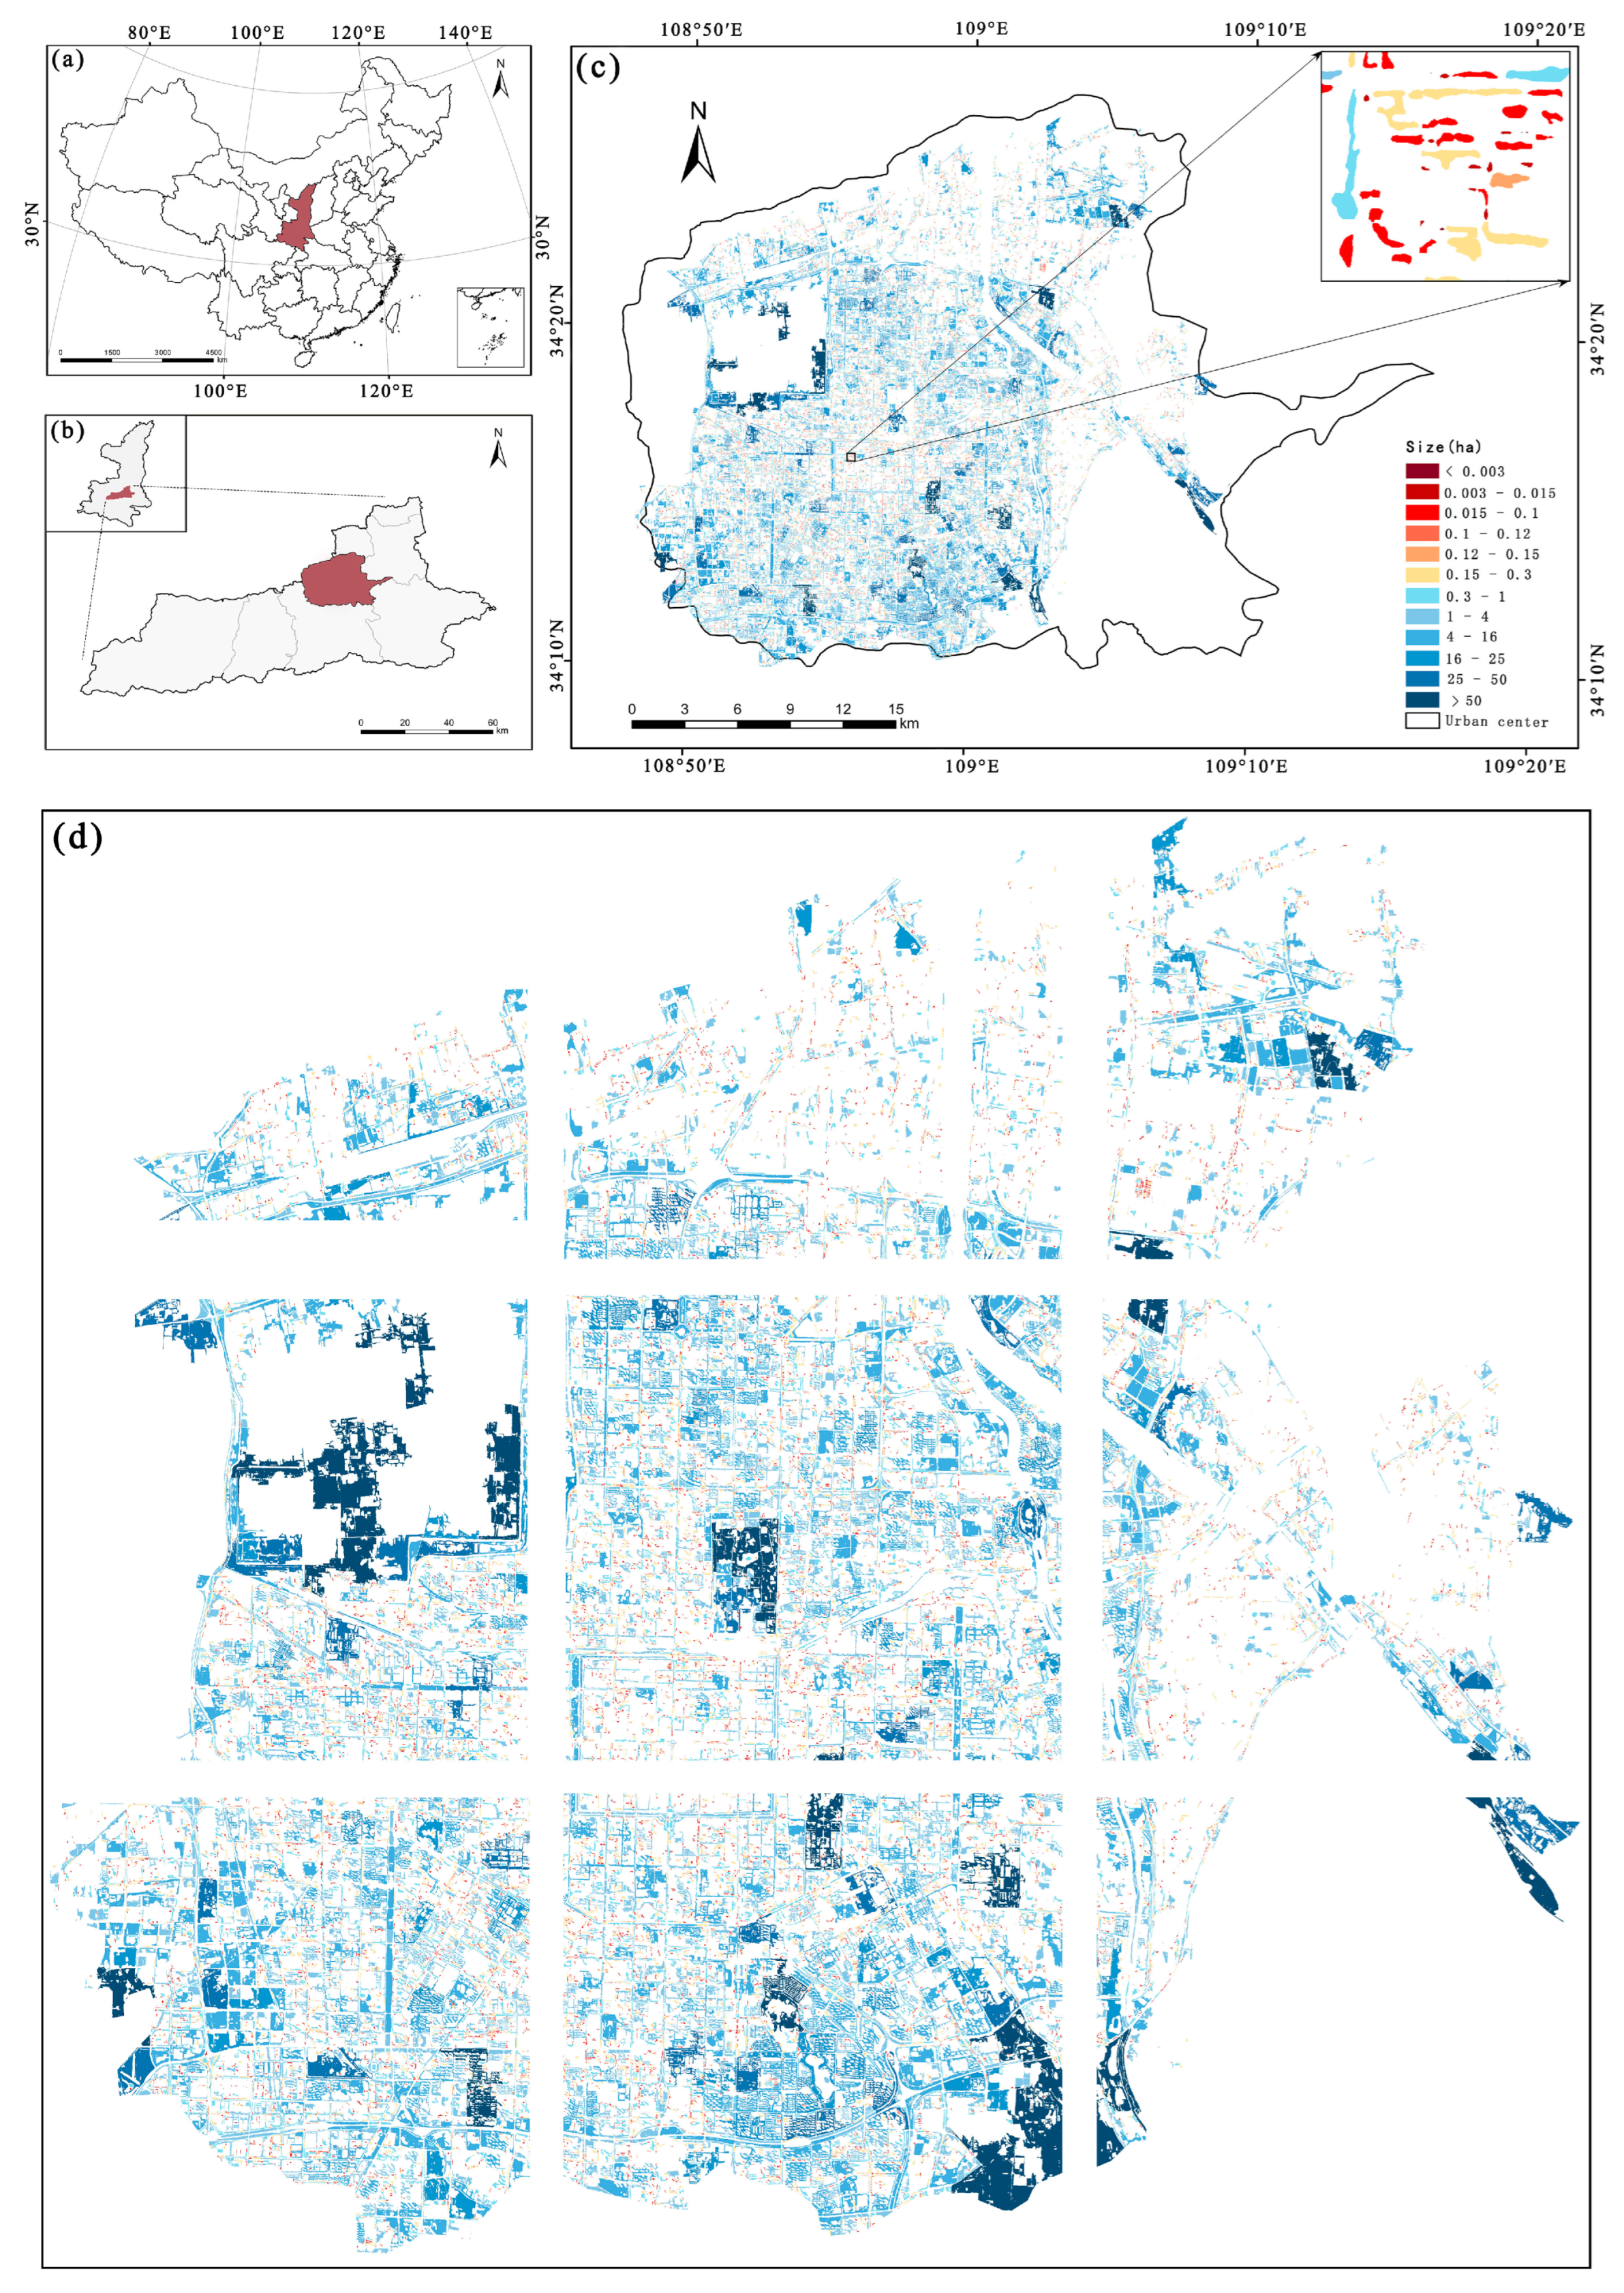
Xi’an is situated on the Guanzhong Plain in northwestern China, bordered by the Wei River and the Loess Plateau to the north and the Qinling Mountains to the south. It functions as the central city within both the Xi’an metropolitan area and the Guanzhong Plain urban agglomeration. This study focuses on six districts: Weiyang, Yanta, Xincheng, Beilin, Lianhu, and Baqiao (
Figure 1), which are located between 108°47′ E and 109°16′ E longitude and 34°10′ N and 34°27′ N latitude. The region experiences a warm temperate, semi-humid continental monsoon climate. In recent years, influenced by global climate change, Xi’an has demonstrated trends of increasing annual average temperatures, along with rising temperatures during the spring, autumn, and winter seasons. Notably, the increase in summer temperatures has been particularly significant. To confront the challenges posed by climate change, the local government has enacted various measures to mitigate warming. The “Xi’an Urban Greening Regulations” were implemented to expand urban green space, optimize the arrangement of green areas, and increase vegetation coverage, thereby enhancing the city’s cooling capacity. In addition, Xi’an’s 14th Five-Year Plan for Ecological and Environmental Protection underscores the importance of constructing climate-adaptive cities, promoting green and low-carbon development, and proactively responding to climate change [
33]. These initiatives not only aim to alleviate the urban heat island effect and improve residents’ quality of life but also serve as active responses to the broader challenges of climate change.
The study focused on six central districts of Xi’an, where high-resolution Google Earth images (1-m resolution) were utilized to classify urban green space (UGS) patches within the study area. Landsat 8 OLI_TIRS satellite data were employed to retrieve LST, with the acquisition dates synchronized with those of the Google Earth images. To cross-validate the LST, this study utilized the freely available Moderate Resolution Imaging Spectroradiometer (MODIS) surface temperature/emissivity daily product from the National Aeronautics and Space Administration (NASA) (
https://ladsweb.modaps.eosdis.nasa.gov/, accessed on 15 July 2023). The MODIS surface temperature product provides LST and emissivity information at a spatial resolution of 1 km in a daily product originating from the MODIS instrument, and the MODIS MOD11 (Terra) product is typically accurate to more than 1 K [
34,
35].
To enhance the methodology and data analysis concerning UGS and their cooling effects, it is essential to address potential limiting factors that may impact data quality and the accuracy of temperature assessments, such as cloud cover and seasonal fluctuations. Classifying UGS by size is crucial, as these differences may arise from the observed threshold ranges for cooling efficiency identified in previous studies. Research conducted by Zhou et al. [
36] and Kumari and Tiwari [
32] provides valuable insights into these threshold ranges. Medium-sized UGS typically exhibit superior cooling effects due to optimal shading and evapotranspiration processes, which may be less pronounced in smaller or larger patches. For instance, Zhou et al. found that UGS patches with areas ranging from 1000 to 5000 square meters are most effective in reducing urban temperatures, while Kumari and Tiwari highlighted the diminishing returns associated with larger patches exceeding 10,000 square meters. Therefore, in this study, UGS will be categorized into 12 classes: medium-scale will comprise six classes, while both small-scale and large-scale will each consist of three classes, in order to explore the optimal scale of UGS for achieving maximum cooling efficiency.
A total of 25,594 UGS patches were identified across the six districts. These patches were categorized into 12 size classes: <0.003 ha, 0.003–0.015 ha, 0.015–0.1 ha, 0.1–0.12 ha, 0.12–0.15 ha, 0.15–0.3 ha, 0.3–1 ha, 1–4 ha, 4–16 ha, 16–25 ha, 25–50 ha, and >50 ha. Additionally, patches smaller than 0.1 ha were classified as small-scale (Bin1–Bin3), those ranging from 0.1 ha to 16 ha as medium-scale (Bin4–Bin9), and patches larger than 16 ha as large-scale (Bin10–Bin12).
Table 1 shows the information of Landsat8 OLI-TIRS C2 L2 and MODIS utilized in the study, along with the corresponding weather conditions.
2.2. Urban Green Space (UGS) Patch Classification and Recognition
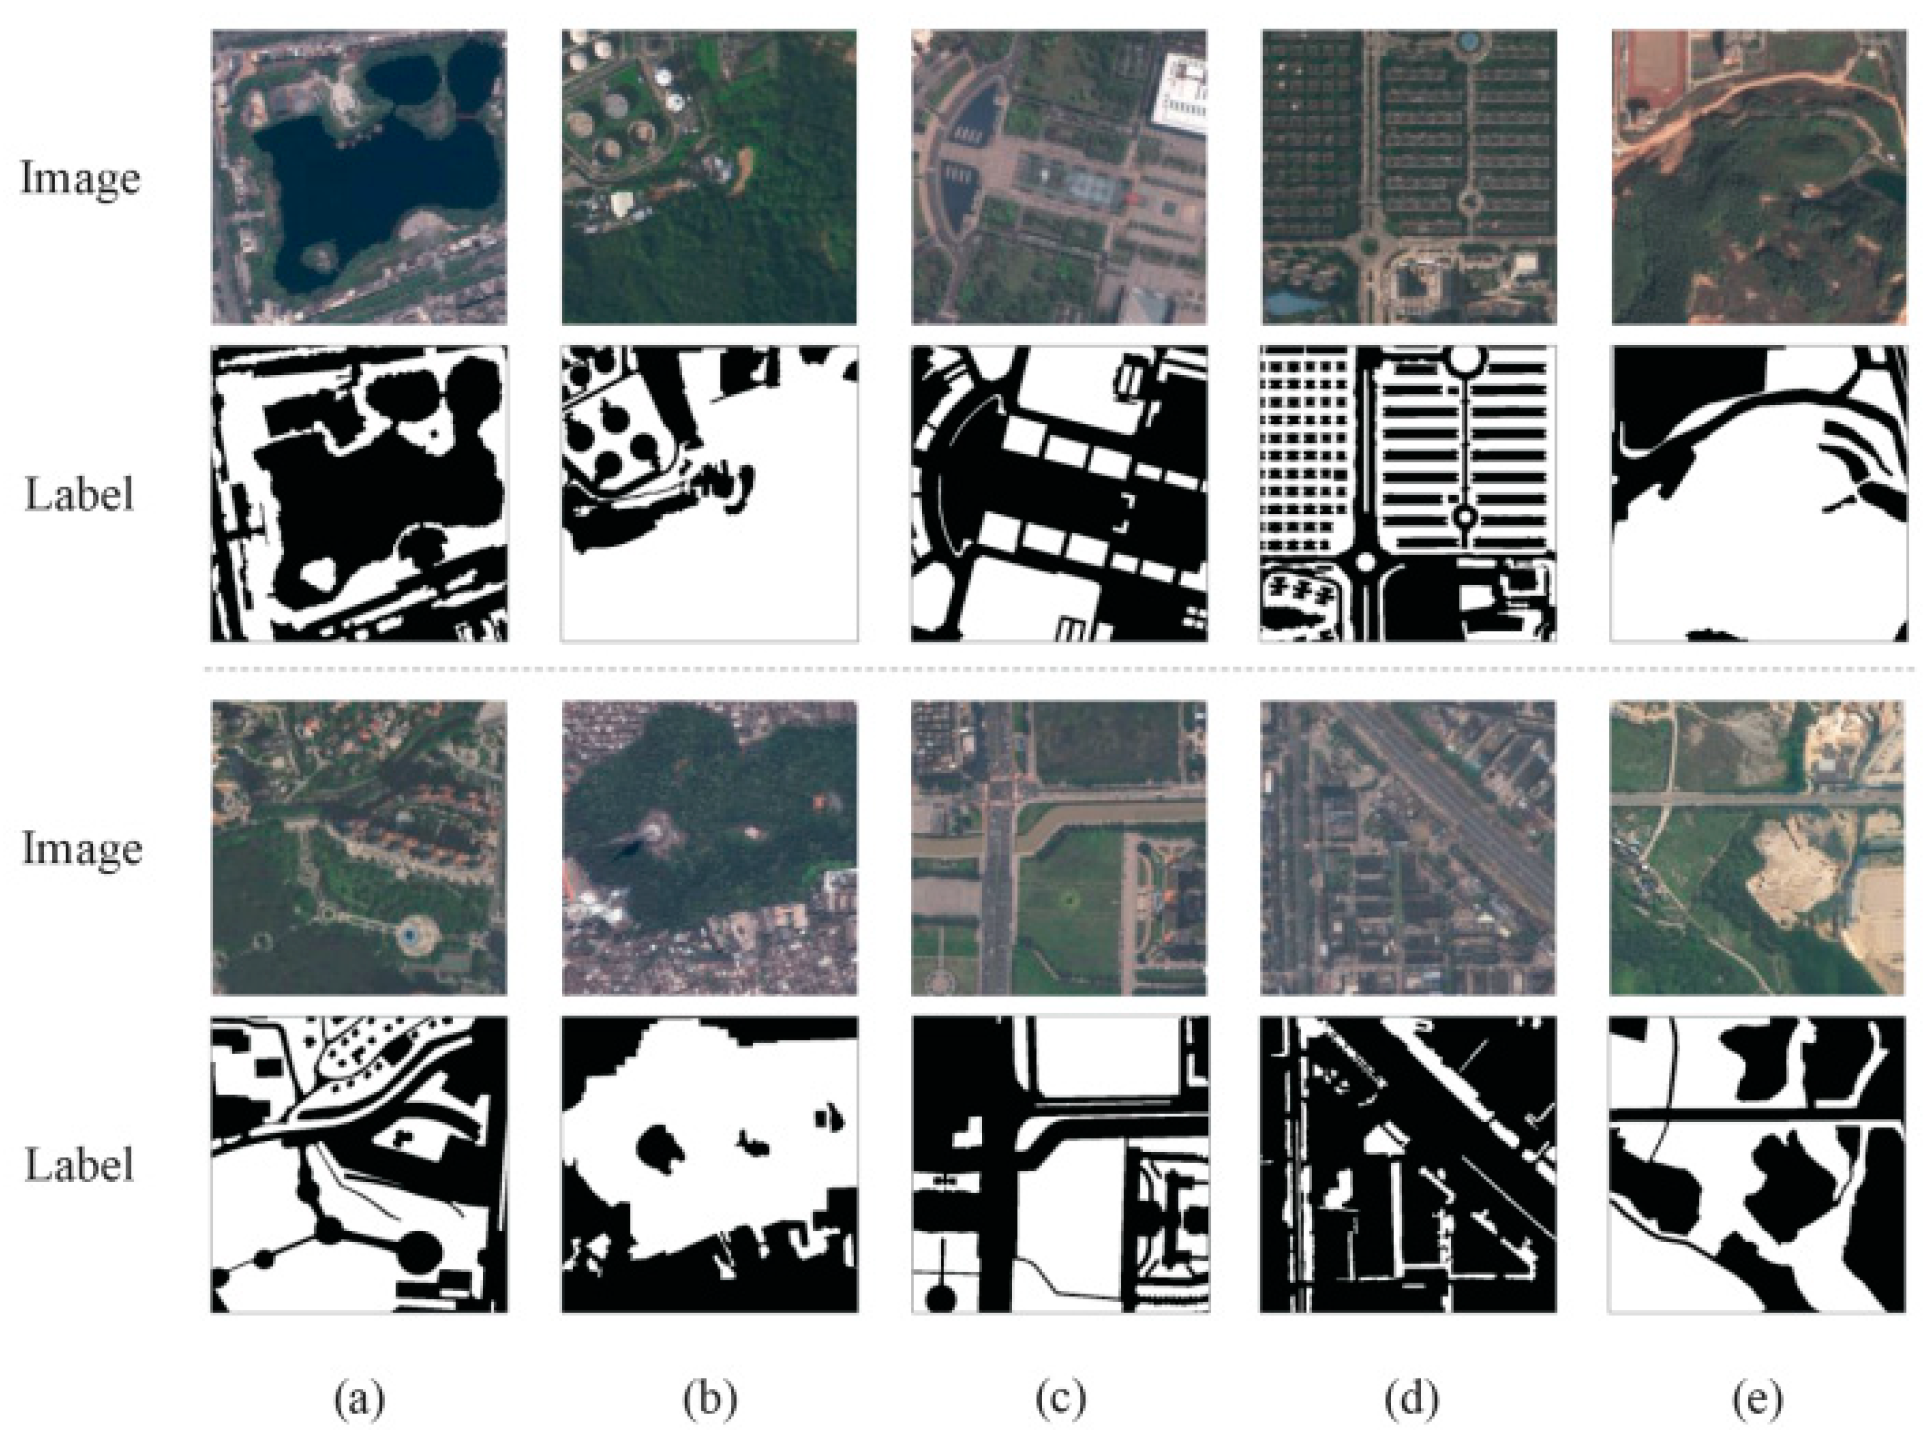
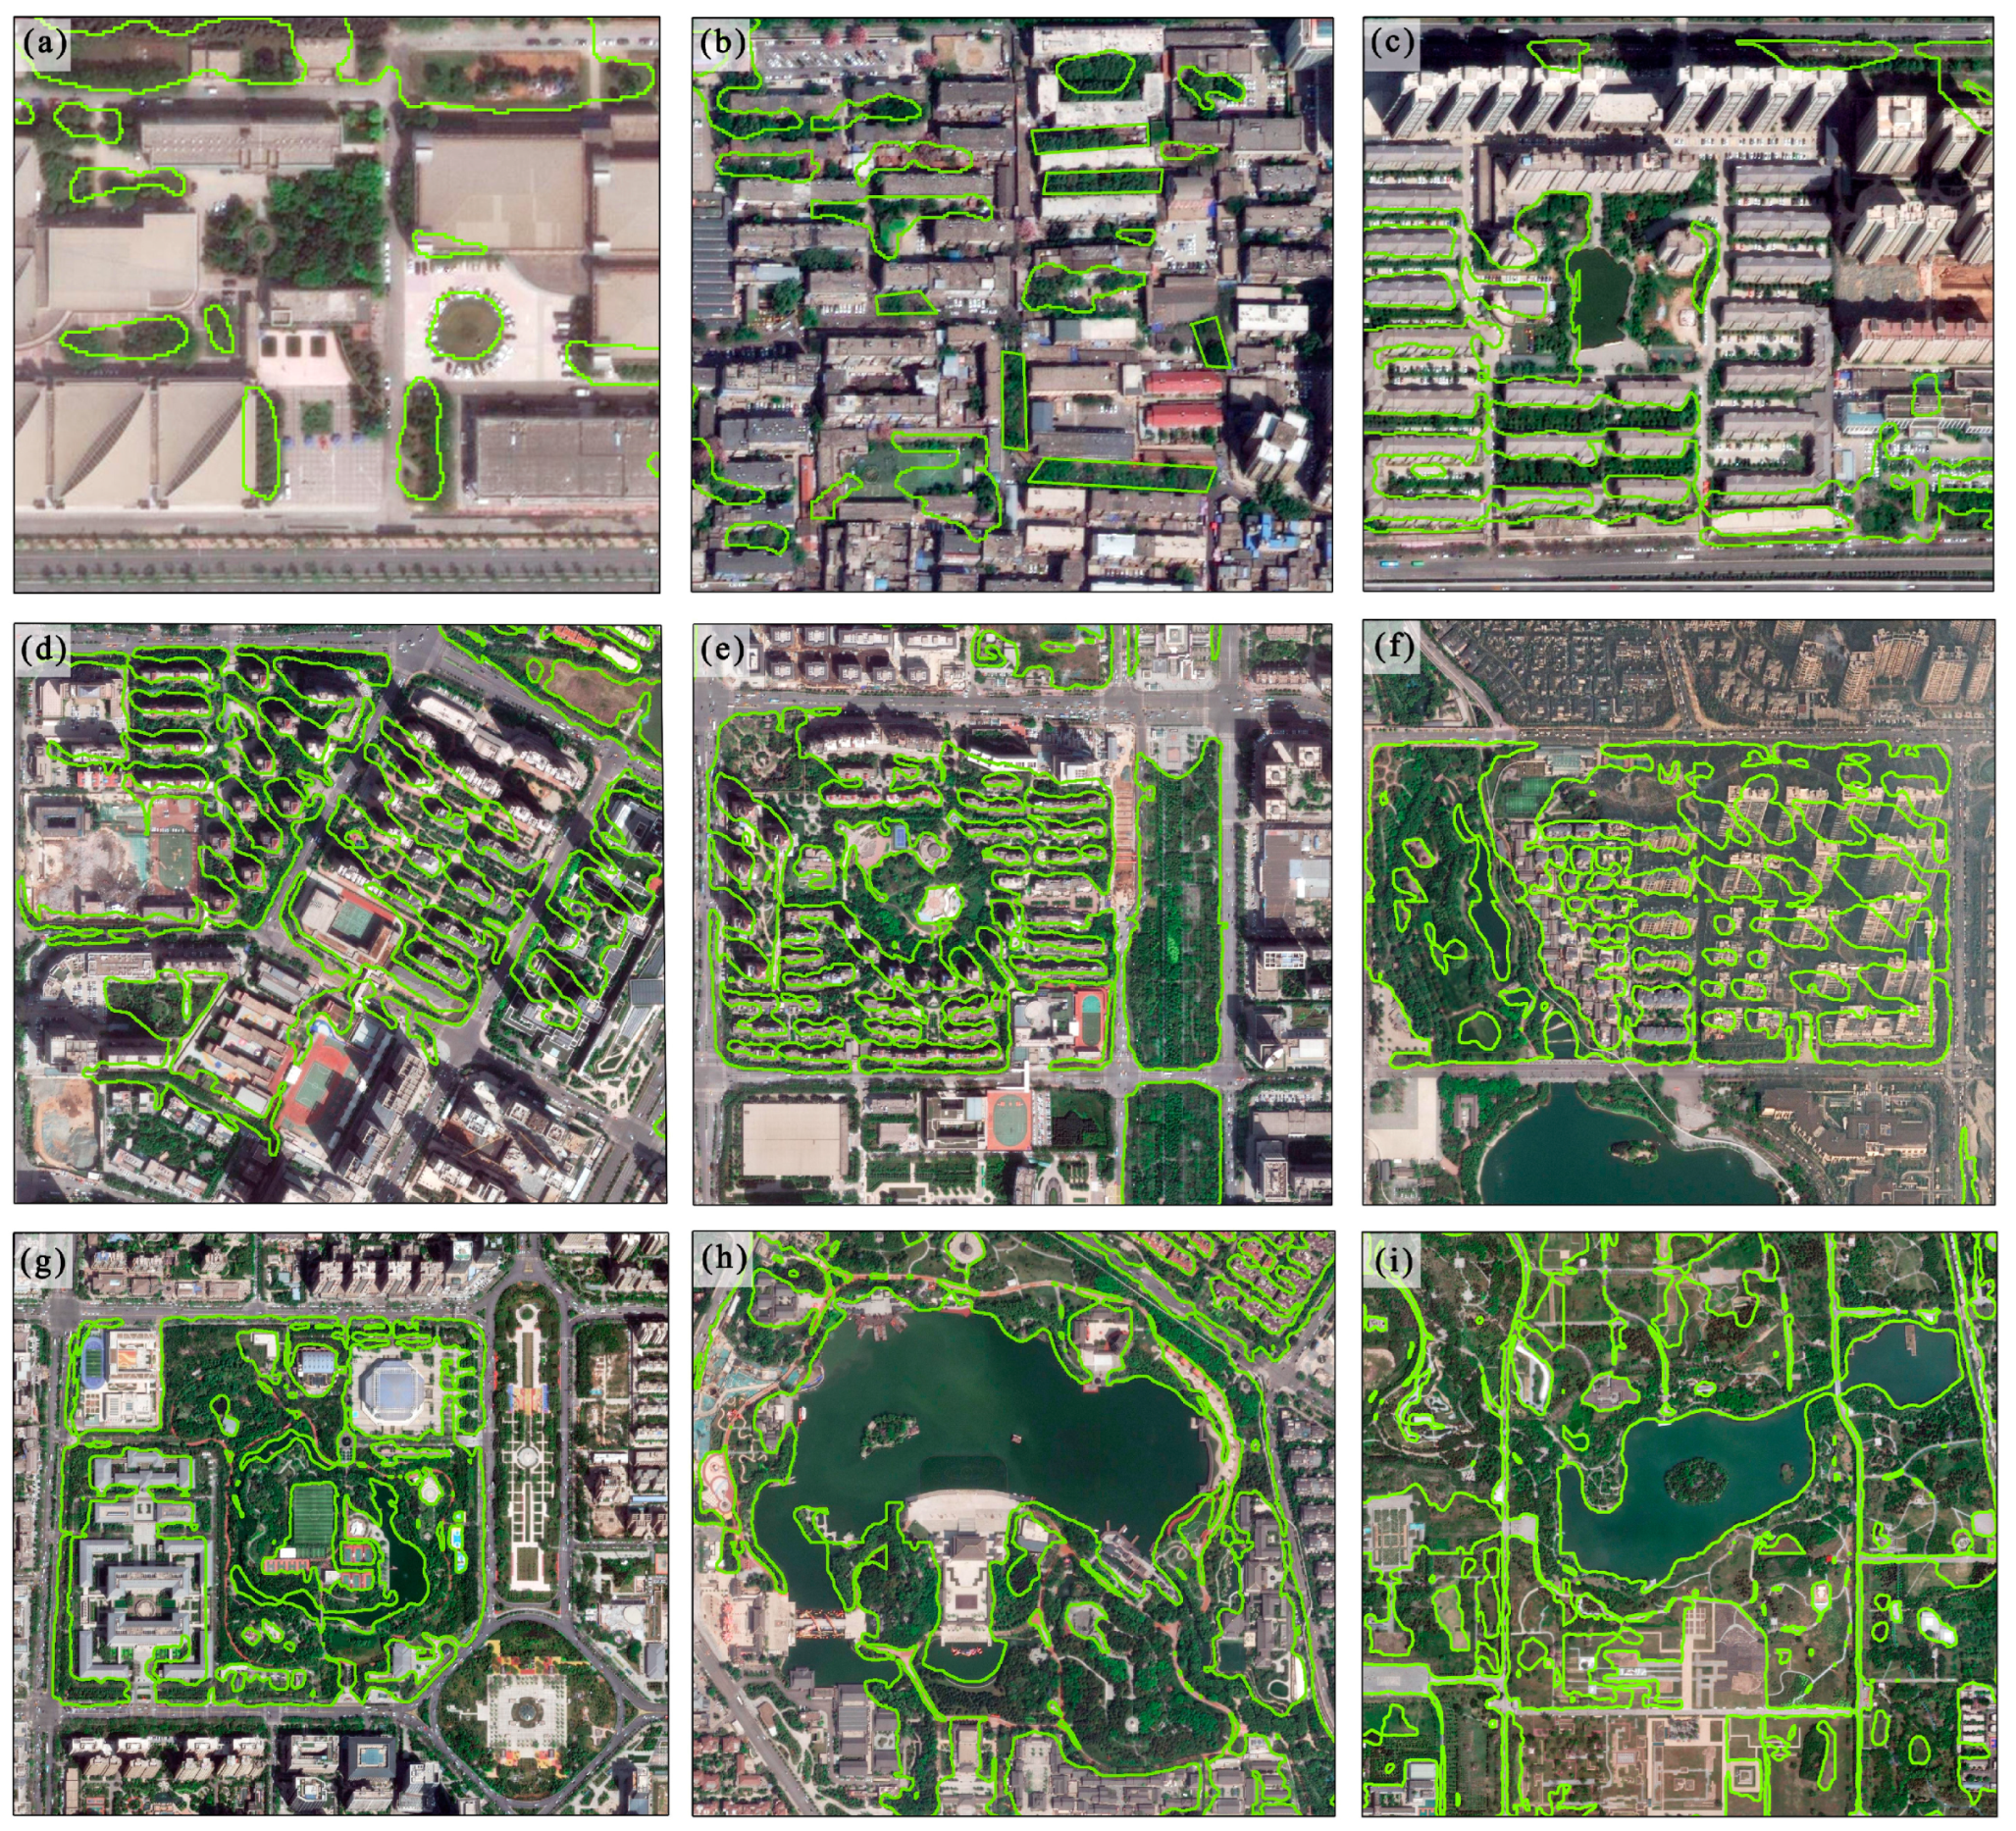
The UGS classification data utilized in this study was derived from the urban green space data set (UGSet), which was compiled as part of the UGS-1m project. UGSet, a high-resolution data set, was specifically created to facilitate deep learning model training. The data set comprises 4554 samples, with each sample having dimensions of 512 × 512 pixels. In conjunction with the UGS-1m product and the UGSNet network, UGSet is applied to produce fine-grained urban green space maps (UGS-1m) for various cities. The generation of these maps entails the pre-training of UGSNet on UGSet, followed by adversarial training to allow the model to adapt to diverse urban environments. The final UGS outputs are generated through the use of Google Earth imagery. The images referenced in this study are sourced from © Gaofen-2 2019. Each column depicts distinct types of UGS samples, illustrating machine-identifiable urban green space categories:
Figure 2: (a) parks, (b) green buffer zones, (c) square green spaces, (d) affiliated green spaces, and (e) other green spaces.
The reliability and validity of the UGSet data set has been validated by comparing experiments with other existing state-of-the-art (SOTA) deep learning models, in which UGSNet as a generator has shown the highest F1 score. The integration of UGSet helps to improve the adaptability and accuracy of the model for mapping different urban green spaces.
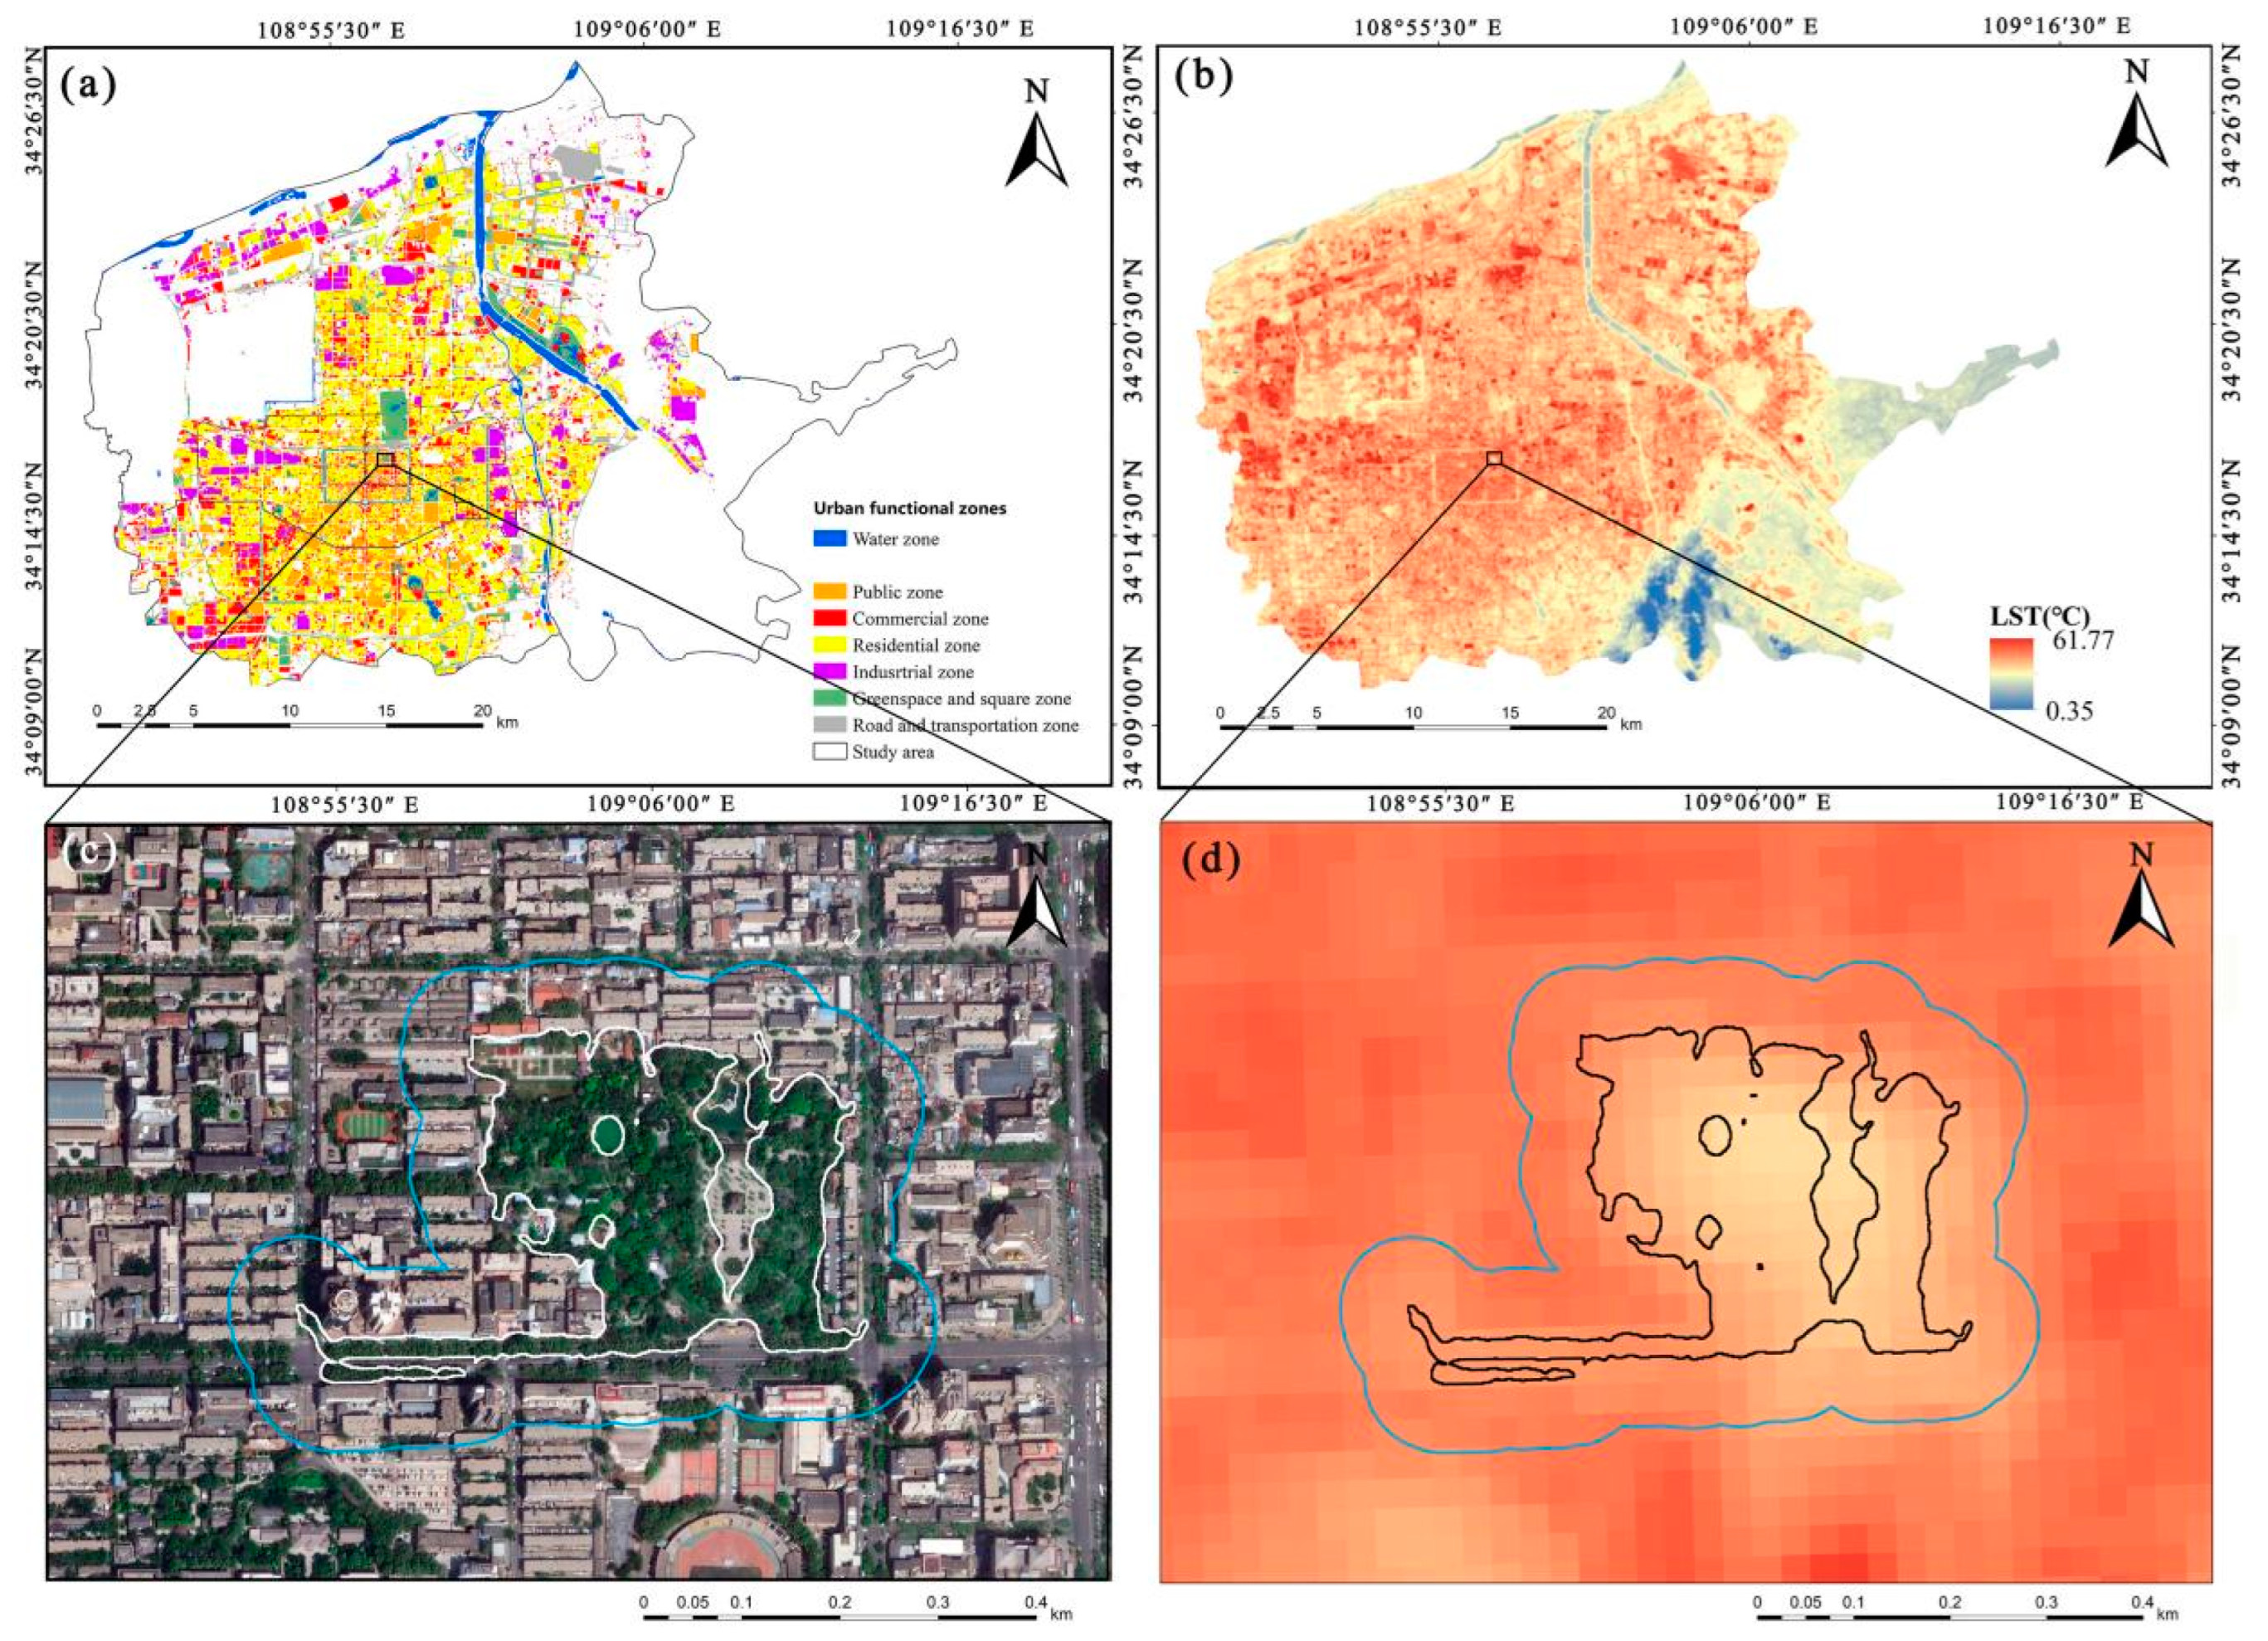
Figure 3 shows the green space classification coverage map of the study area.
2.3. Surface Temperature Inversion
In this study, an atmospheric correction method based on the radiative transfer equation (RTE) was employed to retrieve LST from Landsat-8 OLI_TIRS imagery. The RTE, a physical method rooted in actual atmospheric and surface processes, was used to simulate the effects of atmospheric influence on surface thermal radiation, providing a more accurate inversion of LST. Unlike single-channel and single-window algorithms, which depend heavily on empirical relationships or assumptions regarding specific atmospheric conditions, the RTE method is less constrained by the absolute calibration accuracy of the TIRS data. LST retrieval was performed on 15 July 2023. Meteorological data from the China National Meteorological Center indicated that the maximum temperature on that day was 35 °C, with an average temperature of 19 °C, an average relative humidity of 48%, and a maximum wind speed of 2.5 m/s under light breeze conditions, with minimal cloud cover. Following LST retrieval, the normalized difference vegetation index (NDVI), vegetation coverage, and LST were calculated.
The RTE algorithm used for temperature retrieval is represented by the following equation:
In the formula,
L↑ is the upward radiation brightness of the atmosphere;
L↓ is the energy reflected by the downward radiation of the atmosphere after reaching the ground and is the physical temperature of the ground.
Lλ is the brightness value of thermal infrared radiation received by the satellite sensor. The parameters τ, L↓, and L↑ correspond to atmospheric transmittance, downward atmospheric radiance, and upward atmospheric radiance, respectively. These parameters can be obtained from the Downloaded metadata file package (accessed on 15 July 2023).
B(
) is the energy reflected by the atmospheric transmittance of the blackbody radiant thermal infrared band after reaching the ground.
ε is the land surface emissivity (LSE). The blackbody of radiation brightness
B(
) in the thermal infrared band temperature
T can be calculated by the Equation (2) [
37]:
Finally, according to the Planck function (Equation (3)),
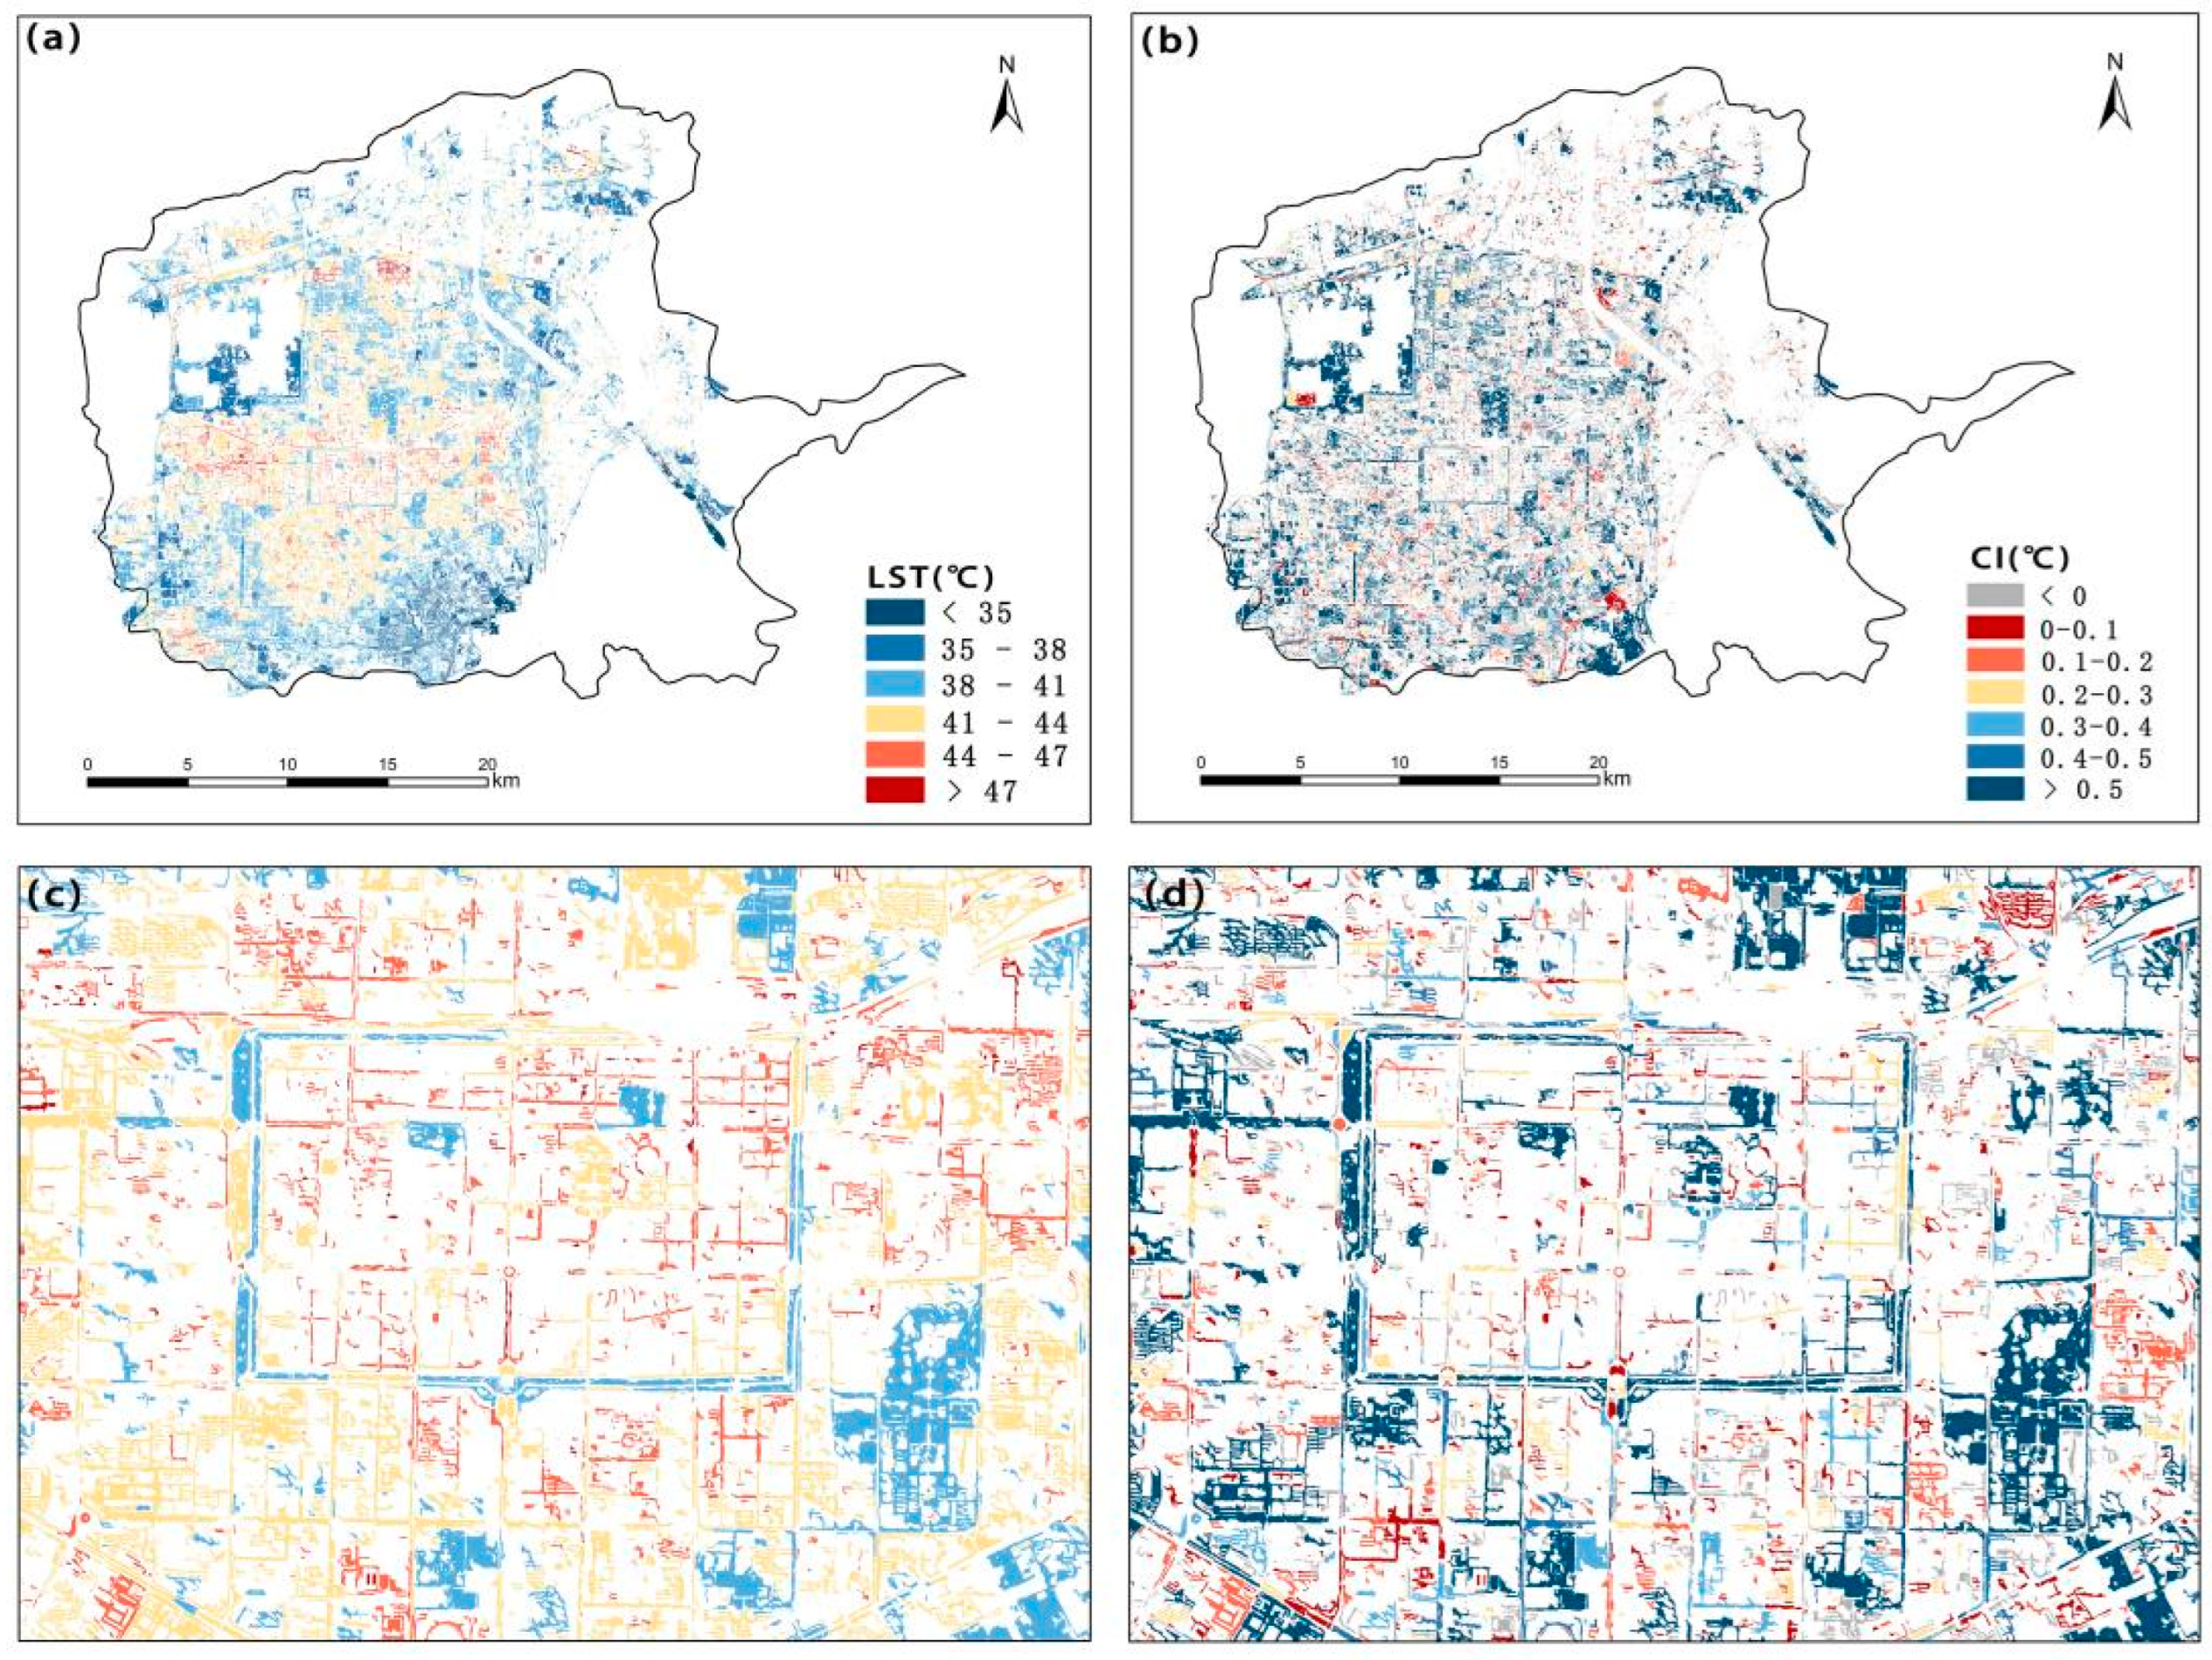
Figure 3b displays the LST values for this day is displayed at a resolution of 30 m:
where
Ts is the actual surface temperature (°C),
K1 = 774.89 W/m
2·Sr·μm,
K2 = 1321.08 km. In order to ensure the consistency of spatial resolution, we use the nearest neighbor resampling technology in ArcGIS to further resample the data with a resolution of 30 m LST to 1 m.
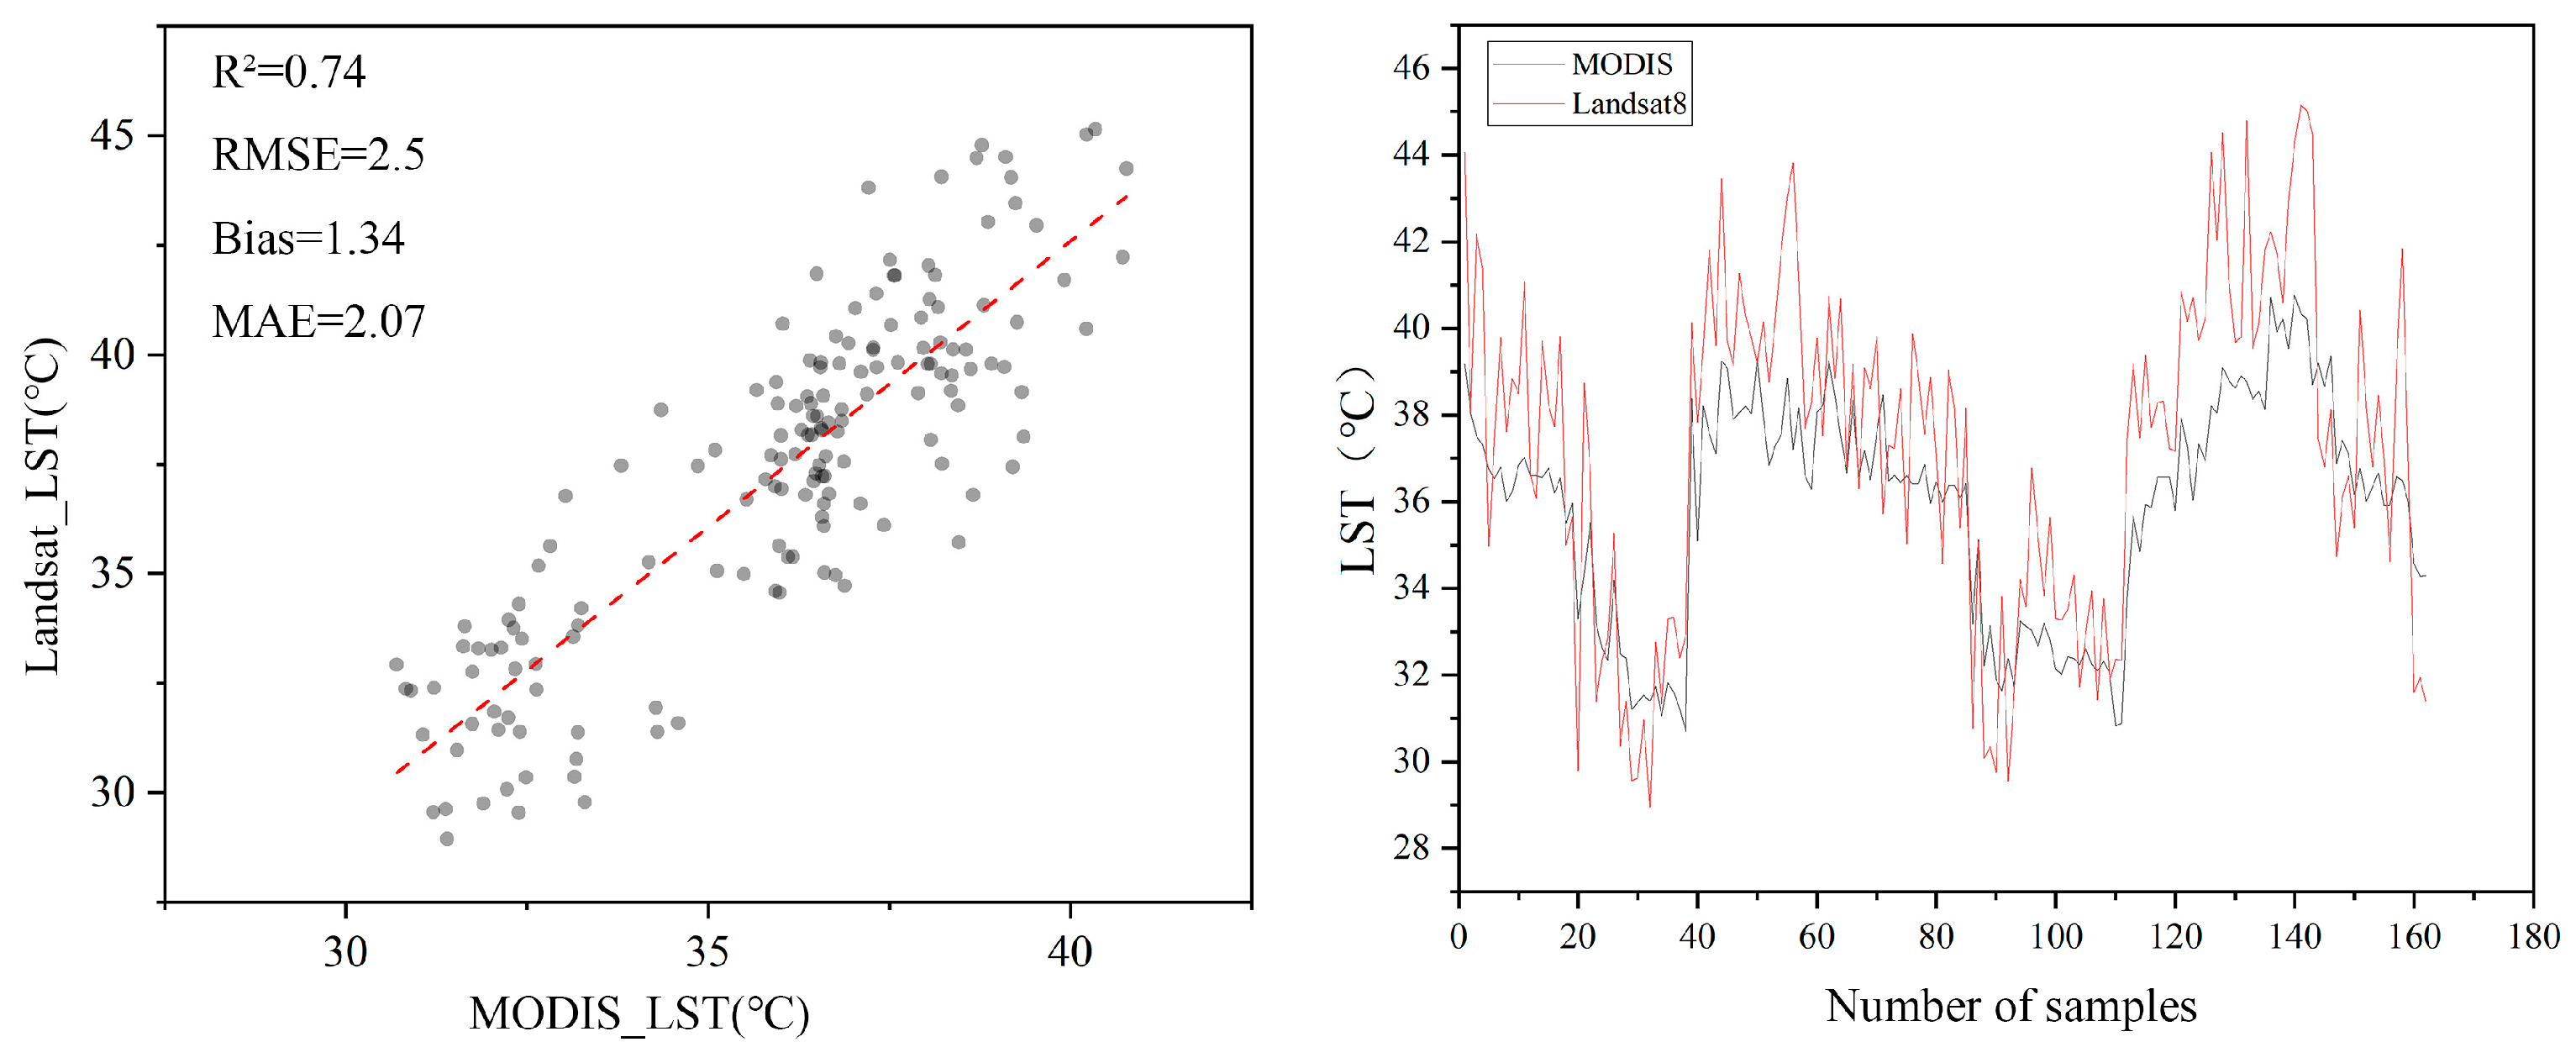
Due to the lack of actual measured LST data on the ground, this study cross-validates the RTE-based calculated LST with MODIS surface temperature products. The accuracy of the RTE-calculated LST images can be further confirmed using the coefficient of determination (R-squared), root mean square error (RMSE) and mean absolute error (MAE).
where,
and
are the validated and the actual values,
and
are the mean values of the validated and the actual values, and n is the number of samples validated.
2.4. Land Surface Emissivity Estimation Using the NDVI Thresholds Method
LSE is one of the key parameters to retrieve accurate LST from remotely sensed imagery. The modified NDVI thresholds method (NDVI
THM) was used for LSE estimation as Equation (8)
where,
and
are the vegetation of the emissivity and the soil emissivity, the values for Landsat 8 TIRS band 10 are 0.982 (
) and 0.971 (
).
is the apparent reflectance in the OLI band j,
is the corresponding band coefficient obtained from Li and Jiang [
34]
NDVI can be calculated from red and near infrared bands:
where
and
are land surface reflectance of RED band and NIR band, the term
in Equation (8) includes the effect of the geometrical distribution of the natural surfaces and also the internal reflections. Sorbrino et al. [
37] suggested that
can be estimated by:
where,
F is a geometrical factor ranging between 0 and 1, whose mean value is 0.55.
2.5. Quantify the Cooling Efficiency and Cooling Intensity of UGS
In assessing the cooling effects of UGS, various indices have been developed by researchers to quantify their impact. Cooling intensity (CI) refers to the difference in LST between UGS and their surrounding areas [
38], while cooling efficiency (CE) is defined as the CI per unit area of UGS [
39]. Additionally, some studies evaluate the cooling area per unit of UGS. However, much of the existing literature has not fully accounted for the heterogeneity in CE across different scales [
16]. To address this gap, this study introduces a novel analytical framework by applying a power-law function to model the CI of green patches within UGS. This method aims to clarify the scale dependence of UGS cooling effects and determine the optimal scale for achieving maximum CE. Power-law functions are widely used to describe complex patterns and scale dependencies across various disciplines, including ecology, sociology, and engineering. For example, they have been applied to study the relationships between forest cover and biodiversity [
40], as well as between city size (e.g., population) and the number of cities [
41]. By examining the scale dependency of both CI and CE in UGS, this research provides a more comprehensive understanding of the cooling mechanisms of green patches across varying spatial scales, offering more precise and actionable insights for urban planning and environmental management.
In order to meet the research objectives, a novel adaptive method was developed to define the cooling distance of UGS with various shapes. When the UGS is assumed to be circular, the radius is determined such that the cooling area approximately corresponds to the area of the UGS. This area-based method offers greater flexibility and adaptability compared to approaches that utilize fixed thresholds [
21] or rely on fixed-point calculations [
42] for determining cooling distances. By allowing dynamic adjustments, the proposed method enables a more precise definition of the size and shape of the cooling area around UGS, leading to improvements in computational efficiency and accuracy. As shown in
Figure 2, the cooling area in this study is calculated based on the actual area of the UGS, with the radius (denoted as r) determined using the following formula:
We defined CI as the difference between the calculated mean temperature of the impervious surface in the buffer area and the mean temperature in the green patch.
The power-law function provides an effective method for elucidating the scaling relationship between CI and area. This approach offers deeper insights into how CI varies with changes in area size and whether a consistent pattern exists between the two variables. By applying logarithmic transformation to both sides of the power-law equation and performing piecewise fitting, the scale exponent (or slope) of the resulting curve, denoted as CE (β), is obtained. CE represents the extent of the power-law relationship between CI and area. A fixed value of β indicates scale invariance in CE, implying that increases in the area of green patches do not result in higher CE. Conversely, if β is not constant, piecewise linear fitting is employed to investigate the scale-dependent relationship of UGS. By evaluating the value of β, it can be determined how CE changes with UGS size, revealing the existence of a maximum CE where the cooling effect is optimized at a specific threshold scale.
where S represents the UGS region; parameter β represents the scale index (slope) of CE and UGS regions. The parameter α refers to the influence of factors other than area.
2.6. Exploration of Potential Landscape Factors
The factors influencing the cooling effect of UGS can be categorized into internal and external factors. Internal factors are defined by the characteristics of the green space itself, such as its area, shape, vegetation type, coverage, and the presence of water bodies [
43]. In contrast, external factors are related to environmental influences within the surrounding buffer zone, including landscape patterns outside the green space [
12]. To examine the potential impact of landscape factors on CI and CE, five internal factors and four external factors were investigated. These factors are presented in
Table 2. And
Table 3 provides detailed explanations for each indicator. The internal factors include UGS area (UGSA_in), tree canopy coverage (TA_in), UGS shape (LSI), normalized difference vegetation index (NDVI_in), and fractal dimension (FRAC_MN), which quantify the green space’s shape, vegetation coverage, and boundary complexity. External factors consist of UGS area within the buffer zone (UGSA_out), NDVI within the buffer zone (NDVI_out), water area within the buffer zone (WA_out), and the aggregation index (AI), which were analyzed to assess the landscape pattern and connectivity of green space patches. We imported each type of raster data into Fragstats 4.0, and calculated two important indicators, patch aggregation degree (AI) and fractal dimension (FRAC_MN), based on pixel size of 1 m and surrounding 8 units. To refine the selection of indicators and address multicollinearity issues, the variance inflation factor (VIF) was calculated, and indicators with a VIF value of less than 10 (as shown in
Table 1) were incorporated into the multiple stepwise regression. Additionally, it is important to note that the normalized difference vegetation index (NDVI) used in this study was derived from the processing of Landsat 8 satellite imagery. The specific methodology involves the calculation of NDVI values from surface reflectance data obtained from the near-infrared and red bands. These values are employed to evaluate the density and health of urban green spaces. This process provides significant ecological indicators that support the analysis of the cooling effects associated with urban green spaces.
2.7. Importance and Relevance Analysis
The next step is to conduct a multivariate stepwise regression analysis to verify the correlation between potential influencing factors and CI. This method not only considers the impact of individual variables but also the synergistic effects between variables. The relative importance of the variables can be quantified by standardizing the regression coefficients in the model, and the calculated values can show the positive or negative contribution of each influencing factor to the target variable. This can explain the contribution of the influencing factors to CI at different scales of green space, while identifying the most important factor as the dominant factor [
39]. Additionally, a Spearman correlation analysis is used to determine whether there is a positive or negative correlation between each influencing factor and LST. In this study, the Spearman correlation coefficient is used to calculate the correlation between potential landscape factors and CI, thereby deriving the relationship between influencing factors and the cooling effect.
2.8. Explore the Leading Factors of Green Functional Areas
Building on the results from the previous analysis, the optimal area threshold for CE across various scales of UGS was identified. Within this threshold, UGS areas were classified into five distinct functional zones: roads, industrial zones, public service areas, residential zones, and commercial areas. For each functional zone, the UGS patch exhibiting the highest CI was selected. The data for eight indicator factors were then normalized, with values mapped between [0, 1]. By comparing different functional zones, the primary factors influencing CE in each zone were identified, leading to the development of targeted strategies to enhance cooling performance within each specific functional zone.
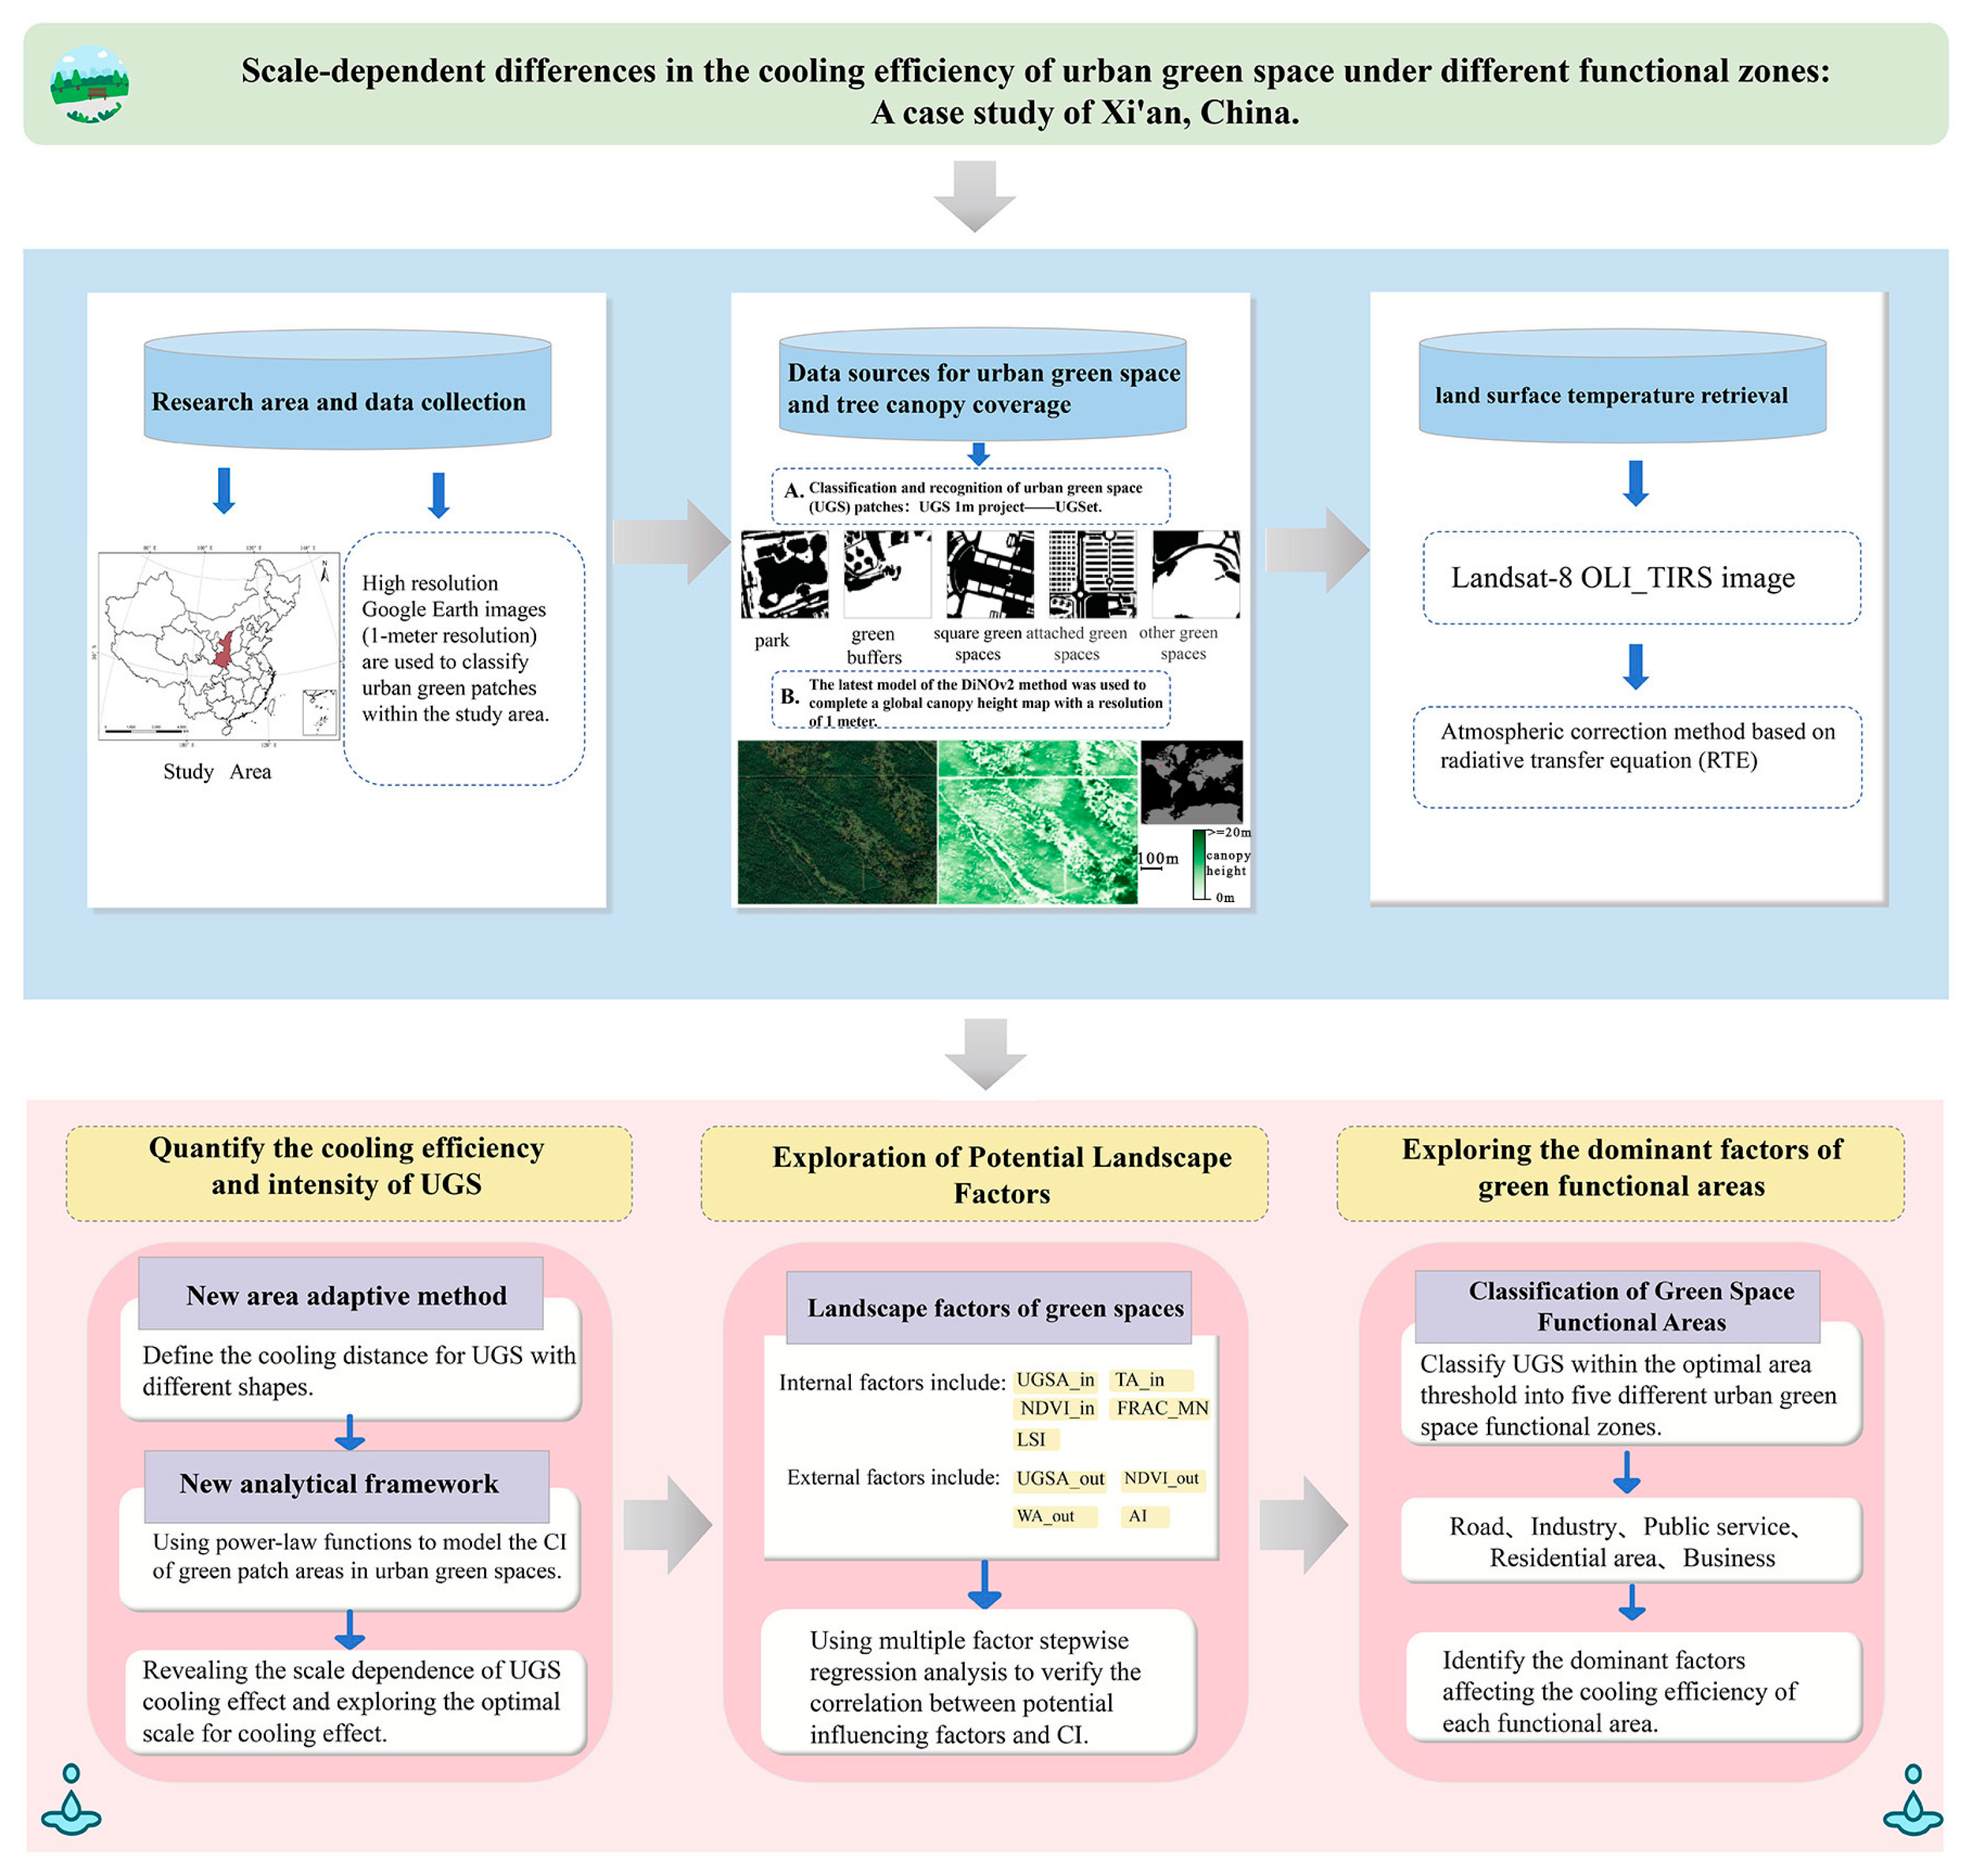
The technical route of this study is shown in
Figure 4.
3. Results
3.1. Cross-Verification of RTE-Based LST
Figure 5 illustrates the degree of accuracy of the RTE-based LST inverted from Landsat 8, which shows a strong correlation between the MODIS product and the RTE-based LST, The MODIS land surface temperature (LST) data (MOD11A1, 1 km resolution) were collected on 15 July. To align this data with the resolution of Landsat LST data, kriging interpolation was applied to resample it to a finer 30 m resolution. In total, 968 MODIS grid points were extracted from the study area, and 16% of these (162 points) were randomly selected for comparison with the Landsat data. The analysis revealed an R
2 of 0.74, a root mean square error (RMSE) of 2.5, a mean absolute error (MAE) of 2.11, and a bias of 1.34. These metrics suggest that the interpolation method yields reliable accuracy. Furthermore, the results align with those reported by [
44], who similarly found that despite the lower spatial resolution of MODIS data, accurate and stable LST comparisons can be achieved with higher-resolution data sets following appropriate spatial interpolation. Overall, the results of the LST inversion exhibit a high level of confidence and can be applied to the LST-derived cooling studies.
3.2. Spatial Visualization Analysis of Urban Green Space Cooling Intensity
The average LST of the 25,594 UGS in Xi’an was recorded at 41.81 ± 3.03 °C. Of these green patches, 13,872 (54.20%) demonstrated a “cooling island effect”, in which vegetation mitigated direct solar heating of the ground through processes such as transpiration and shading, thereby reducing local air temperatures. The remaining 11,722 (45.80%) patches exhibited a “heat island effect”, with an average patch area of 0.18 ± 0.9 hectares. These patches, characterized by their relatively small size and low internal vegetation coverage, were more vulnerable to urban heat due to both their limited green space and the influence of external human activities.
The distribution of CI and Landsat LST in
Figure 6 illustrates the spatial variability of cooling effects provided by green spaces in Xi’an. Significant differences in cooling were observed between the urban core and peripheral areas, which could be attributed to factors such as the size, shape, and vegetation quality of the green patches. Moreover, the analysis of LST and CI distributions emphasized the critical role of UGSin mitigating the heat island effect. High-temperature zones in the LST distribution were primarily concentrated in the city center and densely built-up areas, where surface temperatures typically exceeded 41 °C, with some regions surpassing 47 °C, resulting in a pronounced urban heat island effect. Conversely, low-temperature zones were predominantly located in the city’s outskirts and around large green spaces, parks, or undeveloped land, where temperatures were below 35 °C, exhibiting a cooling island effect. Furthermore, regions with higher CI (CI > 0.5 °C) were mainly found around large green spaces or parks within the study area, as well as in the northern and southwestern parts of the city. These areas typically featured large patches of vegetation with high coverage and were often intersected by water bodies, effectively reducing the surrounding temperature. In contrast, areas with weaker CI (0 °C < CI < 0.2 °C) were primarily located at the city margins or in areas with limited green space, where the cooling effect was minimal due to smaller patch sizes. It is noteworthy that the spatial distribution of LST and CI revealed opposing trends. In high-LST areas (such as the city center and densely developed regions), CI values were generally lower, indicating insufficient green coverage or poor landscape configuration within buffer zones, making it difficult to mitigate elevated temperatures. In contrast, in low-LST areas (such as those near green spaces in the city outskirts), CI values were higher, suggesting that these green patches significantly reduced surrounding surface temperatures. This underscores the crucial role of the cooling island effect of green spaces in alleviating the urban heat island effect.
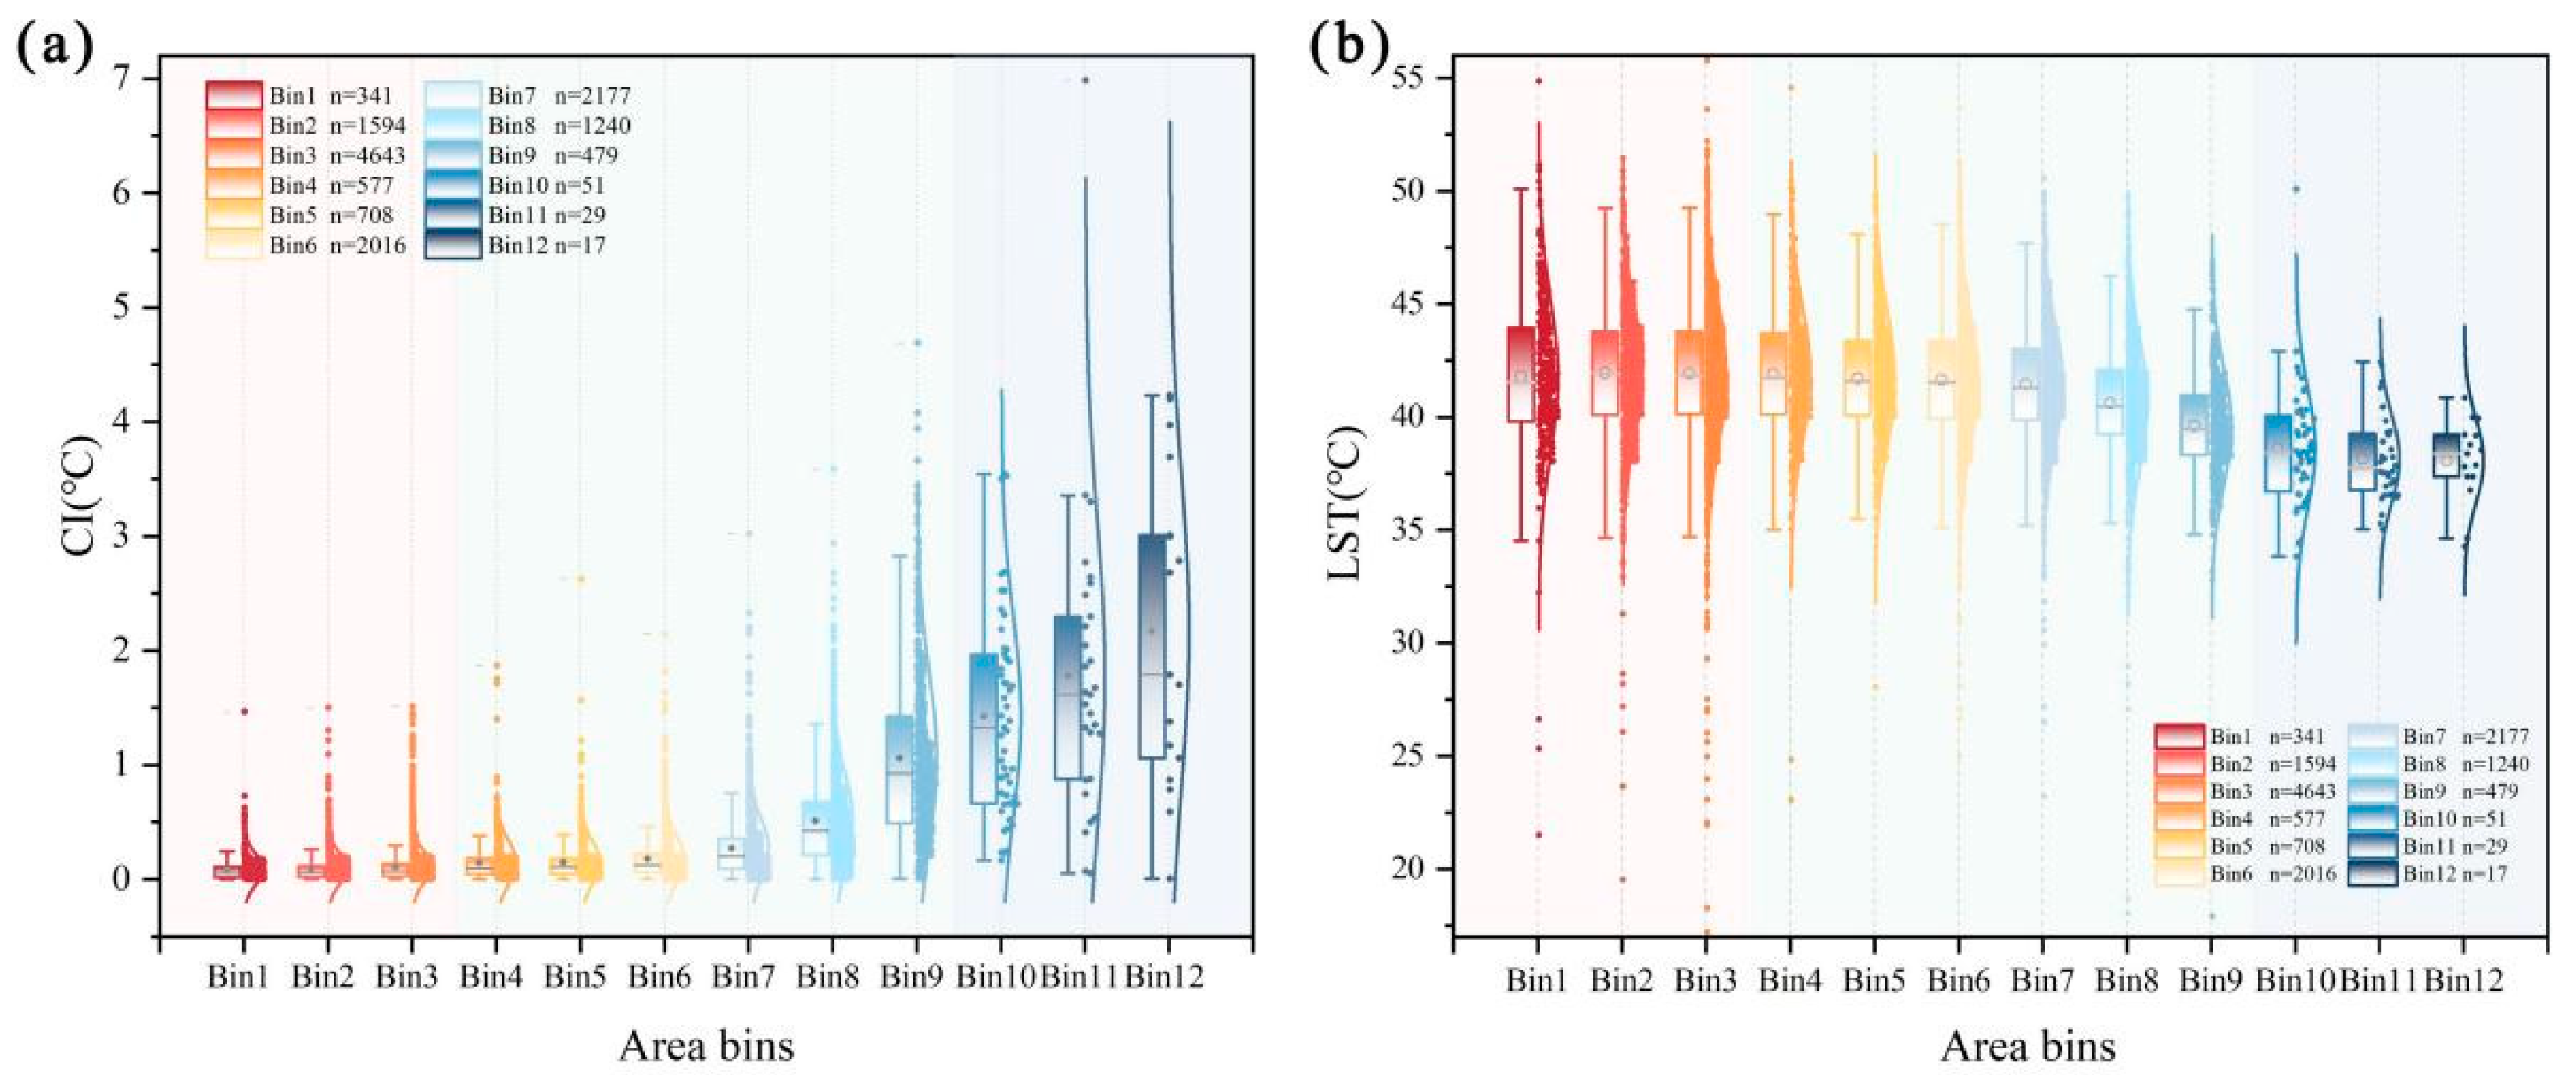
Figure 7 presents a combined boxplot and normal distribution curve for LST and CI, where a total of 13,872 UGS are categorized into 12 groups based on varying area sizes. LST follows a downward trend along the area gradient, decreasing from 41.79 ± 3.45 °C in Bin1 (<0.003 ha) to 36.07 ± 6.27 °C in Bin12 (>50 ha). CI exhibits an upward trend along the area gradient, increasing from 0.09 ± 0.13 °C in Bin1 (<0.003 ha) to 0.22 ± 0.35 °C in Bin12 (>50 ha). It is evident from the figure that the data for both LST and CI become more dispersed as the area increases, with larger standard deviations, supporting the notion of CI heterogeneity at different scales. Notably, the CI difference in Bin11 and Bin12 is particularly pronounced, ranging from a minimum of 0.05 °C to a maximum of 3.36 °C (excluding outliers). However, CI values greater than 0.05 °C are also observed in mid-scale (Bin4–Bin9) and small-scale (Bin1–Bin3) groups. Therefore, the variability of CI across different scales suggests a nonlinear relationship between CI and scale, highlighting the potential impact of landscape factors on CI.
3.3. Scale-Dependent Analysis of Urban Green Space Cooling Efficiency
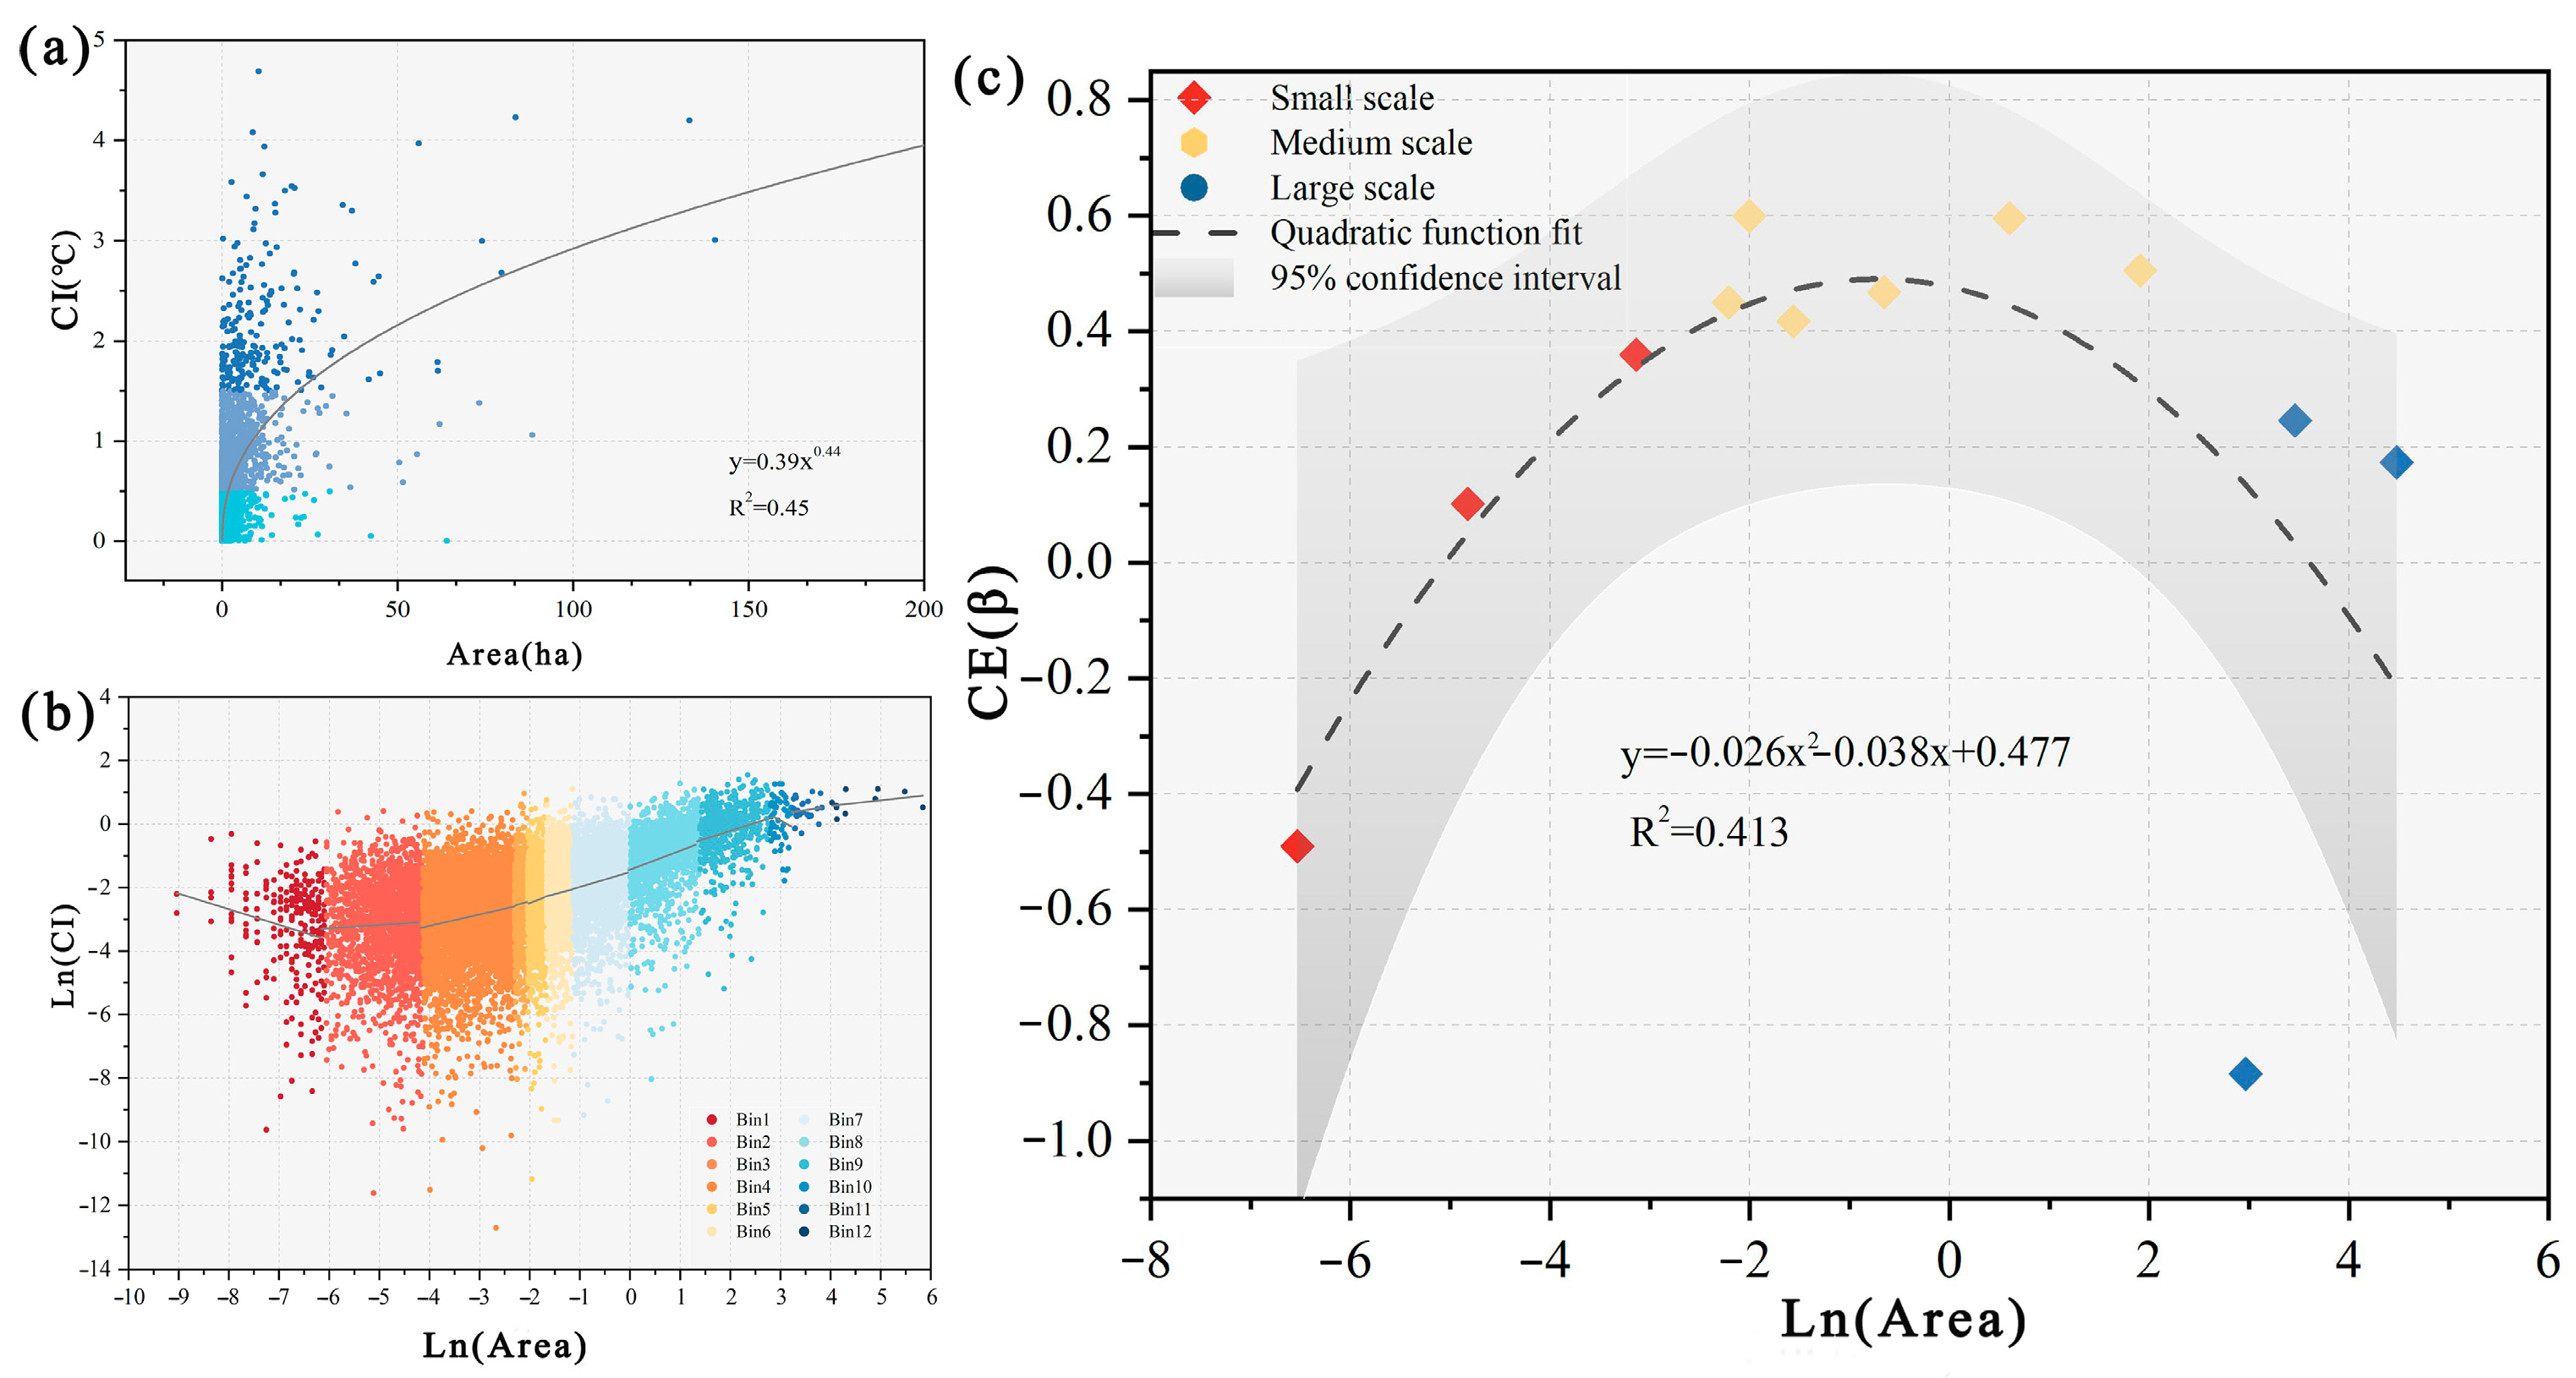
Figure 8a,b depict the relationship between CI and patch area. The results demonstrate that as the area increases, CI follows a power function (R
2 = 0.45). When the logarithms of both sides of the power-law function are taken, a nonlinear relationship between CI and area is revealed, suggesting considerable variation in the CE of green spaces across different scales. For small-scale (Bin1-Bin3) and large-scale (Bin10-Bin12) green spaces, the curve either gently rises or sharply declines. In contrast, at the medium-scale (Bin4-Bin9), the curve steepens, with the highest β value observed, indicating the maximum CE within the study.
Figure 8c illustrates the quadratic functional relationship between CE and the natural logarithm of area (Ln(Area)). The fitted equation is: −0.026(Ln(Area))
2 − 0.038Ln(Area) + 0.477 (R
2 = 0.413). Initially, the curve declines, followed by a rise to a peak before subsequently declining again. The initial decline and subsequent rise correspond to small-scale UGS (<0.1 ha) such as small parks, green belts, and neighborhood parks. During this phase, the slope of the Ln(CI)-Ln(Area) relationship transitions from negative to positive, although the positive correlation remains weak. CE values for Bin1–Bin3 range from −0.49 to 0.36, and the cooling effect is often closely linked to areas with human activity, directly improving local microclimates and significantly reducing the urban heat island effect. By contrast, the peak phase corresponds to medium-scale UGS (0.1–16 ha), including community green spaces and larger parks. It is worth noting that the variable n expressed below represents the number of plaques in each category. In this phase, the slope increases, with a prominent CE peak observed at 0.3–1 ha
(n = 708, CE = 0.60), demonstrating the potential for maximum CE. Based on the high degree of fit between UGS categories and the curve, Bin7 (0.3–1 ha) represents the category with the highest CE, indicating that medium-scale UGS offers the best cooling performance, with an optimal area threshold of 0.3–1 ha. The final declining phase corresponds to large-scale UGS (>16 ha), including greenbelt centers and nature reserves, where the slope becomes negative and further decreases. From Bin10 (
n = 51, CE = −0.88) to Bin12 (
n = 17, CE = 0.17), the marginal effects and internal microclimatic conditions of UGS areas suggest that overly large UGS do not continue to reduce their temperatures, leading to a gradual decrease in CE, which eventually levels off for large-scale UGS.
3.4. Analysis of Potential Landscape Factors Affecting the Cooling Effect of UGS
Based on the results of the stepwise regression analysis (
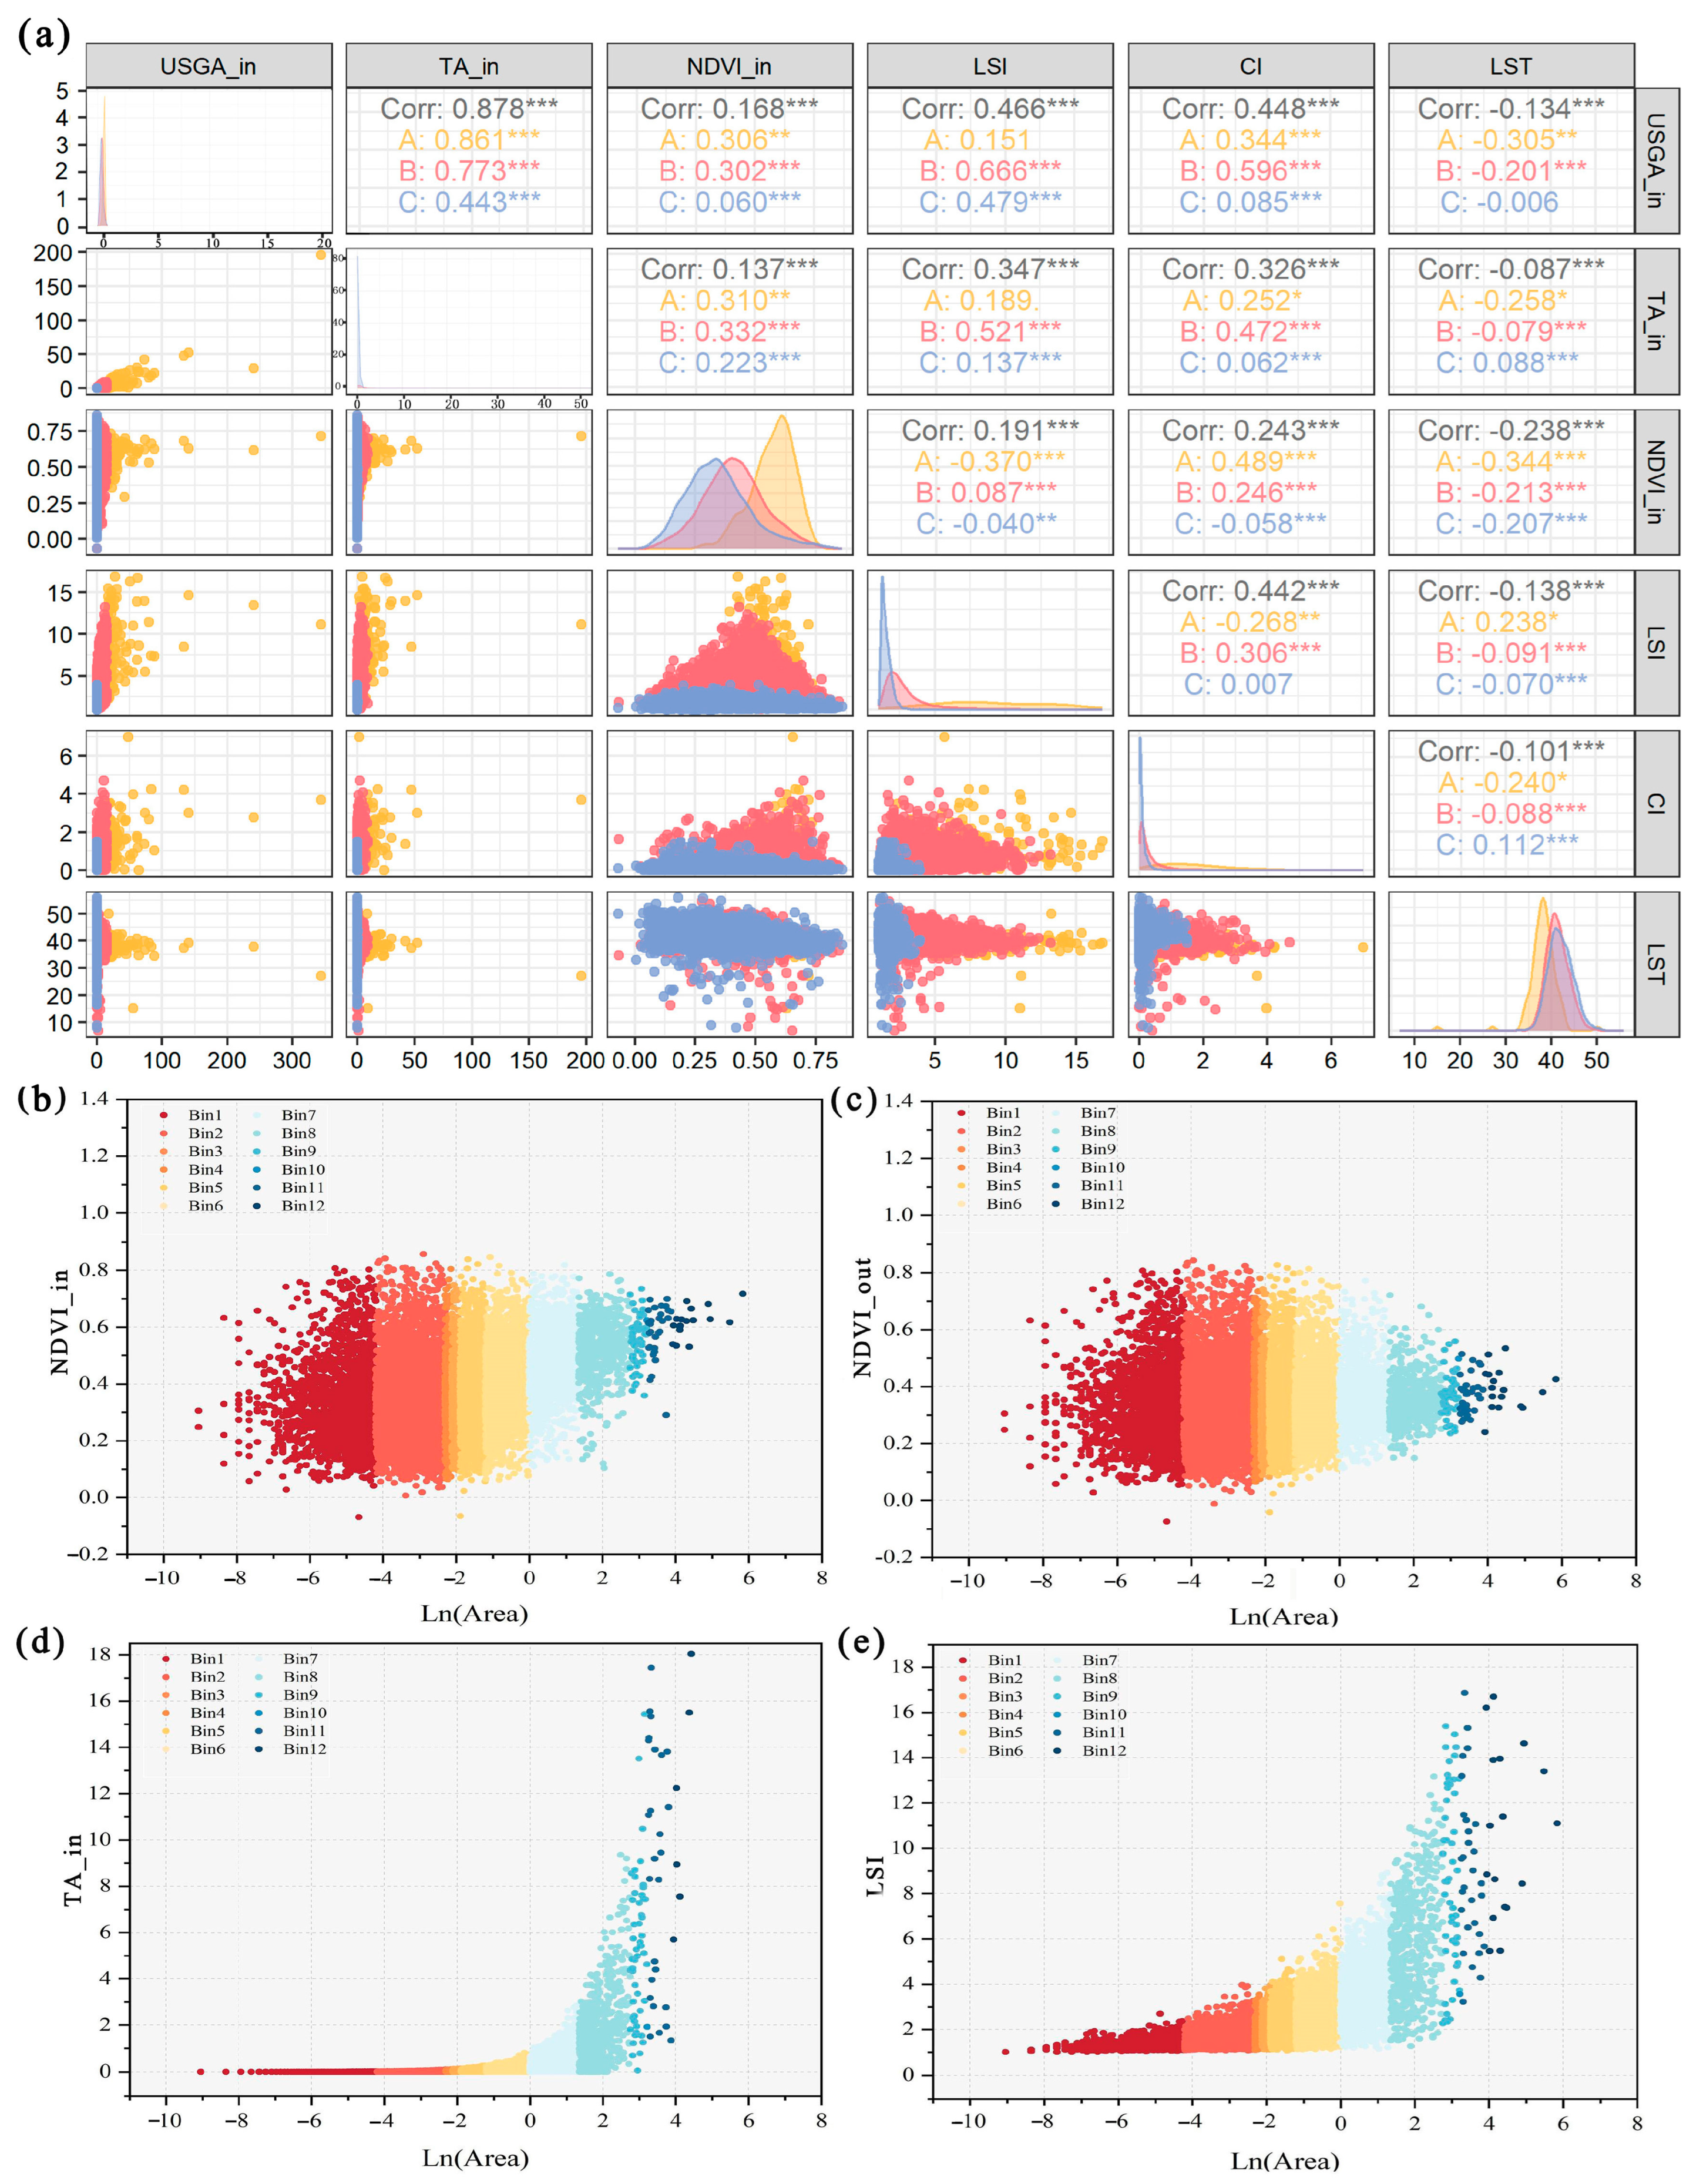
Table 4), NDVI_in and NDVI_out were identified as the primary factors influencing CI, with relative contributions of 32.34% and 29.65%, respectively. UGSA_in and TA_in contributed 18.48% and 8.07%, respectively. In contrast, external indicators such as AI, FRAC_MN, and UGSA_out, along with the internal indicator LSI, were of lower significance, each contributing less than 8%. Consequently, UGSA_in, TA_in, NDVI_in, and NDVI_out were selected for correlation analysis. As illustrated in the figure, UGSA_in was found to be negatively correlated with LST (Corr = −0.14) and positively correlated with CI (Corr = 0.45). Additionally, TA_in exhibited a positive correlation with CI (Corr = 0.33), indicating that as UGS area increases, the marginal effects on central areas gradually diminish, allowing tree canopies to develop more fully, resulting in greater coverage. This increased canopy coverage contributes to further reductions in temperature. Moreover, positive correlations between NDVI_in and NDVI_out with CI suggest that vegetation growth conditions and spatial arrangement within the UGS and its buffer zone play a significant role in enhancing the cooling capacity of UGS.
Figure 9a shows the correlation between influencing factors and their relationship with cooling intensity. The study presents scatter plots of the three most significant influencing factors against the natural logarithm of the area (Ln(Area)). These factors were selected based on their relative importance to the dependent variable, CI, as shown in
Figure 9b–d. Analysis of the internal and external normalized difference vegetation index (NDVI) revealed that both NDVI_in and NDVI_out display similar trends (
Figure 9b,c). Due to the distribution of vegetation within UGS, small-scale UGS exhibits low, widely dispersed values with large ranges, followed by a sharp increase at medium-scales, reaching relatively stable high values. At larger scales, the values become more concentrated, which could be attributed to the limited data samples available for larger UGS. Interestingly, as UGS area increases, the minimum values of NDVI_in and NDVI_out show an upward trend. However, their maximum values first increase and then decrease, with only minor fluctuations. This finding indicates that medium-scale UGS achieves higher vegetation density and quality, thereby providing a more favorable cooling environment, resulting in the optimal cooling effect [
16].
Furthermore,
Figure 9d demonstrates that as UGS scale increases, canopy cover increases significantly, reaching its maximum in large-scale UGS. This suggests that large-scale UGS contains diverse vegetation types, higher tree density, and adequate tree growth, with interlocking tree crowns forming continuous canopy coverage. Lastly, analysis of the additional factors listed in
Table 3 reveals that the landscape shape index (LSI) is positively correlated with CI (as shown in
Figure 9e), suggesting that more complex and diverse UGS shapes enhance the cooling effect by facilitating heat exchange between UGS and the buffer zone. The aggregation index (AI) is also positively correlated with CI, indicating that a dispersed layout of multiple patches has a stronger cooling effect. Increasing patch connectivity can mitigate surface temperature changes across the area. The mean fractal dimension index (FRAC_MN) shows a positive correlation with CI, as more complex boundary shapes result in stronger edge effects, allowing the cooling influence of UGS to extend into surrounding urban areas, thus lowering temperatures in adjacent regions. Additionally, UGSA_out is positively correlated with CI, indicating that UGS within the buffer zone exerts a significant influence on internal UGS temperatures. Lastly, water area (WA_out) is positively correlated with CI, suggesting that proximity to large bodies of water enhances cooling, as nearby water bodies help reduce land surface temperatures (LST), thus strengthening CI.
Figure 10 shows the characteristic green spaces with different cooling efficiencies corresponding to different features selected by the green space scale among all green spaces.
Table 5 corresponds to the characteristic indicators and cooling intensity of the green spaces in each graph.
3.5. Green Space Division of Medium-Scale Functional Areas
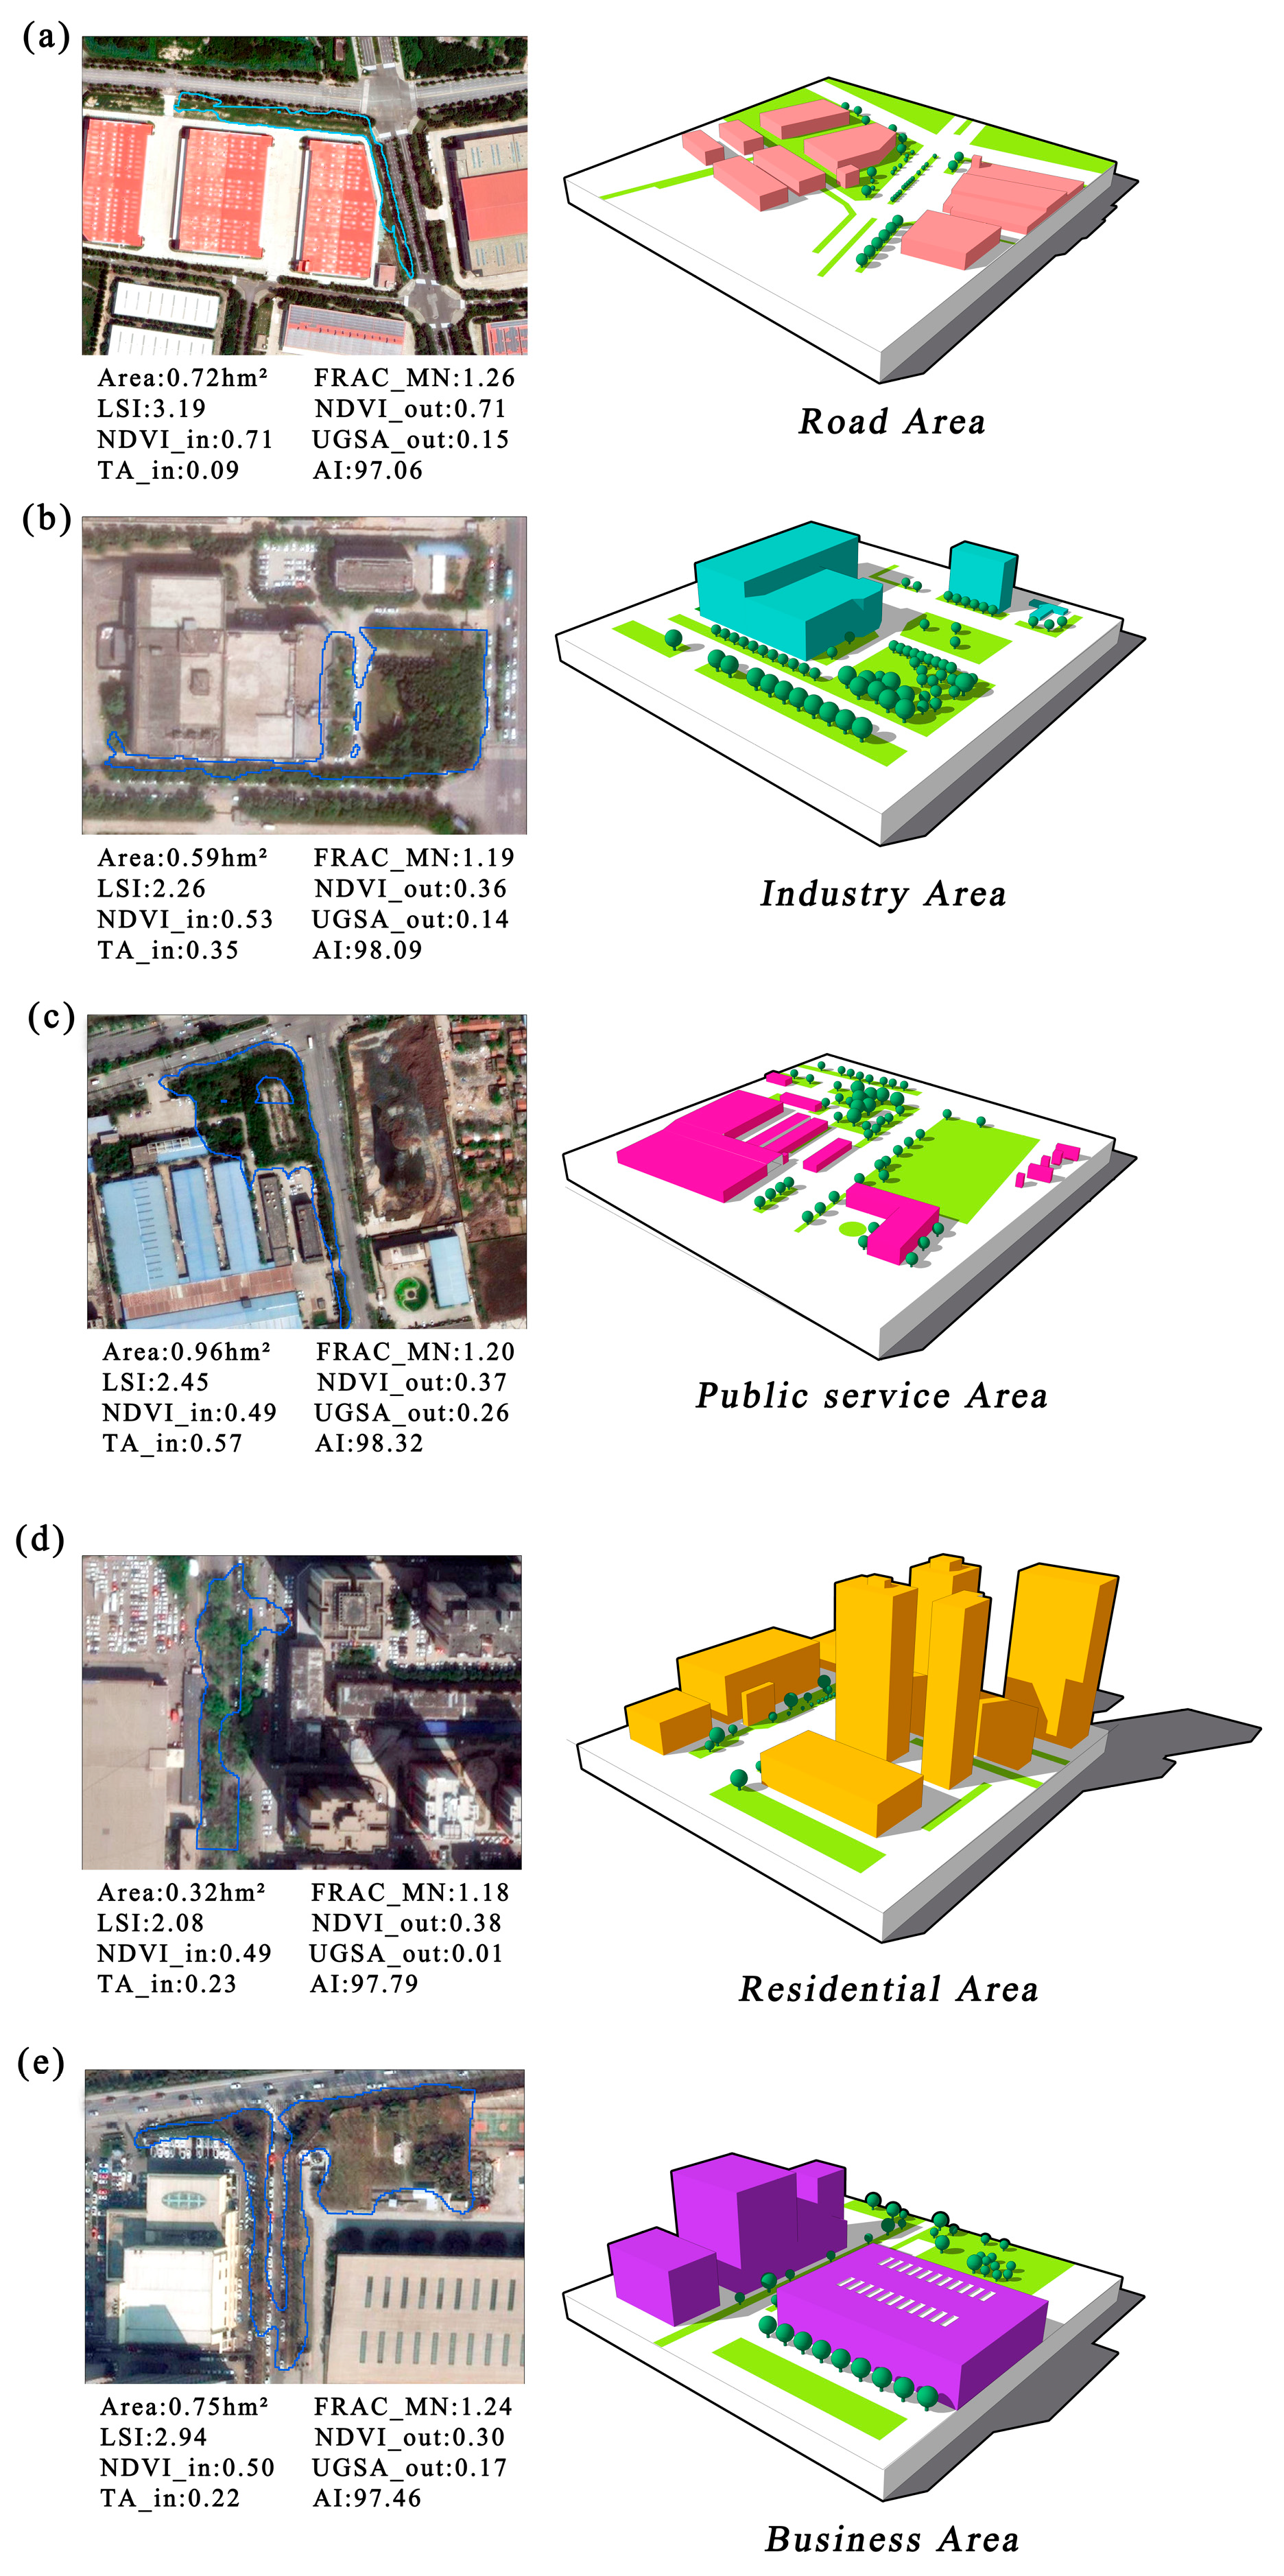
According to 2.7, we divide the UGS under the optimal CE threshold into five different green space functional areas. The corresponding maximum CI regional indicators, visualization pictures and model presentations of the five functional areas are shown in
Figure 11.
From the analysis of
Figure 12, it is evident that each functional area (roads, industrial zones, public service areas, residential areas, and commercial districts) demonstrates distinct patterns across the eight indicators on the x-axis. These variations exert a measurable influence on the CI within each functional area. Therefore, a detailed analysis of each functional area has been conducted in the following paragraphs.
In the road functional area, the average NDVI_in value is relatively high, indicating a substantial level of internal greening. The transpiration of vegetation, combined with its shading capacity and regulation of heat absorption and dissipation, significantly reduces local temperatures. AI exhibits relatively high values, suggesting that green spaces in road areas are more concentrated, thereby further enhancing their cooling effect. Moreover, FRAC_MN indicates a moderate level of patch shape complexity, implying that green spaces in road areas tend to be more regular in shape, with moderate complexity, thus exerting a limited influence on overall cooling. TA_in is relatively low, indicating that tree coverage within road areas is sparse, leading to a minimal impact on cooling. Both NDVI_out and UGSA_out display moderate values, suggesting that external greening around the road areas contributes to temperature regulation, although its impact is less pronounced compared to internal greening.
In industrial zones, FRAC_MN and AI are identified as the dominant cooling factors. Although the internal greening of industrial zones is moderate, the complexity of the green space shapes and their concentrated distribution result in a significant cooling effect. Notably, TA_in is relatively high, potentially due to efforts to mitigate the urban heat island effect and environmental pollution within industrial zones by retaining more green spaces and trees for temperature regulation. The low NDVI_out value indicates sparse external greening around industrial zones, limiting the influence of external factors on cooling. The moderate LSI value suggests that the shape of green spaces within industrial zones is relatively stable, contributing to a reduction in local temperatures.
In the public service area, the NDVI_in value is particularly noteworthy, indicating that abundant vegetation is present, which plays a critical role in regulating the temperature of the area. The relatively high FRAC_MN value suggests that the shape of green spaces in this area is somewhat complex. Such complexity may increase the surface area where green spaces interact with buildings, thereby enhancing their cooling effect. Furthermore, the elevated TA_in value indicates a significant level of tree coverage, further contributing to temperature regulation. In comparison to the previous two functional areas, the AI value here is moderate, indicating a relatively even distribution of green spaces. Although these green spaces are not as concentrated as in industrial zones, they exhibit a certain degree of clustering. The moderate values of NDVI_out and UGSA_out suggest that external greening around the public service area contributes to internal temperature regulation, although the effect remains limited. However, the low LSI value reflects that the shape of green spaces in this area is relatively regular, and the lower complexity has a weaker impact on temperature regulation.
In the residential area, both NDVI_in and NDVI_out values are high, indicating substantial vegetation coverage both internally and externally, resulting in superior cooling performance. The high AI value suggests a concentrated arrangement of green spaces, which helps reduce temperatures while providing a comfortable microclimate for residents. The TA_in value is moderate, indicating an average density of trees that aids in providing shade and cooling. Additionally, the FRAC_MN value points to a relatively complex patch shape, which may increase the interaction between green spaces and buildings, thereby improving CE. The LSI value is also high, reflecting the complex shapes of green spaces in residential areas, which could enhance the interaction between these spaces and buildings, further regulating the microclimate. Although UGSA_out is relatively low, indicating limited external greening, the internal greening within residential areas significantly contributes to the cooling effect.
An examination of the commercial area reveals relatively low NDVI_in and NDVI_out values, indicating minimal internal and external greening, which leads to weaker cooling effects. Although the AI value is high, suggesting that the green spaces within the commercial area are concentrated, this concentration is insufficient to significantly improve the overall cooling effect. In contrast, the high LSI value reflects a more complex shape of green spaces, which can mitigate some of the heat island effect. However, the low values of both TA_in and UGSA_out indicate that tree coverage and external greening have minimal influence on temperature regulation within the commercial area, suggesting that these external factors have a limited role in modulating cooling intensity.
4. Discussion
4.1. Scale Dependence of Urban Green Space Cooling Efficiency
This study focuses on the central district of Xi’an. In light of the accelerated pace of urbanization and the limited availability of land resources, the layout of UGS must be designed with a comprehensive consideration of the cooling effects of green spaces at different scales. The goal is to maximize the overall cooling effect within the constraints of limited land resources. Previous studies have predominantly focused on the CI of individual green spaces, while the scale dependency of CE has not been adequately quantified. In this research, a balance between UGS size and cooling effectiveness is identified. By analyzing the variation in the slope of the Ln(CI)-Ln(Area) relationship, it was observed that the quadratic function y = −0.026(Ln (Area))
2 − 0.038Ln(Area) + 0.477 (R
2= 0.413) indicates an increase in average CI of approximately 1 °C as UGS expands from 150 m
2 to 1000 m
2. When UGS increases from 0.12 hectares to 1 hectare, the average CI rises by approximately 3 °C. However, as the area increases further, from Bin9 (4–16 hectares) to Bin10 (16–25 hectares), the average CE increases by approximately 4 °C. Notably, it was found that the maximum CE occurs when UGS is between 0.3 and 1 hectare, which aligns closely with the findings of [
12]. Therefore, increasing the area at a medium scale provides greater cooling benefits than at smaller or larger scales.
The CE of UGS demonstrates a notable nonlinear dependence on scale, primarily resulting from variations in microclimate regulation mechanisms at different UGS scales. At smaller scales, UGS mainly provide cooling through processes such as evapotranspiration and shading [
45]. In contrast, larger-scale UGS not only rely on these mechanisms but also affect local airflow and heat conduction [
46], thereby intensifying their cooling effects. Nevertheless, the increase in UGS area does not lead to a proportional improvement in CE, which can be attributed to the intricate interactions between factors such as vegetation density, morphological complexity, and the configuration of surrounding buildings. Furthermore, the normalized difference vegetation index (NDVI), an indicator of vegetation health, plays a crucial role in enhancing CI within UGS [
47]. To optimize CE, increasing investments in management and irrigation to improve the NDVI of UGS is recommended. Such a strategy can help achieve stronger and more sustainable cooling effects in urban environments.
In
Figure 6c, an outlier is identified in the CE of Bin10 (16–25 hectares) UGS, represented as a discrete point, which indicates a decline in cooling performance. This negative correlation in such UGS can be explained by four factors:
(1) Marginal Effect: The principle of diminishing marginal returns, a well-established concept in economics, is also relevant in the landscape planning and management of blue-green systems. For green spaces, a minimum area is necessary to sustain cooling effects; however, once a marginal utility threshold is surpassed, CE declines, representing a trade-off [
48]. The marginal cooling effect of urban UGS fluctuates as the area increases, typically peaking at mid-scale to maximize cooling performance. Therefore, optimizing the cooling effects and ecological benefits of UGS requires a holistic approach, considering the function, shape, and spatial coverage of the green space.
(2) Green Space Shape and Landscape Layout: UGS smaller than 16 hectares generally have a more regular shape (LSI < 2.4) and a compact layout, which enhances their CE. Conversely, larger UGS tend to exhibit more complex shapes and landscape configurations [
20], where larger, aggregated, and more intricate patches improve cooling performance, thereby creating a more stable cooling zone [
49]. Upon examining UGS between 16 and 25 hectares, it is evident that irregular shapes and dispersed layouts contribute to reduced CE, signaling the need for improvement in their cooling performance.
(3) Microclimate within UGS: In smaller UGS, there is a significant temperature contrast between the green space and the surrounding buffer zone, resulting in higher CE. In contrast, larger UGS develop more independent internal microclimates that are less affected by external climate conditions, enabling them to effectively reduce temperatures both inside and outside the green space, thus enhancing overall cooling performance. However, for UGS between 16 and 25 hectares, while the area increases, it has not yet reached a size that allows for the development of a sufficiently large internal microclimate zone. Consequently, internal temperature regulation remains relatively uniform, making them less effective at cooling compared to both smaller and larger UGS.
(4) Impact of Human Activity: The CE of urban UGS is also significantly affected by human factors, such as changes in land use and the intensity of urban activity, which can alter local microclimates and reduce the effectiveness of green spaces in mitigating heat. Human activities, including traffic, industrial processes, and heat generated from building materials, often counteract the cooling effects of vegetation [
50,
51], thereby diminishing the overall cooling capacity of UGS.
4.2. The Impact of the Vertical Structure of Urban Green Space on the Cooling Effect
In addition to the scale of UGS, its vertical structure—including canopy coverage and tree height—plays a crucial role in influencing cooling effects [
52]. In Xi’an, where urban land resources are becoming increasingly constrained, an effective strategy for enhancing cooling effects is the optimization of the vertical structure of UGS by increasing the presence of tall trees and enhancing vegetation density. Furthermore, in accordance with the policies introduced in Xi’an that promote vertical greening, the cooling function of urban UGS can be significantly strengthened.
This paper focuses primarily on the impact of canopy coverage within the vertical structure of UGS on cooling effects. Previous studies have indicated that smaller UGS typically have lower canopy coverage. This is due to the limited space available, which restricts the number of trees and their growth potential, preventing the formation of a high-density canopy. However, as the area of UGS expands, canopy coverage tends to increase significantly. Medium UGS generally accommodate more large trees, and with the additional space, optimal tree spacing encourages the expansion and overlap of canopies, thereby increasing overall canopy coverage [
53]. Interestingly, this study found a positive correlation between increasing UGS area and canopy coverage. Nevertheless, previous research suggests that the effect of canopy coverage on CE reaches a critical threshold, beyond which further increases in canopy coverage do not result in proportional cooling gains. In fact, studies by [
27,
54] observed that once canopy coverage exceeds 70%, the cooling effects begin to taper off. However, this phenomenon was less evident in the present study, potentially due to a limited sample size. The critical threshold for canopy coverage varies across different studies, typically ranging from 40% to 70%. When canopy coverage reaches this level, the cooling effects of UGS are most pronounced. For instance, [
55] found that CI within parks begins to decrease when canopy coverage exceeds 0.55. Similarly, in highly dense urban areas, research conducted by [
56] demonstrated that the most effective cooling occurs when canopy coverage is between 40% and 50%. Consequently, the optimal canopy coverage for improving urban microclimates may differ from city to city. As UGS areas increase, canopy coverage generally rises, but this relationship is influenced by various factors such as UGS shape, edge effects, management practices, and vegetation density. To maximize canopy coverage, expanding the area of UGS is essential, but optimizing the shape, arranging vegetation appropriately, and improving management techniques are equally critical. The vertical structure of UGS plays a multifaceted role in enhancing the CE of urban green spaces. In addition to directly lowering temperatures through physical processes such as shading and evapotranspiration, vertical structures also improve cooling by facilitating better air circulation and reducing heat accumulation. Attention to vertical structure design and implementation in urban planning and green space management can significantly enhance the overall cooling effectiveness of UGS [
57].
4.3. Inspiration for Urban Green Space and Landscape Design
Many studies indicate that patch size is a critical characteristic determining the cooling effect of UGS. A positive correlation between patch size and cooling effect has also been established [
58]. However, it was found by [
12] that although the cooling effect generally increases with patch size, there exists an efficiency threshold (TVoE). This means that once the size of green patches reaches a certain threshold, their CE begins to decrease [
59].
At the UGS patch level, the present study first validates results found in numerous prior studies, demonstrating that patch size and NDVI are positively correlated with CI intensity. Additionally, a positive correlation between the complexity of landscape patches and the CI of UGS is indicated, which contrasts with previous research findings [
60].
Secondly, the layout and vegetation types of green space functional zones significantly affect the cooling performance of UGS. This study investigates the potential factors influencing the cooling effects under optimal green space areas for mid-scale cooling. These findings can serve as a reference for effectively enhancing the cooling capabilities of UGS. Based on the analysis in
Section 3.4, the following layout strategies for UGS are proposed. These strategies consider the unique characteristics and key factors of each functional zone, with the goal of improving the city’s overall cooling capacity through appropriate vegetation coverage, green space configuration, and optimized landscape morphology.
In road functional zones, the vegetation density (TA_in) is relatively low. Although some greenery is present along the roads, it is insufficient to generate a substantial cooling effect. To address this, several strategies can be implemented. First, increase the number of green belts and tree plantings along the roads. Planting tall trees on both sides of the road and enhancing the greening of central median strips can improve both NDVI_in and TA_in. Second, optimize the density and layout of the greenery. While the high aggregation index (AI) in road areas suggests a concentration of green spaces, the current NDVI_out and UGSA_out indicate only moderate cooling performance, meaning external greenery contributes little to the overall cooling effect. Therefore, it is necessary to establish more public green spaces to improve connectivity within road green spaces. Third, optimize the shape and complexity of landscape patches. The relatively simple shapes of green spaces, as indicated by the FRAC_MN, suggest that introducing more complex and irregular landscape designs could enhance microclimate regulation.
In industrial zones, temperature regulation is influenced by both NDVI_in and TA_in. Although the concentration of green spaces helps mitigate high temperatures to some extent, there is still significant room for improvement. First, internal greening should be enhanced to further elevate environmental quality. While NDVI_in levels in industrial areas are moderate, they can be increased by integrating more green spaces within factory premises or by creating small green areas between buildings. Second, the relatively high TA_in reflects a notable presence of trees, which should be preserved and gradually interconnected to improve canopy continuity [
61]. Additionally, the establishment of green buffer zones around industrial areas could significantly alleviate the thermal impacts of industrial activities on the surrounding environment. Furthermore, increasing the complexity of green space shapes by incorporating diverse, irregularly shaped spaces would boost edge effects, thereby improving the CE.
Public service zones exhibit relatively strong vegetation coverage and a high FRAC_MN value, suggesting that internal green spaces are complex in shape. This complexity contributes to their effective cooling performance. Future optimization should prioritize enhancing external greening by adding more green spaces around the zone to improve connectivity with the surrounding environment and develop a regional ecosystem. These ecological spaces can create networks that link various public service facilities, offering more comfortable areas for public activities while mitigating the urban heat island effect.
In residential areas, the shape complexity of green spaces is relatively high, yet both NDVI_in and NDVI_out still offer room for further optimization. Strengthening internal and external greening and enhancing the connectivity of UGS would reinforce the cooling effect, even though NDVI_in is already relatively high. It is recommended to increase the number of trees and public green spaces within residential zones while ensuring natural connections between these spaces to form a green network [
62], which would reduce temperatures and improve the overall comfort of the living environment.
In commercial zones, AI performance is relatively strong, while the greening levels of NDVI_in and NDVI_out are moderate. However, both FRAC_MN and LSI are underperforming. To enhance CE, the complexity of urban green space shapes should be moderately increased to maximize edge effects. Additionally, while maintaining the current levels of TA_in and greening, the complexity of green space shapes should be further developed to boost cooling intensity.
From the perspective of overall urban planning, future research on layout strategies for functional zones should focus on creating a cohesive urban green space network to enhance the connectivity of green spaces and vegetation coverage across different zones. A key consideration is the construction of urban ecological corridors [
63], connecting green spaces in roads, residential areas, and public service zones to form a city-wide ecological network. This would ensure continuity of green spaces between functional zones and improve the city’s overall cooling capacity. Additionally, promoting rooftop and vertical greening is an effective method for further enhancement. In densely built areas, such as commercial and industrial zones, the implementation of rooftop and vertical greening [
64] not only maximizes the use of limited space but also significantly boosts CE and mitigates the urban heat island effect.
4.4. Mechanisms and Influencing Factors of Cooling Effects of Medium-Scale Urban Green Spaces
This study demonstrates that medium-scale UGS exhibit the most pronounced cooling effects, indicating that size, vegetation cover, and edge complexity are critical factors influencing their cooling efficacy. This conclusion is consistent with findings from related studies, reinforcing the nonlinear relationship between the size of green spaces and their cooling effects. Research has shown that the canopy coverage of green spaces directly affects their cooling effectiveness, particularly as UGS with strong evapotranspiration and shading effects typically exhibit higher cooling efficiency [
65]. Medium-scale UGS are likely to provide adequate canopy coverage while maximizing edge effects, thereby enhancing heat exchange efficiency. The impact of edge complexity has been corroborated by numerous studies, suggesting that complex edges of green spaces often contribute to increased cooling capacity [
66,
67]. Additionally, the diminishing influence of human activities on the cooling effects of green spaces warrants attention. Existing research indicates that high-intensity human activities, such as traffic and industrial processes, can weaken the cooling effects of green spaces by increasing heat emissions and reducing the efficiency of green space utilization [
68,
69]. This suggests that in areas characterized by intense human activities, the cooling capacity of green spaces may be compromised. Consequently, medium-scale green spaces may serve a more significant cooling function in functional zones with relatively lower levels of human activity.
To further validate these conclusions, comparisons with empirical data from cities exhibiting similar climatic conditions are essential. By analyzing canopy coverage, human activities, and their respective impacts on cooling effects across various cities, a deeper understanding of these factors’ roles in different urban environments can be achieved. Previous studies have indicated that in other cities with comparable climatic conditions, vegetation density is closely linked to the cooling effects of urban green spaces, influenced by the characteristics of the surrounding urban environment [
67]. Therefore, future research should consider comparative studies across multiple cities to further investigate the combined effects of green space size, vegetation cover, and human activities on cooling effects, thereby providing more universally applicable insights for optimizing urban green space layouts.
4.5. Limitations and Future Research Directions
This study contributes to the literature in several key ways. First, it not only assesses the CE of UGS but also accounts for the landscape factors that influence the cooling effect of UGS in urban areas. This comprehensive approach enables a more accurate evaluation of the optimal scale at which UGS achieves maximum CE. Second, the study identifies green land use types that correspond to the most substantial cooling effects at the medium-scale. A new framework is introduced for calculating CE, which examines the power-law relationship between CI and the UGS area. Additionally, a novel method for adaptively calculating the area of buffer zones surrounding green spaces is proposed. These findings are significant for urban planners in selecting the appropriate scale and green land use types for UGS to mitigate urban heat island effects.
Nonetheless, several limitations are present in this study. First, the 30 m resolution of Landsat imagery used to describe smaller UGS may be insufficient, as the lower resolution might not fully capture finer details. The absence of higher-resolution remote sensing data restricts the precision of the results. Second, while different types of green spaces exhibit varying cooling effects, which is useful for cooling assessments and urban green space management, this study does not explore optimal green land use types across all scales due to the large data size and lack of detailed data sources. Third, the study’s reliance on background temperature presents a challenge. Variability in remote sensing imagery across different years may introduce inconsistencies in background temperatures. Since UGS cooling effects are sensitive to changes in background temperature [
70], future studies should integrate multi-source data and conduct comparisons within the same time frame to reduce background temperature dependency. Furthermore, the limited selection of landscape factors may have excluded significant indicators that impact on the cooling efficiency of UGS, such as the presence of internal vegetation, water bodies, airflow, wind speed, and anthropogenic heat emissions, potentially introducing uncertainties in the results.
This study emphasizes the importance of addressing both the advantages and disadvantages of the proposed method. A novel framework for analyzing the cooling capacity of UGS has been developed. A primary advantage of this framework is its scale-dependent approach to evaluating CI and CE, which effectively captures the nonlinear relationship between cooling effects and distance, thereby enhancing modeling and prediction capabilities. However, a notable disadvantage is that this method may neglect the complexity of regional characteristics, which could reduce its applicability in specific environments. Such environments may encompass variations in urban structure, land use types, climatic conditions, and topography. For example, cooling effects in dense urban areas may differ from those in suburban regions, and seasonal variations may further influence cooling efficiency. Consequently, the applicability of power-law relationships may be restricted in these contexts. Furthermore, the newly proposed area-adaptive method defines buffer zones that accurately reflect the actual cooling needs of different areas, improving the precision of spatial analysis. Nevertheless, this method may also increase computational complexity and necessitate more input data, presenting challenges for implementation in regions with data scarcity.
In future research, it is important to consider the more nuanced factors influencing the types and layouts of vegetation within UGS as well as other external human activities. Moreover, the incorporation of refined climate models is necessary to further quantify the cooling contributions of different types of green spaces under various environmental conditions. The CE of UGS are significantly influenced by human factors, such as changes in land use and the intensity of urban activity, which can alter local microclimates and diminish the effectiveness of green spaces in mitigating heat. Human activities, including traffic, industrial processes, and heat generated from building materials, often counteract the cooling effects of vegetation, thereby reducing the overall cooling capacity of UGS. Customized approaches that address specific urban planning needs, particularly within the context of Xi’an, are essential for the development of more practical and feasible urban cooling strategies. Consequently, a primary objective of future work should be to refine these methods to ensure their applicability to urban planning and climate adaptation initiatives in Xi’an and similar cities. Finally, further research should explore ways to optimize the layout and management of UGS to maximize their cooling effects and ecosystem services, while promoting sustainable urban development.
5. Conclusions
As global climate change progresses, cities are increasingly confronted with frequent and severe high-temperature weather and heatwave events. Appropriately scaled green spaces can effectively alleviate the UHI effect in the short term while also serving as a buffer for long-term climate change adaptation. This study focuses on 25,594 UGS in Xi’an, with sizes ranging from 11.8 m2 to 343 hm2. The results indicate that 5922 UGS (59.20%) exhibit a “cool island effect”, highlighting their potential to mitigate UHI. Notably, significant differences are observed in the cooling effects of UGS across various scales, with the cool island effect demonstrating a nonlinear increase as the size of UGS increases. The quadratic relationship between CI and UGS area suggests that medium green spaces possess considerable cooling efficiency, playing a crucial role in alleviating the urban heat island effect.
Moreover, the discussion on canopy cover within urban green spaces offers critical insights for understanding and optimizing the structure and function of urban forests. Canopy cover not only reflects the ecological contributions of green spaces to urban forests but also illustrates the synergistic effects between the two in regulating climate. In summary, this study provides valuable insights into the appropriate scaling of green spaces for ecosystems and the rational utilization of functional area factors to enhance cooling efficiency, offering feasible strategies for guiding urban landscape design aimed at mitigating heat island effects.
Future research should place increased emphasis on the types of vegetation present within UGS and the influence of external human activities. Refined climate models are to be integrated in order to address existing methodological shortcomings, while universal methods suitable for quantifying the cooling effects of UGS and calculating buffer zones should be explored. Ultimately, a more precise quantification of the cooling contributions from various types of green spaces under diverse environmental conditions is required. It is important to note that high-resolution satellite imagery was employed in this study instead of higher-precision drone data. This decision was primarily driven by the significant volume of data and the complex processing steps associated with drone data, which could potentially compromise the feasibility of the research. Future investigations may integrate higher-precision data to further refine the conclusions drawn in this study. Ultimately, optimizing the allocation of green spaces through scientific planning and management strategies within the constraints of limited urban areas will represent an important direction for future studies.
