Abstract
Increased wildfire activity is the most significant natural disturbance affecting forest ecosystems as it has a strong impact on their natural recovery. This study aimed to investigate how burn severity (BS) levels and climate factors, including land surface temperature (LST) and precipitation variability (Pr), affect forest recovery in the Middle Volga region of the Russian Federation. It provides a comprehensive analysis of post-fire forest recovery using Landsat time-series data from 2000 to 2023. The analysis utilized the LandTrendr algorithm in the Google Earth Engine (GEE) cloud computing platform to examine Normalized Burn Ratio (NBR) spectral metrics and to quantify the forest recovery at low, moderate, and high burn severity (BS) levels. To evaluate the spatio-temporal trends of the recovery, the Mann–Kendall statistical test and Theil–Sen’s slope estimator were utilized. The results suggest that post-fire spectral recovery is significantly influenced by the degree of the BS in affected areas. The higher the class of BS, the faster and more extensive the reforestation of the area occurs. About 91% (40,446 ha) of the first 5-year forest recovery after the wildfire belonged to the BS classes of moderate and high severity. A regression model indicated that land surface temperature (LST) plays a more critical role in post-fire recovery compared to precipitation variability (Pr), accounting for approximately 65% of the variance in recovery outcomes.
1. Introduction
Monitoring wildfires and the post-fire forest structural response is increasingly important for understanding their recovery potential as it strongly impacts ecosystem processes, regional carbon cycling, biodiversity, and climate change [1,2]. It is also essential for detecting spatial and temporal changes in forest ecosystems and developing nature-based solutions aimed at sustainable forest management [3]. This is particularly significant as large wildfires are becoming more frequent worldwide [4]. Effective monitoring and the reliable estimation of post-fire forest recovery in relation to burn severity and climate change indicators [5,6] can also aid in rehabilitation measures and prevent undesired forest species succession [7,8]. Therefore, there is a need for research efforts that focus on a comprehensive understanding of post-fire forest recovery for the professional forestry community.
A recent literature review and critical evaluation indicates that a broad range of studies have been conducted to monitor and assess the spatio-temporal patterns in post-fire forest recovery [9,10,11,12]. Most of these studies use satellite images and remote sensing techniques for characterizing and modeling post-fire vegetation recovery at local and regional levels [13,14,15,16,17]. Many researchers utilize multitemporal imagery from sensors like Moderate Resolution Imaging Spectroradiometer (MODIS), Landsat-series, SPOT-series, and Sentinel MSI due to their high temporal resolution and free access to archived data [18,19,20,21]. Various remote sensing products have been utilized to assess vegetation recovery trajectories over large territories. This has primarily been achieved by estimating spectral indices, such as the Normalized Difference Vegetation Index (NDVI), the differenced Normalized Burn Ratio (dNBR), the Enhanced Vegetation Index (EVI), the Leaf Area Index (LAI), and Fractional Vegetation Cover (FVC), due to their theoretical simplicity and efficiency [22,23,24,25,26,27]. The use of such spectral indices is ultimately based on establishing pre-fire baselines on the forest cover of remote sensing images in order to compare with the patterns of post-fire recovery.
Some researchers have found a significant correlation between the vegetation restoration following wildfires and meteorological factors such as precipitation and temperature [28,29,30,31]. The topography (e.g., slope, altitude, and elevation) of a forest burnt area may influence surface evapotranspiration following a wildfire, which can also impact the rate of vegetation restoration in various spatial patterns [32,33,34,35]. Numerous studies have attributed the modeling of forest recovery trajectories and regeneration rates to other significant factors such as species-specific vegetation type, soil type, rainfall, and drought [36,37,38,39].
Comprehensive studies have shown that forest recovery heavily depends on the magnitude (burn severity) of the wildfire regime. In general, the BS is typically classified based on the extent of vegetation that is damaged or consumed by the wildfire [40]. A low-severity fire mostly burns the understory vegetation and leaves most of the trees intact, whereas a high-severity fire is akin to a crown fire, which devastates the majority of the trees and other understory species. In ecosystems with mixed coniferous trees, high-severity wildfires often lead to increased post-fire tree mortality, poor regeneration of young trees, and contrasting tree cover, and it may take decades for forest conditions to fully recover [41,42,43,44]. Following a high-severity wildfire, some coniferous ecosystems may not be able to recover to their original state and may shift toward forests with broadleaved species or systems dominated by shrubs [45,46,47]. Other studies indicate that fire-adapted tree species will actively regenerate following a severe wildfire due to the complete disruption of the forest overstory and loss of dominance within the ecosystem [48,49].
Monitoring the state of forest cover requires processing large amounts of geospatial data, which is limited by the available storage and computational resources. Recently, Google Earth Engine (GEE), a cloud-based big data processing platform, has offered users efficient operation and suitability for parallel computing of such data [50]. The platform offers a range of services, including web apps, machine learning tools, mapping, and visualization of geospatial data, along with access to a multi-petabyte collection of remotely sensed imagery, climate–weather, and geophysical datasets [51,52]. Numerous change detection algorithms have been created for the GEE and extensively employed in evaluating forest cover dynamics on an annual time scale [53,54,55]. One of these algorithms is the Landsat-based spectral change detection method called Trends in Disturbance and Recovery (LandTrendr). It implements a temporal segmentation approach to divide time-series spectral indices into linear sequential segments [56,57]. By designating a segment as disturbance, recovery, or stable, LandTrendr offers annual-scale information about the change event in vegetation cover dynamics based on the direction of spectral change [58].
In the last few decades, the LandTrendr algorithm has been widely used in different regions to characterize forest disturbances and recovery [59,60,61,62,63]. For example, in western North America from 2000 to 2007, the burnt area recovery varied across different forest types, with intermediate rates found in mixed conifer and the slowest rates found in ponderosa pine stands [64]. In subtropical China, an analysis of forest cover dynamics from 1986 to 2019 using the LandTrendr approach revealed an overall increasing trend. The mean annual forest gain rate was found to be 1.7% [65]. In the Greater Khingan Mountains of China, a comprehensive methodology was utilized, integrating LandTrendr and random forests (RF) models to monitor the patterns of forest disturbance and recovery from 1987 to 2021, achieving an overall accuracy of 0.86 [66]. A LandTrendr time-series analysis conducted over the last 30 years (1990–2020) in humid tropical forests of Madagascar revealed that the main factors influencing disturbance and forest recovery were the complex interactions among biotic, abiotic, and historical land-use data [67].
Several studies have examined the dynamics of forest recovery following wildfires in various ecosystems and regions of the Russian Federation. The majority of these studies investigated the Siberian forest ecosystems [28,68,69]. The studies have revealed differences in how forest fire regimes respond to climate change and the inconsistencies in forest recovery across different regions of the Russian Federation. For example, estimates of the NDVI and NBR dynamics in burned ecosystems of north–central Siberia indicate that the average time for vegetation recovery ranges from 20 to 25 years, with the recurrence of wildfires and high severity significantly prolonging this process [44]. According to other research findings, a substantial shift toward young fire-enduring forests (mainly consisting of birch and aspen) may occur in the southern and mid-taiga regions due to moderate and extreme climate warming along with increased wildfire activity [47].
The Middle Volga region, situated in the Volga Federal District, is recognized for its extensive forest cover, ranking it as one of the most heavily forested areas in the European part of the Russian Federation (http://www.fedstat.ru, accessed on 16 September 2024). In recent decades, this region has undergone significant transformations in forest gains and losses, and it has been influenced by intensive forest management practices (such as harvesting and intermediate cuttings), reforestation efforts, and various disturbances, including forest fires, droughts, and outbreaks of insects and diseases. The recent wildfires have had multiple environmental consequences, including fragmentation of forest ecosystems, disturbances of the hydrological cycle, and adverse effects on the functioning and resilience of ecosystems [70,71]. A comprehensive assessment of forest cover in the Republic Mari El, carried out under the Northern Eurasia Land Cover Dynamics Analysis (NELDA) project (https://www.fsl.orst.edu/nelda/, accessed on 16 September 2024), found that approximately one third (34,228 ha) of the forested area that burned in 2010 was situated within pine plantations (Pinus sylvestris) that had been established following a severe forest fire in 1972 [72].
Despite a number of the abovementioned studies, the spatio-temporal distribution of the forest recovery on BAs in the Middle Volga region remains understudied. The objective of this study was to examine whether the BS and climate factors (LST and Pr) influence forest recovery. The study combined a Landsat time-series NBR with post-fire ground-truth data for a BA in the Middle Volga region of the Russian Federation after wildfires that occurred in the years 2002, 2006, 2009, 2010, 2014, 2017, and 2022. The NBR time series covered the post-fire period and was combined with pre-fire data to determine potential forest cover conditions before the wildfire. Specifically, the study intended to (I) characterize the spatio-temporal trends and magnitude of the forest recovery over a 20-year period, (II) determine the statistical difference in post-fire forest recovery within three levels of the BS, (III) analyze the trends of the forest recovery using a suite of spectral metrics, and (IV) analyze the effect of climatic factors on forest recovery.
Previous studies employing time-series data to characterize annual trends in wildfires and forest recovery have not considered this region of the Russian Federation. In this context, the unique contribution of this research was its comprehensive approach, which integrated spatio-temporal, climatic, and BS-level factors using a modern cloud-based remote sensing data processing platform to enhance our understanding of post-fire recovery dynamics in the large western part of the country.
2. Materials and Methods
2.1. Study Area
The study area encompassed the Middle Volga region of the Russian Federation, including Nizhegorodskaya and Kirovskaya oblasts, as well as the Republics Mari El, Tatarstan, and Chuvashia (ranging between 54.89556 N and 58.08659 N in latitude and 42.47314 E and 51.54785 E in longitude; Figure 1). This region is situated in the central part of the East European Plain. According to the national system of silvicultural zones (https://docs.cntd.ru/document/902268260?marker=6540IN, accessed on 16 September 2024), the northern part of the study area is classified as belonging to the South Taiga region of the European part of the Russian Federation, while the central and southern parts are considered as coniferous–deciduous (mixed) forests (Figure 1).
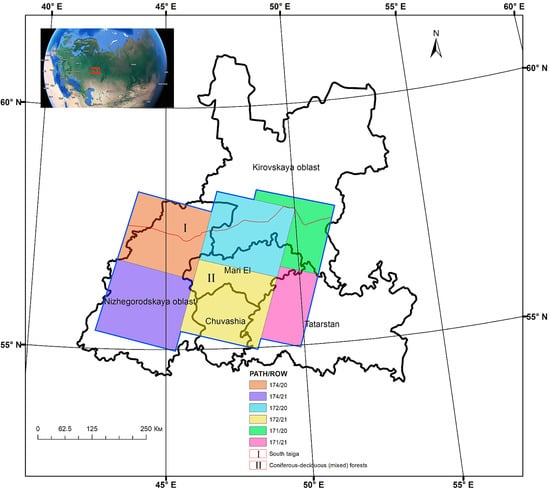
Figure 1.
Geographical distribution of the study area in the western Russian Federation on the Landsat scenes.
The topography of this region ranges from plains to hilly areas, with elevations between 45 and 316 m above sea level, predominantly featuring Podzols soils. The climate is classified as moderate–continental, exhibiting relatively stable weather during winter and summer, though significant fluctuations occur in spring and autumn. According to the Köppen–Geiger climate classification, the area is characterized as a warm summer humid continental climate (Dfb) (https://koeppen-geiger.vu-wien.ac.at/present.htm, accessed on 15 October 2024). Over the past 24 years, summer temperatures in July and August have shown a consistent increase. The average annual precipitation varies from 450 to 550 mm, with 250–300 mm occurring during the vegetation period of spring and summer. Mean annual temperatures range from +2.2 °C in the northeastern part to +3.1 °C in the southwestern part [73]. In the eastern region of the Middle Volga, there is a noticeable upward trend in land surface temperature and a decline in precipitation compared to the western part of the area.
The primary forest types found in the region include evergreen coniferous forest, broadleaf (deciduous) forest, and mixed forest. The landscape is mainly characterized by species such as pine (Pinus sylvestris L.), birch (Betula pendula Roth.), spruce (Picea abies Karst.), lime (Tilia cordata), and aspen (Populus tremula L.). Environmental disturbances, including windstorms, insect outbreaks, and wildfires, have increased in frequency [74]. In recent decades, particularly within the Republic of Mari El and Nizhegorodskaya oblast, the recurrence of fires in pine stands has led to a notable regeneration of birch and aspen species on affected sites. A significant rise in the area of broadleaved trees across the Middle Volga can be traced back to the increase in birch trees following forest fires in 1921, 1972, and 2010 [73].
The study area has a historical pattern of a mixed fire regime, characterized by varying levels of burn severity, fire return intervals, and overall fire size. Between 2000 and 2022, wildfires impacted 280,000 ha, or 4% of the total forested area being studied in the Middle Volga region. The smallest recorded wildfire affected 0.5 ha in the Republic Mari El, whereas the largest burned area reached 86.6 thousand ha in the Nizhny Novgorod oblast. Typically, the wildfire season in the Middle Volga occurs between June and August, and it is often ignited by summer lightning storms. Coniferous forests are the most vulnerable to fires, representing 59.0% of the total burnt area, while deciduous forests account for 25.1%. Minimal fire instances have been recorded in young forests and shrublands [71].
2.2. Data and Method
2.2.1. Remote Sensing
In our study, the majority of the procedures for image selection, processing, and analysis were conducted on the GEE platform (https://earthengine.google.org/, accessed on 16 September 2024) using JavaScript application programming interfaces. The overall methodology of the research workflow for detecting and analyzing the forest recovery over 2000–2023 in the study area using Landsat time-series images and other geospatial data is depicted in Figure 2. The full Landsat Collection 2 Surface Reflectance (SR) archive, including data from TM, ETM+, OLI, and OLI-2 sensors during the summer months (1 May to 30 September), was used to produce annual 30 m composites for the period spanning 2000 to 2023. All necessary Landsat (SR) images were individually retrieved from the following Image Collections stored in GEE: LANDSAT/LT05/C02/T1_L2, LANDSAT/LE07/C02/T1_L2, LANDSAT/LC08/C02/T1_L2, and LANDSAT/LC09/C02/T1_L2. The availability of data for each observed year was verified in GEE by utilizing the buildClearPixelCountCollection code within the LandTrendr algorithm [57].

Figure 2.
Flow chart of the methodology.
In total, 2457 Landsat images were acquired during the vegetation period within the study area, covering 6 Landsat scenes (Path 171, 172, and 174; Row 20, 21, Figure 3). This time span (1 May to 30 September) corresponds to the main dry and wildfire seasons in the Middle Volga region. The focus of this study was to investigate the spectral recovery patterns after forest fires that occurred in the years 2002, 2006, 2009, 2010, 2014, 2017, and 2022.
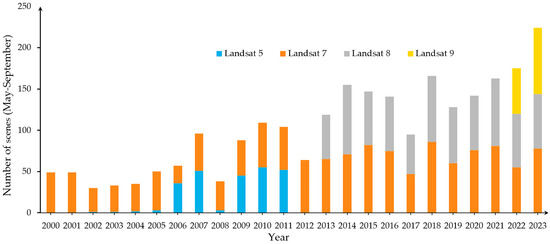
Figure 3.
Annual number of the Landsat (TM/ETM+/OLI/OLI2) scene observations over the period May–September 2000–2023.
Clouds and their shadows were automatically identified and removed from Landsat images using the C Function of Mask (CFMASK) algorithm [75]. The chosen images underwent geometric and atmospheric corrections, followed by conversion to surface reflectance utilizing the Landsat Ecosystem Disturbance Adaptive Processing System (LEDAPS) for the TM and ETM+ sensors [76], as well as the Landsat 8 Surface Reflectance Code (LaSRC) from the USGS for the OLI sensor [77]. To address the higher 12-bit radiometric resolution of the Landsat OLI/OLI-2 in comparison to the ETM+ sensor, an ordinary least squares regression, as described by Roy et al. [78], was implemented to harmonize the linear differences in spectral values between the two instruments and normalize the reflectance data.
2.2.2. Climate Data
Simulated climate data for the Middle Volga region from May to September (2000–2023) were sourced from various gridded datasets (see Table 1). For this study, two specific meteorological data products were selected. The MOD11A1.061 Terra Land Surface Temperature and Emissivity Daily Global archive was utilized to calculate the average monthly land surface temperature (LST) in Celsius (°C) at a spatial resolution of 1 km. Meanwhile, the Global Precipitation Measurement (GPM) IMERG (Integrated Multi-satellite Retrievals for GPM) Final Precipitation L3 Half Hourly 0.10 × 0.10 V06 (GPM_3IMERGHH) product was employed to estimate the gridded monthly average precipitation (Pr) values for the region (https://giovanni.gsfc.nasa.gov/giovanni/, accessed on 16 September 2024) (refer to Table 1). The data were downloaded via the GEE platform, with the projection coordinate system configured to “EPSG:32638/39”.

Table 1.
Data employed for the estimation of vegetation recovery and climatic factors monitoring in the Middle Volga region from May to September 2000–2023.
2.2.3. Burn Severity
To investigate the relationship between the forest recovery and climatic factors such as Land Surface Temperature (LST) and Precipitation (Pr), we transformed the selected pixels from the time series into an NBR. We assessed the burn severity (BS) across various wildfires in the Middle Volga region using dNBR values. The severity was categorized, with results averaged for each burned area, into three levels: low (50–190), moderate (200–360), and high (>400) dNBR [79]. To improve the identification of the early indicators of potential forest recovery, we filtered the Landsat time-series data to focus on the spectral recovery trajectories corresponding to these severity classes (Figure 4). Burned areas were identified using a threshold of >50 dNBR, indicating a severity level conducive to the growth of young trees.

Figure 4.
Examples of the forest recovery in three different 2010 wildfire burn severity sites in the Middle Volga region.
2.2.4. LandTrendr Algorithm
To analyze the vegetation recovery dynamics in burnt forest areas, we employed the LandTrendr algorithm in the GEE platform to process the time-series Landsat images. We applied a medoid selection process [80] to a stack of Landsat images, which functioned as a multi-dimensional median. The technique compares the spectral values of each estimated image against the median spectral values for each pixel across all visible and infrared bands in the Landsat time series. The pixel with the smallest sum of squared differences between observations and median spectral values was selected by LT using Euclidean distance. This approach enabled us to minimize the data volume in GEE, reduce atmospheric impact, and mitigate sensor influences to the greatest extent possible. Consequently, we created an aggregated stack of Landsat images spanning 23 years, complete with interpolated spectral values and reduced year-to-year noise.
2.2.5. Spectral Forest Recovery Metrics
To estimate the rate and patterns of the forest recovery in the region, we used a suite of spectral metrics (Figure 5, Table 2). The recovery metrics were developed using trend-fitted NBR values from the Landsat time-series analysis. We selected a five-year post-fire period to analyze the spectral forest recovery in the Middle Volga as previous studies have identified this timeframe as critical for monitoring forest regeneration [38,65,81,82].
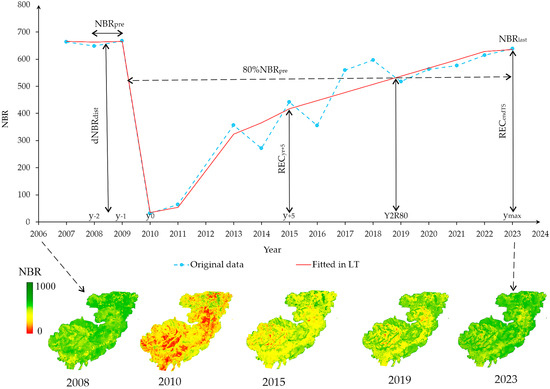
Figure 5.
Schematic of the spectral recovery metrics for the 2010 forest fire burnt area using an example of a fitted NBR trajectory in the LandTrendr program.
Table 2.
The spectral metrics used for monitoring the forest recovery.
To minimize the impact of inter-annual variations caused by atmospheric conditions and other noise factors, we established a two-year pre-fire window for calculating the NBR prior to the wildfire (Figure 5). The change in the NBR five years after the wildfire served as the Absolute Recovery Indicator (ARI) (see Table 2). This metric reflects the extent of change in the NBR values for specific Landsat pixels during the five years following the wildfire. Additionally, we employed the Relative Recovery Index (RRI), which facilitates the assessment of regrowth rates over time or at various successional stages, as defined by the number of segments analyzed [12,83].
The Years to Recovery of Eighty Percent (Y2R80) refers to the number of years necessary for a disturbed pixel to achieve 80% of the pre-disturbance NBR value (Figure 5). In the context of this study, reaching 80% of the pre-fire NBR value signifies a positive trend in vegetation regrowth within the burnt area. However, this does not guarantee a return to the original forest cover characteristics that were at a site prior to the wildfire. This aspect is particularly relevant for coniferous and broadleaf species in the Middle Volga region, such as pine stands that generally mature in 60–80 years and birch trees that reach maturity in 30–40 years.
The Year-on-Year (YrYr) metric provides insights into the average annual change in NBR values after wildfire, illustrating the yearly recovery of vegetation. A YrYr value of zero indicates that no forest recovery had occurred in the affected area, whereas positive values show the average NBR increase in the years following the wildfire event.
An important indicator that takes into account the longer duration of regrowth in BA is the spectral recovery observed at the end of the time series (RecendTS) [62]. Given that the estimated Landsat time series spans over two decades and the majority of the BAs were possibly to have spectrally recovered by 2023, this metric serves to identify areas that are experiencing delayed recovery.
2.2.6. Reference Data Collection and Validation
To validate the BS and estimate the accuracy of the forest recovery trend analyses, we randomly selected 843 forest BA test sites across various phases of vegetation recovery in the Middle Volga region, spanning from 2000 to 2023. To identify these sites, we used publicly available platforms such as Google Earth and Yandex Maps, employing visual interpretation methodologies [84]. The accuracy assessment of forest recovery by BS classes was carried out by visually assessing the vegetation cover in randomly distributed sample plots throughout the analyzed BAs.
Furthermore, to support the remote sensing analysis, the Volgatech team undertook several field campaigns during the summer months (June–August) in 2011, 2012, 2014, 2017, and 2019–2024 in the BAs of the Middle Volga. A total of 386 sample plots were established, representing a diverse range of stand ages, tree species, and typical forest ecosystems of the area. This selection process ensured comprehensive coverage of all the possible BS levels. To assess the BA and BS, the composite burn index (CBI) was used [40]. The sample plots were randomly distributed, primarily within coniferous and mixed broadleaved stands in the identified BAs.
Geographical coordinates for each sample plot were recorded using GPS, with a minimum size of 90 by 90 m. Within each sample plot, the team measured various metrics, including tree species composition, diameter at breast height (DBH), tree height, crown base height, and scorch height [79]. Additionally, fieldwork was conducted on existing plot locations, where the team evaluated forest regeneration by counting seedlings and re-sprouted shrubs, as well as by assessing the late survival rate. For improved accuracy in training and validation, only the grid cells at the center of each plot were selected, rather than the entire plot area.
2.2.7. Trend Analysis
The Mann–Kendall (MK) nonparametric statistical test was employed to quantify the temporal trends of the estimated factors based on the Landsat time series [85,86]. The Theil–Sen slope estimator, a non-parametric method for determining the median slope, was employed to analyze the rate and magnitude of these trends [87,88]. Typically, the Mann–Kendall test is usually performed to assess whether a time series shows a statistically significant monotonic increasing or decreasing trend (p < 0.05). Trends deemed non-significant were considered negligible and excluded from further analysis, although their Theil–Sen slopes are included in the results for completeness. Both of these tests, which the World Meteorological Organization has recommended for application in climate studies, are widely used in trend analyses [89,90].
3. Results
3.1. Burn Severity Analysis
We have compiled the results from the BS analysis based on the dNBR for the estimated burnt areas of the forest fires that occurred in 2002, 2006, 2009, 2010, 2014, and 2018, as presented in Table 3. The BS classes derived from the analysis in GEE were categorized into four groups based on size: less than 50 ha, 50–200 ha, 200–1000 ha, and more than 1000 ha. These groups were established to ensure an even distribution of the number of each BS class and their corresponding area within each category.
Table 3.
The distribution of BS classes on the burnt area in the Middle Volga region for 2002–2018.
According to the GEE, the largest area falls were on the moderate (112,433 ha or 42.9%) and high (111,511 ha or 42.6%) BS classes (Table 3). It is noteworthy that the moderate class of aboveground vegetation experienced significant damage during the wildfires, leading us to estimate that around 86% of the forest cover in the studied BA was entirely destroyed. Taking into account all three groups of the BS (low, moderate, and high), approximately 98% of the burnt areas were disturbed after the wildfires. The remaining 1.9% of unburned trees presented small, fragmented patches all over the BA. These trees provided seeds for the natural forest recovery and helped to maintain the biodiversity of the ecosystem.
In burnt areas of less than 50 ha and those ranging from 50 to 200 ha, the largest share was occupied by areas with a dNBR below 50, accounting for 42.9% (908 ha) and 27.8% (1377 ha), respectively. Areas with a low degree of damage ranged from 11.5% in BA over 1000 ha to 24.1% in BA between 200 and 1000 ha. In the group exceeding 1000 ha, the areas classified as moderate (43.7% or 104,853 ha) and high (44.2% or 106,015 ha) severity were nearly equal. Notably, approximately 99%, or 256.8 thousand ha, of the disturbed forested areas fell within the group of over 1000 ha.
3.2. Statistical Comparison of the Spectral Metrics
A multiple sample comparison test was conducted on the spectral recovery time-series datasets for RRI5, YrYr, and YrYr5. The ANOVA test revealed a statistically significant difference between the RRI5 low-burn-severity values and the moderate and high BS values at the 5% significance level RRI5 (F-ratio = 37.61, p-value = 0.00). On the other hand, no statistically significant difference was found between the means of the RRI5 moderate and RRI5 high BS values (F-ratio = 2.52, p-value = 0.14). The mean RRI5 for the moderate-severity recovery group was 18.0 compared to 18.6 for the RRI5 high-severity recovery (Figure 6a).

Figure 6.
Box and whisker plot of the time-series recovery metrics by the three burn severity classes: (a) the relative recovery indicator at 5 years after the wildfire (RRI5); (b) the average annual recovery (YrYr), and (c) the annual recovery at 5 years after the wildfire (YrYr5).
The ANOVA test indicated a statistically significant difference between the means of the three classes of YrYr BS values at the 5% significance level (F-ratio = 62.14, p-value = 0.00). The average mean YrYr for the low-severity recovery class was 6.5 compared to 14.0 for moderate recovery and 17.5 for the high-severity BA (Figure 6b). A comparison of the YrYR5 metric using ANOVA also demonstrated a significant statistical difference at the 5% significance level (F-ratio = 22.97, p-value = 0.00). The average YrYr5 during the first five years post-wildfire for the low-severity recovery class was 3.9 versus 12.8 for moderate-recovery and 18.0 for high-severity BA (refer to Figure 6c).
This statistical analysis of the spectral metrics indicated that recovery in different BAs is directly influenced by the BS. Specifically, areas subjected to higher levels of wildfire disturbance exhibit more rapid and extensive reforestation.
3.3. Vegetation Recovery Following Wildfire
We found that using a time-series analysis of Landsat data, particularly through the LandTrendr segmentation algorithm, proved to be an effective tool for tracking the gradual spectral recovery processes of trees across large forest areas following wildfires. The results showed that the forest recovery in the Middle Volga region from 2003 to 2023 was highly variable and dependent on the burn severity within the BAs. As illustrated in Figure 7, the NBR values decreased below the typical level for forest growth after wildfires in 2002, 2006, 2010, and 2018, and the degree of decline was influenced by BS. For the three BS classes, the NBR index values demonstrated similar recovery trends across all estimated BAs. The majority of estimated BA showed an increase in RRI5 metric values during the short-term recovery phase (Figure 7).

Figure 7.
Time series of the NBR recovery by burn severity after the wildfires: (a) 2002; (b) 2006; (c) 2010; and (d) 2018. The green horizontal dashed line represents the mean NBR reference for the two years prior to the wildfire, while the red vertical dashed line marks the year of the wildfire.
In the first 5 years following a wildfire, the areas under all three classes of BS had an RRI5 value of 44,533 ha, representing 17.3% of the disturbed area (excluding the unburned BS class) (Table 4). On average, 40.8% (18,164 ha) and 50.0% (22,282 ha) of RRI5 areas belonged to the moderate- and high-severity BS classes, which are considered indicative of the spectral forest recovery (Table 4). Conversely, the RRI5 in low-severity BA was sufficiently lower at 9.2% (4086 ha). This could be attributed to the minimal disturbance to the canopy and ground cover during the wildfire, leading to less impact on the regeneration of these areas.
Table 4.
The forest recovery area during 2002–2023 by burn severity based on spectral metrics.
Only 13.1% (33,755 ha) of the disturbed area reached the Y2R80 metric for the low and moderate BS classes during the estimated time series (Table 4). Generally, Y2R80 reached its target value within 4 to 8 years after the wildfire in areas with low BS, while it took 14 to 18 years in areas with moderate burn severity (Figure 7a–c). During the period from 2002 to 2023, the forest recovery to the Y2R80 level primarily occurred in areas (72.2%) with low burn severity (Figure 8b).

Figure 8.
On-site examples of the three recovery stages on the BA of the high BS for the spectral metrics: (a) RRI5; (b) Y2R80; and (c) RecendTS.
The BA with moderate and high BS levels exhibited the highest values of the RecendTS metric. In the moderate BS class, the RecendTS reached 73,833 thousand ha (48.6%), while high BS areas accounted for 58,357 ha (38.4%) of the total calculated by the end of the estimated time series. The remaining 19,823 ha (13.0%) of BA was recovered in low BS areas from 2002 to 2023. These figures suggest that natural forest recovery is occurring sustainably across all three BS classes.
During the estimated period, the post-fire YrYr recovery metric was assessed annually at 2.7% of the total area disturbed by wildfire. In low-severity BAs, YrYr constituted 417 ha (3.1%), while in moderate and high BS levels, it was 3136 (44.8%) and 3451 (49.2%), respectively (Table 4). The 5-year post-fire YrYr5 metric showed a slightly lower recovery rate of 2.5% of the disturbed area, particularly in low-severity BAs. Meanwhile, the YrYr5 values in the moderate- and high-severity areas were nearly identical to the annual YrYr figures (Table 4). Ultimately, by the end of the study period from 2002 to 2023, approximately 60% of BAs in the Middle Volga region that were disturbed by wildfires demonstrated positive trends in forest recovery (Figure 8a–c).
3.4. Spatial Analyses of Forest Recovery
Based on the Mann–Kendall τ (tau) correlation coefficient and Theil–Sen’s slope (TSS) analysis, we examined the trend of forest recovery on a pixel scale in the burned areas of the Middle Volga region during the vegetation seasons from 2003–2023 (Table 5). The results indicate varied spatial patterns in natural forest regeneration trends over the past two decades. Figure 9 and Figure 10 illustrate the monotonic trends of tau and TSS in the Landsat time series for forest recovery (NBR), highlighting areas with an increasing trend in green and a decreasing trend in red.
Table 5.
Post-fire forest recovery trends in the Middle Volga based on the Mann–Kendall’s test for BAs with different burn severities and statistically significant values (p < 0.05). The data are presented in ha and as percentages relative to the total disturbed area for the period from 2002 to 2023.
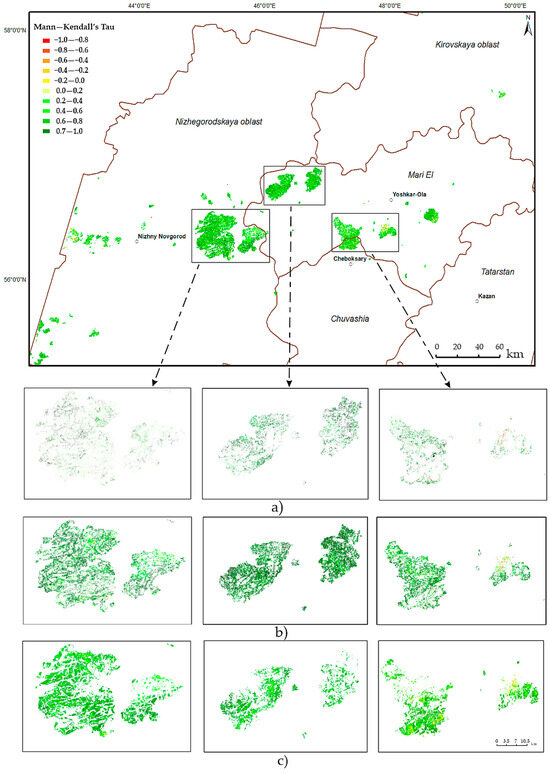
Figure 9.
Spatial trends of the post-fire natural forest recovery in the Middle Volga region (2003–2023) based on the Mann–Kendall’s Tau test (p < 0.05) for sites with different burn severities: (a) low; (b) moderate; and (c) high.

Figure 10.
The spatial trends of post-fire natural forest recovery in the Middle Volga region (2003–2023) based on the Theil–Sen’s slope (p < 0.05) for sites with different burn severities: (a) low; (b) moderate; and (c) high.
Figure 9 shows a stable trend in the forest recovery in the three largest BAs within the study area, and it was found to be particularly pronounced in regions with moderate and high BS. In general, the NBR demonstrated an increasing trend across 31,421 ha of low BS, 109,265 ha of moderate BS, and 106,969 ha of high BS in the study area. Conversely, the Mann–Kendall analysis indicated that sites with tau < 0, which signify a decline in forest cover during the study period, accounted for 14.1% of low BS, 2.5% of moderate BS, and 3.2% of high BS areas.
In terms of magnitude, all three BS classes predominantly exhibited a positive Theil–Sens’s slope in forest recovery across areas disturbed by wildfire (Figure 11). The majority (73%–93%) of significant slopes (p-value < 0) fell within the range of 10 to 30, with an average yearly increase of 4.6 in low BS areas, 4.3 in moderate BS areas, and 3.6 in high BS areas throughout the time series.
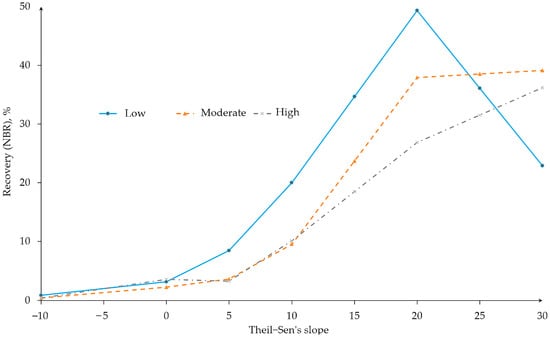
Figure 11.
The Theil–Sen’s slope (magnitude) trend for the forest recovery in the Middle Volga region from 2003–2023 for sites with different burn severities.
The increasing trends in the forest recovery were not clustered in a specific location; rather, their distribution was consistent across the BAs of the study territory. Most of the negative trends appeared as a small patch, including sites that experienced two or even three burn events during the study period [72]. Most of these patches were located in the area of small BAs in the Republic Mari El and Nizhegorodskaya oblast (Figure 9 and Figure 10). Overall, the results from the Mann–Kendall and Theil–Sen’s slope estimator statistical tests demonstrated consistency in the detection of spatio-temporal trends for the forest recovery variables in all BS classes.
3.5. Assessing the Impact of Climate Factors on Forest Recovery
To investigate the impact of the burn severity and climatic variables on forest recovery (NBR dynamics), we employed multiple linear regression analysis. This analysis spanned 5 years of intensive recovery following wildfires, as well as an additional 10 years during which low and moderate BAs achieved approximately 80% forest recovery. We derived two key climate variables from MODIS imagery and the GPM_3IMERGHH NASA product to model the post-fire recovery. The results of the multiple linear regression analysis for various BS sites are summarized in Table 6. The most effective equation, demonstrating the highest fit with combined climatic factors, utilized the monthly means of LST and Pr, and this was averaged over the period of May to September. All estimated climate variables for predicting recovery during both periods were statistically significant at the 95% confidence level (p-value < 0.05).
Table 6.
The results of the multiple linear regression model for forest recovery (NBR) at different BS sites. p-value < 0.05.
The multiple regression analysis revealed that climatic factors played an important role in the BA forest recovery during the studied period. Both the standard error statistics (SE) and T-statistic demonstrated that, among the climatic variables, temperature (LST) had a more profound effect on forest recovery (i.e., vegetation growth) than precipitation (see Table 6). LST emerged as a crucial factor in both assessed time periods (Figure 12 and Figure 13).

Figure 12.
The fitting results of a multiple linear regression model to describe the relationship between the natural forest recovery (NBR) during the 5 years after a wildfire, the land surface temperature (LST), and the precipitation (Pr) for sites with different burn severities: (a) low; (b) moderate; and (c) high.

Figure 13.
The fitting results of a multiple linear regression model to describe the relationship between the natural forest recovery (NBR) during the 5 + 10 years after a wildfire, the land surface temperature (LST), and precipitation (PR) for sites with different burn severities: (a) low; (b) moderate; and (c) high.
The precipitation data generally showed a weaker negative influence on forest recovery. However, since the p-value for Pr in all equations was less than 0.05, this variable was statistically significant at the 95% confidence level. Consequently, it was retained in the model. The models exhibited a fitted R2 statistic for the 5-year period, ranging from 56.5% in the moderate BS area to 60.6% in the high BS area. This suggests that the combined climatic factors of land surface temperature (LST) and precipitation significantly influenced the forest recovery in the investigated region (Table 6, Figure 12). Similar patterns were observed in the regression results for BA over the 5- + 10-year period following a wildfire. During this period, the strongest relationship between forest recovery and climate factors was identified in the moderate BS area, where the fitted R2 statistic reached 66.7% in the model (Table 6, Figure 13).
4. Discussion
Wildfires have a severe impact on tree cover, the carbon budget of forests, and ecosystem services, particularly in coniferous–deciduous (mixed) forests where large areas of forest ecosystems are burned annually. A better understanding of the spatial patterns and underlying factors driving the tree recovery in wildfire-affected areas is essential for developing effective forest management strategies and climate change mitigation measures. Numerous previous studies have demonstrated that the use of remote-sensing images and cloud-based processing platforms provides a cost-effective and efficient way of monitoring post-wildfire vegetation recovery [9,11,31,60]. However, there is limited research addressing the impact of climatic factors on recovery processes, particularly in the coniferous–deciduous (mixed) forests of the Russian Federation [47,68,69].
In this study, we examined the effect of burn severity on the natural recovery of forests in the Middle Volga region. We analyzed various NBR spectral metrics derived from Landsat images using GEE [50] and the LandTrendr algorithm (a widely used tool for detecting forest disturbance) [1,29,31,38,47]. Our findings indicated that the NBR values showed a strong correlation with the ground truth data, effectively capturing the continuous dynamics of the forest recovery across all BAs. The suitability of this index for assessing vegetation cover after wildfires has also been previously confirmed by other researchers [12,25,64,67]. We compared the NBR time series with data on post-fire climate conditions across the study area and three classes of burn severity. This comparison allowed us to identify the potential factors influencing forest recovery and to analyze their short-term spatio-temporal trends. Additionally, field survey data were utilized to identify the tree species present on the BAs, their combinations, growth conditions, and sources of variability in recovery processes that cannot be discerned solely from Landsat imagery [21,66].
The ANOVA test generally confirmed the statistically significant difference in the means of the RRI5, YrYr, and YrYr5 spectral metrics for low, moderate, and high BS classes at the 5% significance level. This revealed that the forest recovery on the estimated BAs is directly influenced by the degree of burn severity. Specifically, the higher the class of disturbance, the faster and more extensive the reforestation of the area occurs, which supports former studies with similar conclusions [60,64]. Mostly, the forest recovery rates of NBR spectral metrics were highest shortly after the wildfire, gradually stabilizing by the end of the time-series analysis (Figure 6). The BAs with the greatest burn severity exhibited a more extensive rate of forest recovery within the first five years after the fire, which is a finding that is also consistent with previous studies [16,29,43,46]. Approximately 91% (40,446 ha) of the RRI5 falls within the moderate and high BS classes. From 2002 to 2023, the post-fire YrYr recovery metric annually reached 2.7% of the total BAs.
A visual inspection of the BAs and validation plots suggested that the recovering vegetation primarily comprised deciduous pioneer species such as birch and aspen. These mixed, highly dense forest ecosystems are typical in the Middle Volga region [73,77]. Additionally, the recovery of Scotch pine was observed in validation plots, particularly on sandy soils, during the 5–15 years after the wildfire. The ongoing succession processes in the Middle Volga region, following several severe wildfires, show a significant shift toward forests dominated by broadleaved deciduous and mixed stands. It is crucial to consider these dynamics in post-fire management strategies to take necessary measures for mitigating wildfire risks in the region.
The application of NBR spectral metrics allowed us to compare the recovery of the BAs in relation to their pre-fire conditions. The results of this study demonstrate that only 13.1% (33,755 ha) of the BAs achieved the Y2R80 metric for low and moderate BS classes, predominantly in deciduous forest ecosystems, within the 20 years after the wildfire (Table 4). Forest recovery to the Y2R80 level occurred mainly in areas (72.2%) characterized by low burn severity (Figure 8b). This observation aligns with the minimum recovery intervals required, i.e., 15 years for broadleaved species and 25 years for coniferous species, to be considered as recovered after the wildfire.
To quantitate the spatio-temporal patterns of forest recovery, we carried out the Mann–Kendall trend analysis for the periods from 2003 to 2023. The results revealed primarily increasing NBR trends at the pixel level across all three BS classes, especially in BAs with moderate (97.5%) and high (96.8%) severities. In contrast, decreasing Mann–Kendall trends in the forest cover were observed mostly in low (14.1%) BS areas in the form of small patches. Validation plots confirmed that these negative trends largely corresponded to areas that lost tree dominance after the wildfire, transitioning to marshlands or becoming dominated by grasses and shrubs. Additionally, some areas within the vast territory of the Middle Volga region that experienced two or three wildfires during the studied period (approximately 3% of the disturbed areas), predominantly within plantation forests of Scots pine, exhibited declining Mann–Kendall trends [71].
The importance of climatic factors in assessing the forest recovery on BAs using remote sensing data has been recognized in various regions worldwide [29,38,47,68]. Some studies have suggested that dry weather not only increases the risk of wildfires, but also hampers or even leads to recruitment failure in post-fire recoveries of boreal forests in southern Siberia [28,42,68]. Our study, based on multiple linear regression analysis significant at the 95% confidence level (p-value < 0.05), shows that climate parameters (LST and Pr) are responsible for variations in the forest recovery at different BS sites following wildfires. The optimal regression model included both climatic factors averaged over the period from May to September, revealing that temperature (LST) had a stronger impact on the forest recovery (vegetation growth) compared to precipitation. Notably, the strongest correlation between forest recovery and climatic factors was observed in the moderate BS area. Considering the IPCC (Intergovernmental Panel on Climate Change) scenarios in the context of a changing climate worldwide, which forecasts increasing LST during the coming decades [91], it becomes clear that these climatic factors are crucial in shaping the long-term recovery patterns of post-fire ecosystems.
Our findings enhance the understanding of the complex relationships between BS, time-series spectral NBR metrics, climatic factors, and the spatio-temporal recovery of forests after large wildfires in the Middle Volga region from 2000 to 2023. This study’s results are consistent with field-based validation plots established throughout the investigated area. This research can support forest managers in predicting the post-fire recovery capacity of broadleaved and mixed coniferous stands based on the observed burn severity regimes using scientific and rational arrangements. Regions susceptible to extensive forest fires, such as the Republic Mari El and Nizhegorodskaya oblast, should be prioritized for implementing restoration strategies aimed at reinstating the pre-fire conditions of forest ecosystems. The developed maps, regression models, and trend analyses of forest recovery at a spatial resolution relevant to forest management can be valuable tools for local authorities and decision makers in strategic planning.
However, several limitations must be acknowledged when interpreting these findings: (1) Constraints related to NBR, ground-truth data, and official wildfire reports resulted in some low- and moderate-severity small, burned areas being undetected in the Landsat time series. (2) The low resolution of the meteorological data utilized may have restricted the correlation with forest recovery dynamics in the studied burned areas. (3) The analysis did not take into account the distribution of forests by species composition, which is critical for evaluating recovery. (4) While Landsat data offers valuable insights, higher spatial resolution imagery could enhance the monitoring accuracy of forest cover.
Future research should aim to broaden and deepen the analysis conducted in this study. We recommend investigations into the recovery patterns of various tree species and forest types using multispectral imagery, which could assist in modeling the composition of post-fire ecosystems. More efforts are also needed to examine the long-term competitive relationships and forest recovery processes using sensors with higher spatial and temporal resolution, such as SENTINEL, Resurs-P, and Canopus-B, supplemented with field survey data. In addition to climatic factors, forest recovery can be influenced by various other driving factors, including topography, soil moisture, competitive interactions, and socio-economic data specific to each satellite image. Finally, future research should incorporate more sensitive spectral vegetation indices, the IPCC climate change scenarios for forest management, and contemporary time-series models, such as Long Short-Term Memory (LSTM) networks.
5. Conclusions
In this study, we analyzed Landsat time-series data to examine spectral forest recovery rates and their associated drivers in the burned areas of the Middle Volga region of the Russian Federation over the past 20 years. This research presents the first spatio-temporally explicit, multi-decadal trends in forest recovery for this area, revealing a transition from coniferous to broadleaved species dominance. We propose a cost-effective methodology that leverage large-scale spatiotemporal remote sensing data and deep learning algorithms to estimate the recovery of wildfire-affected forests. To assess post-fire trends and recovery rates, we employed the LandTrendr algorithm in the Google Earth Engine platform. Our findings reveal that forest recovery trajectories are highly variable and dependent on the burn severity of the affected areas. By utilizing several metrics to measure spectral forest recovery rates, we gained valuable insights into the characteristics and patterns of forest recovery, both spatially and temporally, particularly in areas classified with high and moderate burn severity. Consistent with previous studies [28,29,30,31], we confirmed a strong correlation between forest recovery and climatic factors, especially in terms of land surface temperature.
The findings of this research have broader implications for other BAs and can assist researchers in optimizing the use of the Google Earth Engine platform and time-series images for mapping forest recovery, recovery rates, and trends in future environmental studies. Furthermore, the results can inform management decisions by providing cost-effective strategies for adapting to changing climatic conditions, such as carbon forecasting in forest ecosystems, vegetation regeneration, and climate-smart forestry. Lastly, these research outcomes will be valuable for developing forestry and fire protection strategies within the forest districts of the Middle Volga region’s oblasts and republics.
Author Contributions
Conceptualization, E.K., A.Y. (Aydin Yakhyayev), O.V., J.S. and J.W.; methodology, E.K., L.T., A.Y. (Aydin Yakhyayev), O.V., J.S. and J.W.; software, L.T., S.G., S.L., D.D. and A.Y. (Anna Yastrebova); validation, E.K., L.T., O.V., S.L., D.D. and A.Y. (Anna Yastrebova); formal analysis, E.K., L.T., A.Y. (Aydin Yakhyayev), J.W. and S.L.; investigation, L.T., O.V., S.L., D.D. and A.Y. (Anna Yastrebova); resources, L.T., S.L., D.D. and A.Y. (Anna Yastrebova); data curation, L.T., S.G., S.L., D.D. and A.Y. (Anna Yastrebova); writing—original draft preparation, E.K., A.Y. (Aydin Yakhyayev) and O.V.; writing—review and editing, E.K., A.Y. (Aydin Yakhyayev), J.S., O.V. and J.W.; visualization, S.L., S.G., D.D. and A.Y. (Anna Yastrebova); supervision, E.K.; project administration, E.K., A.Y. (Aydin Yakhyayev), J.S. and J.W.; funding acquisition, E.K., A.Y. (Aydin Yakhyayev) and S.G. All authors have read and agreed to the published version of the manuscript.
Funding
The reported study was funded in the framework of the Russian Science Foundation (grant no. 22-16-00094): https://rscf.ru/project/22-16-00094/ (accessed on 16 September 2024).
Data Availability Statement
The data presented in this study are available in the article. More information is available on request from the corresponding authors.
Acknowledgments
The authors are grateful to the anonymous reviewers for their valuable feedback and guidance in improving the initial version of this manuscript in multiple ways.
Conflicts of Interest
The authors declare no conflicts of interest. The funders had no role in the design of the study; in the collection, analyses, or interpretation of data; in the writing of the manuscript; or in the decision to publish the results.
References
- Poorter, L.; Craven, D.; Jakovac, C.C.; van der Sande, M.T.; Amissah, L.; Bongers, F.; Chazdon, R.L.; Farrior, C.E.; Kambach, S.; Meave, J.A.; et al. Multidimensional tropical forest recovery. Science 2021, 374, 1370–1376. [Google Scholar] [PubMed]
- Alayan, R.; Rotich, B.; Lakner, Z.A. Comprehensive framework for forest restoration after forest fires in theory and practice: A systematic review. Forests 2022, 13, 1354. [Google Scholar] [CrossRef]
- Strassburg, B.B.N.; Beyer, H.L.; Crouzeilles, R.; Iribarrem, A.; Barros, F.; de Siqueira, M.F.; Sánchez-Tapia, A.; Balmford, A.; Sansevero, J.B.B.; Brancalion, P.H.S.; et al. Strategic approaches to restoring ecosystems can triple conservation gains and halve costs. Nat. Ecol. Evol. 2019, 3, 62–70. [Google Scholar] [CrossRef] [PubMed]
- FAO. Global Forest Resources Assessment 2020: Main Report; FAO: Rome, Italy, 2020; 184p. [Google Scholar]
- Chen, X.; Chen, W.; Xu, M. Remote-sensing monitoring of postfire vegetation dynamics in the Greater Hinggan mountain range based on long time-series data: Analysis of the effects of six topographic and climatic factors. Remote Sens. 2022, 14, 2958. [Google Scholar] [CrossRef]
- Lasslop, G.; Hantson, S.; Harrison, S.P.; Bachelet, D.; Burton, C.; Forkel, M.; Forrest, M.; Li, F.; Melton, J.R.; Yue, C.; et al. Global ecosystems and fire: Multi-model assessment of fire-induced tree-cover and carbon storage reduction. Glob. Chang. Biol. 2020, 26, 5027–5041. [Google Scholar] [CrossRef]
- Vasques, A.; Baudena, M.; Vallejo, V.R.; Kefi, S.; Bautista, S.; Santana, V.M.; Baeza, M.J.; Maia, P.; Keizer, J.J.; Rietkerk, M. Post-fire regeneration traits of understorey shrub species modulate successional responses to high severity fire in Mediterranean pine forests. Ecosystems 2022, 26, 146–160. [Google Scholar] [CrossRef]
- Otoda, T.; Doi, T.; Sakamoto, K.; Hirobe, M.; Nachin, B.; Yoshikawa, K. Frequent fires may alter the future composition of the boreal forest in northern Mongolia. J. For. Res. 2012, 18, 246–255. [Google Scholar] [CrossRef]
- Chu, T.; Guo, X. Remote sensing techniques in monitoring post-fire effects and patterns of forest recovery in boreal forest regions: A review. Remote Sens. 2014, 6, 470–520. [Google Scholar]
- Kurbanov, E.; Vorobev, O.; Lezhnin, S.; Sha, J.; Wang, J.; Li, X.; Cole, J.; Dergunov, D.; Wang, Y. Remote sensing of forest burnt area, burn severity, and post-fire recovery: A review. Remote Sens. 2022, 14, 4714. [Google Scholar] [CrossRef]
- Souza-Alonso, P.; Saiz, G.; García, R.A.; Pauchard, A.; Ferreira, A.; Merino, A. Post-fire ecological restoration in Latin American forest ecosystems: Insights and lessons from the last two decades. For. Ecol. Manag. 2022, 509, 120083. [Google Scholar]
- Frazier, R.J.; Coops, N.C.; Wulder, M.A.; Hermosilla, T.; White, J.C. Analyzing spatial and temporal variability in short-term rates of post-fire vegetation return from Landsat time series. Remote Sens. Environ. 2018, 205, 32–45. [Google Scholar] [CrossRef]
- Gitas, I.; Mitri, G.; Veraverbeke, S.; Polychronaki, A. Advances in remote sensing of post-fire vegetation recovery monitoring—A review. In Remote Sensing of Biomass—Principles and Applications; Fatoyinbo, L., Ed.; InTech: London, UK, 2012; ISBN 978-953-51-0313-4. [Google Scholar]
- Perez-Cabello, F.; Montorio, R.; Alves, D.B. Remote sensing techniques to assess post-fire vegetation recovery. Curr. Opin. Environ. Sci. Health 2021, 21, 100251. [Google Scholar] [CrossRef]
- Alatorre, L.; Sánchez, E.; Amado, J.; Wiebe, L.; Torres, M.; Rojas, H.; Bravo, L.; López, E. Analysis of the temporal and spatial evolution of recovery and degradation processes in vegetated areas using a time series of Landsat TM images (1986–2011): Central region of Chihuahua, Mexico. Open J. For. 2015, 5, 162–180. [Google Scholar] [CrossRef][Green Version]
- Bartels, S.F.; Chen, H.Y.H.; Wulder, M.A.; White, J.C. Trends in post-disturbance recovery rates of Canada’s forests following wildfire and harvest. For. Ecol. Manag. 2016, 361, 194–207. [Google Scholar] [CrossRef]
- Hislop, S.; Haywood, A.; Jones, S.; Soto-Berelov, M.; Skidmore, A.; Nguyen, T.H. A satellite data driven approach to monitoring and reporting fire disturbance and recovery across boreal and temperate forests. Int. J. Appl. Earth Obs. Geoinf. 2020, 87, 102034. [Google Scholar] [CrossRef]
- Chu, T.; Guo, X.; Takeda, K. Effects of burn severity and environmental conditions on post-fire regeneration in Siberian Larch forest. Forests 2017, 8, 76. [Google Scholar] [CrossRef]
- Santana, N.C.; Júnior, O.A.d.C.; Gomes, R.A.T.; Fontes Guimarães, R. Comparison of post-fire patterns in Brazilian savanna and tropical forest from remote sensing time series. ISPRS Int. J. Geo-Inf. 2020, 9, 659. [Google Scholar] [CrossRef]
- Ryu, J.-H.; Han, K.-S.; Hong, S.; Park, N.-W.; Lee, Y.-W.; Cho, J. Satellite-based evaluation of the post-fire recovery process from the worst forest fire case in South Korea. Remote Sens. 2018, 10, 918. [Google Scholar] [CrossRef]
- Avetisyan, D.; Velizarova, E.; Filchev, L. Post-fire forest vegetation state monitoring through satellite remote sensing and in situ data. Remote Sens. 2022, 14, 6266. [Google Scholar] [CrossRef]
- Ba, R.; Lovallo, M.; Song, W.; Zhang, H.; Telesca, L. Multifractal analysis of MODIS Aqua and Terra satellite time series of normalized difference vegetation index and enhanced vegetation index of sites affected by wildfires. Entropy 2022, 24, 1748. [Google Scholar] [CrossRef]
- Bonannella, C.; Chirici, G.; Travaglini, D.; Pecchi, M.; Vangi, E.; D’Amico, G.; Giannetti, F. Characterization of wildfires and harvesting forest disturbances and recovery using Landsat time series: A case study in Mediterranean forests in central Italy. Fire 2022, 5, 68. [Google Scholar] [CrossRef]
- Vandansambuu, B.; Gantumur, B.; Wu, F.; Byambasuren, O.; Bayarsaikhan, S.; Chantsal, N.; Batsaikhan, N.; Bao, Y.; Vandansambuu, B.; Jimseekhuu, M.-E. Assessment of burn severity and monitoring of the wildfire recovery process in Mongolia. Fire 2023, 6, 373. [Google Scholar] [CrossRef]
- White, J.C.; Hermosilla, T.; Wulder, M.A.; Coops, N.C. Mapping, validating, and interpreting spatio-temporal trends in post-disturbance forest recovery. Remote Sens. Environ. 2022, 271, 112904. [Google Scholar]
- Meneses, B.M. Vegetation recovery patterns in burned areas assessed with Landsat 8 OLI imagery and environmental biophysical data. Fire 2021, 4, 76. [Google Scholar] [CrossRef]
- Han, A.; Qing, S.; Bao, Y.; Na, L.; Bao, Y.; Liu, X.; Zhang, J.; Wang, C. Short-term effects of fire severity on vegetation based on sentinel-2 satellite data. Sustainability 2021, 13, 432. [Google Scholar] [CrossRef]
- Sun, Q.; Burrell, A.; Barrett, K.; Kukavskaya, E.; Buryak, L.; Kaduk, J.; Baxter, R. Climate variability may delay post-fire recovery of boreal forest in southern Siberia, Russia. Remote Sens. 2021, 13, 2247. [Google Scholar] [CrossRef]
- Hao, B.; Xu, X.; Wu, F.; Tan, L. Long-term effects of fire severity and climatic factors on post-forest-fire vegetation recovery. Forests 2022, 13, 883. [Google Scholar] [CrossRef]
- Wilson, A.M.; Latimer, A.M.; Silander, J.A. Climatic controls on ecosystem resilience: Postfire regeneration in the Cape floristic region of South Africa. Proc. Natl. Acad. Sci. USA 2015, 112, 9058–9063. [Google Scholar] [CrossRef]
- Viana-Soto, A.; Aguado, I.; Salas, J.; García, M. Identifying post-fire recovery trajectories and driving factors using Landsat Time series in fire-prone Mediterranean pine forests. Remote Sens. 2020, 12, 1499. [Google Scholar] [CrossRef]
- Bassett, M.; Leonard, S.W.; Chia, E.K.; Clarke, M.F.; Bennett, A.F. Interacting effects of fire severity, time since fire and topography on vegetation structure after wildfire. For. Ecol. Manag. 2017, 396, 26–34. [Google Scholar]
- Haffey, C.; Sisk, T.D.; Allen, C.D.; Thode, A.E.; Margolis, E.Q. Limits to ponderosa pine regeneration following large high-severity forest fires in the United States Southwest. Fire Ecol. 2018, 14, 143–163. [Google Scholar]
- Rammer, W.; Braziunas, K.H.; Hansen, W.D.; Ratajczak, Z.; Westerling, A.L.; Turner, M.G.; Seidl, R. Widespread regeneration failure in forests of Greater Yellowstone under scenarios of future climate and fire. Glob. Chang. Biol. 2021, 27, 4339–4351. [Google Scholar] [CrossRef] [PubMed]
- He, Z.; Wang, L.; Luo, J.; Zhang, B.; Deng, Q.; Liu, H. Topographic factors drive short-term understory revegetation in burned areas. Fire 2022, 5, 171. [Google Scholar] [CrossRef]
- Christopoulou, A.; Mallinis, G.; Vassilakis, E.; Farangitakis, G.-P.; Fyllas, N.M.; Kokkoris, G.D.; Arianoutsou, M. Assessing the impact of different landscape features on post-fire forest recovery with multitemporal remote sensing data: The case of Mount Taygetos (southern Greece). Int. J. Wildl. Fire 2019, 28, 521–532. [Google Scholar] [CrossRef]
- Alegria, C. Vegetation monitoring and post-fire recovery: A case study in the centre inland of Portugal. Sustainability 2022, 14, 12698. [Google Scholar] [CrossRef]
- Blanco-Rodríguez, M.Á.; Ameztegui, A.; Gelabert, P.; Rodrigues, M.; Coll, L. Short-term recovery of post-fire vegetation is primarily limited by drought in Mediterranean forest ecosystems. Fire Ecol. 2023, 19, 68. [Google Scholar] [CrossRef]
- Maillard, O. Post-fire natural regeneration trends in Bolivia: 2001–2021. Fire 2023, 6, 18. [Google Scholar] [CrossRef]
- Key, C.H.; Benson, N.C. Landscape assessment: Remote sensing measure of severity, the normalized burn ratio. In FIREMON: Fire Effects Monitoring and Inventory System; Lute, D.C., Ed.; USDA Forest Service, Rocky Mountain Research Station: Fort Collins, CO, USA, 2006; pp. 305–325. [Google Scholar]
- Collins, B.M.; Roller, G.B. Early forest dynamics in stand-replacing fire patches in the northern Sierra Nevada. Landsc. Ecol. 2013, 28, 1801–1813. [Google Scholar] [CrossRef]
- Barrett, K.; Baxter, R.; Kukavskaya, E.; Balzter, H.; Shvetsov, E.; Buryak, L. Postfire recruitment failure in Scots pine forests of southern Siberia. Remote Sens. Environ. 2020, 237, 111539. [Google Scholar]
- Guz, J.; Sangermano, F.; Kulakowski, D. The Influence of burn severity on post-fire spectral recovery of three fires in the southern Rocky Mountains. Remote Sens. 2022, 14, 1363. [Google Scholar] [CrossRef]
- Dvornikov, Y.; Novenko, E.; Korets, M.; Olchev, A. Wildfire dynamics along a north-central Siberian latitudinal transect assessed using Landsat imagery. Remote Sens. 2022, 14, 790. [Google Scholar] [CrossRef]
- Crotteau, J.S.; Morgan Varner, J.; Ritchie, M.W. Post-fire regeneration across a fire severity gradient in the southern Cascades. For. Ecol. Manage. 2013, 287, 103–112. [Google Scholar] [CrossRef]
- Viana-Soto, A.; Okujeni, A.; Pflugmacher, D.; García, M.; Aguado, I.; Hostert, P. Quantifying post-fire shifts in woody-vegetation cover composition in Mediterranean pine forests using Landsat time series and regression-based unmixing. Remote Sens. Environ. 2022, 281, 113239. [Google Scholar] [CrossRef]
- Williams, N.G.; Lucash, M.S.; Ouellette, M.R.; Brussel, T.; Gustafson, E.J.; Weiss, S.A.; Sturtevant, B.R.; Schepaschenko, D.G.; Shvidenko, A.Z. Simulating dynamic fire regime and vegetation change in a warming Siberia. Fire Ecol. 2023, 19, 33. [Google Scholar] [CrossRef]
- Wan, H.Y.; Olson, A.C.; Muncey, K.D.; St Clair, S.B. Legacy effects of fire size and severity on forest regeneration, recruitment, and wildlife activity in aspen forests. For. Ecol. Manag. 2014, 329, 59–68. [Google Scholar] [CrossRef]
- Lewis, J.S.; St. Clair, S.B.; Fairweather, M.L.; Rubin, E.S. Fire severity and ungulate herbivory shape forest regeneration and recruitment after a large mixed-severity wildfire. For. Ecol. Manag. 2024, 555, 121692. [Google Scholar] [CrossRef]
- Gorelick, N.; Hancher, M.; Dixon, M.; Ilyushchenko, S.; Thau, D.; Moore, R. Google Earth Engine: Planetary-scale geospatial analysis for everyone. Remote Sens. Environ. 2017, 202, 18–27. [Google Scholar] [CrossRef]
- Tamiminia, H.; Salehi, B.; Mahdianpari, M.; Quackenbush, L.; Adeli, S.; Brisco, B. Google Earth Engine for geo-big data applications: A meta-analysis and systematic review. ISPRS J. Photogramm. Remote Sens. 2020, 164, 152–170. [Google Scholar] [CrossRef]
- Velastegui-Montoya, A.; Montalván-Burbano, N.; Carrión-Mero, P.; Rivera-Torres, H.; Sadeck, L.; Adami, M. Google Earth Engine: A global analysis and future trends. Remote Sens. 2023, 15, 3675. [Google Scholar] [CrossRef]
- Huang, C.; Goward, S.N.; Masek, J.G.; Thomas, N.; Zhu, Z.; Vogelmann, J.E. An automated approach for reconstructing recent forest disturbance history using dense Landsat time series stacks. Remote Sens. Environ. 2010, 114, 183–198. [Google Scholar] [CrossRef]
- Jamali, S.; Jönsson, P.; Eklundh, L.; Ardö, J.; Seaquist, J. Detecting changes in vegetation trends using time series segmentation. Remote Sens. Environ. 2015, 156, 182–195. [Google Scholar] [CrossRef]
- Zhu, Z. Change detection using Landsat time series: A review of frequencies, preprocessing, algorithms, and applications. ISPRS J. Photogramm. Remote Sens. 2017, 130, 370–384. [Google Scholar] [CrossRef]
- Kennedy, R.E.; Yang, Z.; Cohen, W.B. Detecting trends in forest disturbance and recovery using yearly Landsat time series: 1. LandTrendr—Temporal segmentation algorithms. Remote Sens. Environ. 2010, 114, 2897–2910. [Google Scholar] [CrossRef]
- Kennedy, R.E.; Yang, Z.; Gorelick, N.; Braaten, J.; Cavalcante, L.; Cohen, W.B.; Healey, S. Implementation of the LandTrendr algorithm on Google Earth Engine. Remote Sens. 2018, 10, 691. [Google Scholar] [CrossRef]
- Cohen, W.; Yang, Z.; Healey, S.; Kennedy, R.; Gorelick, N. A LandTrendr multispectral ensemble for forest disturbance detection. Remote Sens. Environ. 2018, 205, 131–140. [Google Scholar] [CrossRef]
- Cohen, W.B.; Healey, S.P.; Yang, Z.; Stehman, S.V.; Brewer, C.K.; Brooks, E.B.; Gorelick, N.; Huang, C.; Hughes, M.J.; Kennedy, R.E.; et al. How similar are forest disturbance maps derived from different Landsat time series algorithms? Forests 2017, 8, 98. [Google Scholar] [CrossRef]
- Bonney, M.T.; He, Y.; Myint, S.W. Contextualizing the 2019–2020 Kangaroo island bushfires: Quantifying landscape-level influences on past severity and recovery with Landsat and Google Earth Engine. Remote Sens. 2020, 12, 3942. [Google Scholar] [CrossRef]
- Han, Y.; Ke, Y.; Zhu, L.; Feng, H.; Zhang, Q.; Sun, Z.; Zhu, L. Tracking vegetation degradation and recovery in multiple mining areas in Beijing, China, based on time-series Landsat imagery. GISci. Remote Sens. 2021, 58, 1477–1496. [Google Scholar] [CrossRef]
- Hird, J.N.; Kariyeva, J.; McDermid, G.J. Satellite time series and Google Earth Engine democratize the process of forest-recovery monitoring over large areas. Remote Sens. 2021, 13, 4745. [Google Scholar] [CrossRef]
- Zhang, Q.; Homayouni, S.; Zhao, P.; Zhou, M. Burned vegetation recovery trajectory and its driving factors using satellite remote-sensing datasets in the Great Xing’An forest region of Inner Mongolia. Int. J. Wildland Fire 2023, 32, 244–261. [Google Scholar] [CrossRef]
- Bright, B.C.; Hudak, A.T.; Kennedy, R.E.; Braaten, J.D.; Khalyani, A.H. Examining post-fire vegetation recovery with Landsat time series analysis in three western North American forest types. Fire Ecol. 2019, 15, 8. [Google Scholar] [CrossRef]
- Hua, J.; Chen, G.; Yu, L.; Ye, Q.; Jiao, H.; Luo, X. Improved mapping of long-term forest disturbance and recovery dynamics in the subtropical China using all available Landsat time-series imagery on Google Earth Engine platform. IEEE J. Sel. Top. Appl. Earth Obs. Remote Sens. 2021, 14, 2754–2768. [Google Scholar] [CrossRef]
- Ren, H.; Ren, C.; Wang, Z.; Jia, M.; Yu, W.; Liu, P.; Xia, C. Continuous tracking of forest disturbance and recovery in the Greater Khingan mountains from annual Landsat Imagery. Remote Sens. 2023, 15, 5426. [Google Scholar] [CrossRef]
- Hambinintsoa, A.H.R.; Harto, A.B.; Virtriana, R. Spatio-temporal spectral trajectory pattern to continuous maps of forest disturbance and recovery: Case of tropical forests of Vatovavy Fitovinany, Madagascar. Model. Earth Syst. Environ. 2023, 9, 3597–3608. [Google Scholar] [CrossRef]
- Burrell, A.; Kukavskaya, E.; Baxter, R.; Sun, Q.; Barrett, K. Post-fire recruitment failure as a driver of forest to non-forest ecosystem shifts in boreal regions. In Ecosystem Collapse and Climate Change; Canadell, J.G., Jackson, R.B., Eds.; Springer: Cham, Switzerland, 2021; Volume 241, pp. 69–100. [Google Scholar]
- Shvetsov, E.G.; Kukavskaya, E.A.; Buryak, L.V.; Barrett, K. Assessment of post-fire vegetation recovery in Southern Siberia using remote sensing observations. Environ. Res. Lett. 2019, 14, 05500. [Google Scholar] [CrossRef]
- Perevedentsev, Y.; Sherstyukov, B.; Gusarov, A.; Aukhadeev, T.; Mirsaeva, N. Climate-induced fire hazard in forests in the Volga federal district of European Russia during 1992–2020. Climate 2022, 10, 110. [Google Scholar] [CrossRef]
- Kurbanov, E.; Vorobev, O.; Lezhnin, S.; Dergunov, D.; Wang, J.; Sha, J.; Gubaev, A.; Tarasova, L.; Wang, Y. Temporal and spatial analyses of forest burnt area in the Middle Volga region based on satellite imagery and climatic factors. Climate 2024, 12, 45. [Google Scholar] [CrossRef]
- Loboda, T.; Krankina, O.; Savin, I.; Kurbanov, E.; Joanne, H. Land Management and the impact of the 2010 extreme drought event on the agricultural and ecological systems of European Russia. In Land-Cover and Land-Use Changes in Eastern Europe After the Collapse of the Soviet Union in 1991; Gutman, G., Volker, R., Eds.; Springer International Publishing: Cham, Switzerland, 2017; pp. 173–192. [Google Scholar]
- Vorobyov, O.N.; Lezhnin, S.A.; Kurbanov, E.A.; Yahyayev, A.B.; Dergunov, D.M.; Tarasova, L.V.; Yastrebova, A.V. Predictive analysis of forest cover in the Middle Volga Region based on time series and climate scenarios. Curr. Probl. Remote Sens. Earth Space 2024, 21, 115–130. (In Russian) [Google Scholar] [CrossRef]
- Lerink, B.; Hassegawa, M.; Kryshen, A.; Kovalev, A.; Kurbanov, E.; Nabuurs, G.J.; Moshnikov, S.; Verkerk, P.J. Climate-smart forestry in Russia and potential climate change mitigation benefits. In Russian Forests and Climate Change. What Science Can Tell Us 11; Leskinen, P., Lindner, M., Verkerk, P.J., Nabuurs, G.J., Van Brusselen, J., Kulikova, E., Hassegawa, M., Lerink, B., Eds.; European Forest Institute: Joensuu, Finland, 2020; pp. 73–103. [Google Scholar]
- Foga, S.; Scaramuzza, P.L.; Guo, S.; Zhu, Z.; Dilley, R.D.; Beckmann, T.; Schmidt, G.L.; Dwyer, J.L.; Joseph Hughes, M.; Laue, B. Cloud detection algorithm comparison and validation for operational Landsat data products. Remote Sens. Environ. 2017, 194, 379–390. [Google Scholar] [CrossRef]
- Vermote, E.; Justice, C.; Claverie, M.; Franch, B. Preliminary analysis of the performance of the Landsat 8/OLI land surface reflectance product. Remote Sens. Environ. 2016, 185, 46–56. [Google Scholar] [CrossRef]
- Claverie, M.; Vermote, E.F.; Franch, B.; Masek, J.G. Evaluation of the Landsat-5 TM and Landsat-7 ETM+ Surface Reflectance Products. Remote Sens. Environ. 2015, 169, 390–403. [Google Scholar] [CrossRef]
- Roy, D.P.; Kovalskyy, V.; Zhang, H.K.; Vermote, E.F.; Yan, L.; Kumar, S.S.; Egorov, A. Characterization of Landsat-7 to Landsat-8 reflective wavelength and normalized difference vegetation index continuity. Remote Sens. Environ. 2016, 185, 57–70. [Google Scholar] [CrossRef]
- Kurbanov, E.; Vorobyev, O.; Leznin, S.; Polevshikova, Y.; Demisheva, E. Assessment of burn severity in Middle Povozhje with Landsat multitemporal data. Int. J. Wildland Fire 2017, 26, 772–782. [Google Scholar] [CrossRef]
- Flood, N. Seasonal composite Landsat TM/ETM+ images using the Medoid (A multi-dimensional median). Remote Sens. 2013, 5, 6481–6500. [Google Scholar] [CrossRef]
- Pickell, P.D.; Hermosilla, T.; Frazier, R.J.; Coops, N.C.; Wulder, M.A. Forest recovery trends derived from Landsat time series for North American boreal forests. Int. J. Remote Sens. 2016, 37, 138–149. [Google Scholar] [CrossRef]
- White, J.C.; Saarinen, N.; Wulder, M.A.; Kankare, V.; Hermosilla, T.; Coops, N.C.; Holopainen, M.; Hyyppä, J.; Vastaranta, M. Assessing spectral measures of post-harvest forest recovery with field plot data. Int. J. Appl. Earth Obs. Geoinf. 2019, 80, 102–114. [Google Scholar] [CrossRef]
- Kennedy, R.E.; Yang, Z.; Cohen, W.B.; Pfaff, E.; Braaten, J.; Nelson, P. Spatial and temporal patterns of forest disturbance and regrowth within the area of the Northwest Forest Plan. Remote Sens. Environ. 2012, 122, 117–133. [Google Scholar] [CrossRef]
- Hansen, M.C.; Potapov, P.V.; Moore, R.; Hancher, M.; Turubanova, S.A.; Tyukavina, A.; Thau, D.; Stehman, S.V.; Goetz, S.J.; Loveland, T.R.; et al. High-resolution global maps of 21st-century forest cover change. Science 2013, 342, 850–853. [Google Scholar] [CrossRef]
- Mann, H.B. Nonparametric tests against trend. Econometrica 1945, 13, 245–259. [Google Scholar] [CrossRef]
- Kendall, M.G. Rank Correlation Methods; Charles Griffin: Oxford, UK, 1955. [Google Scholar]
- Sen, P.K. Estimates of the regression coefficient based on Kendall’s tau. J. Am. Stat. Assoc. 1968, 63, 1379–1389. [Google Scholar] [CrossRef]
- Theil, H. A rank-invariant method of linear and polynomial regression analysis. In Henri Theil’s Contributions to Economics and Econometrics; Springer: Berlin/Heidelberg, Germany, 1992; pp. 345–381. [Google Scholar]
- Gocic, M.; Trajkovic, S. Analysis of changes in meteorological variables using Mann-Kendall and Sen’s slope estimator statistical tests in Serbia. Glob. Planet. Chang. 2013, 100, 172–182. [Google Scholar] [CrossRef]
- Yuan, J.; Bian, Z.; Yan, Q.; Gu, Z.; Yu, H. An approach to the temporal and spatial characteristics of vegetation in the growing season in Western China. Remote Sens. 2020, 12, 945. [Google Scholar] [CrossRef]
- IPCC. Climate Change 2013: The Physical Science Basis. Contribution of Working Group I to the Fifth Assessment Report of the Intergovernmental Panel on Climate Change; Stocker, T.F., Qin, D., Plattner, G.-K., Tignor, M.M.B., Allen, S.K., Boschung, J., Nauels, A., Xia, Y., Bex, V., Midgley, P.M., Eds.; Cambridge University Press: Cambridge, UK; New York, NY, USA, 2013; 1535p. [Google Scholar]
Disclaimer/Publisher’s Note: The statements, opinions and data contained in all publications are solely those of the individual author(s) and contributor(s) and not of MDPI and/or the editor(s). MDPI and/or the editor(s) disclaim responsibility for any injury to people or property resulting from any ideas, methods, instructions or products referred to in the content. |
© 2024 by the authors. Licensee MDPI, Basel, Switzerland. This article is an open access article distributed under the terms and conditions of the Creative Commons Attribution (CC BY) license (https://creativecommons.org/licenses/by/4.0/).