
Sentinel-2A Image Reflectance Simulation Method for Estimating the Chlorophyll Content of Larch Needles with Pest Damage


 , and
, and
Abstract
1. Introduction
- Downscaling Sentinel-2A image data and decomposing mixed pixels in multispectral remote sensing images by simulating multispectral reflectance, and enhancing the expression of forest canopy information with Sentinel image pixels;
- Analyzing the potential of the Sentinel-2A spectral vegetation index and its spectral derivative for estimating the chlorophyll content;
- Improving the accuracy of chlorophyll content estimation via Sentinel-2A.
2. Materials and Methods
2.1. Study Data
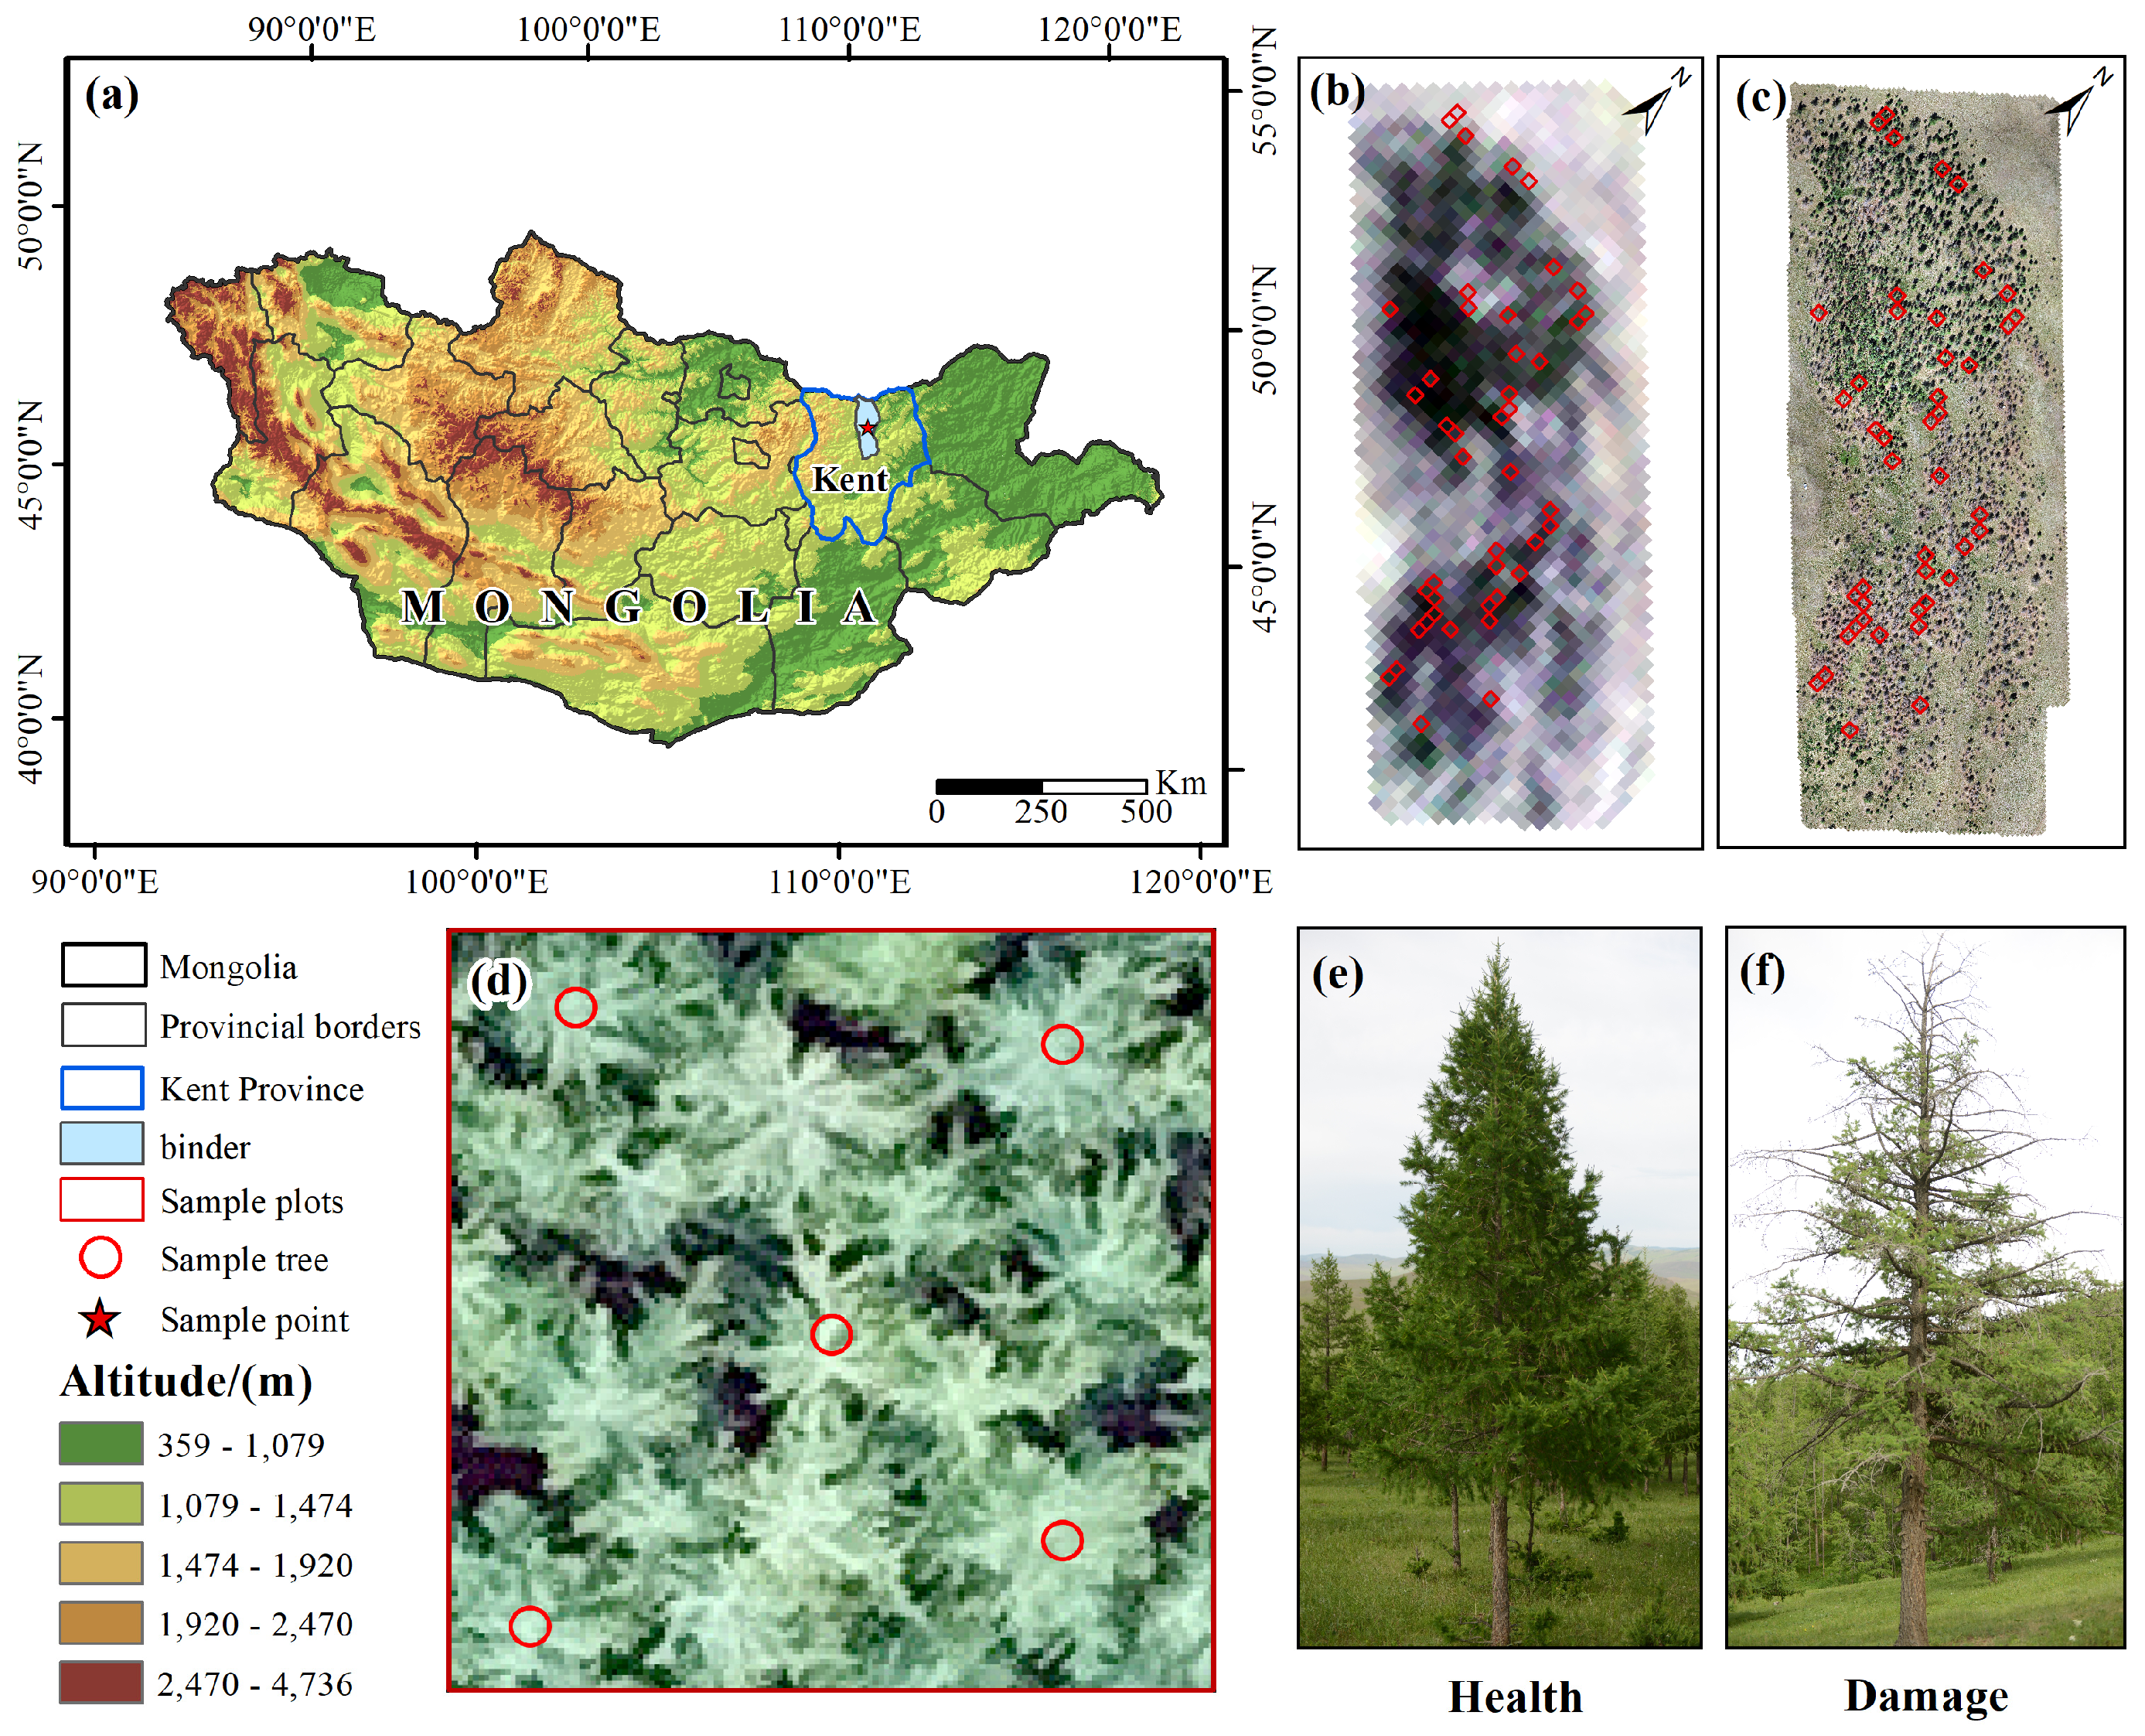
2.1.1. Study Area
2.1.2. Multispectral Remote Sensing Data
- (1)
- Sentinel-2A satellite image data
- (2)
- UAV RGB images
2.1.3. Ground Hyperspectral Data
2.1.4. Relative Chlorophyll Content (SPAD) Data
2.2. Methodology
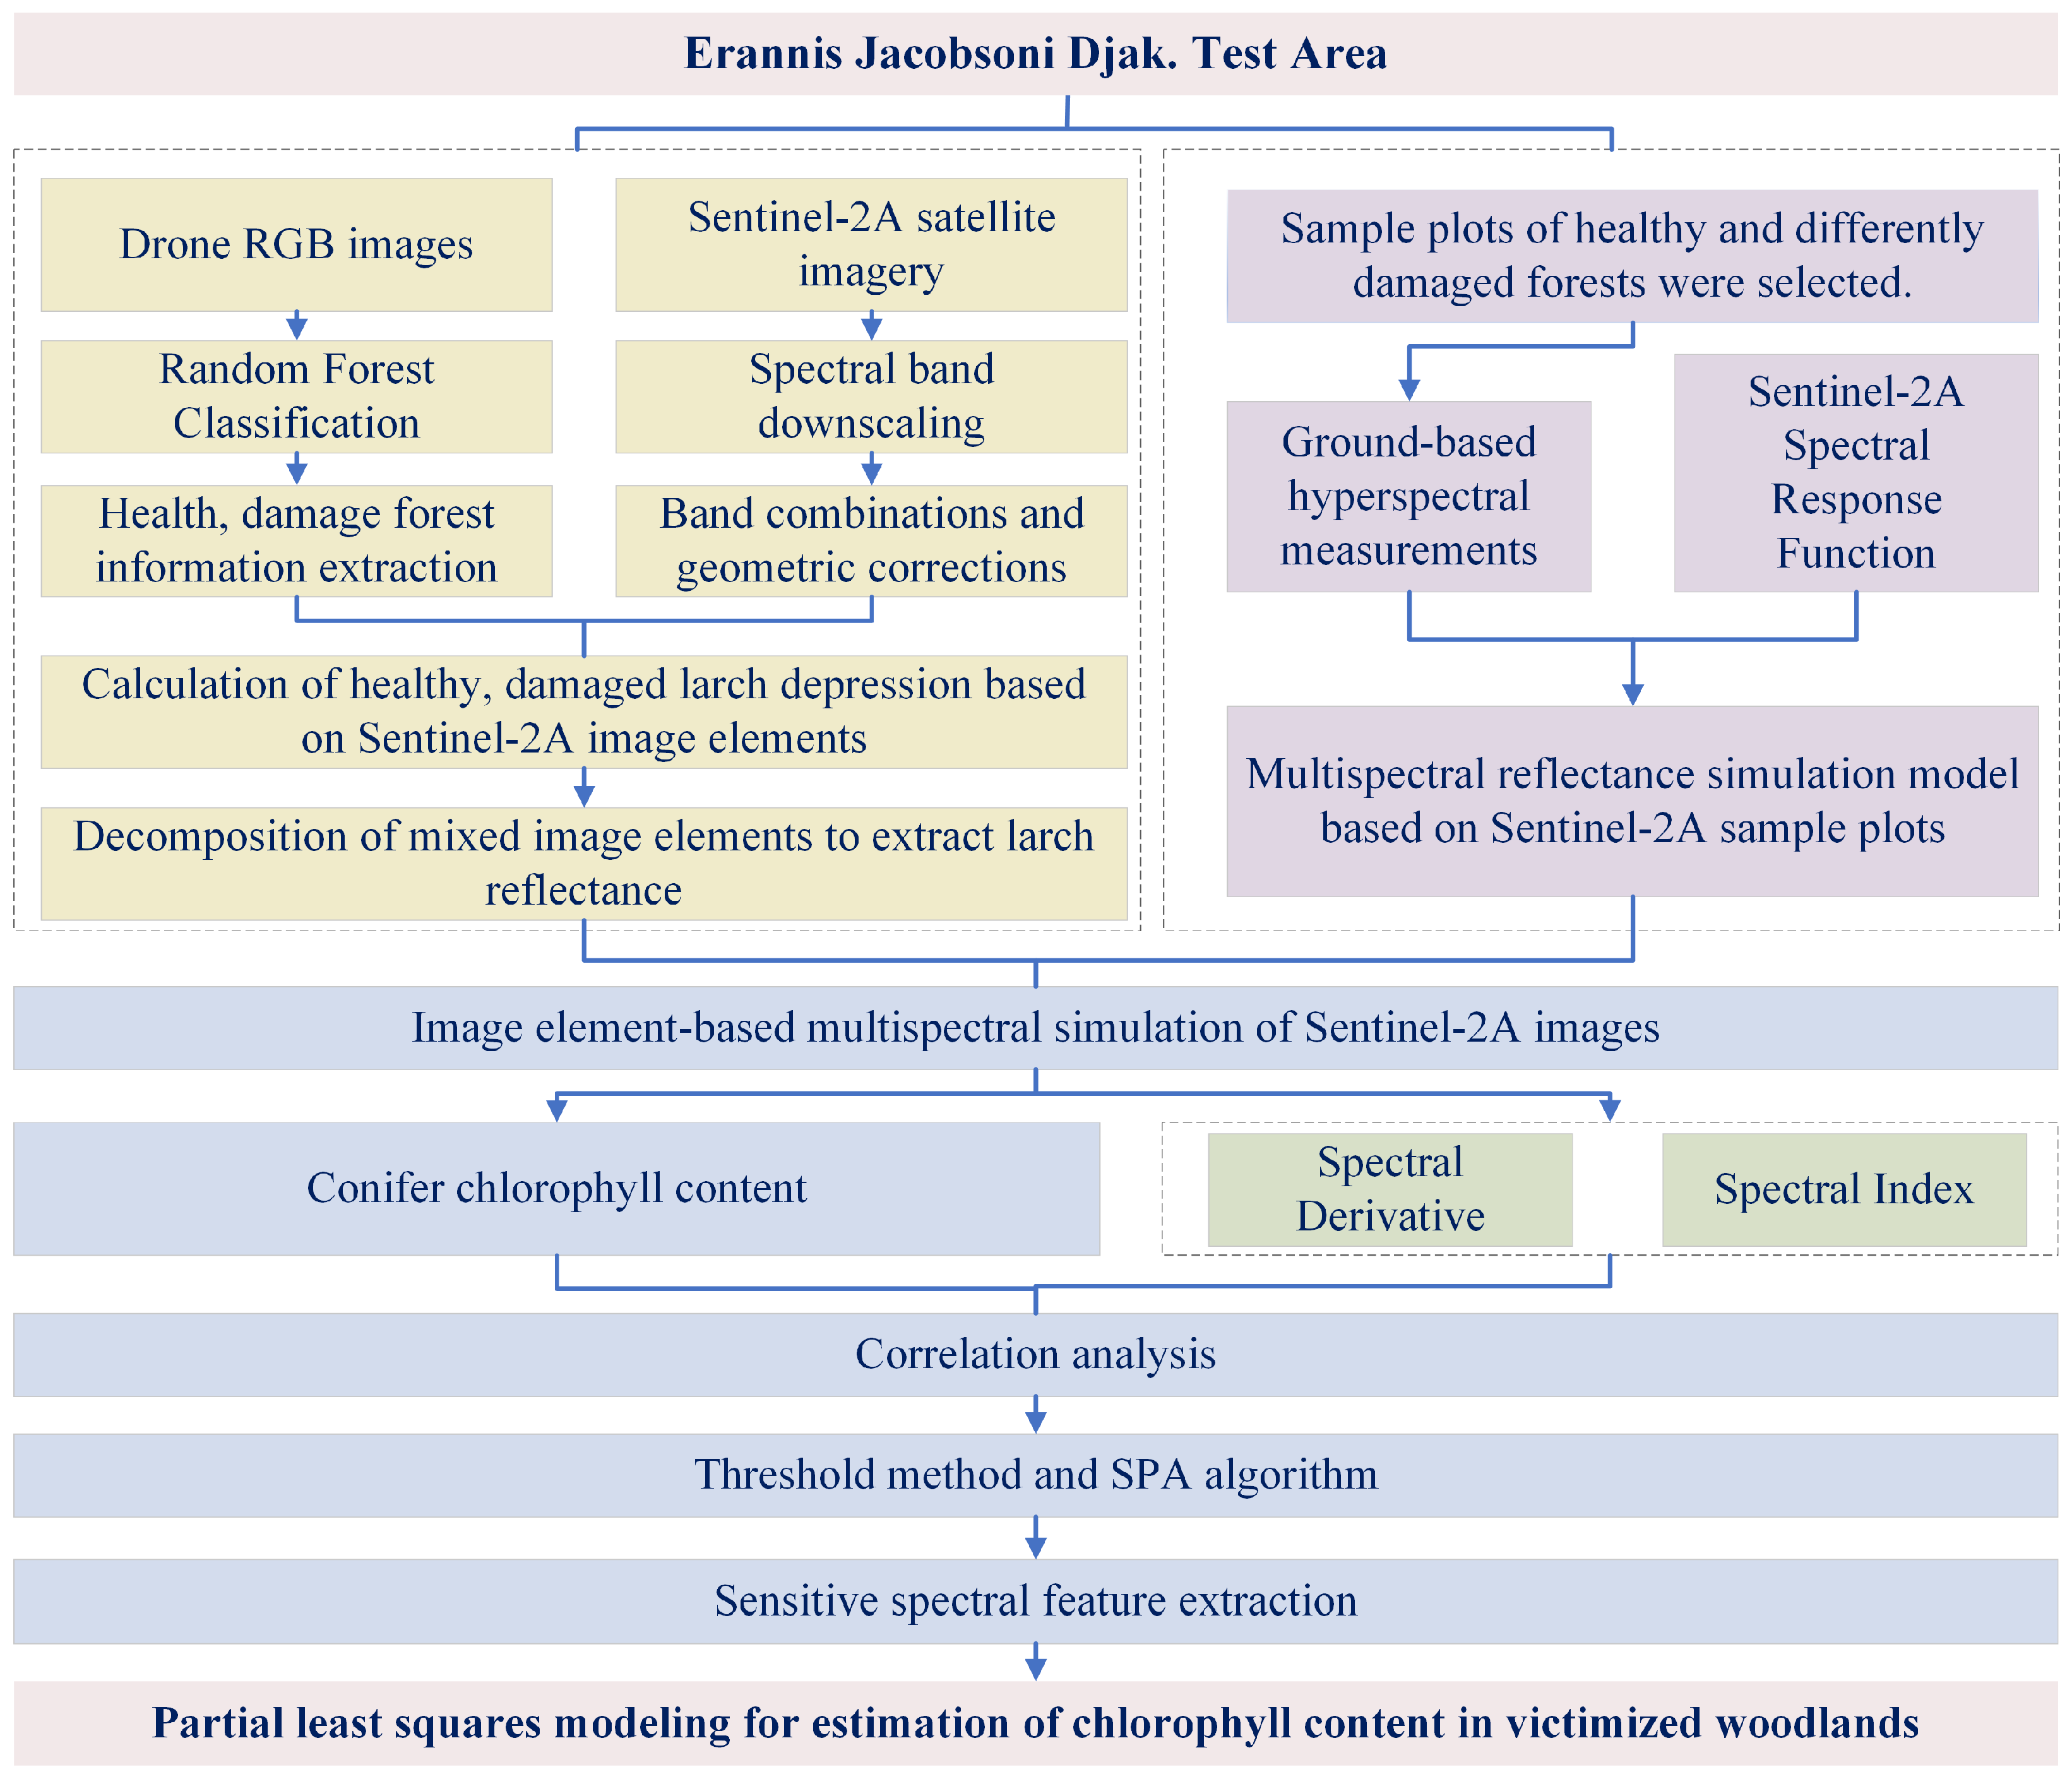
2.2.1. Data Processing
- (1)
- Sentinel-2A multispectral data
- (2)
- UAV RGB data
- (3)
- Ground hyperspectral data
- (4)
- Chlorophyll content data
2.2.2. Sentinel-2A Multispectral Reflectance Simulation
- (1)
- Downscaling of individual bands of Sentinel-2A images
- (2)
- Sentinel-2A image geometric correction
- (3)
- Extraction of larch infestation information
- (4)
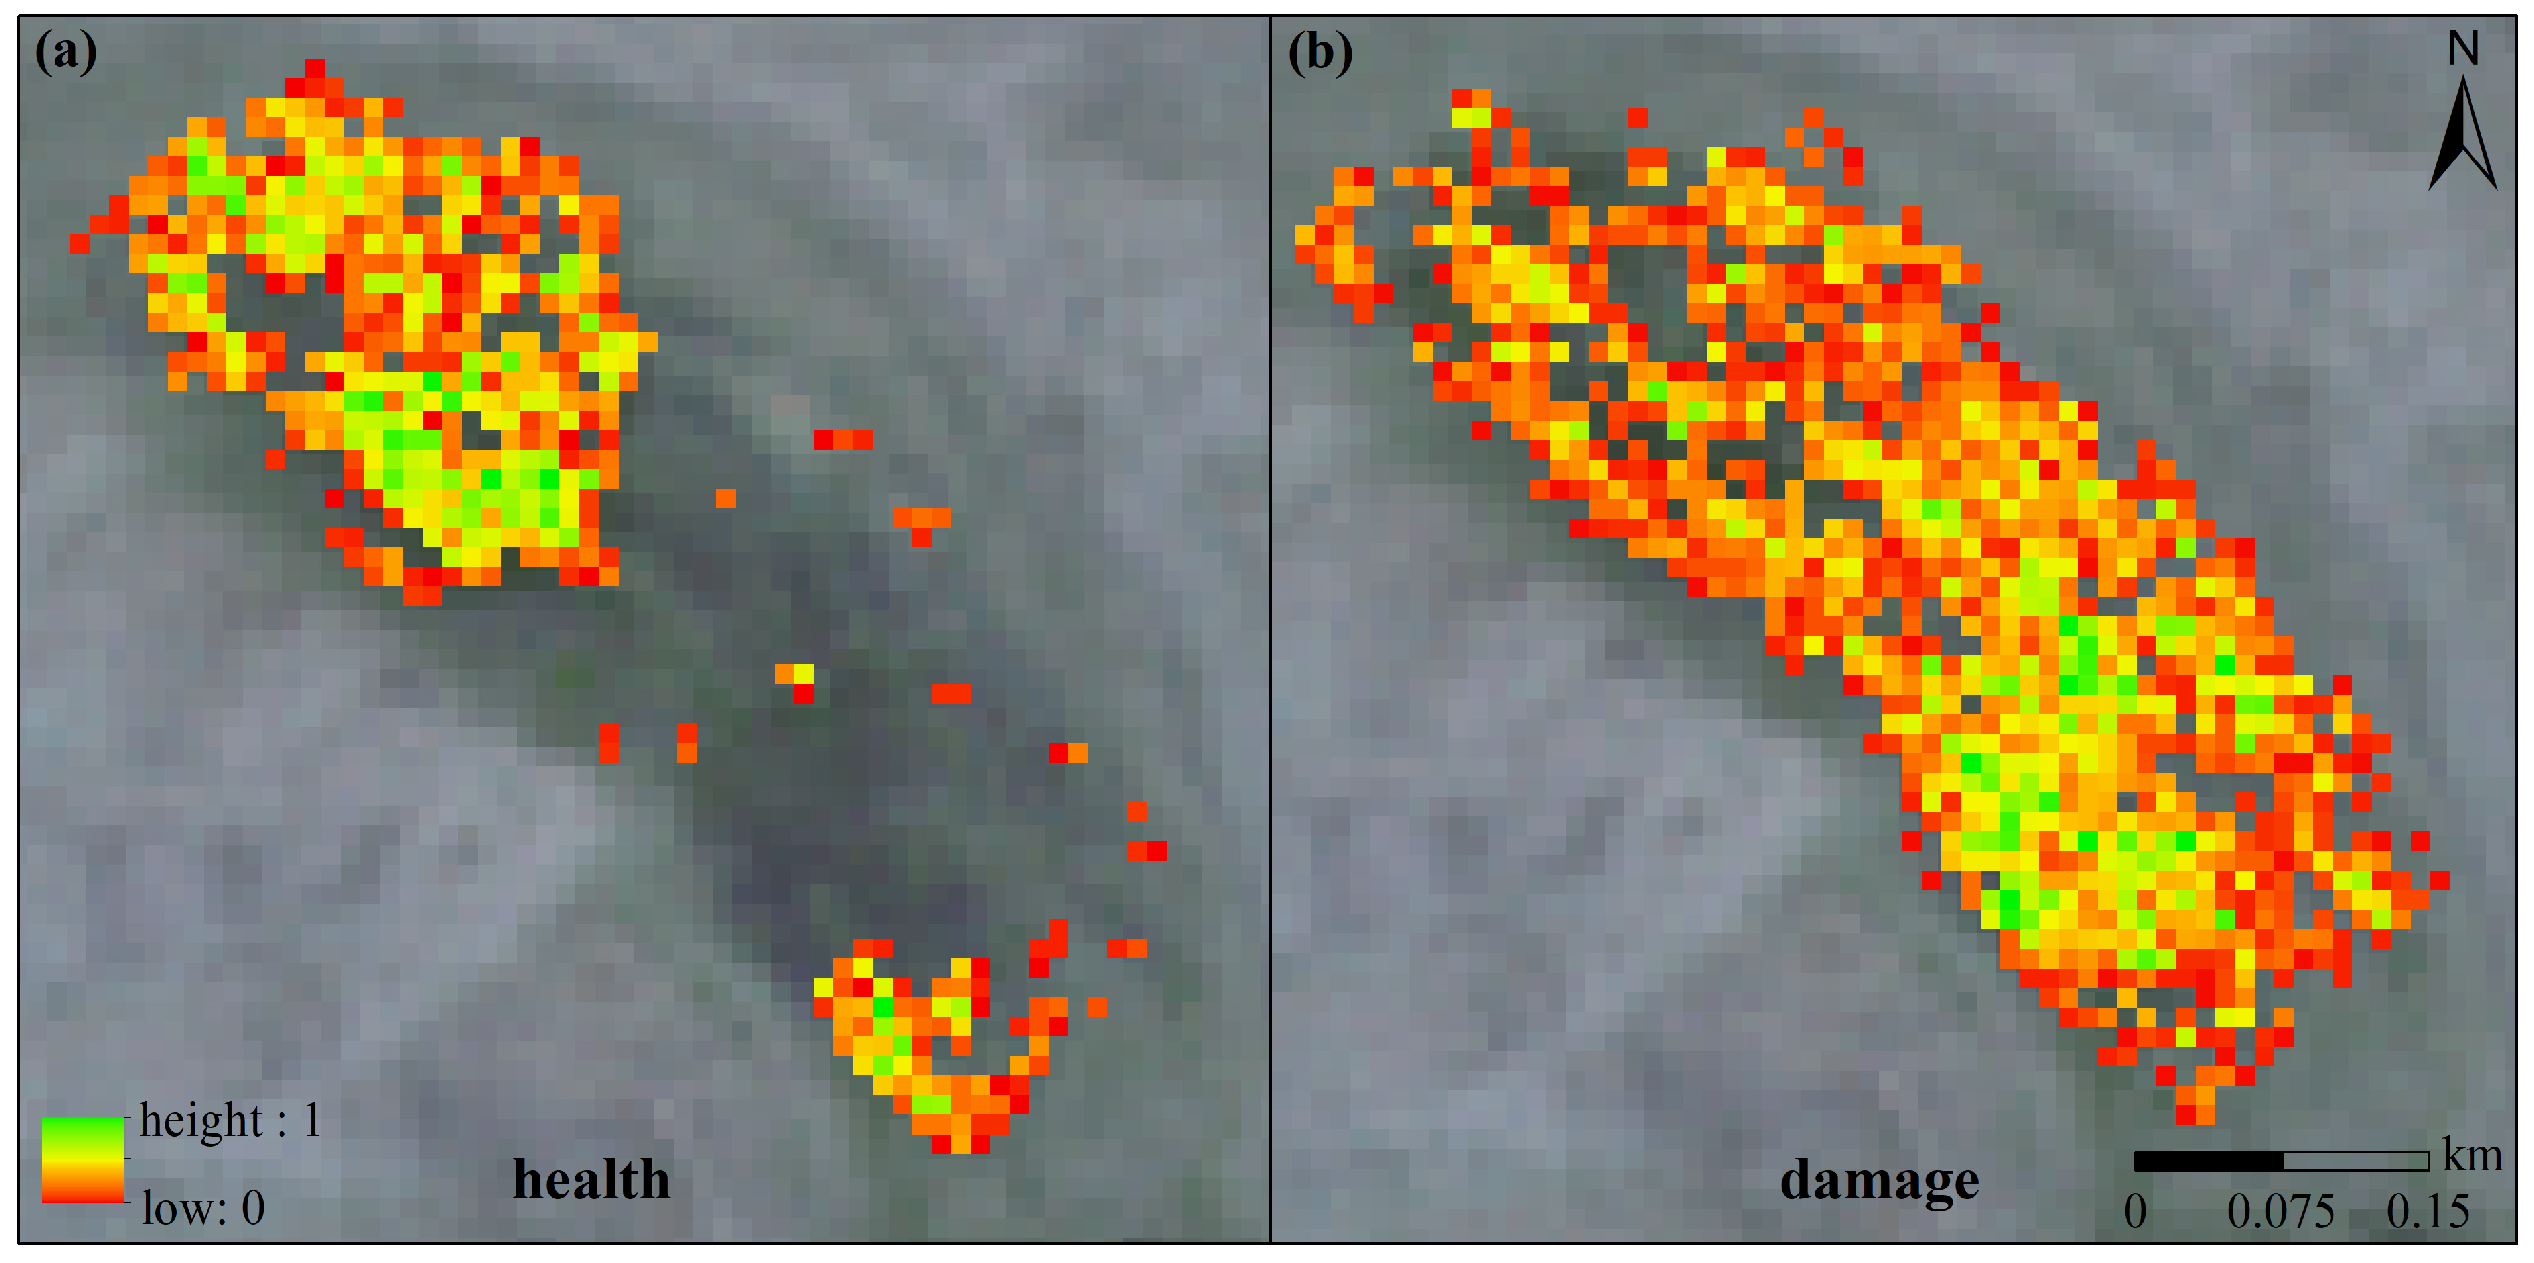
- Calculation of the degree of depression for healthy and damaged larch
- (5)
- Mixed-image element decomposition
- (6)
- Multispectral reflectance simulation
- (i)
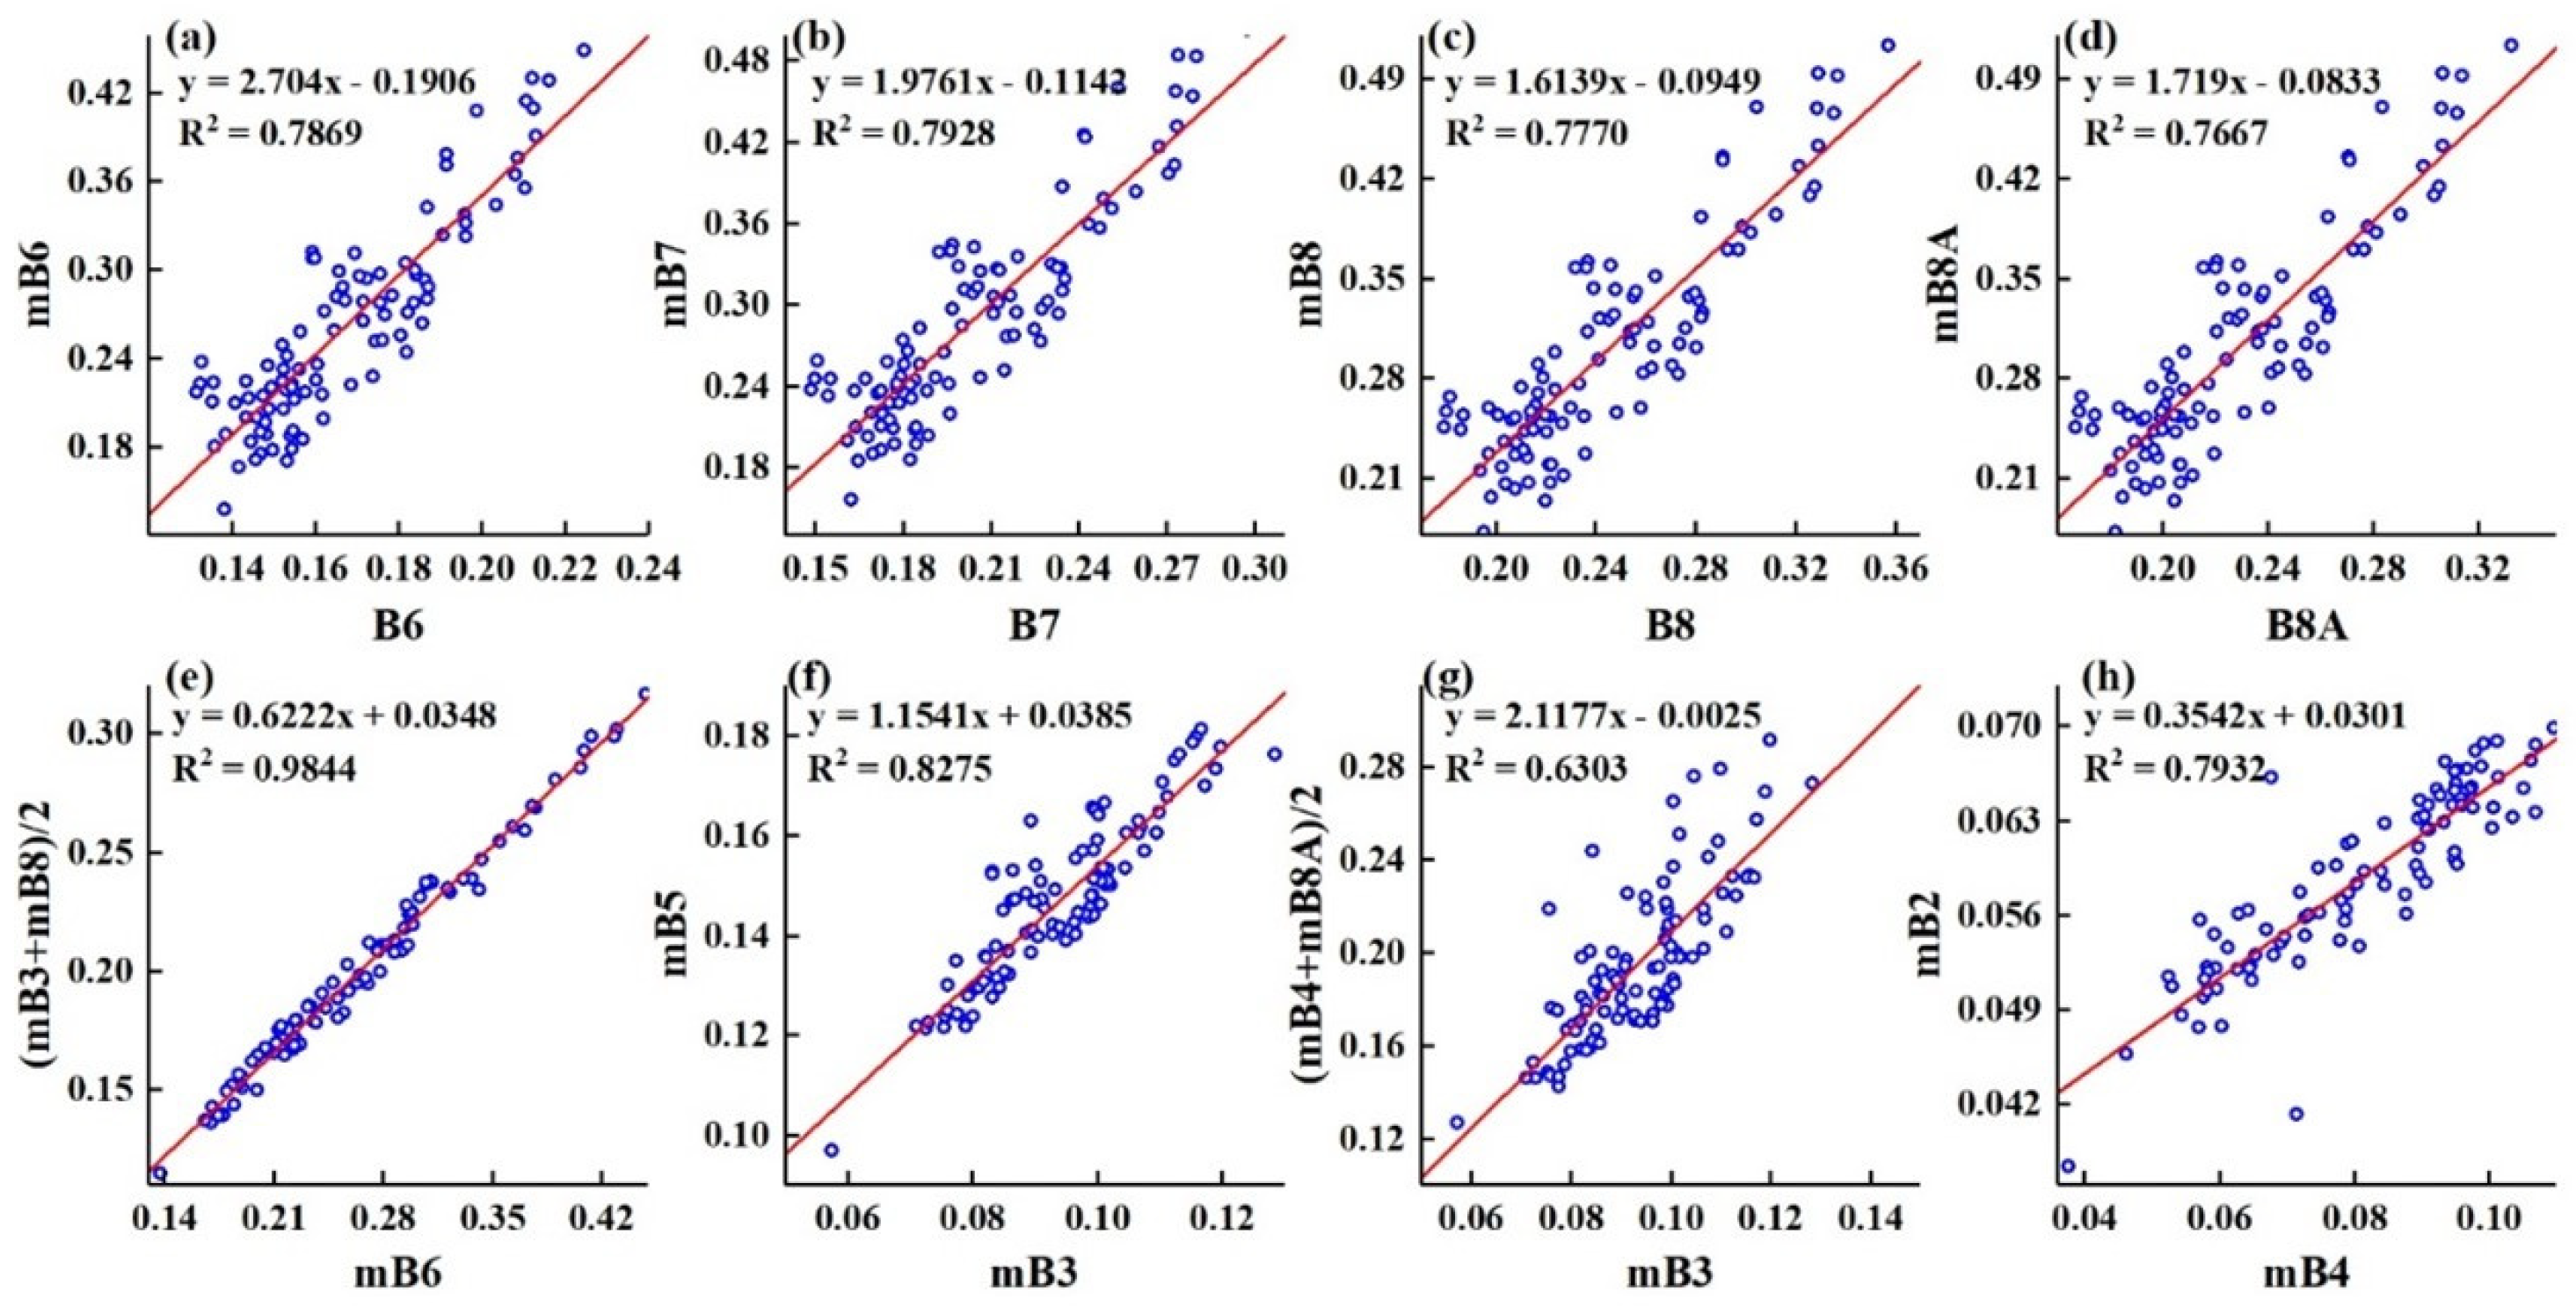
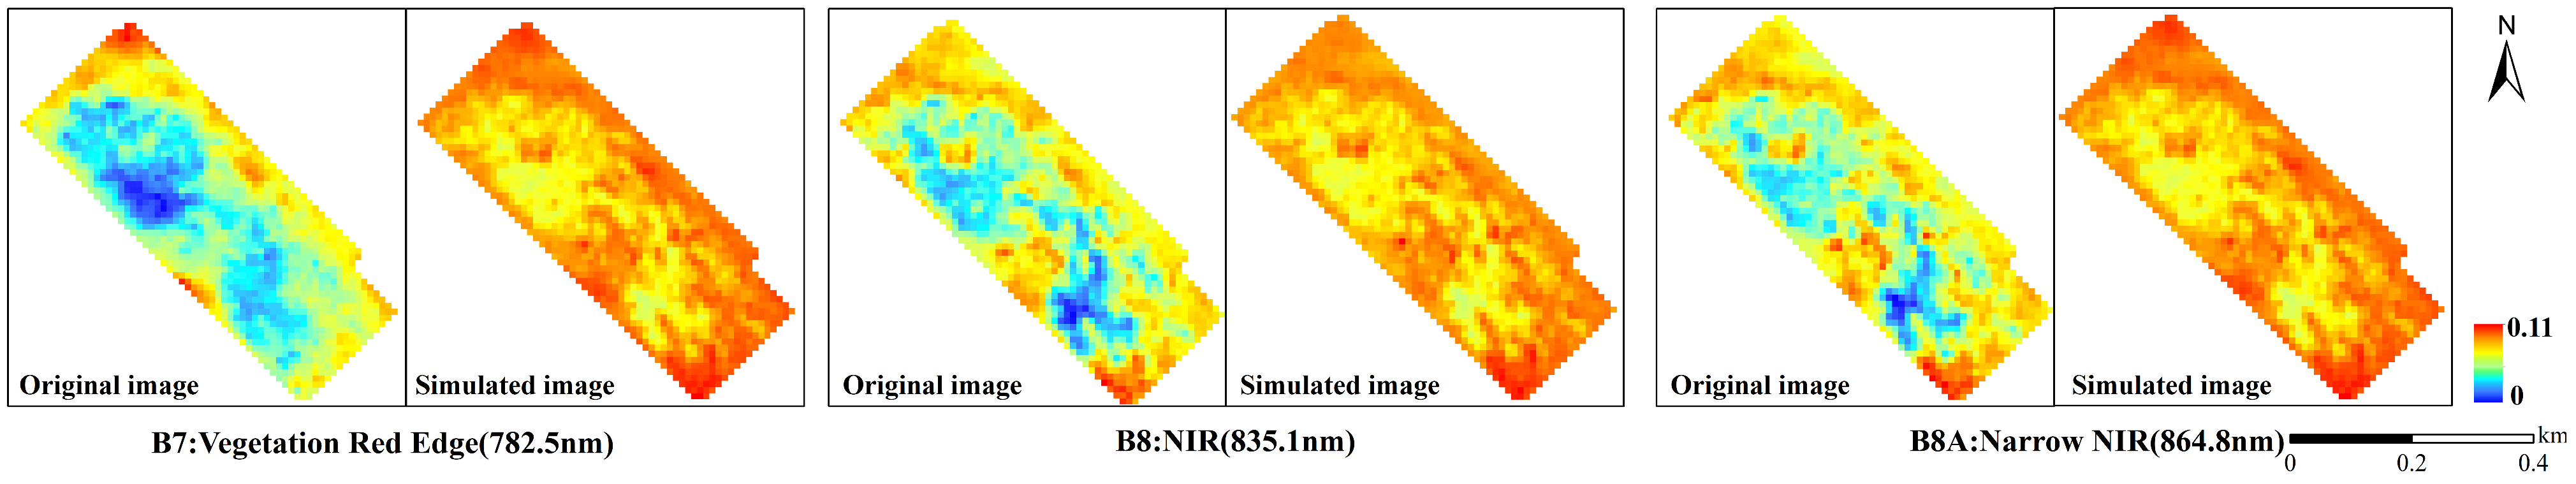
- Sample-plot-based multispectral reflectance modelingThe Sentinel-2A image multispectral reflectance is simulated via ground-based hyperspectral measured data, and the energy received from the Sentinel-2A satellite sensor in each wavelength band can be interpreted as the sum of the energy received at each wavelength within the wavelength range of the band. Therefore, the image multispectral reflectance simulation can be regarded as a redistribution of energy by the spectral response function, which is equivalent to a weighted average of the measured hyperspectral data by wavelength. On this basis, the simulated spectral reflectance of each band can be calculated via the following algorithm:where and are the spectral reflectance and spectral response function of the ith band of the image to be simulated, is the ground-measured spectral reflectance of the sample plots, and are the upper and lower bounds of the spectral range of the ith band of the image to be simulated, respectively.To simulate the multispectral reflectance of the sample plots, 44 sample plots were selected from the experimental area (each plot was as similar to the pure image element as possible), the canopy spectral reflectance of the sample trees in these sample plots was measured, and the spectral reflectance of the sample plots was simulated through the above method with the measured hyperspectral measured data and the spectral response function. Then, considering the relationship between the simulated and actual spectral reflectance, the Sentinel-2A image multispectral reflectance simulation model was constructed.
- (ii)
- Element-based multispectral simulation of Sentinel-2A imagesOn the basis of the reflectance extraction results for healthy and damaged larch, the reflectance values were simulated separately via the sample-based multispectral reflectance simulation model. Then, with the information for healthy () and damaged () larch, the reflectance of each waveband () of image elements was calculated; notably, the reflectance of healthy forest () and damaged forest () elements simulated with the algorithm was obtained with . obtained in this way can realistically reflect the reflectance of the larch canopy.
2.2.3. Estimation Models
- (1)
- Sensitive spectral feature extraction method
- (i)
- Spectral index calculationThe spectral index (denoted as SI) in this study encompasses a vegetation index and texture features. The vegetation index is obtained by calculating the spectral reflectance of two or more bands, which can simplify the spectral information, highlight the vegetation features, and attenuate the influence of background noise on the spectral features of the forest canopy. The spectral texture features reflect the roughness of the forest canopy for areas with different degrees of damage. In this study, the spectral vegetation index and texture features, which are closely related to the chlorophyll content of plants, were selected as the spectral features for chlorophyll estimation, and, consequently, the vegetation spectral index was calculated, as shown in Table 2. The texture features were calculated via a principal component analysis of the Sentinel-2A imagery, followed by the use of the first principal component, which was filtered on the basis of second-order probability statistics to obtain T_mean, T_variance, T_homogeneity, T_contrast, T_dissimilarity, T_entropy, T_ secondmoment and T_correlation, and eight other texture features.
- (ii)
- Spectral derivative characterizationThe derivative of spectral reflectance can be used to identify spectral absorption features and reduce the interference of background noise. Therefore, in this study, the first-order derivatives of the reflectance of the spectral bands in the Sentinel-2A images (denoted D2, D3, D4, D5, D6, D7, D8, and D8A) and the first-order derivatives of the bands combined with the DN35, DR35, SD56, and SDDR indices (denoted D2, D3, D4, D5, D6, D7, D8, and D8A) were calculated with the image derivative module in ENVI as the spectral derivative features (denoted SDF) for the remote sensing monitoring of pests, as follows.DN35 = (D5 − D3)/(D5 + D3)DR35 = D5/D3SD56 = D5 + D6SDDR = (D5 + D6)/D4To compare the accuracy of chlorophyll estimates in cases with simulated and remotely sensed data, spectral indices and spectral derivatives were calculated separately for both cases.
- (iii)
- Spectral sensitivity characterizationTo analyze the correlations between SI and SDF and CHLC, the corresponding coefficients of determination, R2, were calculated. Then, an R2 threshold was selected, and screening was performed to select the sensitive SI and SDF. Next, the SPA algorithm was used to downsize these sensitive spectral features and obtain the spectral features used in the final modeling process.
- (2)
- Monitoring models
2.2.4. Model Evaluation
3. Results
3.1. Downscaling Results for Individual Bands of Sentinel-2A Images
3.2. Simulation of Sentinel-2A Multispectral Reflectance
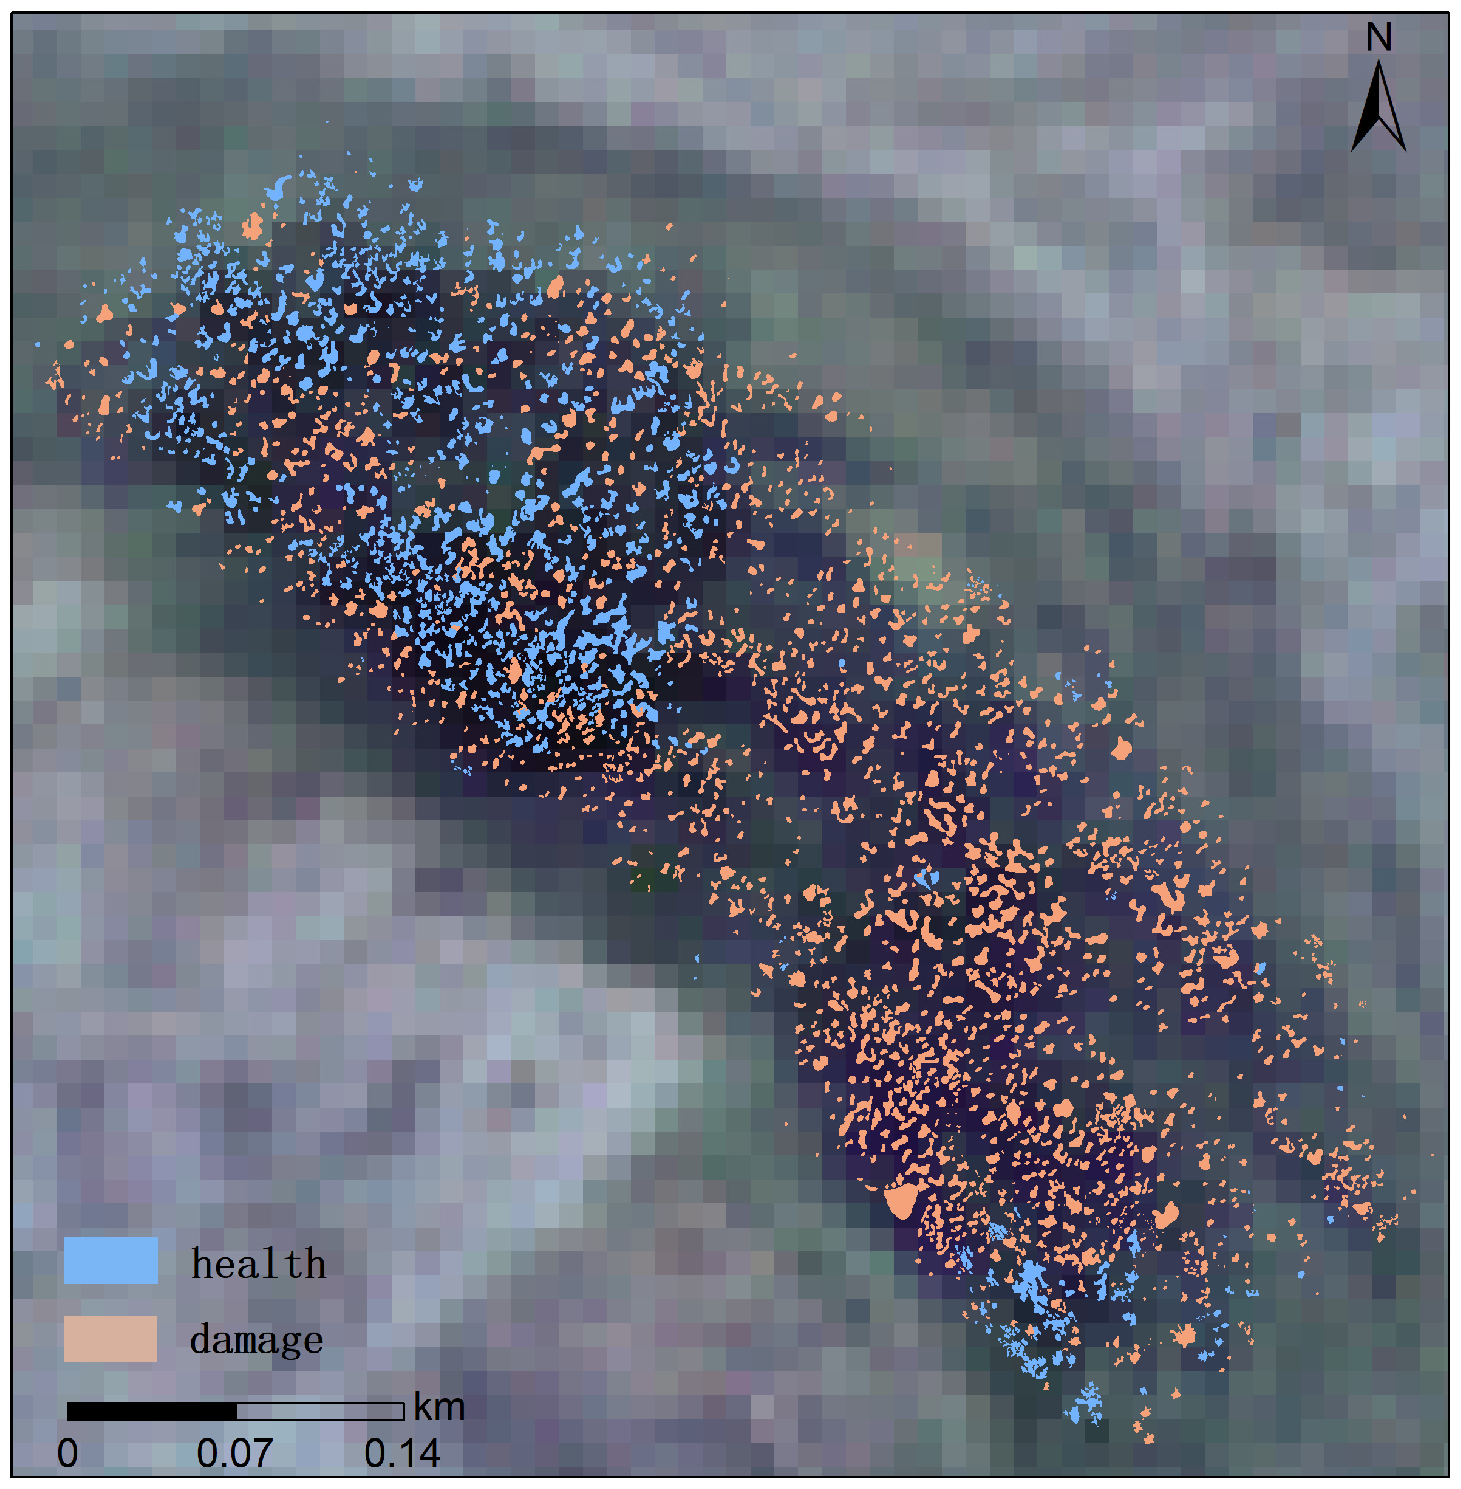
3.2.1. UAV RGB Images-Based Health and Damage Larch Information Extraction
3.2.2. Sentinel-2A Image Pixels-Based Healthy and Damaged Larch Depression Information Extraction
3.2.3. Sample-Plot-Based Multispectral Reflectance Simulation for Sentinel-2A Imagery
3.2.4. Image-Based Multispectral Reflectance Simulation with Sentinel-2A Images
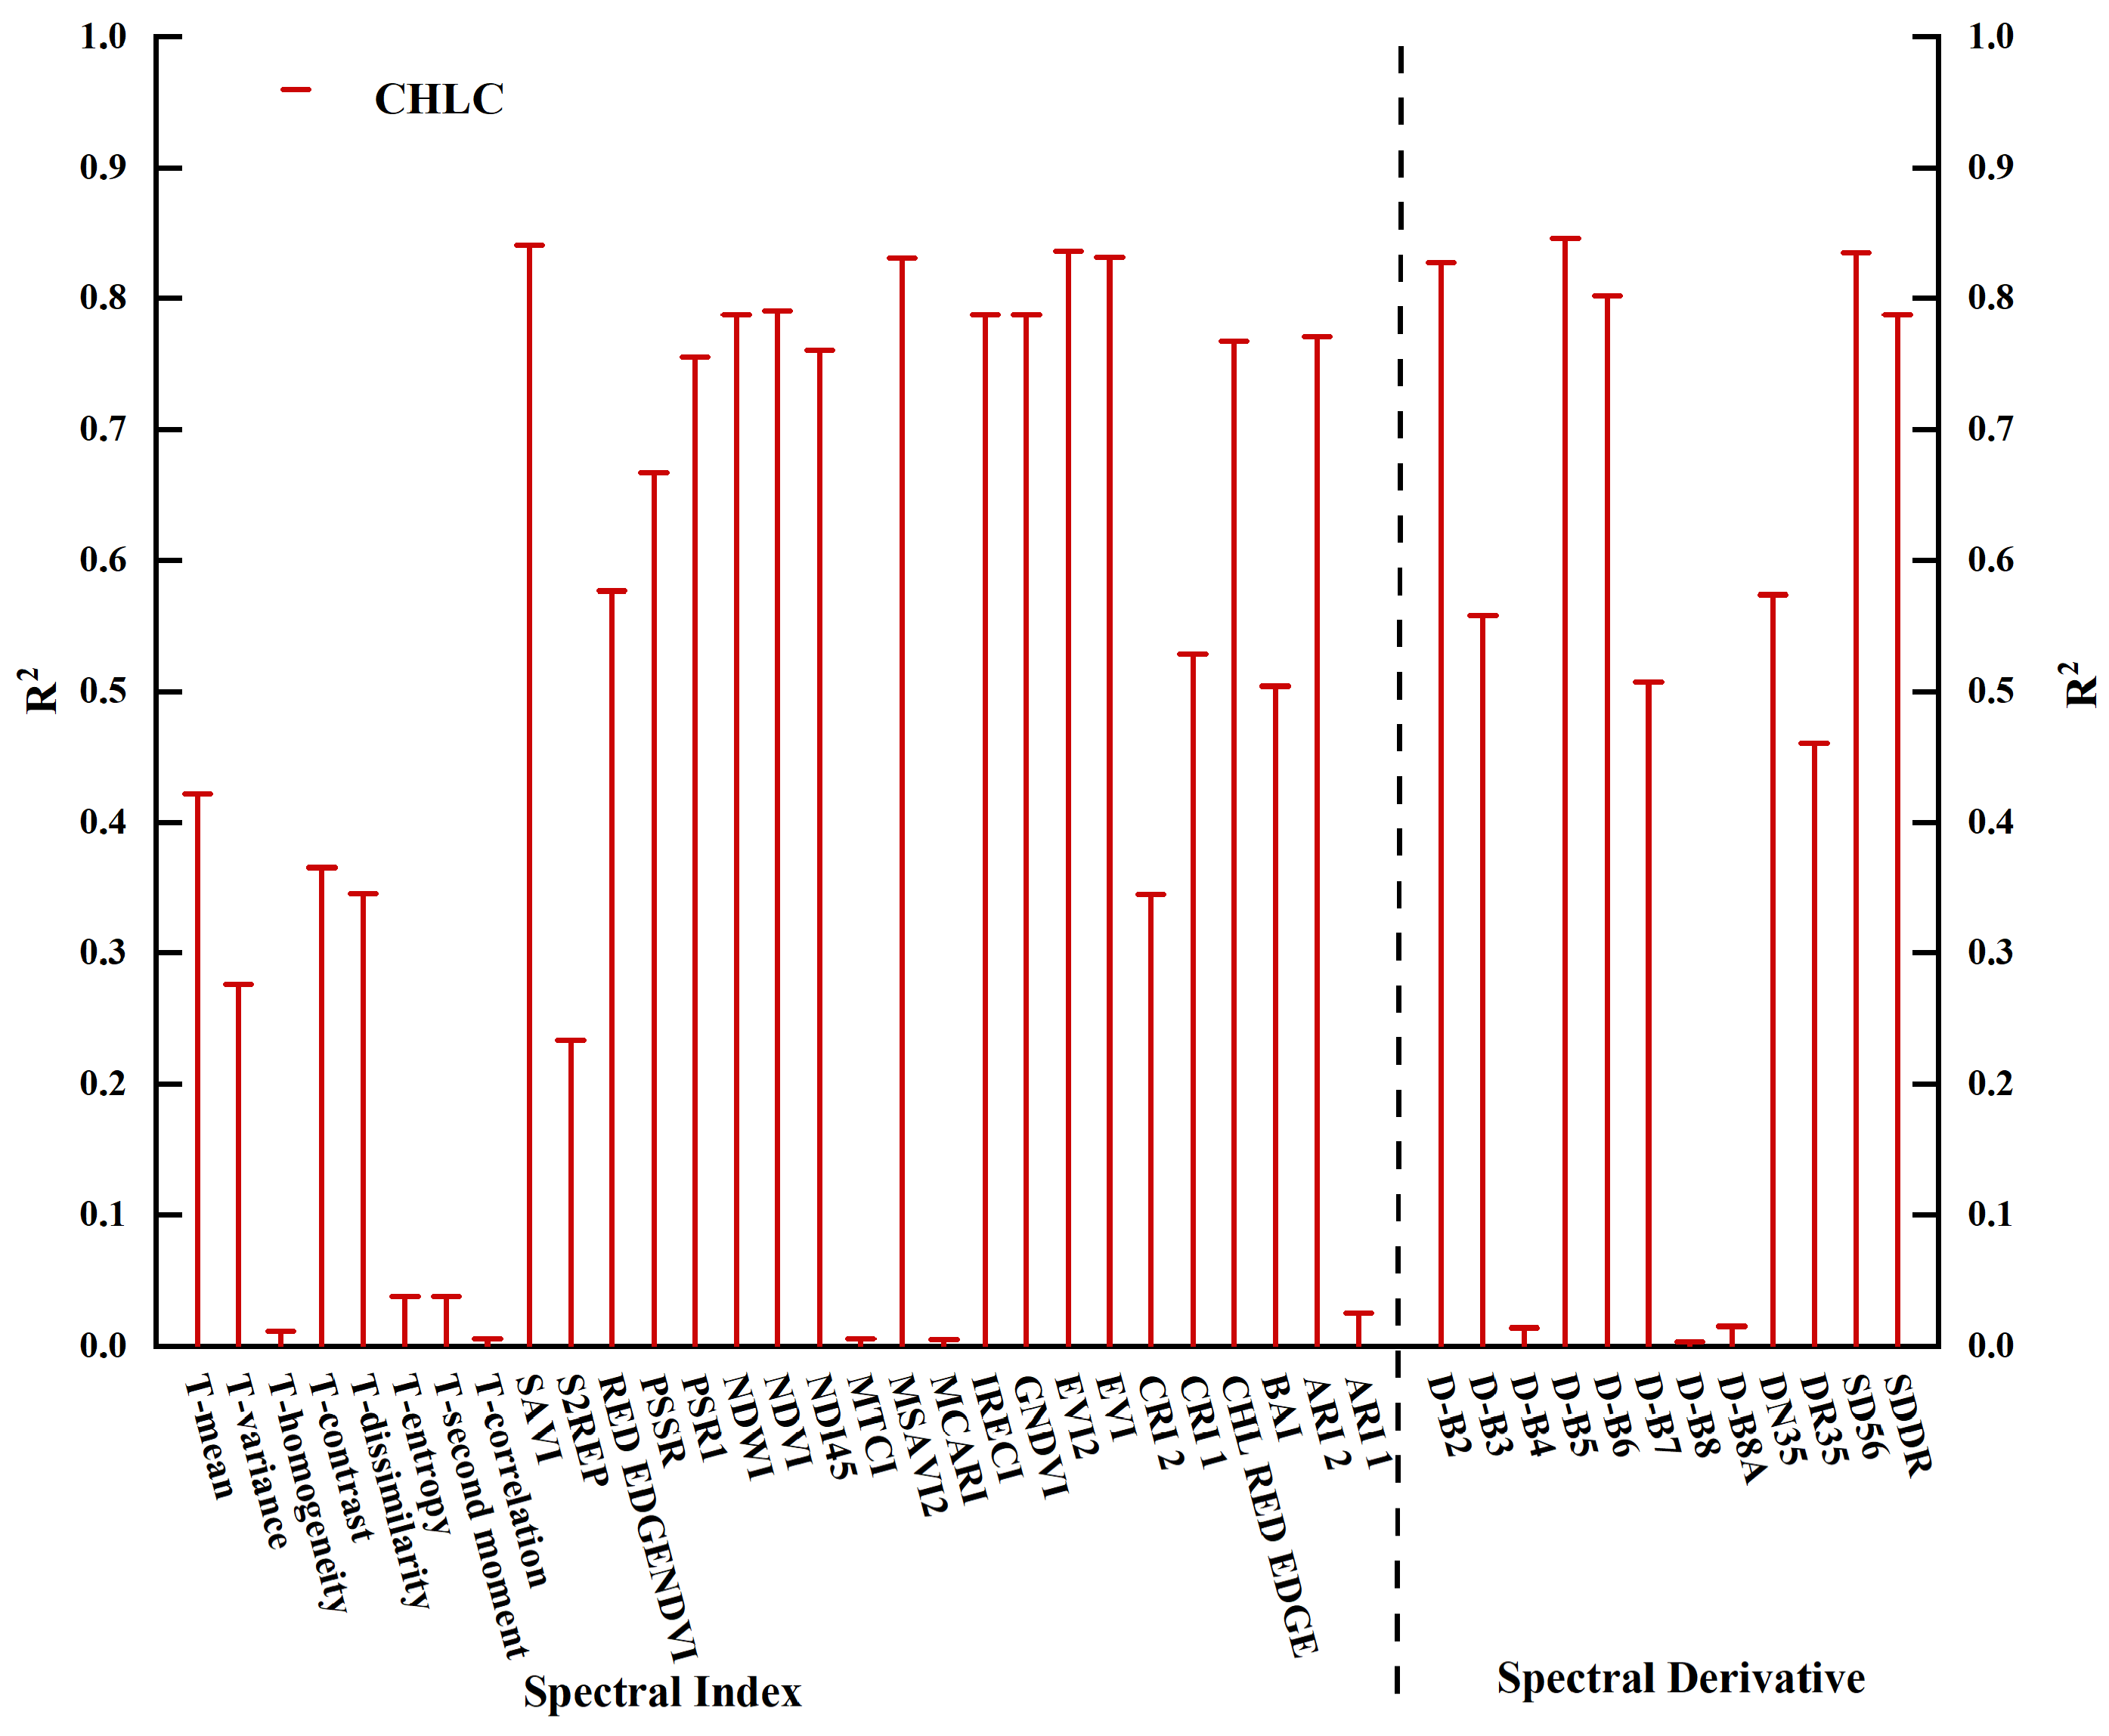
3.3. Spectral Feature Sensitivity Analysis
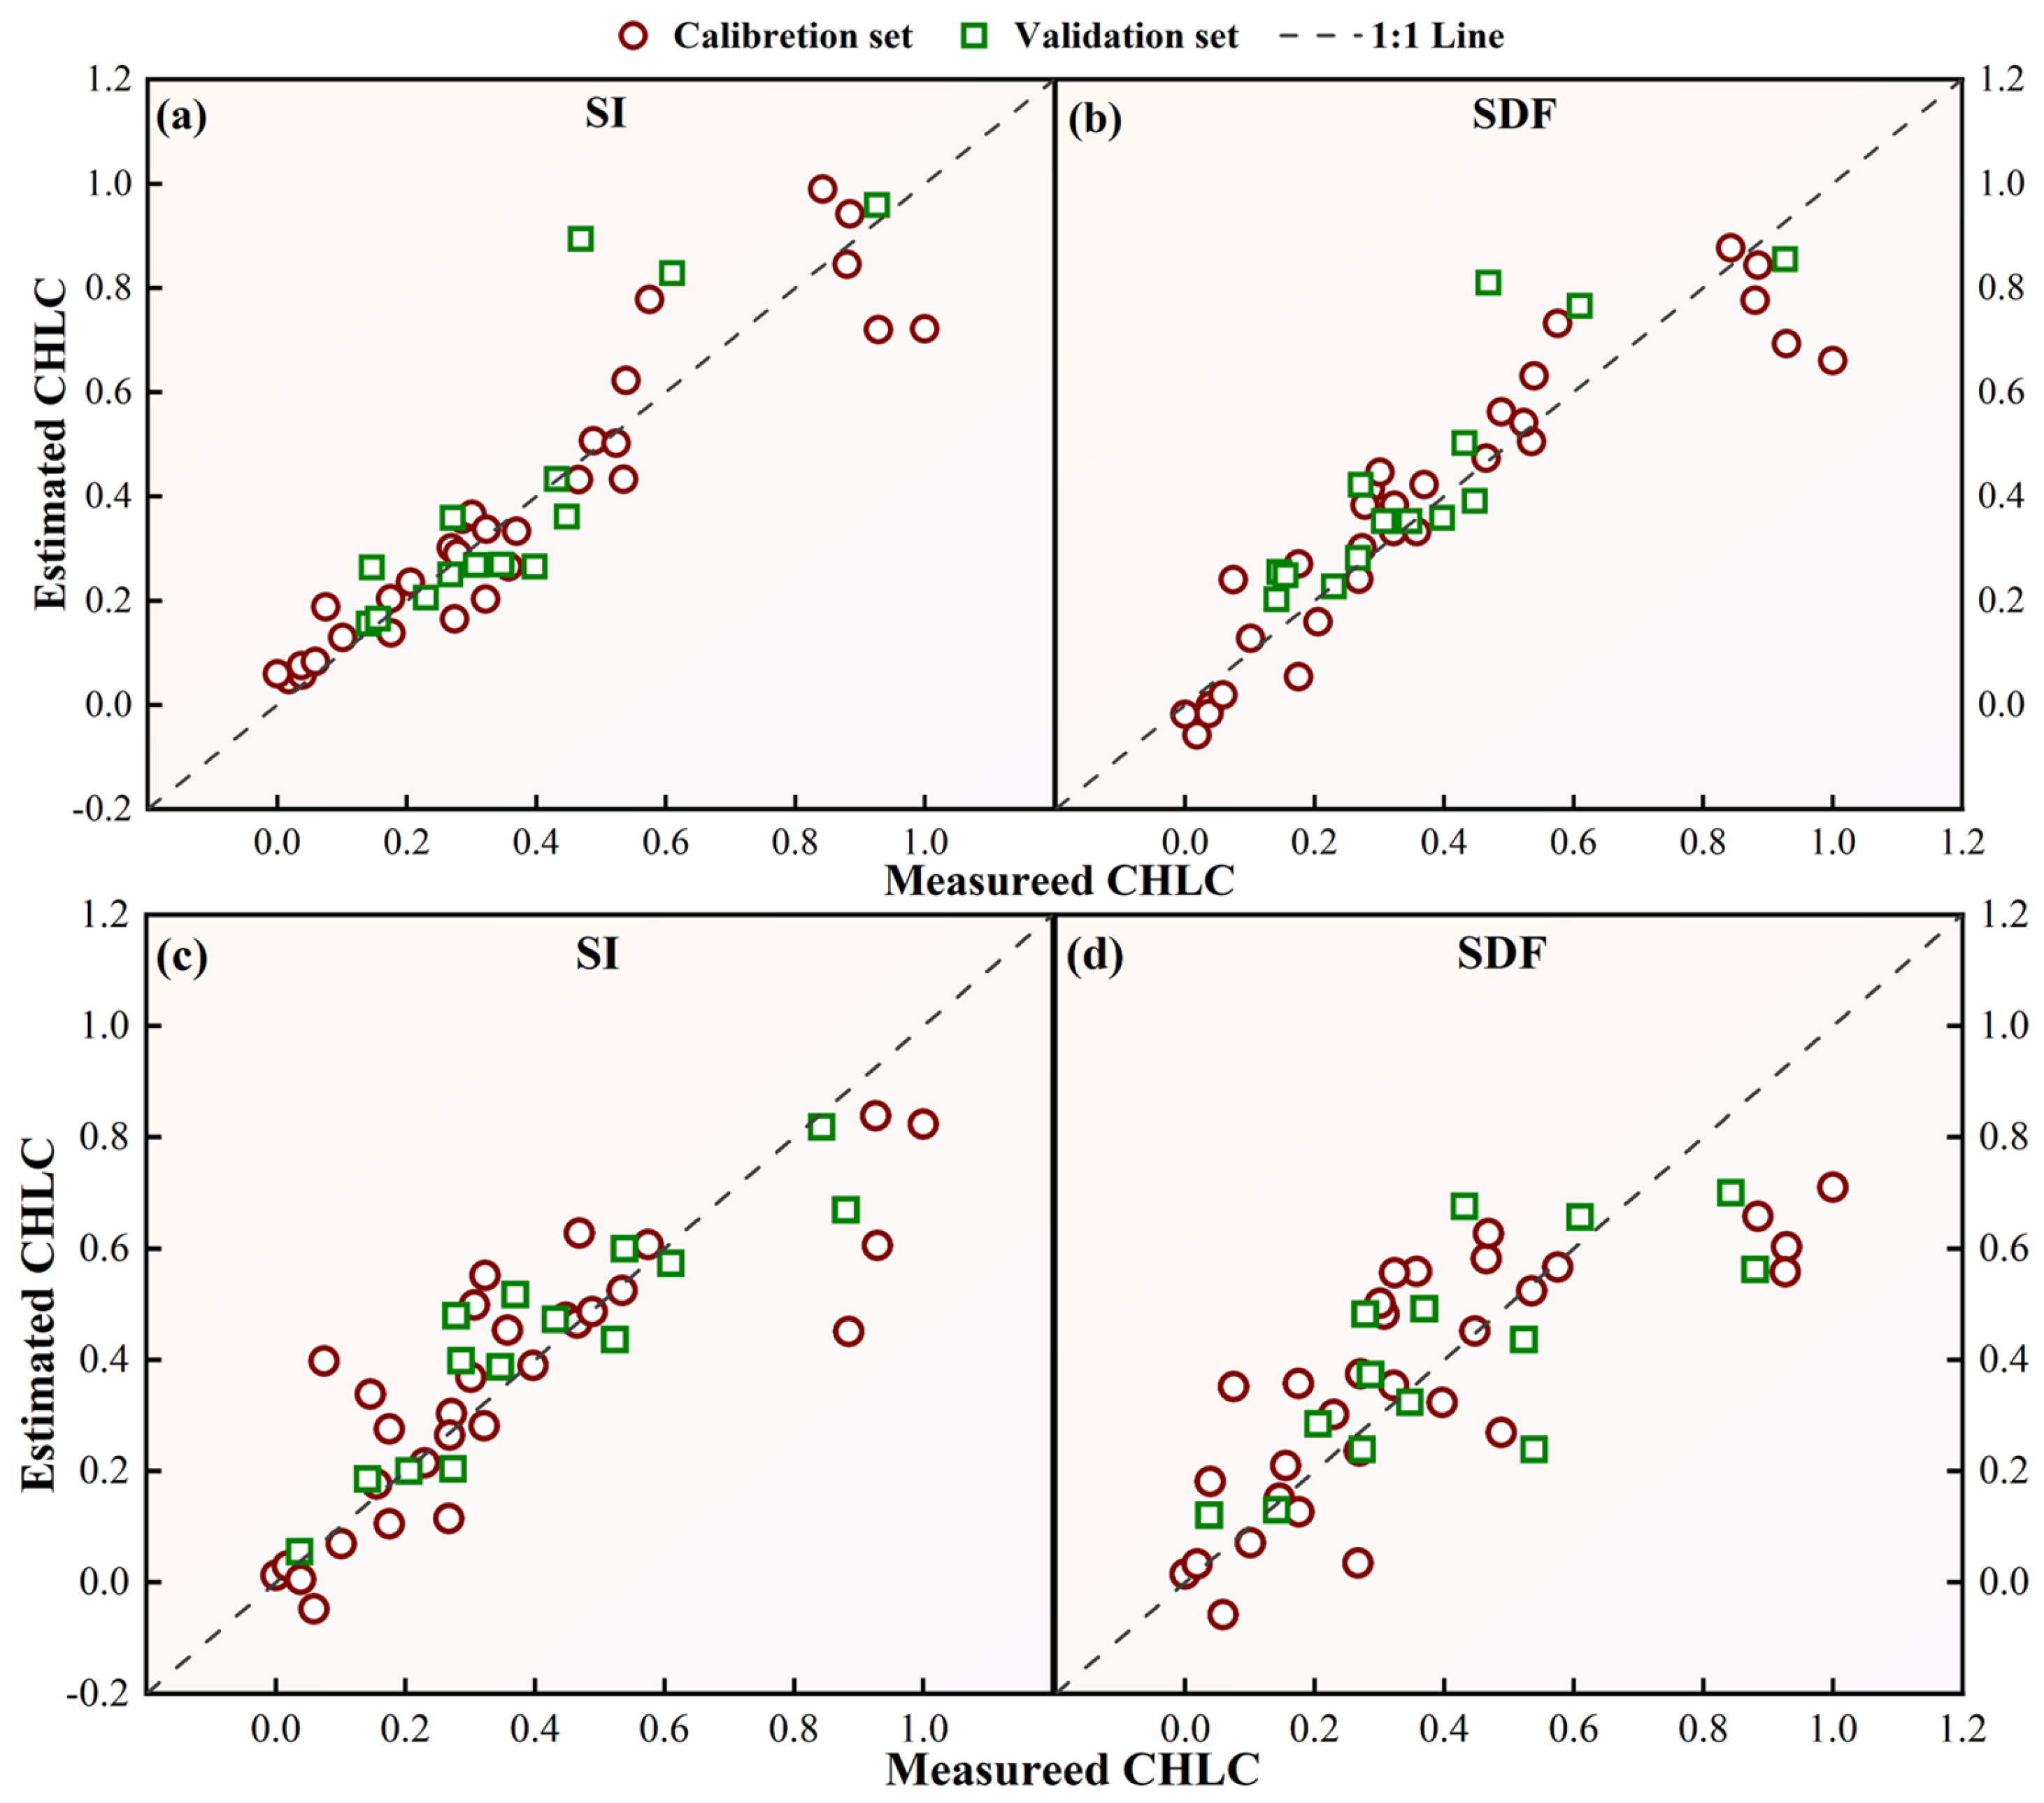
3.4. Conifer Chlorophyll Content Estimation Model and Accuracy Evaluation
4. Discussion
4.1. Multispectral Reflectance Simulation and Mixed-Image Decomposition Effects of Sentinel-2A Data
4.2. Sensitivity of Spectral Characteristics to the Chlorophyll Content
4.3. Accuracy of Chlorophyll Content (CHLC) Estimation with Sentinel-2A Data
5. Conclusions
- (1)
- SI and SDF spectral features based on simulated remote sensing data were significantly sensitive to the chlorophyll content of trees with yarrow larch looper infestations, and the highly sensitive spectral features for th chlorophyll content were the SAVI and EVI2 SIs and the D_B2 and D_B5 SDFs.
- (2)
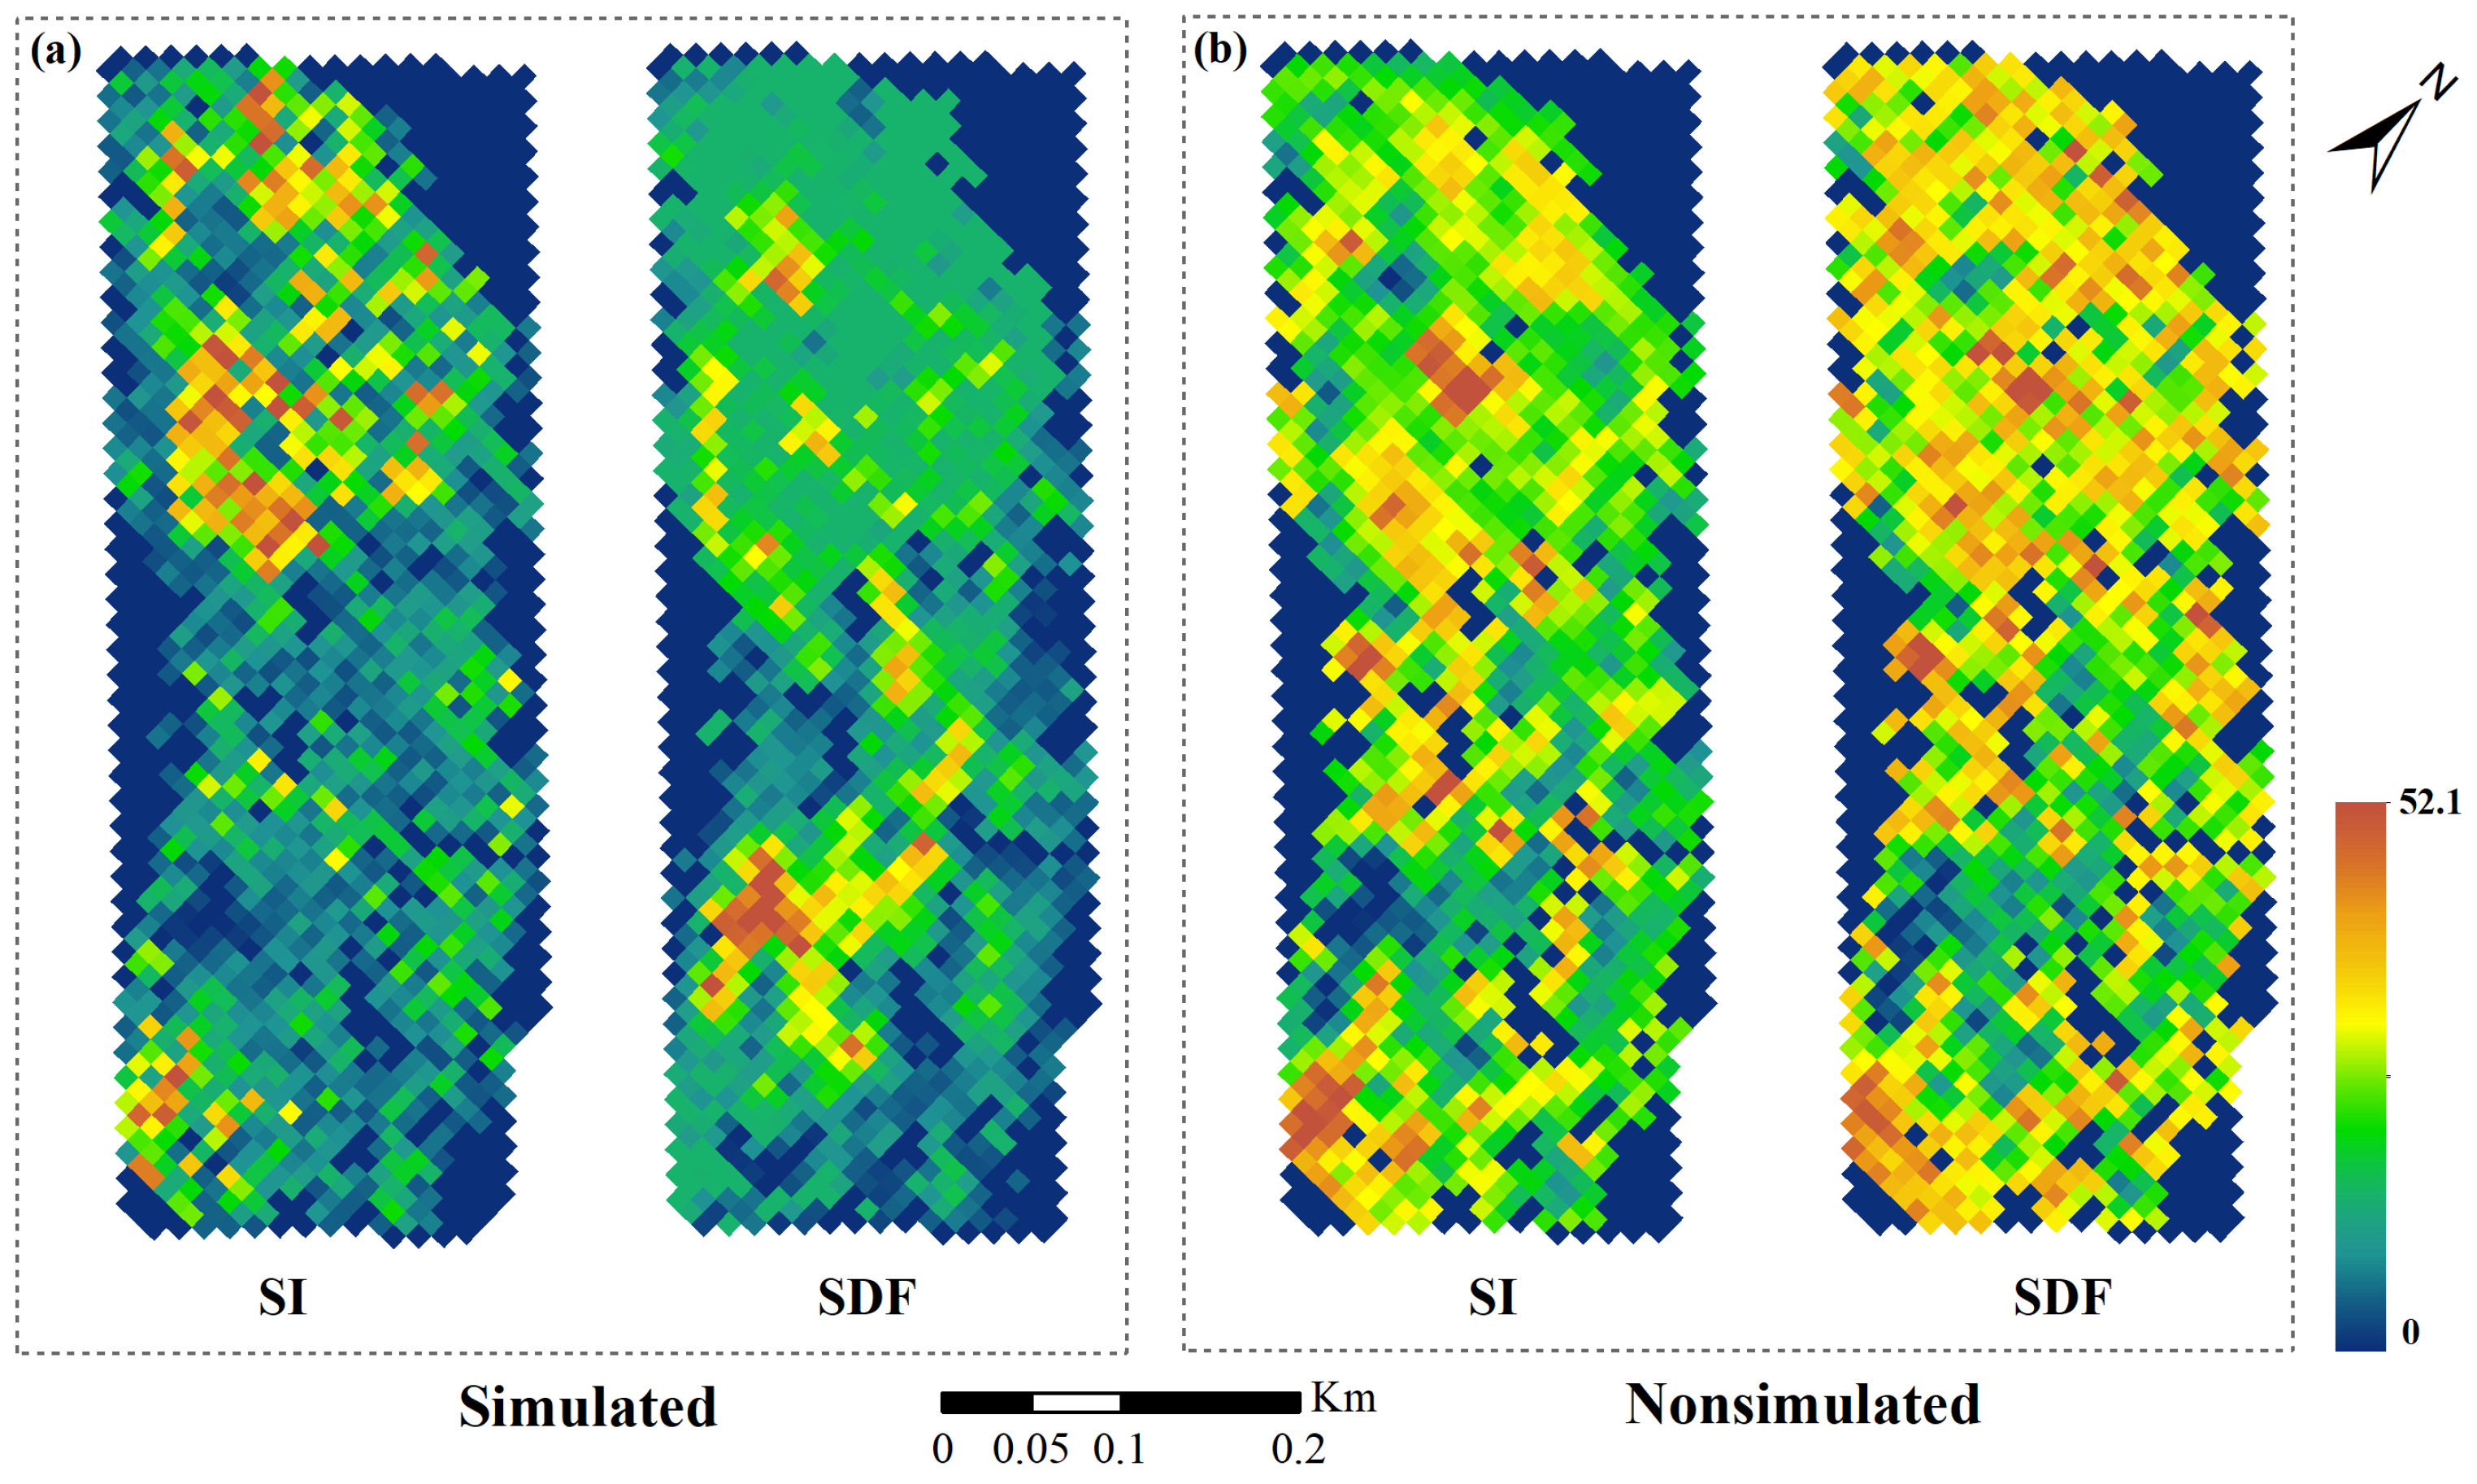
- The estimation model based on simulated data yielded significantly higher accuracy than the model based on nonsimulated data, with better CHLC estimates. Notably, the , , , , and MPI of the SDF-PLSR-based model for pest CHLC estimation were 0.8159, 0.1143, 0.1080, 0.1153, and 0.8636, respectively, which was an improvement in the performance over the SDF-PLSR model on the basis of nonsimulated remote sensing data of at least 0.0404 in each case.
- (3)
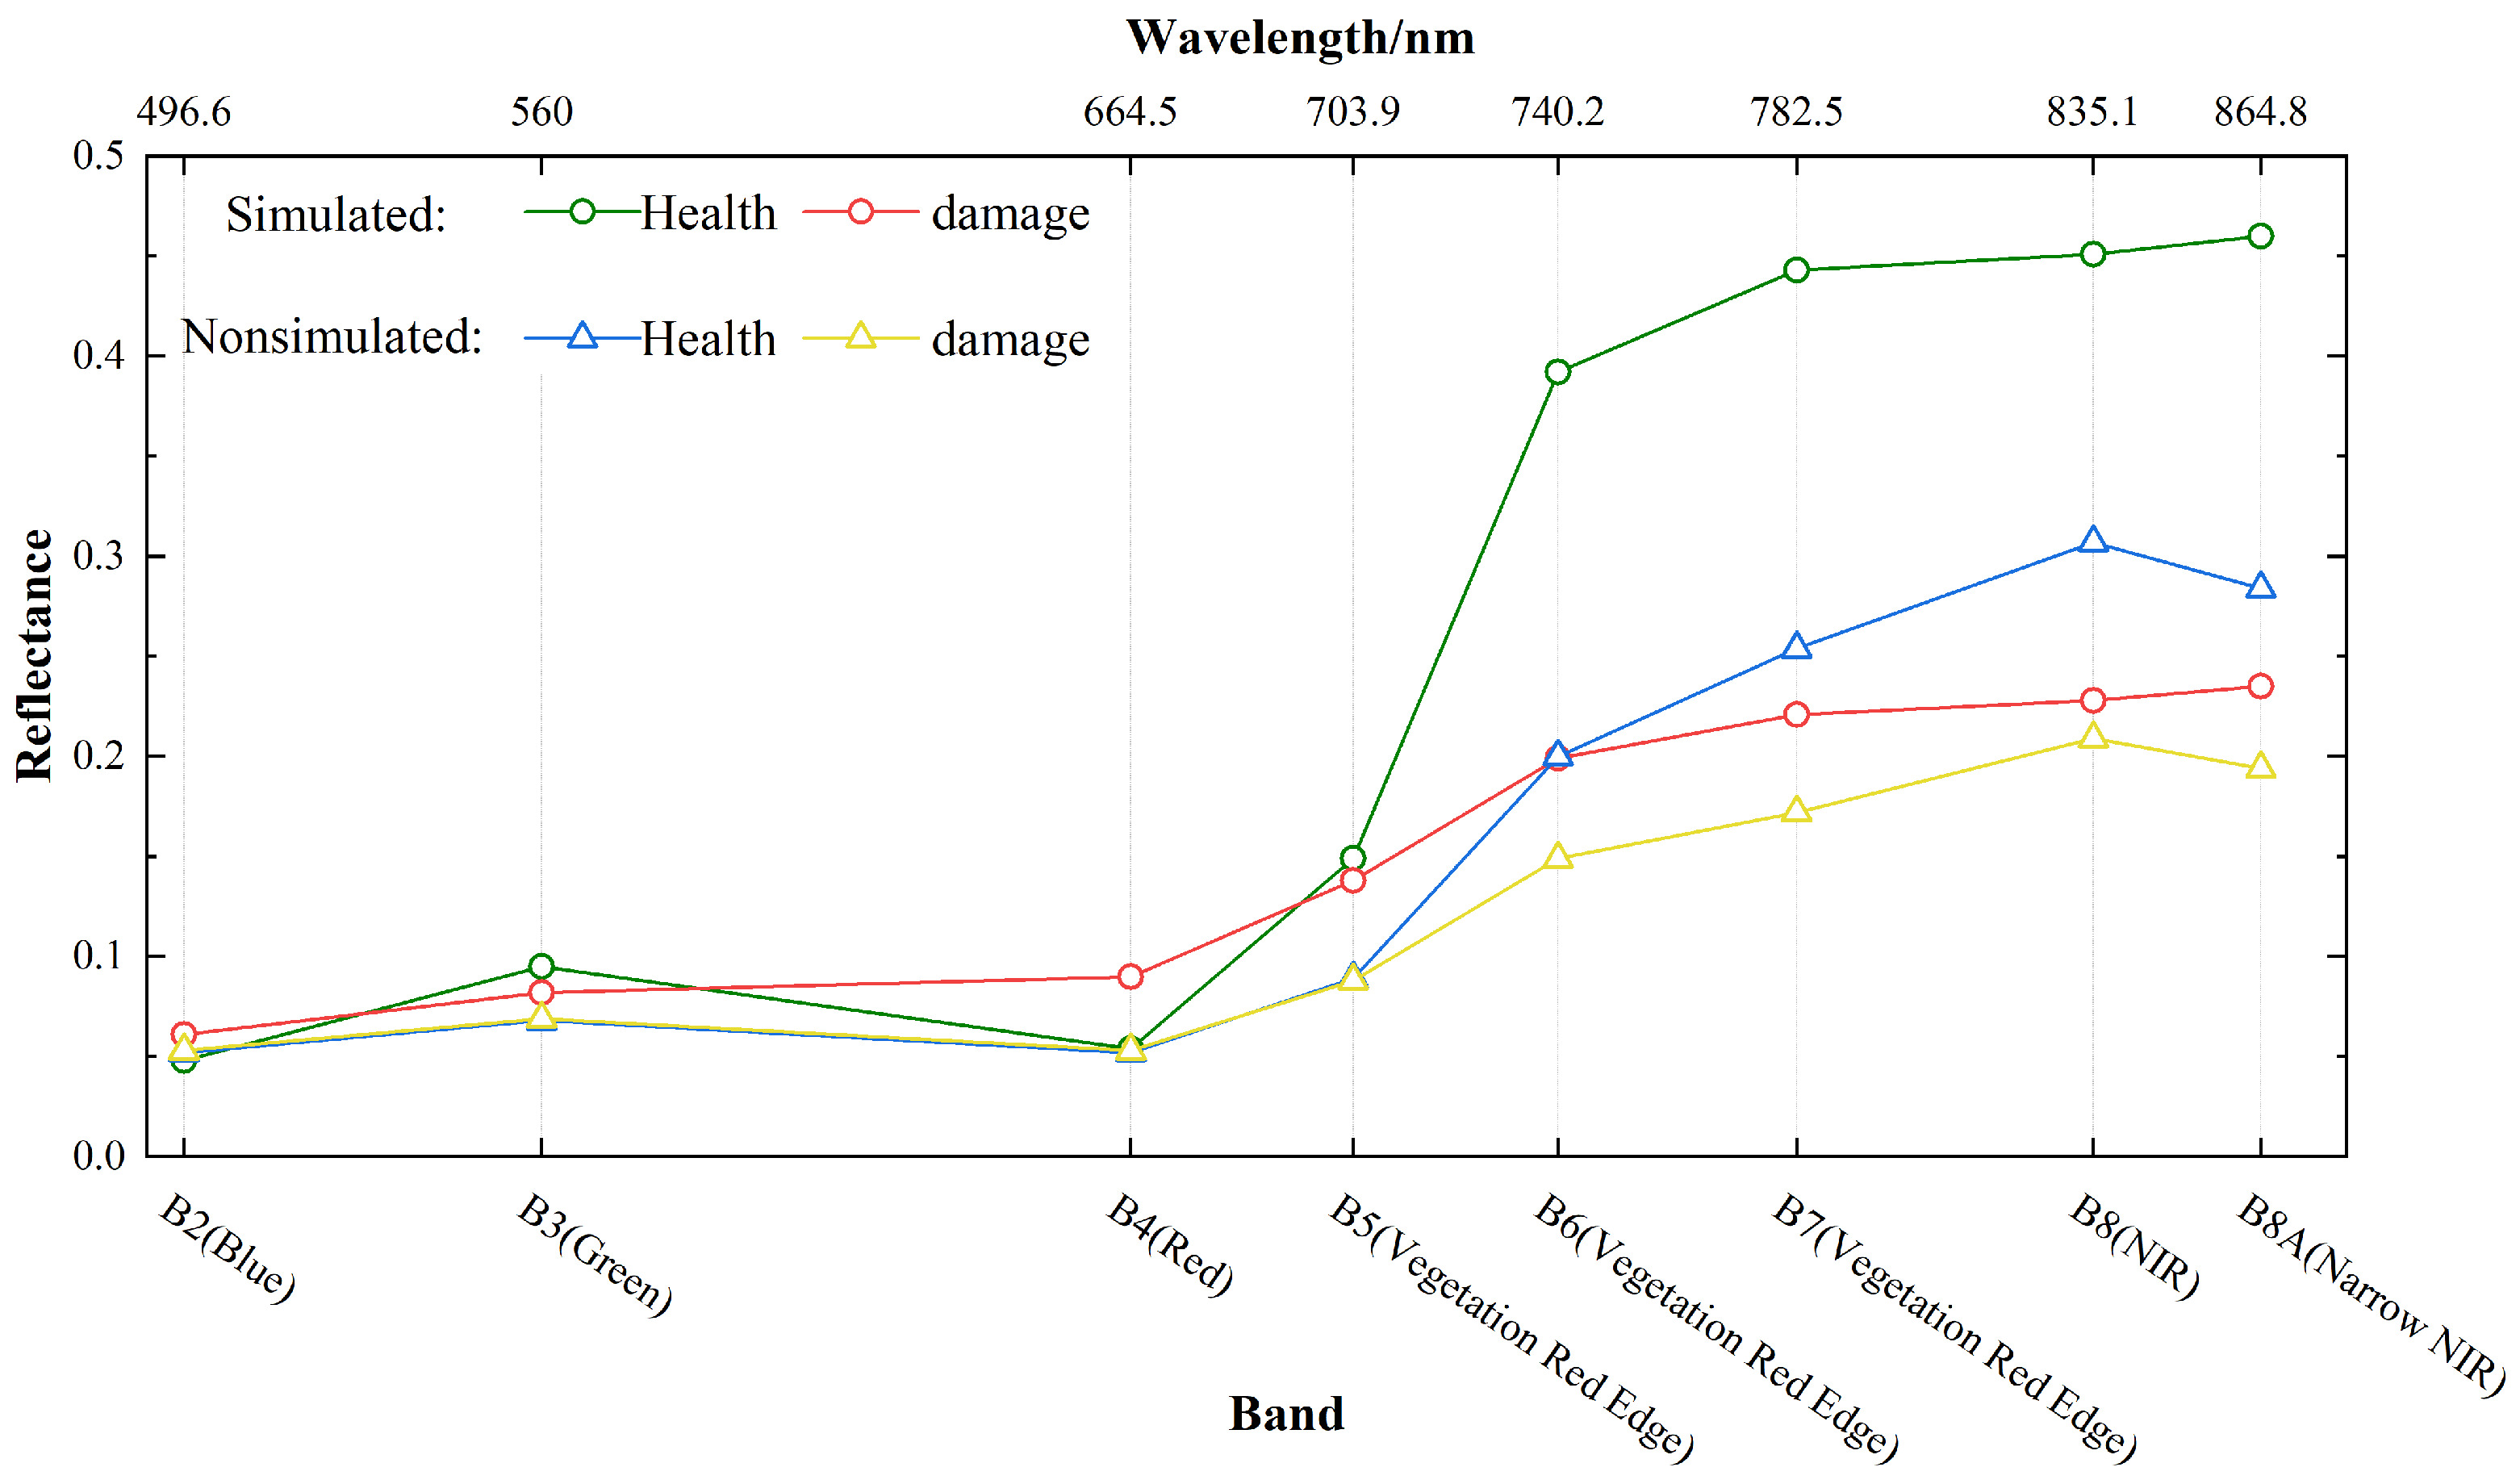
- When the simulated and nonsimulated spectral reflectance values of image elements were compared, the simulated spectral reflectance better reflected the spectral reflectance characteristics of the larch canopy, and the simulated spectral reflectance was more sensitive to larch damage than the nonsimulated spectral reflectance was. Compared with those in the case of nonsimulated spectral reflectance, the decreases in damaged larch in the green light, red edge, and near-infrared bands and the increase in the red light band in the case of simulated data were more significant, indicating that the simulated values were more sensitive to changes in the larch canopy.
Author Contributions
Funding
Data Availability Statement
Conflicts of Interest
References
- Bannari, A.; Khurshid, K.S.; Staenz, K.; Schwarz, J.W. A comparison of hyperspectral chlorophyll indices for wheat crop chlorophyll content estimation using laboratory reflectance measurements. IEEE Trans. Geosci. Remote Sens. 2007, 45, 3063–3074. [Google Scholar] [CrossRef]
- Kandpal, K.C.; Kumar, A. Migrating from Invasive to Noninvasive Techniques for Enhanced Leaf Chlorophyll Content Estimations Efficiency. Crit. Rev. Anal. Chem. 2023, 54, 2583–2598. [Google Scholar] [CrossRef] [PubMed]
- Clevers, J.; Kooistra, L.; van den Brande, M.M.M. Using Sentinel-2 Data for Retrieving LAI and Leaf and Canopy Chlorophyll Content of a Potato Crop. Remote Sens. 2017, 9, 405. [Google Scholar] [CrossRef]
- Qian, B.; Ye, H.; Huang, W.; Xie, Q.; Pan, Y.; Xing, N.; Ren, Y.; Guo, A.; Jiao, Q.; Lan, Y. A sentinel-2-based triangular vegetation index for chlorophyll content estimation. Agric. For. Meteorol. 2022, 322, 109000. [Google Scholar] [CrossRef]
- Gara, T.W.; Skidmore, A.K.; Darvishzadeh, R.; Wang, T.J. Leaf to canopy upscaling approach affects the estimation of canopy traits. Gisci. Remote Sens. 2019, 56, 554–575. [Google Scholar] [CrossRef]
- Chemura, A.; Mutanga, O.; Odindi, J. Empirical Modeling of Leaf Chlorophyll Content in Coffee (Coffea arabica) Plantations with Sentinel-2 MSI Data: Effects of Spectral Settings, Spatial Resolution, and Crop Canopy Cover. IEEE J. Sel. Top. Appl. Earth Obs. Remote Sens. 2017, 10, 5541–5550. [Google Scholar] [CrossRef]
- Frampton, W.J.; Dash, J.; Watmough, G.; Milton, E.J. Evaluating the capabilities of Sentinel-2 for quantitative estimation of biophysical variables in vegetation. Isprs J. Photogramm. Remote Sens. 2013, 82, 83–92. [Google Scholar] [CrossRef]
- Revill, A.; Florence, A.; MacArthur, A.; Hoad, S.P.; Rees, R.M.; Williams, M. The Value of Sentinel-2 Spectral Bands for the Assessment of Winter Wheat Growth and Development. Remote Sens. 2019, 11, 2050. [Google Scholar] [CrossRef]
- Ali, A.M.; Darvishzadeh, R.; Skidmore, A.; Gara, T.W.; O’Connor, B.; Roeoesli, C.; Heurich, M.; Paganini, M. Comparing methods for mapping canopy chlorophyll content in a mixed mountain forest using Sentinel-2 data. Int. J. Appl. Earth Obs. Geoinf. 2020, 87, 102037. [Google Scholar] [CrossRef]
- Chen, Z.L.; Jia, K.; Wei, X.Q.; Liu, Y.; Zhan, Y.L.; Xia, M.; Yao, Y.J.; Zhang, X.T. Improving leaf area index estimation accuracy of wheat by involving leaf chlorophyll content information. Comput. Electron. Agric. 2022, 196, 106902. [Google Scholar] [CrossRef]
- Wu, C.Y.; Wang, L.; Niu, Z.; Gao, S.A.; Wu, M.Q. Nondestructive estimation of canopy chlorophyll content using Hyperion and Landsat/TM images. Int. J. Remote Sens. 2010, 31, 2159–2167. [Google Scholar] [CrossRef]
- Su, W.; Sun, Z.P.; Chen, W.H.; Zhang, X.D.; Yao, C.; Wu, J.Y.; Huang, J.X.; Zhu, D.H. Joint Retrieval of Growing Season Corn Canopy LAI and Leaf Chlorophyll Content by Fusing Sentinel-2 and MODIS Images. Remote Sens. 2019, 11, 2409. [Google Scholar] [CrossRef]
- Croft, H.; Chen, J.M.; Zhang, Y.; Simic, A.; Noland, T.L.; Nesbitt, N.; Arabian, J. Evaluating leaf chlorophyll content prediction from multispectral remote sensing data within a physically-based modelling framework. Isprs J. Photogramm. Remote Sens. 2015, 102, 85–95. [Google Scholar] [CrossRef]
- Gu, C.P.; Li, J.; Liu, Q.H.; Zhang, H.; Liu, L.Y.; Mumtaz, F.; Dong, Y.D.; Zhao, J.; Wang, X.H.; Liu, C. Retrieving decametric-resolution leaf chlorophyll content from GF-6 WFV by assessing the applicability of red-edge vegetation indices. Comput. Electron. Agric. 2023, 215, 108455. [Google Scholar] [CrossRef]
- Darvishzadeh, R.; Skidmore, A.; Abdullah, H.; Cherenet, E.; Ali, A.; Wang, T.J.; Nieuwenhuis, W.; Heurich, M.; Vrieling, A.; O’Connor, B.; et al. Mapping leaf chlorophyll content from Sentinel-2 and RapidEye data in spruce stands using the invertible forest reflectance model. Int. J. Appl. Earth Obs. Geoinf. 2019, 79, 58–70. [Google Scholar] [CrossRef]
- Delloye, C.; Weiss, M.; Defourny, P. Retrieval of the canopy chlorophyll content from Sentinel-2 spectral bands to estimate nitrogen uptake in intensive winter wheat cropping systems. Remote Sens. Environ. 2018, 216, 245–261. [Google Scholar] [CrossRef]
- Clevers, J.; Gitelson, A.A. Remote estimation of crop and grass chlorophyll and nitrogen content using red-edge bands on Sentinel-2 and-3. Int. J. Appl. Earth Obs. Geoinf. 2013, 23, 344–351. [Google Scholar] [CrossRef]
- Xu, J.; Quackenbush, L.J.; Volk, T.A.; Im, J. Estimation of shrub willow biophysical parameters across time and space from Sentinel-2 and unmanned aerial system (UAS) data. Field Crops Res. 2022, 287, 108655. [Google Scholar] [CrossRef]
- Dong, T.F.; Meng, J.H.; Shang, J.L.; Liu, J.G.; Wu, B.F. Evaluation of Chlorophyll-Related Vegetation Indices Using Simulated Sentinel-2 Data for Estimation of Crop Fraction of Absorbed Photosynthetically Active Radiation. IEEE J. Sel. Top. Appl. Earth Obs. Remote Sens. 2015, 8, 4049–4059. [Google Scholar] [CrossRef]
- Mahanta, D.K.; Bhoi, T.K.; Komal, J.; Samal, I.; Mastinu, A. Spatial, spectral and temporal insights: Harnessing high-resolution satellite remote sensing and artificial intelligence for early monitoring of wood boring pests in forests. Plant Stress 2024, 11, 100381. [Google Scholar] [CrossRef]
- Zhang, M.Z.; Su, W.; Fu, Y.T.; Zhu, D.H.; Xue, J.H.; Huang, J.X.; Wang, W.; Wu, J.Y.; Yao, C. Super-resolution enhancement of Sentinel-2 image for retrieving LAI and chlorophyll content of summer corn. Eur. J. Agron. 2019, 111, 125938. [Google Scholar] [CrossRef]
- Sun, Y.H.; Wang, B.Y.; Zhang, Z.X. Improving Leaf Area Index Estimation With Chlorophyll Insensitive Multispectral Red-Edge Vegetation Indices. IEEE J. Sel. Top. Appl. Earth Obs. Remote Sens. 2023, 16, 3568–3582. [Google Scholar] [CrossRef]
- Kong, J.; Ryu, Y.; Jeong, S.; Zhong, Z.; Choi, W.; Kim, J.; Lee, K.; Lim, J.; Jang, K.; Chun, J.; et al. Super resolution of historic Landsat imagery using a dual generative adversarial network (GAN) model with CubeSat constellation imagery for spatially enhanced long-term vegetation monitoring. Isprs J. Photogramm. Remote Sens. 2023, 200, 1–23. [Google Scholar] [CrossRef]
- Gitelson, A.A.; Stark, R.; Grits, U.; Rundquist, D.; Kaufman, Y.; Derry, D. Vegetation and soil lines in visible spectral space: A concept and technique for remote estimation of vegetation fraction. Int. J. Remote Sens. 2002, 23, 2537–2562. [Google Scholar] [CrossRef]
- Woebbecke, D.M.; Meyer, G.E.; Von Bargen, K.; Mortensen, D.A. Color Indices for Weed Identifcation under Various Soil, Residue, and Lighting Conditions. Am. Soc. Agric. Eng. 1995, 38, 259–269. [Google Scholar] [CrossRef]
- Meyer, G.E.; Neto, J.C. Verification of Color Vegetation Indices for Automated Crop Imaging Applications. Comput. Electron. Agric. 2008, 63, 282–293. [Google Scholar] [CrossRef]
- Tucker, C.J. Red and Photographic Infrared Linear Combinations for Monitoring Vegetation. Remote Sens. Environ. 1979, 8, 127–150. [Google Scholar] [CrossRef]
- Bendig, J.; Yu, K.; Aasen, H.; Bolten, A.; Bennertz, S.; Broscheit, J.; Gnyp, M.L.; Bareth, G. Combining Uav-Based Plant Height from Crop Surface Models, Visible, and near Infrared Vegetation Indices for Biomass Monitoring in Barley. Int. J. Appl. Earth Obs. Geoinf. 2015, 39, 79–87. [Google Scholar] [CrossRef]
- Louhaichi, M.; Borman, M.M.; Johnson, D.E. Spatially Located Platform and Aerial Photography for Documentation of Grazing Impacts on Wheat. Geocarto Int. 2001, 16, 65–70. [Google Scholar] [CrossRef]
- Kawashima, S.; Nakatani, M. An Algorithm for Estimating Chlorophyll Content in Leaves Using a Video Camera. Ann. Bot. 1998, 81, 49–54. [Google Scholar] [CrossRef]
- Lu, N.; Zhou, J.; Han, Z.; Li, D.; Cao, Q.; Yao, X.; Tian, Y.; Zhu, Y.; Cao, W.; Cheng, T. Improved Estimation of Aboveground Biomass in Wheat from Rgb Imagery and Point Cloud Data Acquired with a Low-Cost Unmanned Aerial Vehicle System. Plant Methods 2019, 15, 17. [Google Scholar] [CrossRef] [PubMed]
- Gitelson, A.A.; Merzlyak, M.N.; Chivkunova, O.B. Optical Properties and Nondestructive Estimation of Anthocyanin Content in Plant Leaves. Photochem. Photobiol. 2001, 74, 38–45. [Google Scholar] [CrossRef] [PubMed]
- Chuvieco, E.; Martín, M.P.; Palacios, A. Assessment of different spectral indices in the red-near-infrared spectral domain for burned land discrimination. Int. J. Remote Sens. 2002, 23, 5103–5110. [Google Scholar] [CrossRef]
- Jiang, Z.Y.; Huete, A.R.; Didan, K.; Miura, T. Development of a two-band enhanced vegetation index without a blue band. Remote Sens. Environ. 2008, 112, 3833–3845. [Google Scholar] [CrossRef]
- Gitelson, A.A.; Kaufman, Y.J.; Merzlyak, M.N. Use of a green channel in remote sensing of global vegetation from EOS-MODIS. Remote Sens. Environ. 1996, 58, 289–298. [Google Scholar] [CrossRef]
- Clevers, J.G.P.W.; de Jong, S.M.; Epema, G.F.; van der Meer, F.; Bakker, W.H.; Skidmore, A.K.; Addink, E.A. MERIS and the red-edge position. Int. J. Appl. Earth Obs. Geoinf. 2001, 3, 313–320. [Google Scholar] [CrossRef]
- Daughtry, C.S.T.; Walthall, C.L.; Kim, M.S.; de Colstoun, E.B.; McMurtrey, J.E. Estimating corn leaf chlorophyll concentration from leaf and canopy reflectance. Remote Sens. Environ. 2000, 74, 229–239. [Google Scholar] [CrossRef]
- Qi, J.G.; Chehbouni, A.R.; Huete, A.R.; Kerr, Y.H.; Sorooshian, S. A Modified Soil Adjusted Vegetation Index. Remote Sens. Environ. 1994, 48, 119–126. [Google Scholar] [CrossRef]
- Dash, J.; Curran, P.J. Evaluation of the MERIS terrestrial chlorophyll index (MTCI). Adv. Space Res. 2007, 39, 100–104. [Google Scholar] [CrossRef]
- Rouse, J.W.; Haas, R.H.; Schell, J.A.; Deering, D.W. Monitoring Vegetation Systems in the Great Plains with Erts. In Proceedings of the Third ETRS-1 Symposium, Washington, DC, USA, 10–14 December 1974; Fraden, S.C., Marcanti, E.P., Bechker, M.A., Eds.; Scientific and Technical Information Office, National Aeronautics and Space Administration: Hampton, VA, USA, 1974; Volume 10–14, pp. 309–317. [Google Scholar]
- Gao, B.C. NDWI—A normalized difference water index for remote sensing of vegetation liquid water from space. Remote Sens. Environ. 1996, 58, 257–266. [Google Scholar] [CrossRef]
- Merzlyak, M.N.; Gitelson, A.A.; Chivkunova, O.B.; Rakitin, V.Y. Non-destructive optical detection of pigment changes during leaf senescence and fruit ripening. Physiol. Plant. 1999, 106, 135–141. [Google Scholar] [CrossRef]
- Blackburn, G.A. Quantifying chlorophylls and caroteniods at leaf and canopy scales: An evaluation of some hyperspectral approaches. Remote Sens. Environ. 1998, 66, 273–285. [Google Scholar] [CrossRef]
- Fernández-Manso, A.; Fernández-Manso, O.; Quintano, C. SENTINEL-2A red-edge spectral indices suitability for discriminating burn severity. Int. J. Appl. Earth Obs. Geoinf. 2016, 50, 170–175. [Google Scholar] [CrossRef]
- Huete, A.R. A soil-adjusted vegetation index (SAVI). Remote Sens. Environ. 1988, 25, 295–309. [Google Scholar] [CrossRef]
- Guyot, G.; Baret, F. Utilisation De La Haute Resolution Spectrale Pour Suivre Letat Des Couverts Vegetaux. Spectr. Signat. Objects Remote Sens. 1988, 287, 279–286. [Google Scholar]
- Wang, Z.J.; Sui, L.C.; Zhang, S.Q. Generating Daily Land Surface Temperature Downscaling Data Based on Sentinel-3 Images. Remote Sens. 2022, 14, 5752. [Google Scholar] [CrossRef]
- Du, M.M.; Li, M.Z.; Noguchi, N.; Ji, J.T.; Ye, M.C. Retrieval of Fractional Vegetation Cover from Remote Sensing Image of Unmanned Aerial Vehicle Based on Mixed Pixel Decomposition Method. Drones 2023, 7, 43. [Google Scholar] [CrossRef]
- Badola, A.; Panda, S.K.; Roberts, D.A.; Waigl, C.F.; Bhatt, U.S.; Smith, C.W.; Jandt, R.R. Hyperspectral Data Simulation (Sentinel-2 to AVIRIS-NG) for Improved Wildfire Fuel Mapping, Boreal Alaska. Remote Sens. 2021, 13, 1693. [Google Scholar] [CrossRef]
- Filella, I.; Penuelas, J. The Red Edge Position and Shape as Indicators of Plant Chlorophyll Content, Biomass and Hydric Status. Int. J. Remote Sens. 1994, 15, 1459–1470. [Google Scholar] [CrossRef]
- Pinar, A.; Curran, P.J. Technical Note Grass chlorophyll and the reflectance red edge. Int. J. Remote Sens. 1996, 17, 351–357. [Google Scholar] [CrossRef]
- Gao, D.H.; Qiao, L.; Song, D.; Li, M.Z.; Sun, H.; An, L.L.; Zhao, R.M.; Tang, W.J.; Qiao, J.B. In-field chlorophyll estimation based on hyperspectral images segmentation and pixel-wise spectra clustering of wheat canopy. Biosyst. Eng. 2022, 217, 41–55. [Google Scholar] [CrossRef]
- Zhang, H.; Li, J.; Liu, Q.H.; Lin, S.R.; Huete, A.; Liu, L.Y.; Croft, H.; Clevers, J.; Zeng, Y.L.; Wang, X.H.; et al. A novel red-edge spectral index for retrieving the leaf chlorophyll content. Methods Ecol. Evol. 2022, 13, 2771–2787. [Google Scholar] [CrossRef]
- Biparva, M.; Tsotsos, J. Contextual Interference Reduction by Selective Fine-Tuning of Neural Networks. arXiv 2020, arXiv:2011.10857. [Google Scholar]
- Chen, X.H.; Guo, Z.F.; Chen, J.; Yang, W.; Yao, Y.M.; Zhang, C.S.; Cui, X.H.; Cao, X. Replacing the Red Band with the Red-SWIR Band (0.74ρred + 0.26ρswir) Can Reduce the Sensitivity of Vegetation Indices to Soil Background. Remote Sens. 2019, 11, 851. [Google Scholar] [CrossRef]
- Yang, H.B.; Hu, Y.H.; Zheng, Z.Z.; Qiao, Y.C.; Zhang, K.L.; Guo, T.F.; Chen, J. Estimation of Potato Chlorophyll Content from UAV Multispectral Images with Stacking Ensemble Algorithm. Agronomy 2022, 12, 2318. [Google Scholar] [CrossRef]
- Qiao, L.; Tang, W.J.; Gao, D.H.; Zhao, R.M.; An, L.L.; Li, M.Z.; Sun, H.; Song, D. UAV-based chlorophyll content estimation by evaluating vegetation index responses under different crop coverages. Comput. Electron. Agric. 2022, 196, 106775. [Google Scholar] [CrossRef]
- Liu, B.; Yue, Y.M.; Li, R.; Shen, W.J.; Wang, K.L. Plant Leaf Chlorophyll Content Retrieval Based on a Field Imaging Spectroscopy System. Sensors 2014, 14, 19910–19925. [Google Scholar] [CrossRef]
- Horler, D.N.H.; Dockray, M.; Barber, J.; Barringer, A.R. Red edge measurements for remotely sensing plant chlorophyll content. Adv. Space Res. 1983, 3, 273–277. [Google Scholar] [CrossRef]
- Zhang, A.W.; Yin, S.N.; Wang, J.; He, N.P.; Chai, S.T.; Pang, H.Y. Grassland Chlorophyll Content Estimation from Drone Hyperspectral Images Combined with Fractional-Order Derivative. Remote Sens. 2023, 15, 5623. [Google Scholar] [CrossRef]
- Zhang, X.H.; He, Y.; Wang, C.; Xu, F.; Li, X.H.; Tan, C.W.; Chen, D.M.; Wang, G.J.; Shi, L.X. Estimation of Corn Canopy Chlorophyll Content Using Derivative Spectra in the O2—A Absorption Band. Front. Plant Sci. 2019, 10, 1047. [Google Scholar] [CrossRef]
- Gao, S.; Zhong, R.; Yan, K.; Ma, X.L.; Chen, X.K.; Pu, J.B.; Gao, S.C.; Qi, J.B.; Yin, G.F.; Myneni, R.B. Evaluating the saturation effect of vegetation indices in forests using 3D radiative transfer simulations and satellite observations. Remote Sens. Environ. 2023, 295, 113665. [Google Scholar] [CrossRef]
- Song, D.; Gao, D.H.; Sun, H.; Qiao, L.; Zhao, R.M.; Tang, W.J.; Li, M.Z. Chlorophyll content estimation based on cascade spectral optimizations of interval and wavelength characteristics. Comput. Electron. Agric. 2021, 189, 106413. [Google Scholar] [CrossRef]


| Vegetation Index | Formulation | References |
|---|---|---|
| VARI (visible atmospherically resistant index) | [24] | |
| ExG (excess green index) | [25] | |
| ExR (excess red index) | [26] | |
| ExB (excess blue index) | [26] | |
| ExGR (extra green minus extra red) | [26] | |
| GRVI (green red vegetation index) | [27] | |
| MGRVI (modified green red vegetation index) | [28] | |
| GLI (green leaf index) | [29] | |
| RGBVI (red, green and blue vegetation indices) | [28] | |
| IKAW(Kawashima Index) | [30] | |
| r (red index) | [31] | |
| g (green index) | [31] | |
| b (blue index) | [31] |
| Vegetation Index (VI) | Formulation | References |
|---|---|---|
| ARI1 (Anthocyanin Reflectance Index 1) | [32] | |
| ARI2 (Anthocyanin Reflectance Index 2) | [32] | |
| BAI (Biochemical Affinity Index) | [33] | |
| CRI1 (Carotenoid Reflectance Index 1) | [24] | |
| CRI2 (Carotenoid Reflectance Index 2) | [24] | |
| CHL RED EDGE | [24] | |
| EVI (Enhanced Vegetation Index) | [34] | |
| EVI2 (Enhanced Vegetation Index 2) | [34] | |
| GNDVI (Green Normalized Difference Vegetation Index) | [35] | |
| IRECI (Inverted Red-Edge Chlorophyll Index) | [36] | |
| MCARI (Modified Chlorophyll Absorption in Reflectance Index) | [37] | |
| MSAVI2 (Modified Soil Adjusted Vegetation Index 2) | [38] | |
| MTCI (MERIS Terrestrial Chlorophyll Index) | [39] | |
| NDI45 (Normalized Difference Index 45) | [7] | |
| NDVI (Normalized Difference Vegetation Index) | [40] | |
| NDWI (Normalized Difference Water Index) | [41] | |
| PSRI (Plant Senescence Reflectance Index) | [42] | |
| PSSR (Plant Senescence Reflectance) | [43] | |
| RED EDGE NDVI | [44] | |
| SAVI (Soil Adjusted Vegetation Index) | [45] | |
| S2REP (Sentinel-2 Red Edge Position) | [46] |
| Vegetation Index | F | Selection of Indicators |
|---|---|---|
| R | 2254.10 | ● |
| G | 3439.70 | ● |
| B | 326.48 | ○ |
| VARI | 100.46 | ○ |
| RGBVI | 1.11 | ○ |
| MGRVI | 1.10 | ○ |
| IKAW | 257.52 | ○ |
| GRVI | 1.05 | ○ |
| GLI | 2988.70 | ○ |
| ExR | 3981.50 | ● |
| ExGR | 4113.40 | ● |
| ExG | 3439.70 | ● |
| ExB | 1241.40 | ● |
| Spectral Characteristics | Simulated Data | Nonsimulated Data | ||||||||
|---|---|---|---|---|---|---|---|---|---|---|
| mR2cv | mRMSEcv | rR2cv | rRMSEcv | MPI | mR2cv | mRMSEcv | rR2cv | rRMSEcv | MPI | |
| SI | 0.8150 | 0.1194 | 0.1796 | 0.3888 | 0.8029 | 0.7570 | 0.1245 | 0.1849 | 0.3984 | 0.7796 |
| SDF | 0.8159 | 0.1143 | 0.1080 | 0.1153 | 0.8636 | 0.7722 | 0.1648 | 0.1251 | 0.1528 | 0.8232 |
Disclaimer/Publisher’s Note: The statements, opinions and data contained in all publications are solely those of the individual author(s) and contributor(s) and not of MDPI and/or the editor(s). MDPI and/or the editor(s) disclaim responsibility for any injury to people or property resulting from any ideas, methods, instructions or products referred to in the content. |
© 2024 by the authors. Licensee MDPI, Basel, Switzerland. This article is an open access article distributed under the terms and conditions of the Creative Commons Attribution (CC BY) license (https://creativecommons.org/licenses/by/4.0/).
Share and Cite
Yang, L.; Huang, X.; Zhou, D.; Zhang, J.; Bao, G.; Tong, S.; Bao, Y.; Ganbat, D.; Altanchimeg, D.; Enkhnasan, D.; et al. Sentinel-2A Image Reflectance Simulation Method for Estimating the Chlorophyll Content of Larch Needles with Pest Damage. Forests 2024, 15, 1901. https://doi.org/10.3390/f15111901
Yang L, Huang X, Zhou D, Zhang J, Bao G, Tong S, Bao Y, Ganbat D, Altanchimeg D, Enkhnasan D, et al. Sentinel-2A Image Reflectance Simulation Method for Estimating the Chlorophyll Content of Larch Needles with Pest Damage. Forests. 2024; 15(11):1901. https://doi.org/10.3390/f15111901
Chicago/Turabian StyleYang, Le, Xiaojun Huang, Debao Zhou, Junsheng Zhang, Gang Bao, Siqin Tong, Yuhai Bao, Dashzebeg Ganbat, Dorjsuren Altanchimeg, Davaadorj Enkhnasan, and et al. 2024. "Sentinel-2A Image Reflectance Simulation Method for Estimating the Chlorophyll Content of Larch Needles with Pest Damage" Forests 15, no. 11: 1901. https://doi.org/10.3390/f15111901
APA StyleYang, L., Huang, X., Zhou, D., Zhang, J., Bao, G., Tong, S., Bao, Y., Ganbat, D., Altanchimeg, D., Enkhnasan, D., & Ariunaa, M. (2024). Sentinel-2A Image Reflectance Simulation Method for Estimating the Chlorophyll Content of Larch Needles with Pest Damage. Forests, 15(11), 1901. https://doi.org/10.3390/f15111901