Article

Estimation of Tree Diameter at Breast Height from Aerial Photographs Using a Mask R-CNN and Bayesian Regression

1
Department of Mechanical Engineering, Korea University, 145 Anamro, Seongbuk-gu, Seoul 02841, Republic of Korea
2
Department of Forest Science, Andong National University, 1375 Gyeongdong-ro, Andong-si 36729, Republic of Korea
3
Forest Fire Division, National Institute of Forest Science, 57 Hoegiro, Dongdaemun-gu, Seoul 02455, Republic of Korea
*
Author to whom correspondence should be addressed.
Forests 2024, 15(11), 1881; https://doi.org/10.3390/f15111881
Submission received: 25 September 2024 / Revised: 21 October 2024 / Accepted: 22 October 2024 / Published: 25 October 2024
(This article belongs to the Section Forest Inventory, Modeling and Remote Sensing)

Abstract

:
A probabilistic estimation model for forest biomass using unmanned aerial vehicle (UAV) photography was developed. We utilized a machine-learning-based object detection algorithm, a mask region-based convolutional neural network (Mask R-CNN), to detect trees in aerial photographs. Subsequently, Bayesian regression was used to calibrate the model based on an allometric model using the estimated crown diameter (CD) obtained from aerial photographs and analyzed the diameter at breast height (DBH) data acquired through terrestrial laser scanning. The F1 score of the Mask R-CNN for individual tree detection was 0.927. Moreover, CD estimation using the Mask R-CNN was acceptable (rRMSE = 10.17%). Accordingly, the probabilistic DBH estimation model was successfully calibrated using Bayesian regression. A predictive distribution accurately predicted the validation data, with 98.6% and 56.7% of the data being within the 95% and 50% prediction intervals, respectively. Furthermore, the estimated uncertainty of the probabilistic model was more practical and reliable compared to traditional ordinary least squares (OLS). Our model can be applied to estimate forest biomass at the individual tree level. Particularly, the probabilistic approach of this study provides a benefit for risk assessments. Additionally, since the workflow is not interfered by the tree canopy, it can effectively estimate forest biomass in dense canopy conditions.

1. Introduction

Currently, the role of forests extends beyond their traditional functions, particularly in the context of global climate change driven by industrialization and population growth. For example, one of the key roles of forests is sequestering atmospheric carbon to mitigate climate change as a part of sustainability [1]. Therefore, the investigation of forest biomass is crucial for assessing forest ecosystem services and practicing effective forest management. Additionally, the fire hazard from forests has significantly increased along with their benefits. With extreme weather, wildfire frequency and severity have increased in recent decades [2,3]. Moreover, this widespread occurrence has increased the damage caused by wildfires on society [4,5]. Particularly, communities located near wildland areas, such as rural and wildland-urban interface (WUI) regions, are vulnerable to the impact of wildfires [6,7]. Therefore, assessing wildfire risk in these regions is important to effectively mitigate their impacts. Since forest biomass is a major fuel for wildfires, the investigation of forest biomass is also important to evaluate wildfire hazards for risk assessment.
Traditionally, wildfire risk for mitigation planning has been assessed at national and regional scales [8]. For instance, regional wildfire risk was estimated using a probabilistic approach from the statistical data on wildfires and environmental conditions [9,10]. In contrast, wildfire risk assessments at fine scales, such as the community scale, are less common, with few approaches using simulations or machine learning [11,12]. Thus, average information of a region has been primarily utilized for the wildfire risk assessment, while specific information, such as individual tree data, was considered less essential.
However, mitigation planning for wildfire risks at a fine scale is necessary, as wildfire impacts on local communities and structures can be more severe than roughly estimated. For instance, industrial facilities in rural communities of the Republic of Korea are threatened, and cultural heritage is damaged by wildfires. In particular, the 2022 Uljin-Samcheok wildfire, the worst wildfire on record in Korea, threatened nuclear power plants and partially damaged external facilities. Fortunately, it was suppressed before severely impacting the plant, highlighting the importance of risk assessment at the local scale to prevent predictable disasters.
Furthermore, fine-scale analysis is not only important for wildfire risk assessment but also crucial for evaluating forest ecosystem services under climate change scenarios. Recent research utilized individual tree-level information to develop precise evaluations [13,14]. Accordingly, individual tree-level investigation is now necessary for accurate assessment of wildfire risk and ecosystem services, which is more important due to climate change.
Generally, information about forest biomass can be collected using field surveys and remote sensing [15,16]. Since a field survey is challenging and time-consuming to collect data for the wide area of forests, remote sensing has been widely used to overcome the limitations of field surveys [17,18]. Conventional remote sensing has used aerial photographs and satellite imagery [19,20]. With the introduction of light detection and ranging (LiDAR) methods, remote sensing also utilizes laser scanning methods, such as airborne laser scanning (ALS) and terrestrial laser scanning (TLS) [21,22]. Using remote sensing, forest biomass can be mapped across a region by integrating field survey information to estimate the fuel load for wildfire hazard evaluations [23]. In addition, they can be measured directly using three-dimensional data acquired through laser scanning methods [24]. Also, combined methods of various remote sensing have been used [25]. These remote sensing methods are efficient and allow excellent wildfire risk assessment across wide regions.
For individual tree-level investigation, forest biomass is estimated with specific tree metrics, such as tree height (TH), crown diameter (CD), and diameter at breast height (DBH). Therefore, three-dimensional information has an advantage for obtaining detailed data. However, gathering three-dimensional information with remote sensing has limitations depending on its method. In the case of laser scanning, ALS point clouds under the tree canopy, including the stem and terrain, are typically inaccurate, while TLS point clouds above the canopy are typically inaccurate 2019 [26]. Thus, TH cannot be accurately determined in dense canopy conditions using laser scanning. Although TLS can be utilized to collect DBH, TLS can cover a smaller area compared to ALS, which is a similar scale to a field survey. Likewise, an aerial photograph-based methodology shares the problem of ALS. Since terrain cannot be determined in dense canopy conditions, a canopy height model (CHM) cannot be generated accurately. In a recent study, machine-learning-based image processing was utilized for aerial photographs to determine TH in sparse canopy forests without using CHM [27]. Considering the machine learning mechanism, TH for ground truth is required to establish an estimation model. However, the methodology could be inappropriate in dense canopy conditions due to the inaccuracy of TH measurement with the interference of the tree canopy [28].
We accordingly propose a new methodology to estimate specific forest biomass information utilizing aerial photographs. Considering the limitations of the measurement, we aim to provide an efficient approach while ensuring accurate data collection without the interference of the tree canopy. Because machine-learning-based tree detection has great potential compared to traditional methods [29], we decided to utilize the machine-learning algorithm in this study. Therefore, trees were remotely sensed through machine-learning-based individual tree detection based on aerial photographs captured using an unmanned aerial vehicle (UAV). Subsequently, we measured DBH as a representative variable of forest biomass using TLS and established a probabilistic DBH estimation model using Bayesian regression for risk assessment.

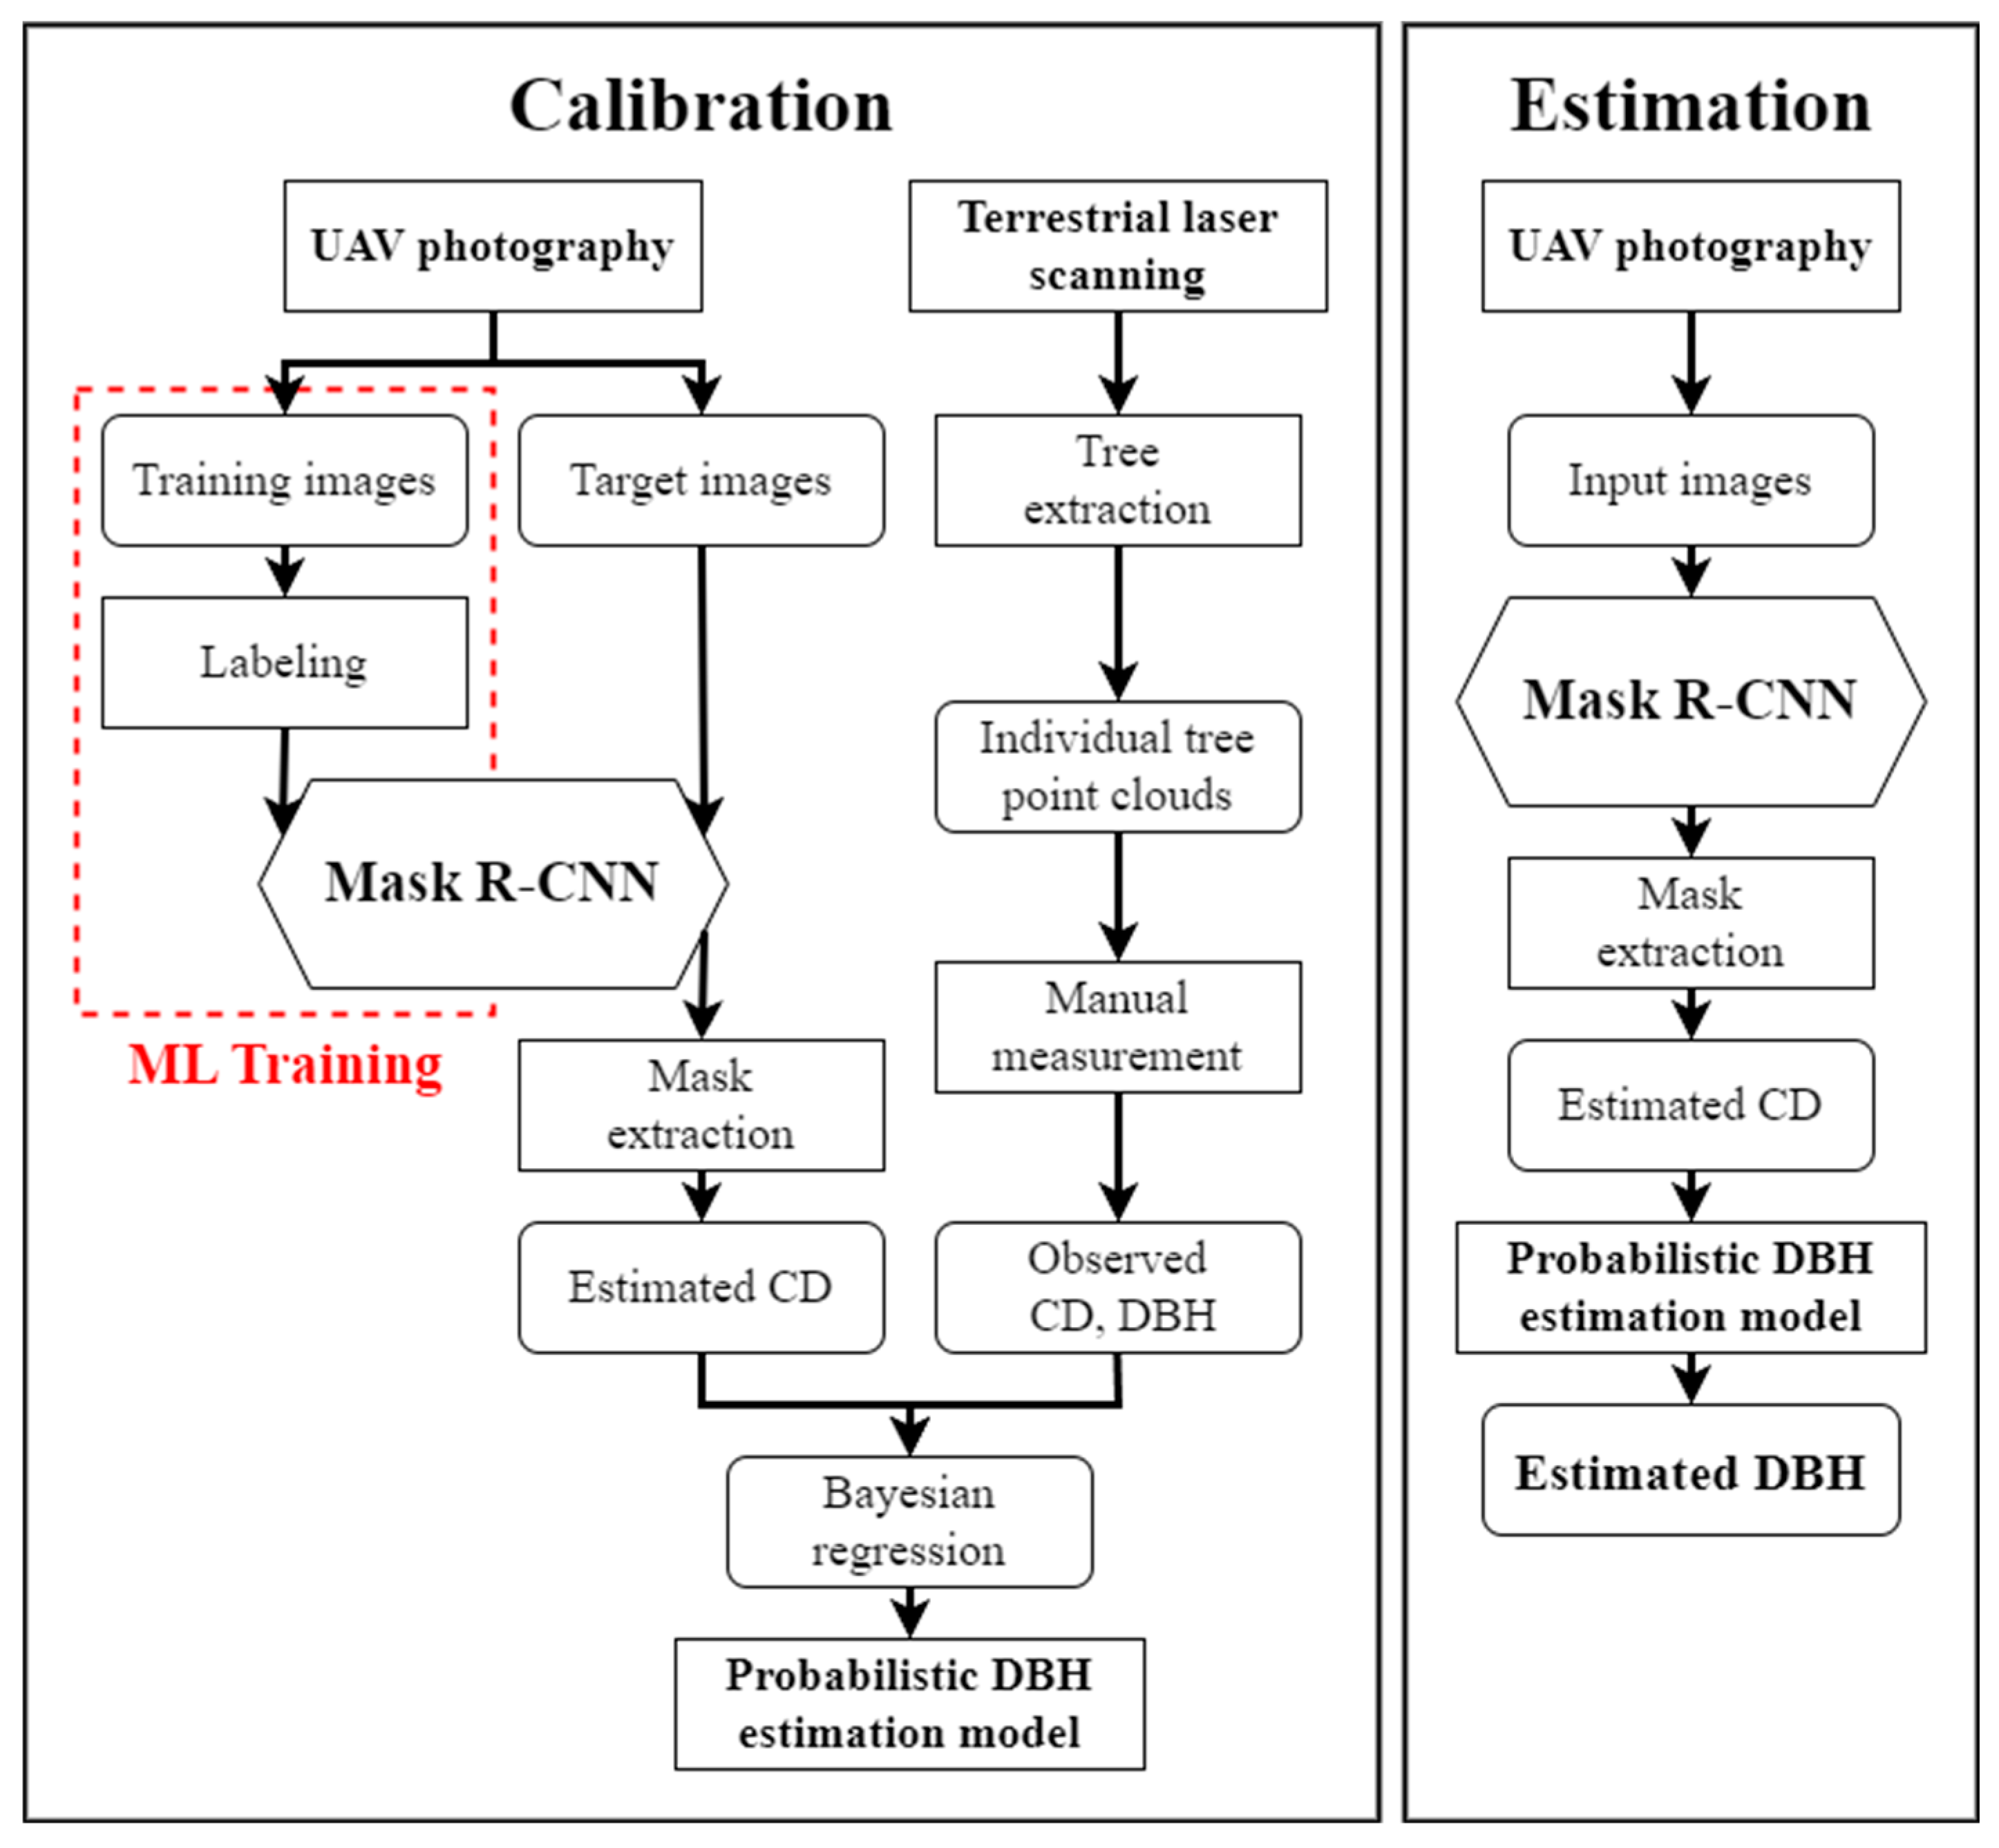
2. Materials and Methods

The procedure for estimating DBH is illustrated in Figure 1. In this study, aerial photographs were captured for individual tree detection using a Mask R-CNN, a machine learning-based detection and segmentation algorithm, which has shown major applicability in various research fields, including remote sensing [30,31,32]. Actual tree metrics were obtained through TLS. We separated the process into calibration and estimation steps. During calibration, the photographs captured outside the TLS regions were used to train the Mask R-CNN. Subsequently, the CD of the trees was estimated from the masks extracted by a trained Mask R-CNN. Finally, a probabilistic DBH estimation model was calibrated based on the allometric equation using the estimated CD and the corresponding measured DBH. In the estimation process, the CD and DBH were estimated using a pre-trained Mask R-CNN and a pre-calibrated estimation model. To validate the methodology, TLS data were divided into true and test sets. Calibration was conducted using true data, and the test data were used to validate the model according to the estimation process. Further details of each step are provided in the following subsections.

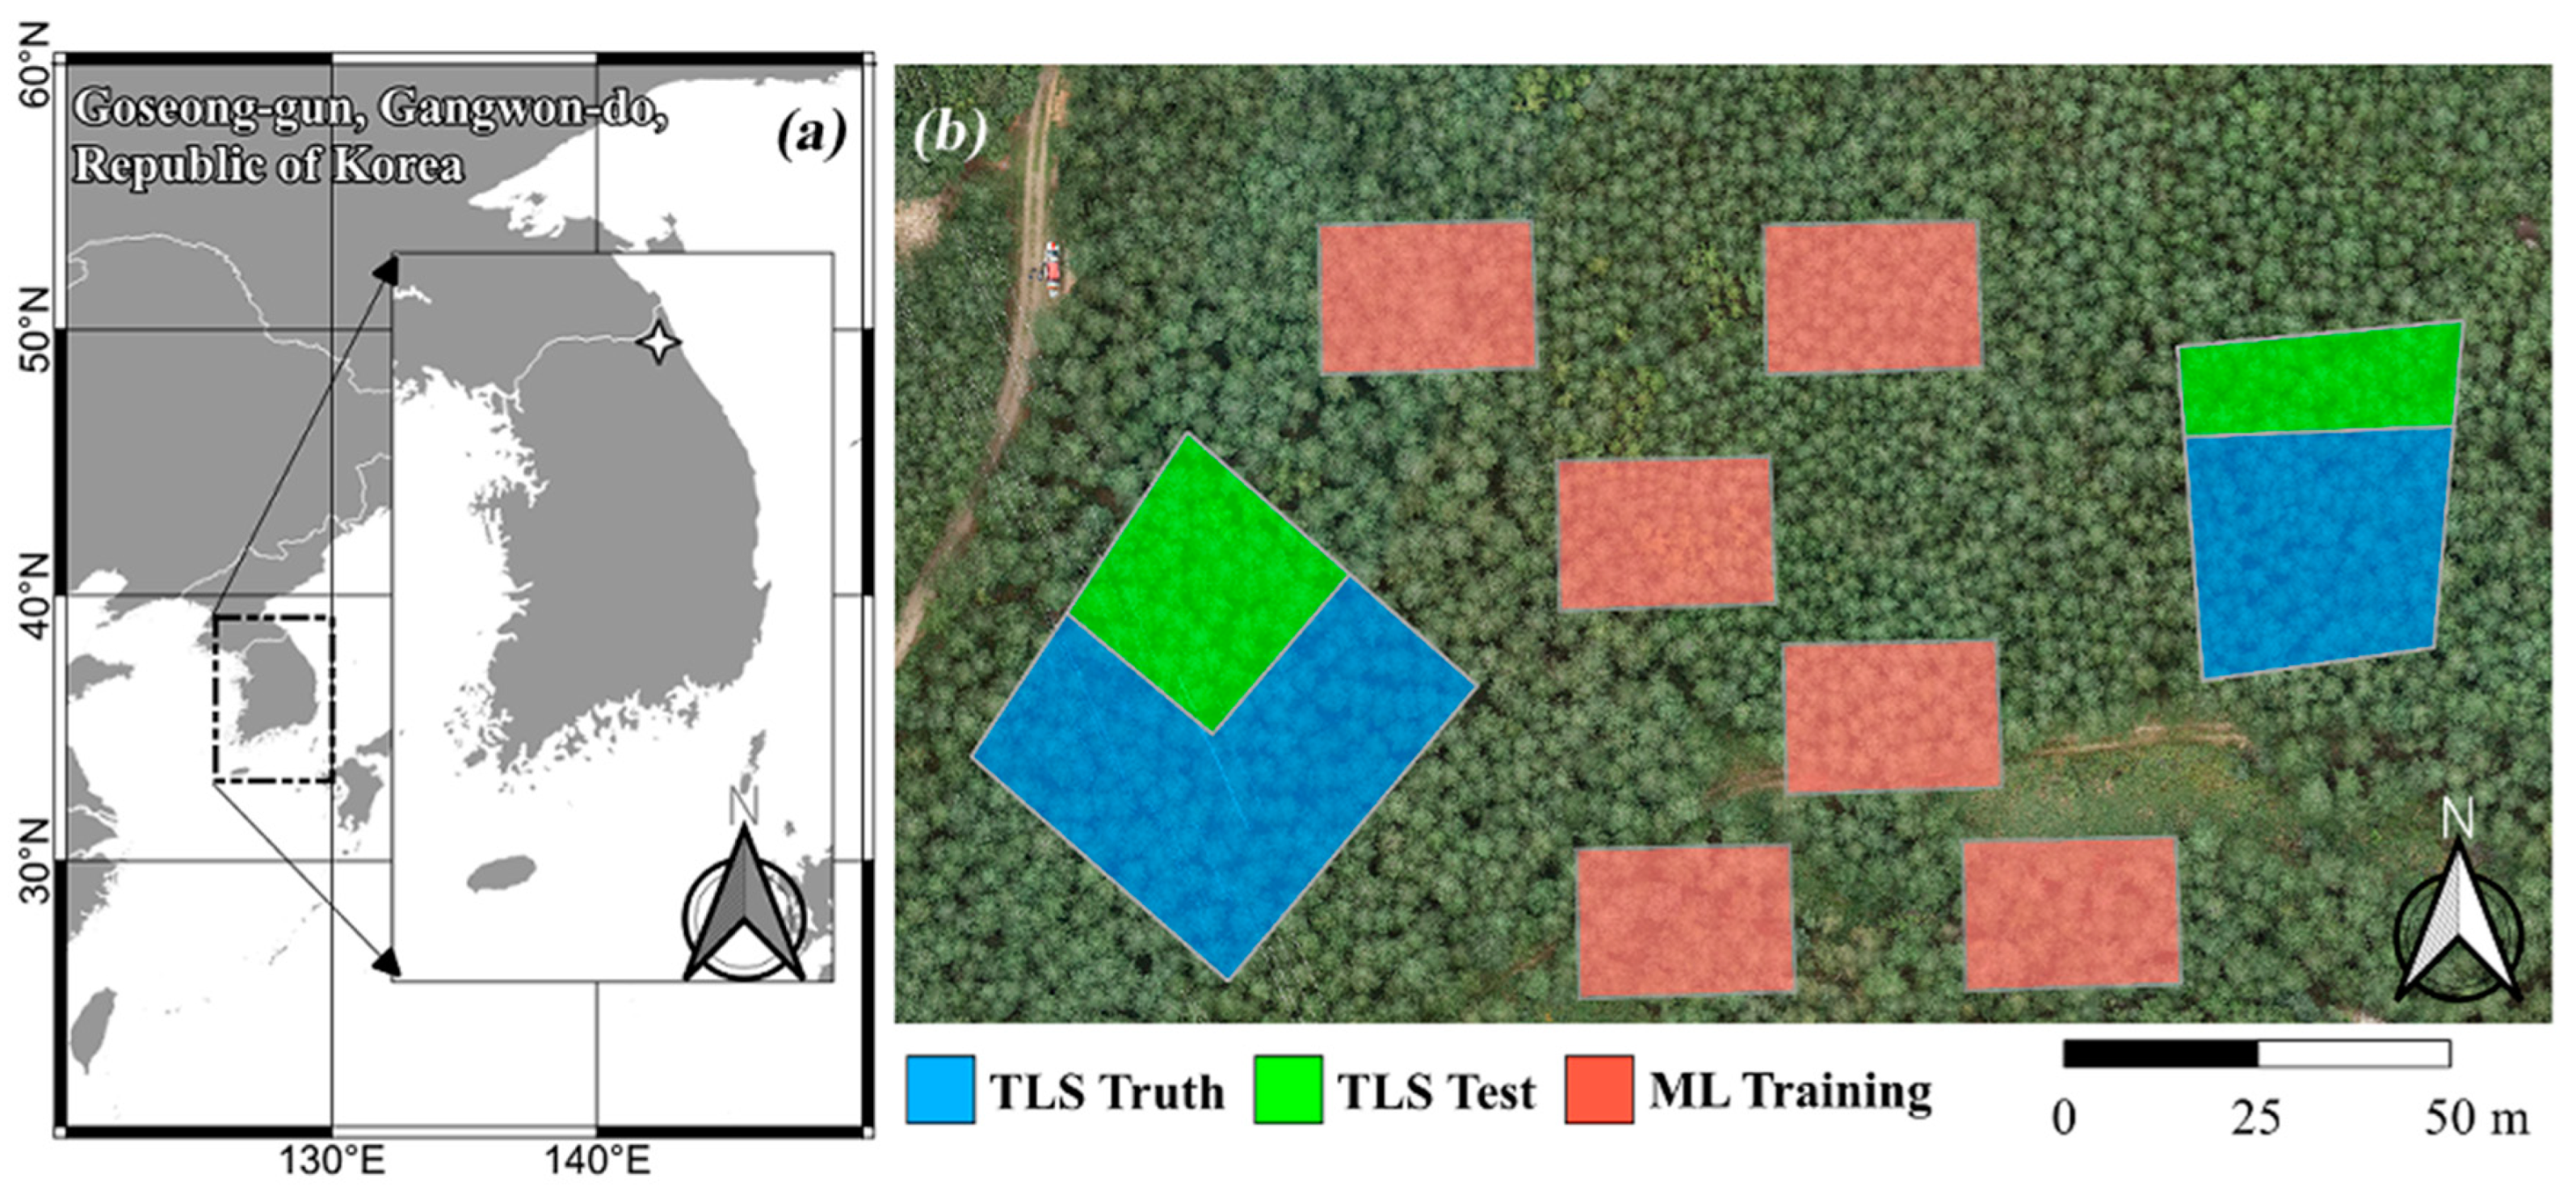
2.1. Site Description

The study site was a coniferous forest located in Gangwon-do, the Republic of Korea (38.31105°, 128.48861°), as shown in Figure 2. It consists of a single tree species, the Pinus densiflora, which is a major fuel for wildfires in the Republic of Korea. Deciduous broad-leaved trees shed leaves during the dry and windy climates of Korean wildfire season, whereas coniferous trees retain leaves with a relatively lower moisture content. Thus, coniferous trees are more exposed to wildfires during the Korean wildfire season than deciduous trees. Additionally, Pinus densiflora is the most abundant species in Korean forests, constituting 60% of coniferous forests [33]. Considering the purpose of the wildfire hazard evaluation, a high-risk location for wildfire spread was selected for this study. As mentioned, the tree metrics were measured in two regions using TLS. Because the sample area was small, the data could have been biased by the sampling location. Therefore, we selected two regions based on stem densities estimated in the field to reduce bias. The total TLS region was approximately 0.5 ha.

2.2. Data Collection

In this study, we utilized remote sensing methods to collect data for both measurement and estimation. For tree metrics measurement, three-dimensional point clouds were obtained using TLS (RTC 360, Leica, Heerbrugg, Switzerland). The specifications of the TLS equipment are summarized in Table 1. The scanning positions of the TLS were based on a 10 m spaced grid with a 1 m variable position to avoid obstacles and steep slopes. Subsequently, we used an in-house graphics-based program that could crop point clouds within the region of interest. Using this program, the point clouds of individual trees were extracted manually for obtaining tree metrics. Although there are several automated methods to measure tree metrics using point clouds [34], we manually measured the CD and TH of the trees according to tree monitoring criteria [35] and tree metrics measurements using remote sensing, while the DBH was measured using a semi-automatic method [26].
For detailed measurements, the CD was calculated with an averaged horizontal distance on the side section of the point clouds, calculated in four directions rotated at 45-degree intervals from the section of the longest horizontal distance. The TH was calculated as the vertical distance from the lowest to the highest points of the trees. The DBH was determined after cropping the top section of the point clouds at breast height (1.3 m from the lowest point of the stem). Least squares circle fitting was utilized with TLS data to calculate the DBH as suggested by [36]. An example of the extracted point clouds and their metrics is shown in Figure S1. Although various algorithms can be used for extracting the individual tree metrics from the TLS data, we manually extracted them to reduce processing errors. The TLS data were separated into the TLS truth and test regions, as depicted in Figure 2, for calibration and validation. Table 2 summarizes the TLS data. In addition, we conducted a field survey to measure the DBH to validate the TLS measurement results. The field survey samples were matched to the TLS samples by using identification cards, as represented in Figure S2. However, certain samples could not be matched because of indistinguishable numbers in the visualization of TLS point clouds. The number of TLS and field survey samples was 308 and 212, respectively. Between them, the matched pairs were 212. A comparison between the DBH of the field survey and the TLS is illustrated in Figure S3. Although the TLS-measured DBH is lower compared to the field survey ones, the error falls within an acceptable range (rRMSE = 7.9%).
To estimate the CD, an aerial photograph of the site was captured using a UAV (Matrice 300 RTK, DJI, Shenzhen, China). The UAV flew 50 m above the site and captured orthophotos using a built-in camera. All orthophotos were merged to create a raster map with the global positioning system (GPS) information. To improve the accuracy, ground control points were located for reference. Subsequently, the UAV photograph was processed using Mask R-CNN to detect individual trees and collect the CD.

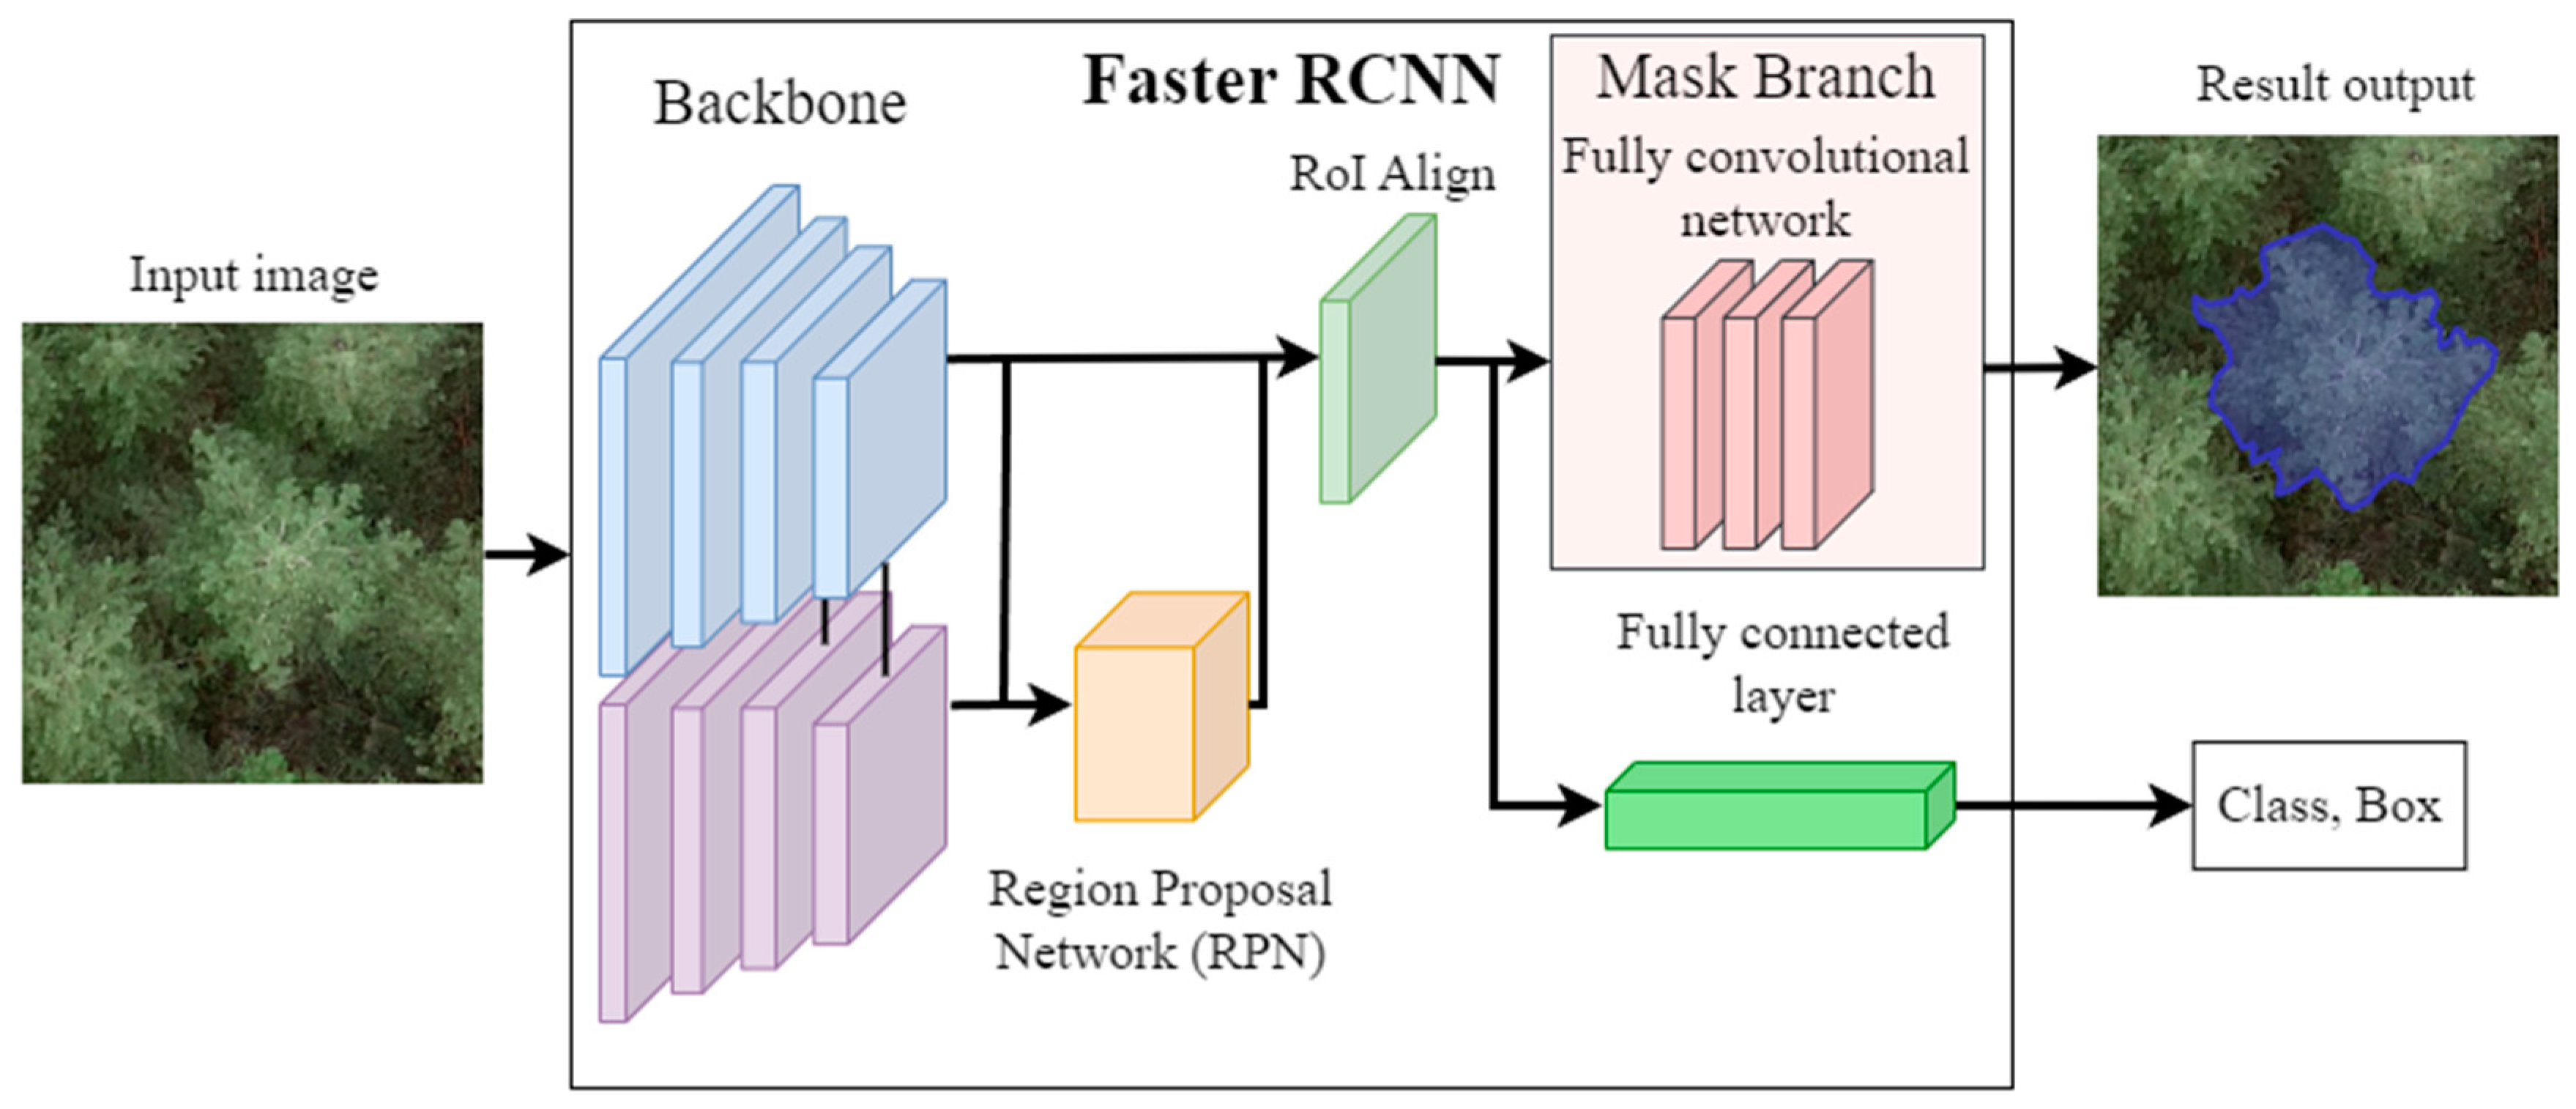
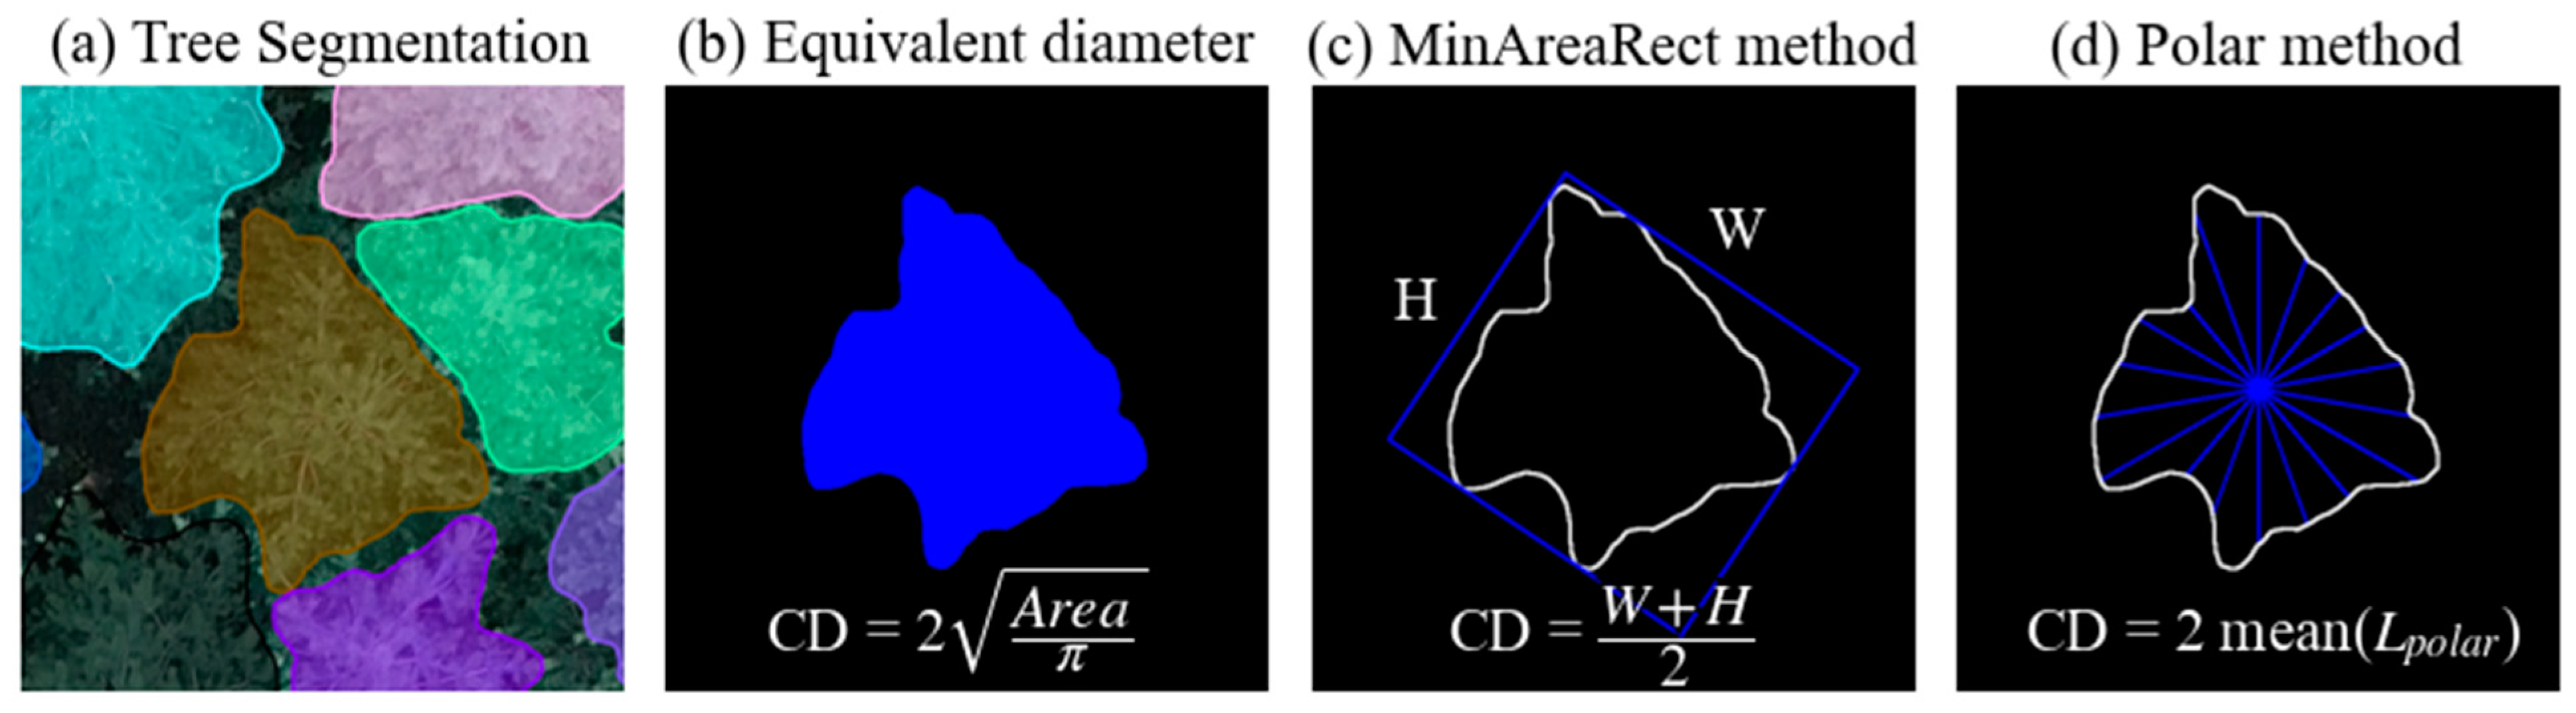
2.3. Tree Segmentation on Photograph

In this study, we detected individual trees for CD estimation using a Mask R-CNN [37]. This algorithm is based on a Faster R-CNN, which is a two-stage object detection model improved from a R-CNN [38]. The original R-CNN requires a high computational cost for the graphics processor owing to multiple CNN calculations. Moreover, extensive R-CNN main processer usage for region proposals with selective searches induces bottlenecks in the calculation, slowing down the entire process. The Faster R-CNN solves these problems by modifying the structure and introducing a regional proposal network. The Mask R-CNN is an extended Faster R-CNN that incorporates a mask branch and utilizes a fully convolutional network to predict the shape mask of each instance. The Mask R-CNN’s outputs include classification, a bounding box, and a binary mask. In this study, a binary mask of the detected individual trees was extracted to estimate the CD. Figure 3 illustrates the Mask R-CNN structure with example inputs and outputs.
For machine learning training, UAV photographs were cropped and labeled. The training regions depicted in Figure 2 were sampled for an arbitrary target, and the total area was similar to that of the TLS regions to prevent overfitting. The labeled tree was manually constructed based on direct observation, and any indistinguishable crowns were neglected. The target mask loss was <0.25. We augmented the input images by rotation, flipping, and large-scale jitter in the training process to enhance the performance. Rotation and flipping are commonly used to prevent network overfitting in various machine-learning-based image processing methods, including object detection. However, large-scale jittering has recently been suggested to improve object detection performance [39]. In the traditional training networks, the scale of resizing was between 0.8 and 1.2 to avoid breaking the context of images. However, large-scale jittering resizes the input images within 0.1 to 2.0 without considering the context. This method effectively improves detection scores without incurring additional processing or computational costs. Further description of Mask R-CNN training is detailed in Supplementary S1.
After training the Mask R-CNN, its performance was evaluated by comparing its F1 score with that of the TLS data. The F1 score represents the overall object detection accuracy based on recall and precision (Equation (1)). Recall measures the correct detection rate among all detections (Equation (2)), whereas precision measures the correct detection rate among all ground truth cases (Equation (3)). In addition, the intersection over union (IoU) was calculated to ensure proper evaluation (Equation (4)). The detections with an IoU higher than 0.8 were classified as true-positives (TP), whereas detections with an IoU below 0.8, duplicated, or merged predictions were classified as false positives (FP). The undetected TLS data were classified as false negatives (FN).
F 1   s c o r e = 2 1 r e c a l l + 1 p r e c i s i o n
R e c a l l = T P F P + T P
P r e c i s i o n = T P F N + T P
I o U = A r e a t r u t h A r e a d e t e c t e d A r e a t r u t h A r e a d e t e c t e d  
To calculate the CD from the mask extracted from the Mask R-CNN detection, three different methods were adopted and compared, as shown in Figure 4. The first method is based on the concept of an equivalent diameter, where the CD is determined by the diameter of a circle that has the same area as that of the mask. The second method involves fitting a rectangle to a mask, where the CD was calculated as the average width and height of the minimum area rectangle (MinAreaRect). The final method used was the polar method, where the CD was calculated as the double average of the longest distances from the center in each of the 24 polar interval regions. Finally, the calculated CD was matched with the corresponding TLS data. The locations of the UAV photographs and the TLS point clouds were matched using GPS coordinates and reference points.

2.4. DBH Estimation Model

We utilized an allometric model describing the relationship between tree characteristics and tree size as the fundamental estimation model. In general, this model has been used to estimate aboveground biomass (AGB) from the DBH in forest ecology [40]. However, this model can also be used with other variables [41]. Allometric models appear as various functions. In this study, log-log and Weibull functions were selected. Both functions have high explanatory power and have been primarily used in other studies [42,43,44,45]. The general forms of log-log and Weibull functions are represented in Equations (5) and (6), respectively.
log Y = a + b log X  
Y = a 1 exp b X c  
As mentioned, the allometric model was developed using a representative metric, DBH, as the independent variable. However, in this study, the CD was selected as the independent variable. Thus, the applicability of the functions was assessed using the TLS data.
When estimating the DBH, bias and error are inevitable with small local samples. Although precise information is required for proper hazard evaluation, probabilistic information is still valuable for risk assessment [46]. Therefore, Bayesian regression, which determines the posterior distribution of the parameters based on the Bayesian theorem, was used in this study to calibrate the model and estimate the DBH using a probabilistic approach.
P A B = P B A P A P B
P C B = P C A P A B d A  
where A, B, C, P(A|B), P(B|A), P(A), and P(B) represent the parameter, observation, unobserved input, posterior probability, likelihood, prior probability, and marginal probability, respectively.
As analytically calculating the posterior distribution might be impractical, the Markov chain Monte Carlo (MCMC) sampling method was applied to approximate the posterior distribution. Consequently, the predictive distribution of an arbitrary unobserved input can be calculated using the posterior distribution of the parameter and observation distributions. In this study, we assume that both the prior distribution and the likelihood are normally distributed. Following modern MCMC sampling algorithms, each chain consists of 2000 samples, with 1000 samples discarded after tuning and 1000 samples retained for the posterior distribution. With Bayesian regression, the predictive distribution can be utilized to estimate wildfire behavior in a probabilistic manner for wildfire hazard evaluation.

3. Results

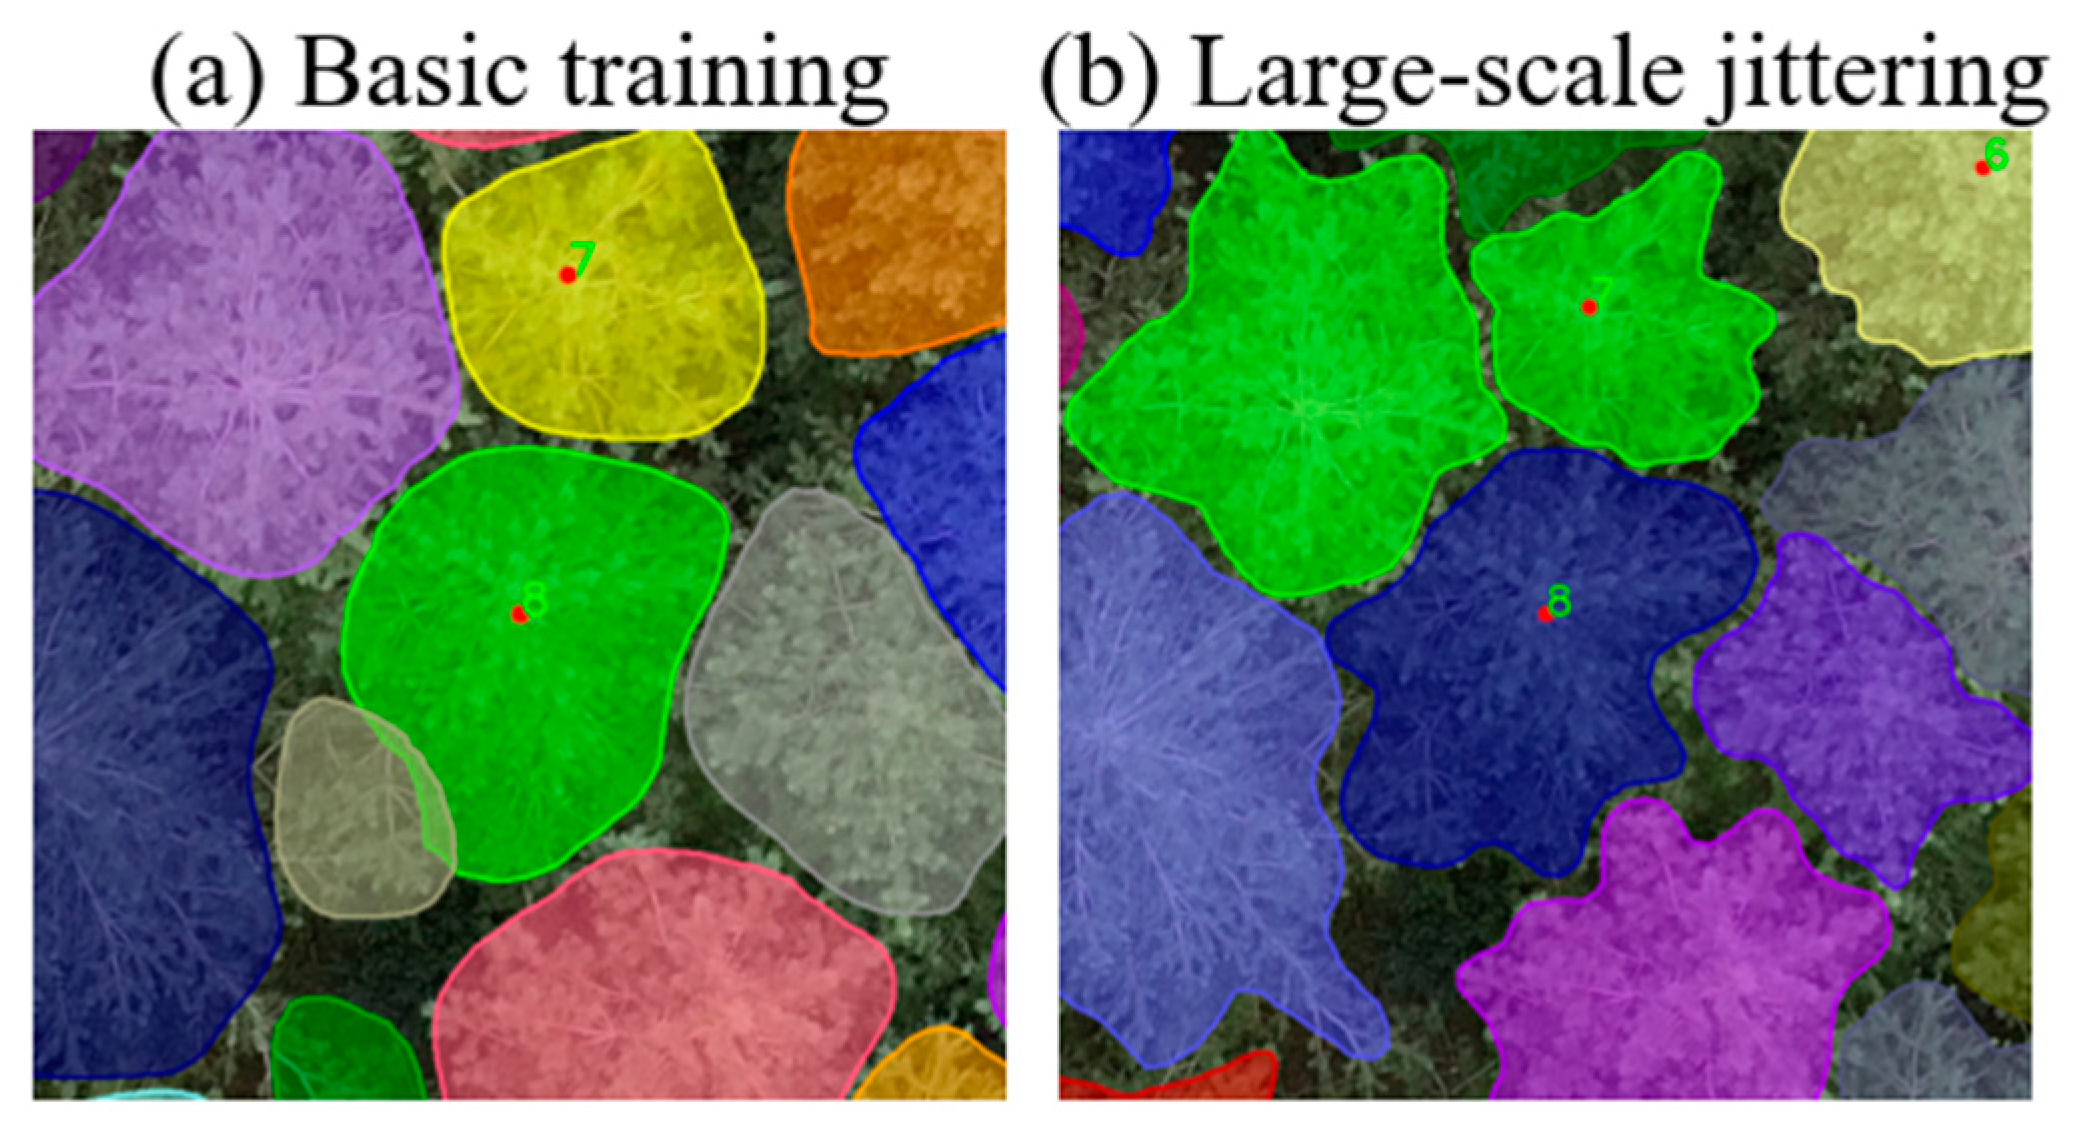
3.1. Tree Segmentation

We trained the Mask R-CNN model using data augmentation, specifically large-scale jittering, to improve individual tree detection (Figure 5). The jittering allowed the detection masks to more accurately estimate tree boundaries. Without jittering, the masks appeared imprecise, and false detections were more frequent. Furthermore, the recall and precision performance metrics were adversely affected without large-scale jittering. Thus, the F1 scores increased by approximately 18% with large-scale jittering (0.78 and 0.927 without and with large-scale jittering, respectively). Therefore, incorporating large-scale jittering during training improves the Mask R-CNN performance for individual tree detection. Finally, we decided to utilize the improved Mask R-CNN for individual tree detection.
A total of 293 trees were detected using the Mask R-CNN within the TLS region, which accounts for approximately 95% of trees sampled by the TLS. The detected trees were categorized as TPs and FPs. The TPs were determined through IoU evaluation, whereas the FPs were classified into three types (Figure 6). The first type involved FP determination through IoU evaluation. The second occurred when two or more trees were duplicated in a single mask. The last type was caused by input image corruption by noise or algorithm errors during capturing or merging UAV orthophotos. In such cases, the actual crown area could not be accurately distinguished through manual segmentation, and IoU calculation was impossible.
To quantitatively evaluate performance, the F1 score was measured using recall and precision. Tree detection recall was 0.908, indicating that the false detection probability was below 10%. The precision, which represents the accurate actual tree detection, was 0.947. Although recall was slightly lower than precision, both parameters were within the acceptable range for object detection. The F1 score was 0.927, indicating that tree detection using the Mask R-CNN showed appropriate performance.
The CD was calculated from the true-positive detections for estimation using the equivalent-diameter, MinAreaRect, and polar methods (Figure 7). The visualized scatter plots indicated that the center of the data points was further away from the identity line using the equivalent-diameter method than using the other methods. The equivalent-diameter method assumes the crown to be circular, whereas the other methods assume an arbitrary shape. The performance of the equivalent diameter method was the poorest in estimating the CD. However, the polar method showed the best performance because the calculation process used in this process is similar to that for the measured CD. Quantitatively, RMSE and bias for the polar method were significantly lower (21% and 80%, respectively) than those for the equivalent-diameter method. The MinAreaRect method showed moderate performance. In conclusion, the polar method was adopted to calculate the CD for the estimation.

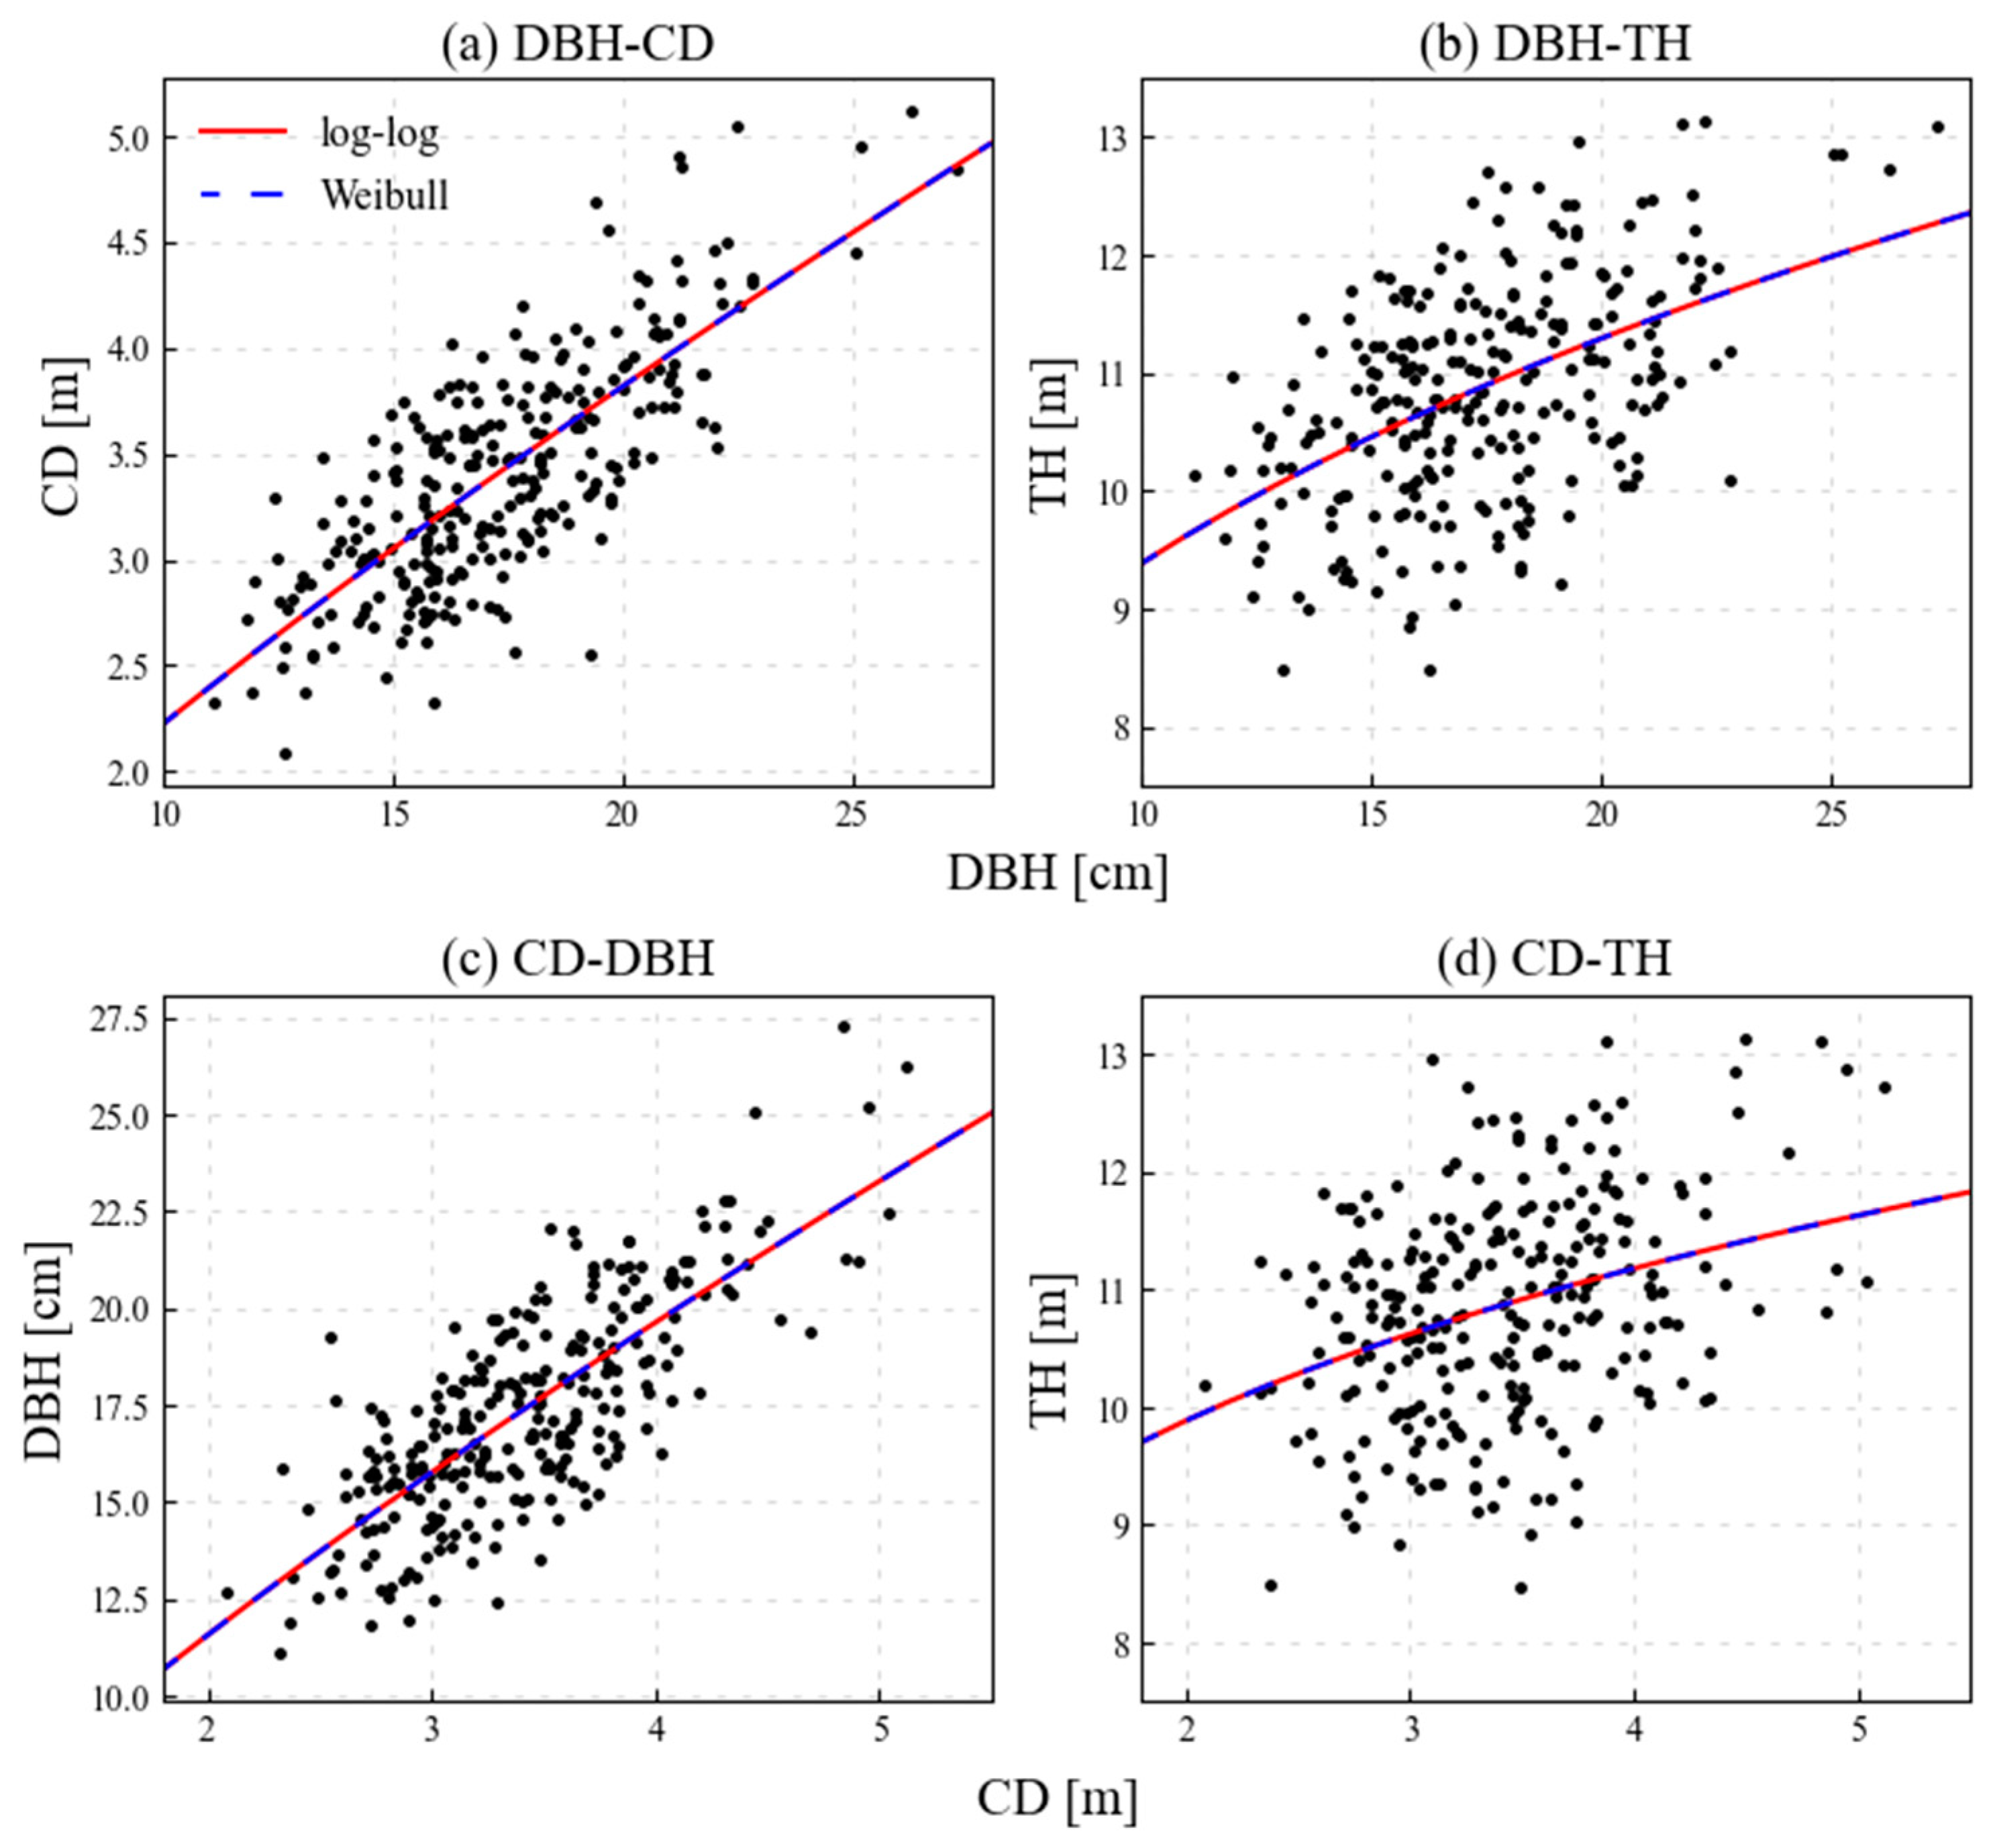
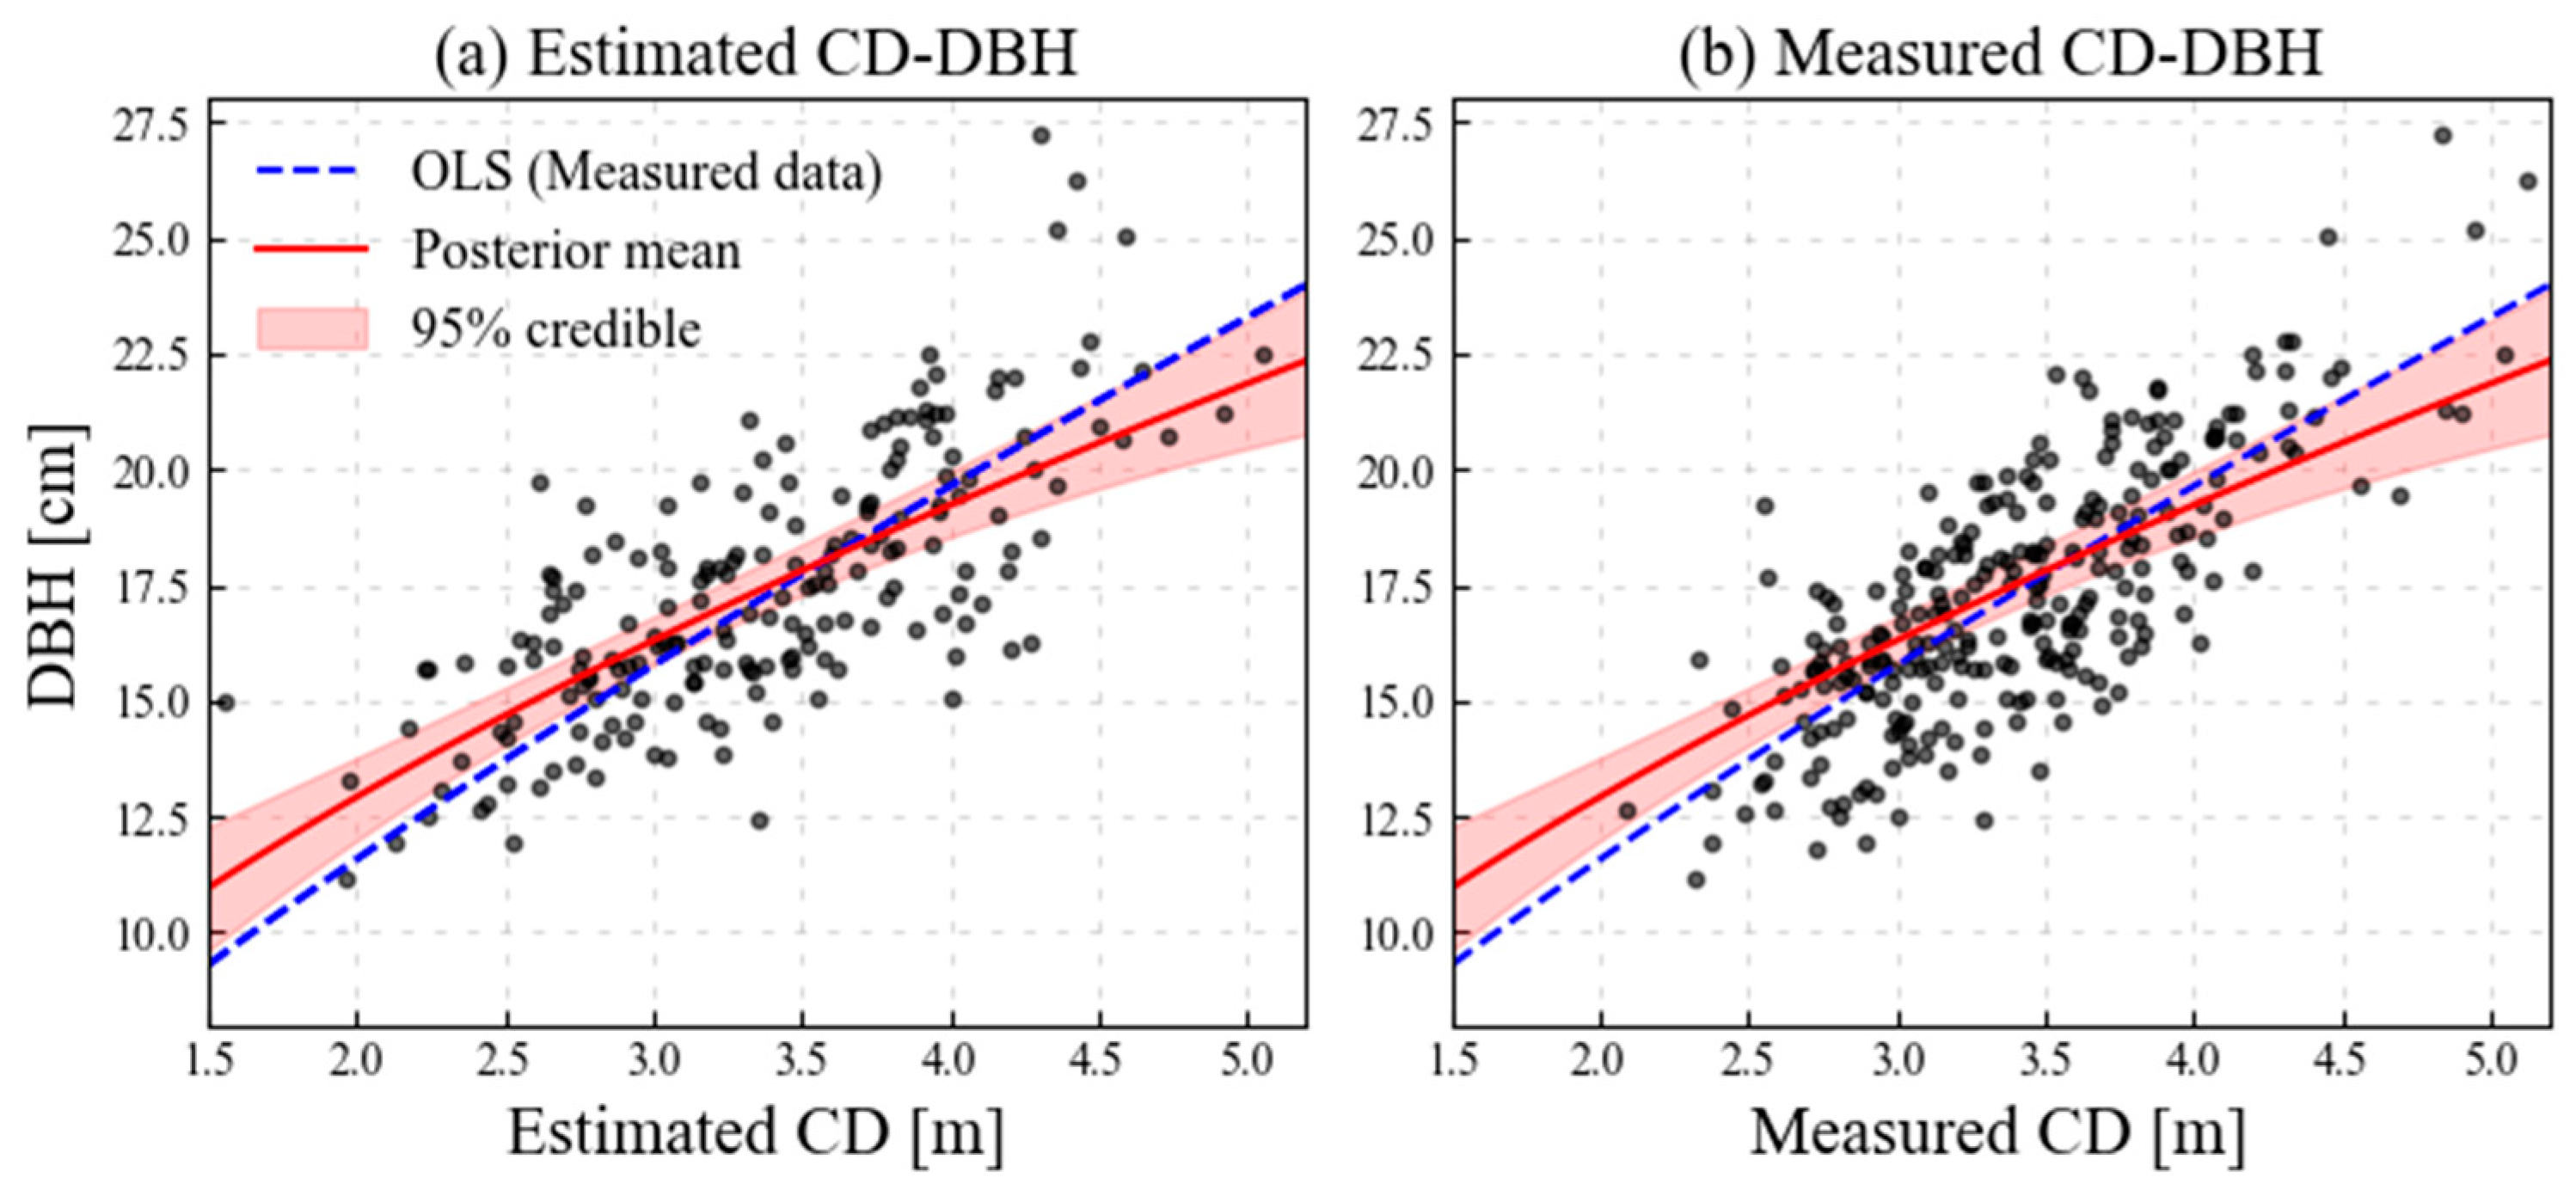
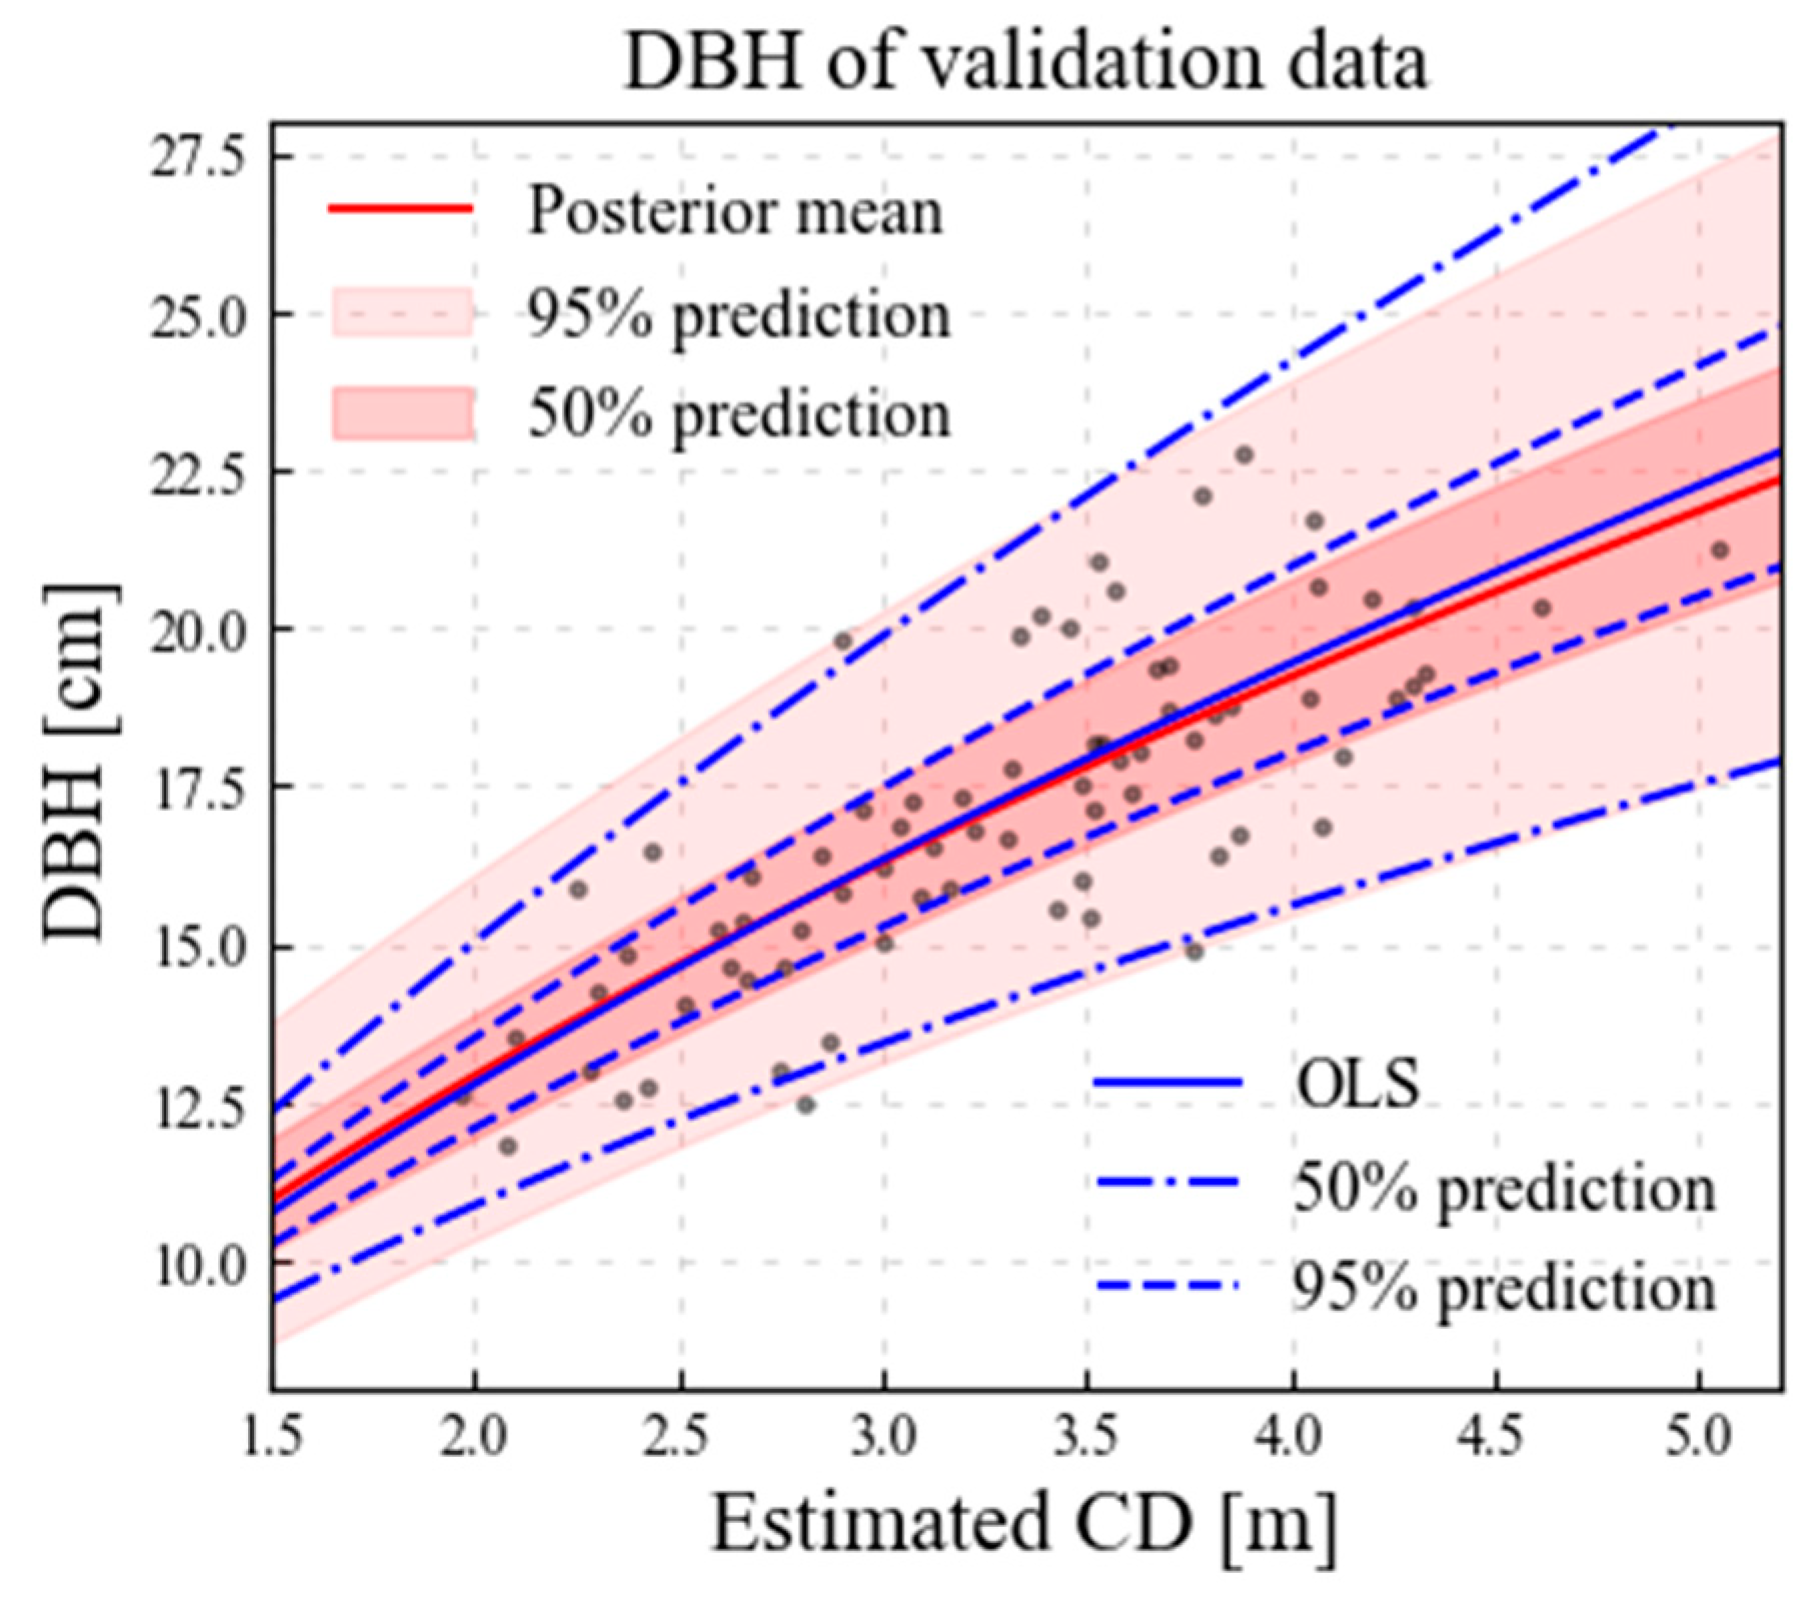
3.2. DBH Estimation Model

First, we assessed the applicability of the functions to allometric models with the CD as an independent variable. Using ordinary least squares (OLS), log-log and Weibull functions were calibrated using the metrics from the TLS data. Figure 8 shows the three metrics and corresponding allometric models. The two functions of the allometric models were the shapes of the plots. The R² and RMSE values for the two allometric models were identical. Only the biases of the log-log function were slightly optimal (Table 3). Thus, we selected and assessed the log-log function as an allometric model function.
A detailed evaluation was conducted using the R2 of allometric models, which represents the goodness of fit of the regression. The overall R2 was statistically relatively low (R2 < 0.6) owing to the locality and irregularity of the sampled region. Specifically, the R2 for CD-TH was lower than that for others, indicating that estimating the TH using the CD might not be appropriate. Additionally, the R2 for DBH-TH was low, which might have been caused by the inaccurate H of the TLS data owing to the blockage of the laser by the dense canopy. It is important to note that our low overall R2 does not indicate the inapplicability of the model for tree allometry. The R2 can be highly influenced by sample size, and our sample size of 212 was considerably smaller than those of other studies, which typically included at least 1000 samples. Consequently, our R2 was lower than the reported R2 in other studies.
Although the R2 of the allometric models was low, they were compared to qualitatively evaluate the applicability of the function. Thus, the R2 for CD-DBH was similar to that for DBH-CD and higher than that for DBH-TH. Therefore, the log-log function can be used in CD-DBH allometric models. Eventually, we calibrated the estimation model for CD-DBH using an allometric model with Bayesian regression. In the calibration process, as previously mentioned, we only used calibration data within the TLS truth region. The number of values used for calibration was 192.
Figure 9 illustrates the results of the Bayesian regression. We used the CD estimated from UAV photographs and the DBH measured from the TLS to calibrate the model. The posterior mean showed a slight difference compared with that of OLS fitted with the measured metrics. However, this difference was within the 95% confidence interval. The RMSE of the posterior mean prediction and R2 were 1.8423 and 0.5456, respectively. Thus, the RMSE was 4.2% higher, and R2 was 6.4% lower than those obtained using OLS. Considering the differences in the estimated and measured CD, the calibrated model using the extracted sample accurately predicted the OLS-fitted model with the measured data. Additionally, we evaluated the goodness of fit of the regression models using a residual plot (Figure S4). The residual distribution for the Bayesian regression represented well-distributed residuals without outliers, while OLS residuals showed a slight decreasing trend as the fitted value increased. It indicates that the Bayesian regression provides a more accurate fit compared to OLS. Therefore, we confirmed that the estimation model could be properly calibrated.
Figure 10 shows the posterior predictive calibration and validation data distribution for the probabilistic estimation model. The number of validation data in the TLS test region was 74. In Figure 10a, 95% and 50% prediction intervals accurately represent the data distribution. Moreover, their width gradually increases with an increased CD. Moreover, the predictive distribution of Bayesian regression is wide within the unobserved range. However, this distribution is exaggerated owing to the nature of the log-log function. On the logarithmic scale, the increment in the interval width appears to be smaller.
To validate the overall procedure, the predictive distribution was evaluated using the validation data, as shown in Figure 10b. Therefore, 97.2% and 64.8% of data were within the 95% and 50% prediction intervals, respectively, indicating that the predictive distribution is appropriate for estimating unobserved data.

4. Discussion

4.1. Machine-Learning-Based Individual Tree Detection

The precise detection of individual trees is crucial for accurate DBH estimation. Several methods with and without machine learning have been proposed for individual tree detection, such as watershed segmentation [47]. The F1 scores of individual tree detection without using machine learning varied from 0.4 to 0.88 [48,49,50], whereas those using machine-learning-based approaches ranged from 0.72 to 0.95 [30,51]. Thus, the F1 score reported in this study (0.927) may be used in the estimation.
However, we studied a single tree species, whereas the performance of a Mask R-CNN for individual tree detection could depend on the tree species [52]. The F1 scores for various species ranged from 0.758 to 0.975. The difference between the best and worst F1 scores was approximately 22% based on the best score. The training method used in this study was different from that used in previous studies. We trained the Mask R-CNN with large-scale jittering, which improved the performance (F1 score: 0.78), similar to the worst case reported previously. Therefore, we expect that the Mask R-CNN performance could be appropriate for other tree species, which will be investigated in future studies.
Although the Mask R-CNN shows good results in detecting trees, it should be noted that the methodology shares limitations inherent to aerial remote sensing. It could not detect overlapping tree crowns under the tree canopy due to loss of information during the capturing process. Thus, the methodology is suitable for fewer overlapping forests or species with tree shyness. However, the other methodologies have additional disadvantages due to their data collection process. For example, the traditional watershed method requires the CHM to detect and measure trees with aerial photographs. But obtaining accurate CHM is challenging with dense canopies due to the blockage of the canopies. Similarly, the ALS-based method could not collect precise data in dense canopies. Nevertheless, the methodology is more appropriate for tree detection in dense canopy forests compared to other methodologies because collecting tree metrics is not interfered with by the canopy.

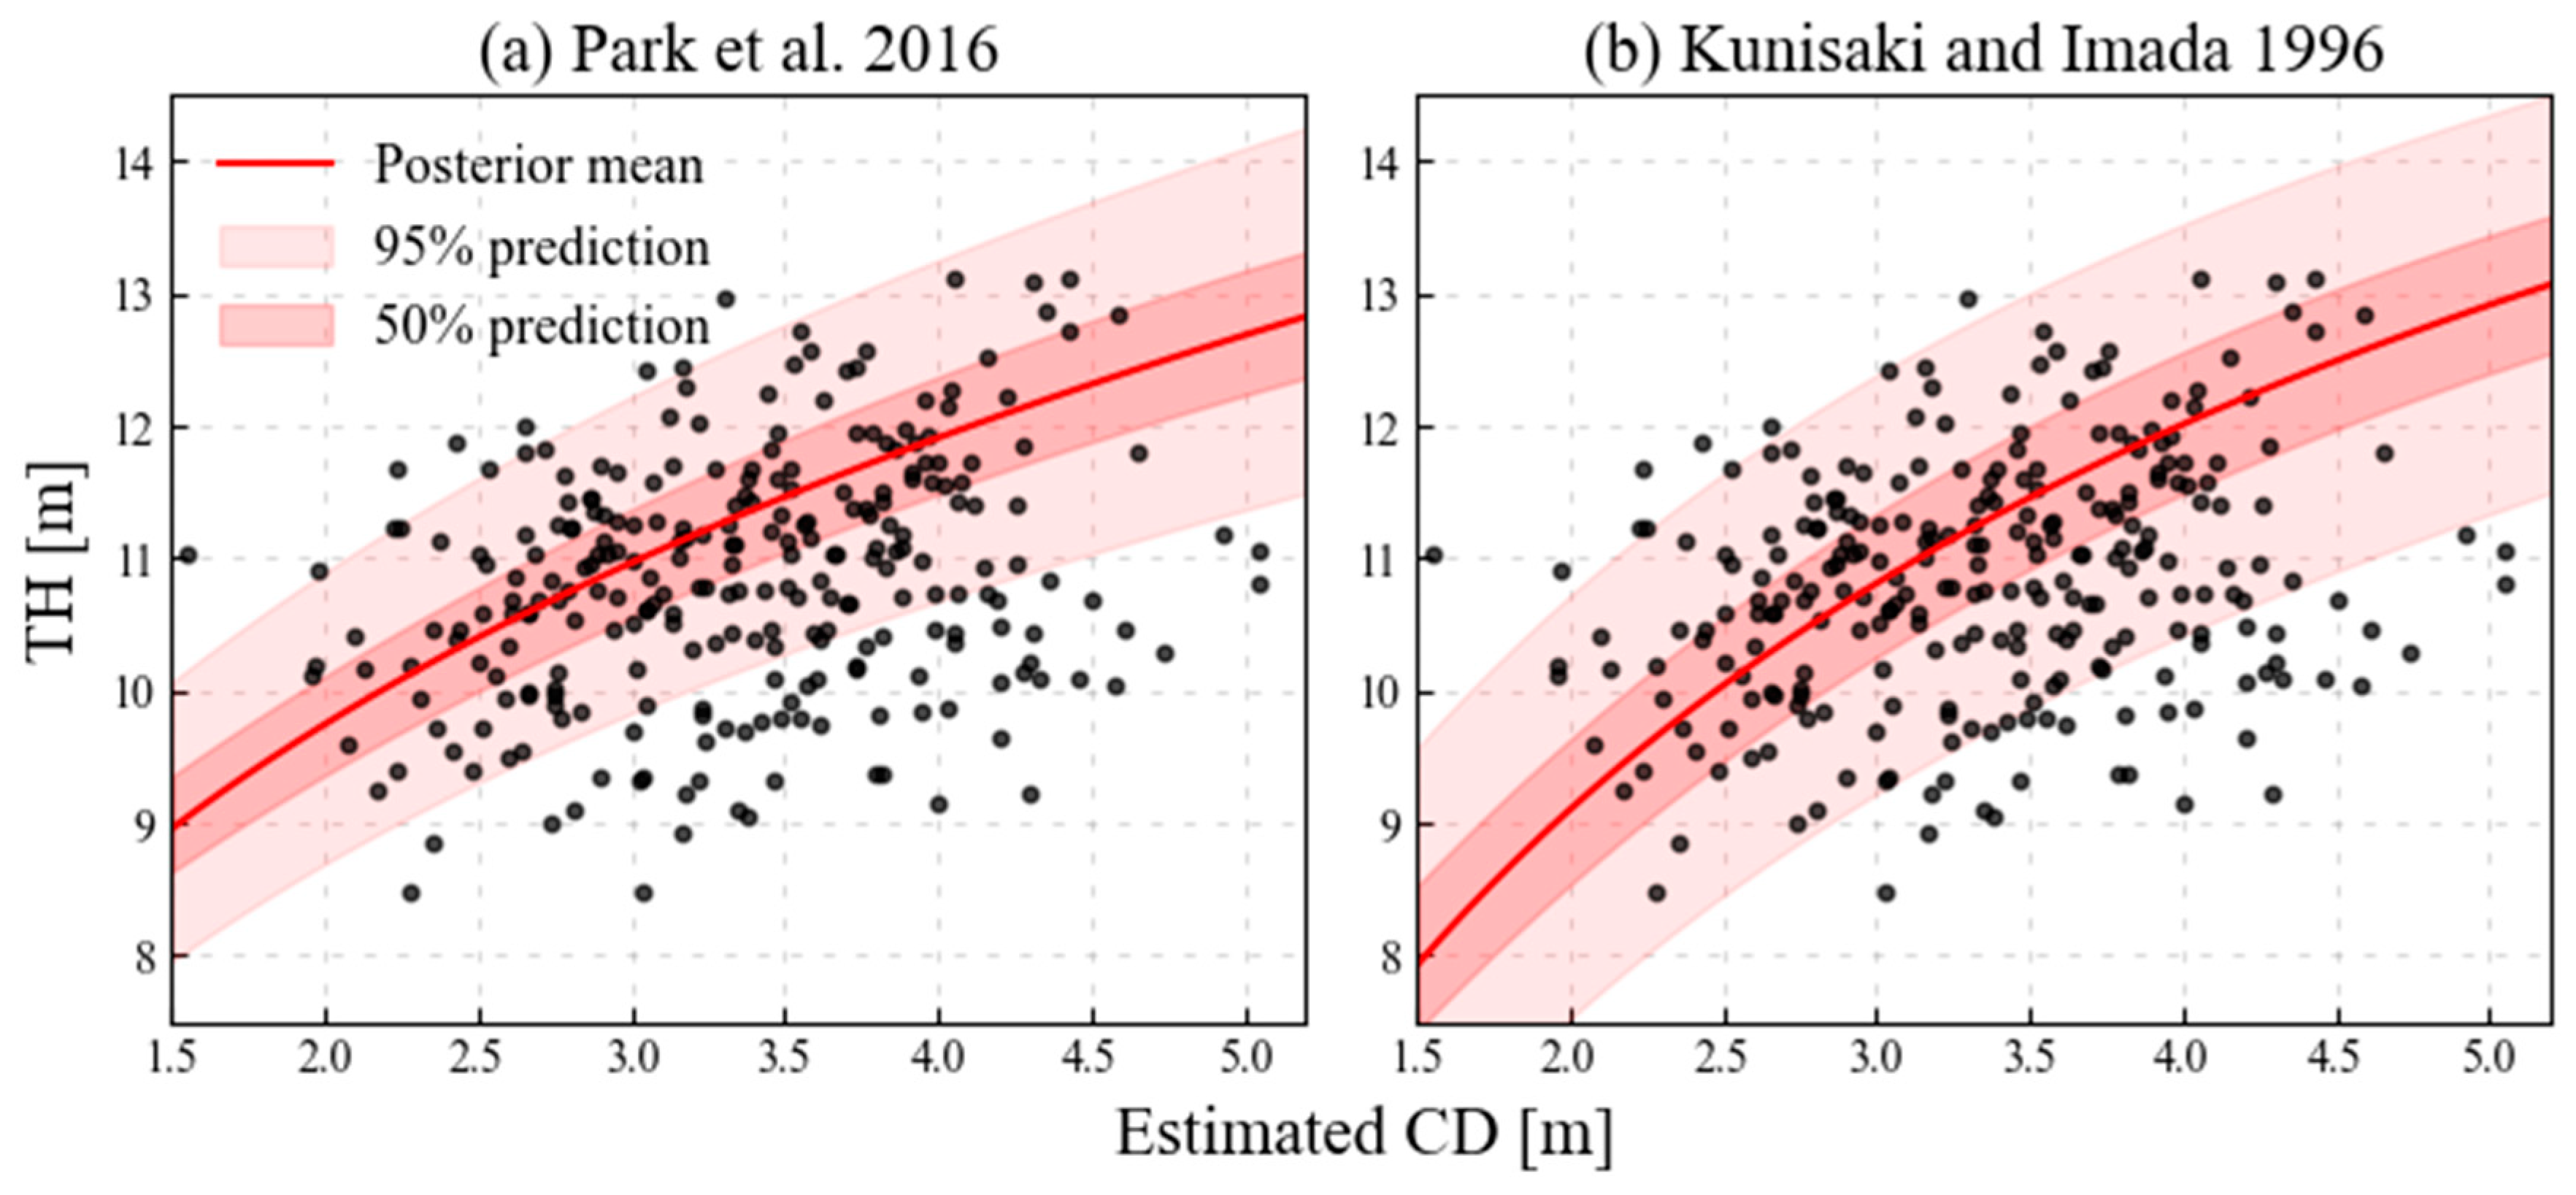
4.2. Comparison with Traditional Regressions

Using a global allometric model may not be appropriate for evaluating wildfire hazards in local forests owing to the influence of environmental factors on tree growth. Therefore, a locally calibrated model is required. A probabilistic estimation model using Bayesian regression is more suitable than the traditional allometric model with a limited sample size. Traditionally, allometric models have been fitted using OLS, which is helpful for obtaining overall forest information. However, uncertainty evaluation is crucial for risk assessment [53]. The probabilistic estimation model provides excellent uncertainty prediction results.
The allometric models were calibrated using OLS for comparison. Figure 11 presents the estimated uncertainty of OLS and the results of this study. Quantatively, 95.9% and 63.5% of data were within the 95% and 50% prediction intervals using OLS, respectively. These percentages were slightly lower compared to Bayesian regression, which achieved 97.2% and 64.8% within the same intervals. Qualtatively, the uncertainties in the data distribution of both models appear to be reasonable within the most frequent CD range (2.5–4.0 m). However, the uncertainty of OLS was not reliable outside this range, which appears to be underestimated and overestimated for the lower and higher ranges, respectively. Although the uncertainty within unobserved data increases in both regression methods because of the small sample size, the stochastic approach of Bayesian regression provides a more reasonable estimation of uncertainty than OLS. Although the uncertainty within unobserved data increases in both regression methods because of the small sample size, the stochastic approach of Bayesian regression provides a more reasonable estimation of uncertainty than OLS. For further analysis, we established the quantile regression model and compared it with the Bayesian regression model in Supplementary S2. The quantile regression model presented even poorer results than OLS. This finding emphasizes the advantage of the probabilistic estimation model in reliably evaluating uncertainty, even with limited data.

4.3. Bayesian Regression with Field Survey DBH

In this study, the results based on remote sensing data using TLS were mainly explained. However, the methodology could be applied with field survey data. A probabilistic prediction model using field surveyed DBH was established. Figure 12 depicts a comparison between the probabilistic prediction models based on the TLS measurement and the field survey. Although the field-survey-based model is not perfectly matched to the TLS-based model, 96.6% and 48.9% of TLS data were within the 95% and 50% prediction intervals of a field survey-based model, respectively. Additionally, the prediction intervals of the field survey-based and TLS-based models have similar tendencies, which indicates that the methodology could produce reasonable results using both methods of data collection.

4.4. DBH as a Representative Metric

Considering the purpose of forest biomass investigation, AGB is a fundamental variable that is required for forest management and wildfire hazard evaluation. However, AGB measurement over a wide area at individual tree level is challenging, whereas measuring the DBH is simpler and more straightforward for establishing an estimation model. Therefore, DBH-based AGB estimation is generally utilized. Indeed, various allometric models using DBH as an independent variable to estimate AGB have shown good agreement [54,55] for various tree species [56] and in several countries [57]. Similarly, DBH could be utilized to estimate other characteristics. For evaluating forest ecosystem services, the carbon storage of forests is modeled based on DBH classes [58,59]. This result indicates that the DBH can effectively represent forest biomass. Additionally, the DBH could be utilized as a factor for wildfire hazard evaluations. The maximum spot fire distance was estimated [60,61] and the crown fire transition probability was modeled with the DBH [62]. Specifically, the wildfire-spread prediction system of Korea uses the DBH classes as a crucial factor for estimating fuel information, such as surface fuel load, which is required to determine fire intensity [63]. As this study evaluated wildfire hazards in the Republic of Korea, we selected the DBH as the target estimation metric.
To measure the DBH, TLS was utilized to collect and verify precise DBH data in this study. However, the same approach could be appropriate for measuring the DBH using other methods, such as manual measurement through a field survey, as previously mentioned. In addition, measurement simplicity is beneficial for rapid wildfire hazard evaluation. Moreover, considering the well-established relationship between DBH and AGB through various allometric models, the methodology used for estimating DBH in this study could also be applied to estimate AGB.
Furthermore, the DBH can be a key metric to alleviate the limitations of using aerial photographs. Since aerial photographs provide two-dimensional data, height-directional data might be missing. If the tree canopy is not dense, three-dimensional data can be reconstructed with structure-from-motion [64]. However, dense canopy forest, similar to the site of the current study, cannot utilize the reconstruction approach with two-dimensional data. Therefore, one of the most crucial metrics of trees, TH, cannot be measured. Moreover, since the relationship between the CD and TH is statistically insignificant due to the inaccuracy of the measured TH in dense canopy conditions, the probabilistic estimation method of the current study could not be applied to TH estimation. In contrast, the relationship between the DBH and TH is well-established for various tree species [42]. For example, for Pinus densiflora, allometric correlations were introduced by Korean [65] and Japanese researchers [66].
Figure 13 depicts allometric correlations from the literature. Both correlations using Korean [65] and Japanese [66] samples show slightly higher values compared to the measured metrics. It is noted that the parts of the measured TH could be lower than the real TH due to the inaccuracy of TLS caused by the nature of the dense canopy. Although the correlation curves are slightly biased, their trends seem to be reasonable. The RMSE of the correlations from the Korean and Japanese studies is 1.01 and 1.11 m, respectively, which are 9.2% and 10.2% of relative RMSE. Thus, it can be mentioned that pre-established correlations can estimate TH well.
Figure 14 represents an example of uncertainty estimation for TH expanded with the allometric correlations. While the results of the estimation are still biased, the upper boundary of uncertainty is reasonable compared to the measured TH. Although it is not the focus of the current study, further field measurements will be conducted to establish DBH-TH-CD relationships. The knowledge obtained from the current study will aid the future work.

5. Conclusions

5.1. DBH Estimation Using a Probabilistic Approach

In this study, we proposed a DBH estimation method using a probabilistic approach to estimate forest biomass. We used recently suggested large-scale jittering to train a Mask R-CNN and improved the performance of the Mask R-CNN. Therefore, the individual trees were properly segmented in aerial photographs captured using a UAV. In addition, the calculated CD using the results of the individual trees accurately estimated the measured ground CD. Subsequently, we predicted the probabilistic DBH distribution from the estimated CD using Bayesian regression. This approach provided a better estimation of uncertainty than that by OLS, particularly in an unobserved range. The forest biomass can be estimated with a considered probability using the predictive distribution. The model effectively measures forest biomass to estimate forest ecosystem services and is also appropriate for evaluating wildfire hazards using probabilities, which are crucial for risk assessment.

5.2. Applicability and Efficiency

The method utilized in this study effectively estimated forest biomass at the individual tree level. Compared to other methodologies measuring forest biomass, our methodology has advantages in dense canopy conditions. Because the workflow and collected data are not interfered with by the tree canopy, this approach is capable of estimating forest biomass in dense canopy conditions. Additionally, our methodology is a rapid and straightforward procedure using UAV photography and has a minor requirement for acquiring measured tree metrics. Considering the number of local area evaluations required and the urgency of wildfire risk assessment, evaluating segmented and distributed areas with low cost and time consumption is useful.

5.3. Limitations and Future Work

The results obtained in this study are valuable for strategic planning and decision-making processes in forest management and wildfire mitigation. However, this study focused on one tree species, Pinus densiflora. For further assessment, the generalizability and applicability of this methodology in different forests should be tested using other tree species. Conducting such assessments on various tree species will help ensure the robustness and reliability of the methodology for assessing a wide range of forest ecosystem services and wildfire risk. Fortunately, the applicability of tree detection using a Mask R-CNN for other tree species has been demonstrated in other studies, and DBH-based tree allometric models for these species have also shown high relevance. Therefore, we believe that further assessment can be achieved by integrating these findings.

Supplementary Materials

The following supporting information can be downloaded at: https://www.mdpi.com/article/10.3390/f15111881/s1, Supplementary S1. Supplementary information regarding Mask R-CNN training, Supplementary S2. Comparison between Bayesian regression with quantile regression, Figure S1. Schematic representation of processed point clouds; (a) an individual tree with examples of tree height and crown diameter, (b) extracted point clouds at breast height, Figure S2. Example of tree identification card within visualization of TLS point clouds, Figure S3. A plot of field- and TLS-measured DBH with identity line, Figure S4. Residual plots of (a) Bayesian regression and (b) ordinary linear regression with validation dataset. Reference [67] is cited in the supplementary materials.

Author Contributions

Conceptualization, K.K., S.-k.I. and C.G.K.; methodology, K.K. and S.-k.I.; software, K.K.; validation, K.K. and S.-k.I.; formal analysis, S.Y.K. and Y.-e.L.; investigation, S.Y.K. and Y.-e.L.; resources, S.Y.K. and Y.-e.L.; data curation, S.Y.K. and Y.-e.L.; writing—original draft preparation, K.K. and S.-k.I.; writing—review and editing, K.K., S.-k.I. and C.G.K.; visualization, K.K.; supervision, C.G.K.; project administration, S.-k.I. and C.G.K.; funding acquisition, S.-k.I. All authors have read and agreed to the published version of the manuscript.

Funding

This work: including the study design and data collection, analysis, and interpretation, was supported by the Korea National Institute of Forest Science. K. K. and S. I. were supported by a Korea University research grant.

Data Availability Statement

The data used and/or analyzed in this study are available from the corresponding author upon reasonable request.

Acknowledgments

The authors thank Jieun Kang and Youngjin Jeon for assisting in the development of machine learning-based individual tree detection algorithms.

Conflicts of Interest

The authors declare no conflicts of interest.

References

  1. Fahey, T.J.; Woodbury, P.B.; Battles, J.J.; Goodale, C.L.; Hamburg, S.P.; Ollinger, S.V.; Woodall, C.W. Forest carbon storage: Ecology, management, and policy. Front. Ecol. Environ. 2010, 8, 245–252. [Google Scholar] [CrossRef]
  2. Dupuy, J.-L.; Fargeon, H.; Martin-StPaul, N.; Pimont, F.; Ruffault, J.; Guijarro, M.; Hernando, C.; Madrigal, J.; Fernandes, P. Climate change impact on future wildfire danger and activity in southern Europe: A review. Ann. For. Sci. 2020, 77, 35. [Google Scholar] [CrossRef]
  3. Jones, M.W.; Smith, A.; Betts, R.; Canadell, J.G.; Prentice, I.C.; Le Quéré, C. Climate change increases the risk of wildfires. Sci. Rev. 2020, 116, 117. [Google Scholar]
  4. Doerr, S.H.; Santín, C. Global trends in wildfire and its impacts: Perceptions versus realities in a changing world. Philos. Trans. R. Soc. B Biol. Sci. 2016, 371, 20150345. [Google Scholar] [CrossRef] [PubMed]
  5. Buechi, H.; Weber, P.; Heard, S.; Cameron, D.; Plantinga, A.J. Long-term trends in wildfire damages in California. Int. J. Wildland Fire 2021, 30, 757–762. [Google Scholar] [CrossRef]
  6. Radeloff, V.C.; Helmers, D.P.; Kramer, H.A.; Mockrin, M.H.; Alexandre, P.M.; Bar-Massada, A.; Butsic, V.; Hawbaker, T.J.; Martinuzzi, S.; Syphard, A.D. Rapid growth of the US wildland-urban interface raises wildfire risk. Proc. Natl. Acad. Sci. USA 2018, 115, 3314–3319. [Google Scholar] [CrossRef]
  7. Kramer, H.A.; Mockrin, M.H.; Alexandre, P.M.; Radeloff, V.C. High wildfire damage in interface communities in California. Int. J. Wildland Fire 2019, 28, 641. [Google Scholar] [CrossRef]
  8. Thompson, M.P.; Calkin, D.E. Uncertainty and risk in wildland fire management: A review. J. Environ. Manag. 2011, 92, 1895–1909. [Google Scholar] [CrossRef]
  9. Preisler, H.K.; Brillinger, D.R.; Burgan, R.E.; Benoit, J.W. Probability based models for estimation of wildfire risk. Int. J. Wildland Fire 2004, 13, 133. [Google Scholar] [CrossRef]
  10. Finney, M.A.; McHugh, C.W.; Grenfell, I.C.; Riley, K.L.; Short, K.C. A simulation of probabilistic wildfire risk components for the continental United States. Stoch. Environ. Res. Risk Assess. 2011, 25, 973–1000. [Google Scholar] [CrossRef]
  11. Mell, W.; McNamara, D.; Maranghides, A.; McDermott, R.; Forney, G.; Hoffman, C.; Ginder, M. Computer modelling of wildland-urban interface fires. In Proceedings of the Fire & Materials, San Francisco, CA, USA, 31 January–2 February 2011. [Google Scholar]
  12. Thompson, M.P.; Wei, Y.; Calkin, D.E.; O’Connor, C.D.; Dunn, C.J.; Anderson, N.M.; Hogland, J.S. Risk Management and Analytics in Wildfire Response. Curr. For. Rep. 2019, 5, 226–239. [Google Scholar] [CrossRef]
  13. Calama, R.; de-Dios-García, J.; del Río, M.; Madrigal, G.; Gordo, J.; Pardos, M. Mixture mitigates the effect of climate change on the provision of relevant ecosystem services in managed Pinus pinea L. forests. For. Ecol. Manag. 2021, 481, 118782. [Google Scholar] [CrossRef]
  14. Triviño, M.; Morán-Ordoñez, A.; Eyvindson, K.; Blattert, C.; Burgas, D.; Repo, A.; Pohjanmies, T.; Brotons, L.; Snäll, T.; Mönkkönen, M. Future supply of boreal forest ecosystem services is driven by management rather than by climate change. Glob. Chang. Biol. 2023, 29, 1484–1500. [Google Scholar] [CrossRef] [PubMed]
  15. Saatchi, S.; Halligan, K.; Despain, D.G.; Crabtree, R.L. Estimation of forest fuel load from radar remote sensing. IEEE Trans. Geosci. Remote Sens. 2007, 45, 1726–1740. [Google Scholar] [CrossRef]
  16. Liu, Y.; Liu, Y.; Fu, J.; Yang, C.-E.; Dong, X.; Tian, H.; Tao, B.; Yang, J.; Wang, Y.; Zou, Y.; et al. Projection of future wildfire emissions in western USA under climate change: Contributions from changes in wildfire, fuel loading and fuel moisture. Int. J. Wildland Fire 2022, 31, 1–13. [Google Scholar] [CrossRef]
  17. Yebra, M.; Quan, X.; Riaño, D.; Rozas Larraondo, P.; van Dijk, A.I.J.M.; Cary, G.J. A fuel moisture content and flammability monitoring methodology for continental Australia based on optical remote sensing. Remote Sens. Environ. 2018, 212, 260–272. [Google Scholar] [CrossRef]
  18. Gale, M.G.; Cary, G.J.; Van Dijk, A.I.J.M.; Yebra, M. Forest fire fuel through the lens of remote sensing: Review of approaches, challenges and future directions in the remote sensing of biotic determinants of fire behaviour. Remote Sens. Environ. 2021, 255, 112282. [Google Scholar] [CrossRef]
  19. Leblon, B. Forest wildfire hazard monitoring using remote sensing: A review. Remote Sens. Rev. 2001, 20, 1–43. [Google Scholar] [CrossRef]
  20. Chuvieco, E.; Aguado, I.; Salas, J.; García, M.; Yebra, M.; Oliva, P. Satellite Remote Sensing Contributions to Wildland Fire Science and Management. Curr. For. Rep. 2020, 6, 81–96. [Google Scholar] [CrossRef]
  21. Arroyo, L.A.; Pascual, C.; Manzanera, J.A. Fire models and methods to map fuel types: The role of remote sensing. For. Ecol. Manag. 2008, 256, 1239–1252. [Google Scholar] [CrossRef]
  22. Skowronski, N.S.; Clark, K.L.; Gallagher, M.; Birdsey, R.A.; Hom, J.L. Airborne laser scanner-assisted estimation of aboveground biomass change in a temperate oak–pine forest. Remote Sens. Environ. 2014, 151, 166–174. [Google Scholar] [CrossRef]
  23. Wells, A.G.; Munson, S.M.; Villarreal, M.L.; Sesnie, S.E.; Laushman, K.M. Connecting dryland fine-fuel assessments to wildfire exposure and natural resource values at risk. Fire Ecol. 2023, 19, 37. [Google Scholar] [CrossRef]
  24. Peterson, B.; Nelson, K.J.; Seielstad, C.; Stoker, J.; Jolly, W.M.; Parsons, R. Automated integration of lidar into the LANDFIRE product suite. Remote Sens. Lett. 2015, 6, 247–256. [Google Scholar] [CrossRef]
  25. Skowronski, N.S.; Haag, S.; Trimble, J.; Clark, K.L.; Gallagher, M.R.; Lathrop, R.G. Structure-level fuel load assessment in the wildland–urban interface: A fusion of airborne laser scanning and spectral remote-sensing methodologies. Int. J. Wildland Fire 2016, 25, 547–557. [Google Scholar] [CrossRef]
  26. Wang, Y.; Lehtomäki, M.; Liang, X.; Pyörälä, J.; Kukko, A.; Jaakkola, A.; Liu, J.; Feng, Z.; Chen, R.; Hyyppä, J. Is field-measured tree height as reliable as believed—A comparison study of tree height estimates from field measurement, airborne laser scanning and terrestrial laser scanning in a boreal forest. ISPRS J. Photogramm. Remote Sens. 2019, 147, 132–145. [Google Scholar] [CrossRef]
  27. Fu, H.; Zhao, H.; Jiang, J.; Zhang, Y.; Liu, G.; Xiao, W.; Du, S.; Guo, W.; Liu, X. Automatic detection tree crown and height using Mask R-CNN based on unmanned aerial vehicles images for biomass mapping. For. Ecol. Manag. 2024, 555, 121712. [Google Scholar] [CrossRef]
  28. Chimitdorzhiev, T.; Dmitriev, A.; Kirbizhekova, I.; Sherkhoeva, A.; Baltukhaev, A.; Dagurov, P. Possible inaccuracy of canopy height model estimation for dense and sparse boreal forest with Tandem-X DSM and ALOS palsar DEM fusion, case study from the Baikal lake region, Russia. In Proceedings of the IGARSS 2019—2019 IEEE International Geoscience and Remote Sensing Symposium, Yokohama, Japan, 28 July–2 August 2019; IEEE: Piscataway, NJ, USA, 2019; pp. 6693–6695. [Google Scholar]
  29. Zhao, H.; Morgenroth, J.; Pearse, G.; Schindler, J. A Systematic Review of Individual Tree Crown Detection and Delineation with Convolutional Neural Networks (CNN). Curr. For. Rep. 2023, 9, 149–170. [Google Scholar] [CrossRef]
  30. Hao, Z.; Lin, L.; Post, C.J.; Mikhailova, E.A.; Li, M.; Chen, Y.; Yu, K.; Liu, J. Automated tree-crown and height detection in a young forest plantation using mask region-based convolutional neural network (Mask R-CNN). ISPRS J. Photogramm. Remote Sens. 2021, 178, 112–123. [Google Scholar] [CrossRef]
  31. Ocer, N.E.; Kaplan, G.; Erdem, F.; Kucuk Matci, D.; Avdan, U. Tree extraction from multi-scale UAV images using Mask R-CNN with FPN. Remote Sens. Lett. 2020, 11, 847–856. [Google Scholar] [CrossRef]
  32. Su, H.; Wei, S.; Yan, M.; Wang, C.; Shi, J.; Zhang, X. Object Detection and Instance Segmentation in Remote Sensing Imagery Based on Precise Mask R-CNN. In Proceedings of the IGARSS 2019—2019 IEEE International Geoscience and Remote Sensing Symposium, Yokohama, Japan, 28 July–2 August 2019; pp. 1454–1457. [Google Scholar]
  33. National Institute of Forest Science. 2020 Korean Forest Resource; National Institute of Forest Science: Seoul, Republic of Korea, 2021. [Google Scholar]
  34. Novotny, J.; Navratilova, B.; Albert, J.; Cienciala, E.; Fajmon, L.; Brovkina, O. Comparison of spruce and beech tree attributes from field data, airborne and terrestrial laser scanning using manual and automatic methods. Remote Sens. Appl. Soc. Environ. 2021, 23, 100574. [Google Scholar] [CrossRef]
  35. Roman, L.A.; van Doorn, N.S.; McPherson, E.G.; Scharenbroch, B.C.; Henning, J.G.; Östberg, J.P.A.; Mueller, L.S.; Koeser, A.K.; Mills, J.R.; Hallett, R.A.; et al. Urban Tree Monitoring; U.S. Department of Agriculture, Forest Service, Northern Research Station: Madison, WI, USA, 2020. [Google Scholar]
  36. Koreň, M.; Mokroš, M.; Bucha, T. Accuracy of tree diameter estimation from terrestrial laser scanning by circle-fitting methods. Int. J. Appl. Earth Obs. Geoinf. 2017, 63, 122–128. [Google Scholar] [CrossRef]
  37. He, K.; Gkioxari, G.; Dollár, P.; Girshick, R. Mask R-CNN. In Proceedings of the 2017 IEEE International Conference on Computer Vision (ICCV), Venice, Italy, 22–29 October 2017; pp. 2980–2988. [Google Scholar]
  38. Ren, S.; He, K.; Girshick, R.; Sun, J. Faster R-CNN: Towards real-time object detection with region proposal networks. In Proceedings of the 28th International Conference on Neural Information Processing Systems, Montreal, QC, Canada, 7–12 December 2015; Volume 1, pp. 91–99. [Google Scholar]
  39. Ghiasi, G.; Cui, Y.; Srinivas, A.; Qian, R.; Lin, T.-Y.; Cubuk, E.; Le, Q.; Zoph, B. Simple Copy-Paste is a Strong Data Augmentation Method for Instance Segmentation. In Proceedings of the IEEE/CVF Conference on Computer Vision and Pattern Recognition, Nashville, TN, USA, 20–25 June 2021; pp. 2917–2927. [Google Scholar] [CrossRef]
  40. Komiyama, A.; Ong, J.E.; Poungparn, S. Allometry, biomass, and productivity of mangrove forests: A review. Aquat. Bot. 2008, 89, 128–137. [Google Scholar] [CrossRef]
  41. Forrester, D.I.; Benneter, A.; Bouriaud, O.; Bauhus, J. Diversity and competition influence tree allometric relationships—Developing functions for mixed-species forests. J. Ecol. 2017, 105, 761–774. [Google Scholar] [CrossRef]
  42. Feldpausch, T.R.; Banin, L.; Phillips, O.L.; Baker, T.R.; Lewis, S.L.; Quesada, C.A.; Affum-Baffoe, K.; Arets, E.J.M.M.; Berry, N.J.; Bird, M.; et al. Height-diameter allometry of tropical forest trees. Biogeosciences 2011, 8, 1081–1106. [Google Scholar] [CrossRef]
  43. Feldpausch, T.R.; Lloyd, J.; Lewis, S.L.; Brienen, R.J.W.; Gloor, M.; Monteagudo Mendoza, A.; Lopez-Gonzalez, G.; Banin, L.; Abu Salim, K.; Affum-Baffoe, K.; et al. Tree height integrated into pantropical forest biomass estimates. Biogeosciences 2012, 9, 3381–3403. [Google Scholar] [CrossRef]
  44. Ledo, A.; Cornulier, T.; Illian, J.B.; Iida, Y.; Kassim, A.R.; Burslem, D.F.R.P. Re-evaluation of individual diameter : Height allometric models to improve biomass estimation of tropical trees. Ecol. Appl. 2016, 26, 2376–2382. [Google Scholar] [CrossRef]
  45. King, D.A. Tree allometry, leaf size and adult tree size in old-growth forests of western Oregon. Tree Physiol. 1991, 9, 369–381. [Google Scholar] [CrossRef]
  46. Hassett, M.J.; Stewart, D. Probability for Risk Management; Actex Publications: Greenland, NH, USA, 2006. [Google Scholar]
  47. Ke, Y.; Quackenbush, L.J. A review of methods for automatic individual tree-crown detection and delineation from passive remote sensing. Int. J. Remote Sens. 2011, 32, 4725–4747. [Google Scholar] [CrossRef]
  48. Miraki, M.; Sohrabi, H.; Fatehi, P.; Kneubuehler, M. Individual tree crown delineation from high-resolution UAV images in broadleaf forest. Ecol. Inform. 2021, 61, 101207. [Google Scholar] [CrossRef]
  49. Hui, Z.; Cheng, P.; Yang, B.; Zhou, G. Multi-level self-adaptive individual tree detection for coniferous forest using airborne LiDAR. Int. J. Appl. Earth Obs. Geoinf. 2022, 114, 103028. [Google Scholar] [CrossRef]
  50. Li, Y.; Xie, D.; Wang, Y.; Jin, S.; Zhou, K.; Zhang, Z.; Li, W.; Zhang, W.; Mu, X.; Yan, G. Individual tree segmentation of airborne and UAV LiDAR point clouds based on the watershed and optimized connection center evolution clustering. Ecol. Evol. 2023, 13, e10297. [Google Scholar] [CrossRef] [PubMed]
  51. Mubin, N.A.; Nadarajoo, E.; Shafri, H.Z.M.; Hamedianfar, A. Young and mature oil palm tree detection and counting using convolutional neural network deep learning method. Int. J. Remote Sens. 2019, 40, 7500–7515. [Google Scholar] [CrossRef]
  52. Ferreira, M.P.; Almeida, D.R.A.d.; Papa, D.d.A.; Minervino, J.B.S.; Veras, H.F.P.; Formighieri, A.; Santos, C.A.N.; Ferreira, M.A.D.; Figueiredo, E.O.; Ferreira, E.J.L. Individual tree detection and species classification of Amazonian palms using UAV images and deep learning. For. Ecol. Manag. 2020, 475, 118397. [Google Scholar] [CrossRef]
  53. Chapman, P.M.; Fairbrother, A.; Brown, D. A critical evaluation of safety (uncertainty) factors for ecological risk assessment. Environ. Toxicol. Chem. 1998, 17, 99–108. [Google Scholar] [CrossRef]
  54. Chave, J.; Andalo, C.; Brown, S.; Cairns, M.A.; Chambers, J.Q.; Eamus, D.; Fölster, H.; Fromard, F.; Higuchi, N.; Kira, T.; et al. Tree allometry and improved estimation of carbon stocks and balance in tropical forests. Oecologia 2005, 145, 87–99. [Google Scholar] [CrossRef]
  55. Jenkins, J.; Chojnacky, D.C.; Heath, L.; Birdsey, R.A. National Scale Biomass Estimators for United States Tree Species. For. Sci. 2003, 49, 12–35. [Google Scholar] [CrossRef]
  56. Abich, A.; Mucheye, T.; Tebikew, M.; Gebremariam, Y.; Alemu, A. Species-specific allometric equations for improving aboveground biomass estimates of dry deciduous woodland ecosystems. J. For. Res. 2019, 30, 1619–1632. [Google Scholar] [CrossRef]
  57. Huy, B.; Kralicek, K.; Poudel, K.P.; Phuong, V.T.; Khoa, P.V.; Hung, N.D.; Temesgen, H. Allometric equations for estimating tree aboveground biomass in evergreen broadleaf forests of Viet Nam. For. Ecol. Manag. 2016, 382, 193–205. [Google Scholar] [CrossRef]
  58. Lindén, L.; Riikonen, A.; Setälä, H.; Yli-Pelkonen, V. Quantifying carbon stocks in urban parks under cold climate conditions. Urban For. Urban Green. 2020, 49, 126633. [Google Scholar] [CrossRef]
  59. Dar, A.A.; Parthasarathy, N. Patterns and drivers of tree carbon stocks in Kashmir Himalayan forests: Implications for climate change mitigation. Ecol. Process. 2022, 11, 58. [Google Scholar] [CrossRef]
  60. Albini, F.A. Spot Fire Distance from Burning Trees—A Predictive Model; USDA Forest Service, Intermountain Forest and Range Experiment Station: Ogden, UT, USA, 1979; p. 73. [Google Scholar]
  61. Andrews, P.L. Current status and future needs of the BehavePlus Fire Modeling System. Int. J. Wildland Fire 2014, 23, 21–33. [Google Scholar] [CrossRef]
  62. Miller, C. Simulation of the Consequences of Different Fire Regimes to Support Wildland Fire Use Decisions. Fire Ecol. 2007, 3, 83–102. [Google Scholar] [CrossRef]
  63. Lee, B.D.; Lee, M.B.; Chung, J.S. Forecasting System and method of Forest Fire Spreading; Korea Intellectual Property Rights Information Service: Daejeon, Republic of Korea, 2011. [Google Scholar]
  64. Westoby, M.J.; Brasington, J.; Glasser, N.F.; Hambrey, M.J.; Reynolds, J.M. ‘Structure-from-Motion’photogrammetry: A low-cost, effective tool for geoscience applications. Geomorphology 2012, 179, 300–314. [Google Scholar] [CrossRef]
  65. Park, J.; Jung, S.Y.; Lee, K.; Kim, C.; Park, Y.; Yoo, B. Classification of Regional Types for Pinus densiflora stands Using Height-DBH Growth in Korea. J. Korean For. Soc. 2016, 105, 336–341. [Google Scholar] [CrossRef]
  66. Kunisaki, T.; Imada, M. DBH-Height Relationship for Japanese Red Pine (Pinus densiflora) in Extensive Natural Forests in Southern Japan. J. For. Plan. 1996, 2, 115–123. [Google Scholar] [CrossRef]
  67. Lin, T.-Y.; Dollár, P.; Girshick, R.; He, K.; Hariharan, B.; Belongie, S. Feature pyramid networks for object detection. In Proceedings of the IEEE Conference on Computer Vision and Pattern Recognition, Honolulu, HI, USA, 21–26 July 2017. [Google Scholar]
Figure 1. Schematics of the overall procedure for establishing a probabilistic estimation model and estimation process.
Forests 15 01881 g001
Figure 2. (a) Location of the study site. (b) Aerial photographs with regions of interest.
Forests 15 01881 g002
Figure 3. Mask region-based convolutional neural network (Mask R-CNN) structure.
Forests 15 01881 g003
Figure 4. Schematics of crown diameter (CD) calculation methods from a segmentation mask.
Forests 15 01881 g004
Figure 5. Training result of tree segmentation (a) without and (b) with large-scale jittering.
Forests 15 01881 g005
Figure 6. Examples of tree detection results using a Mask region-based convolutional neural network (Mask R-CNN).
Forests 15 01881 g006
Figure 7. Plots of measured and estimated crown diameter (CD) of various methods with identity lines.
Forests 15 01881 g007
Figure 8. Plots of metrics from terrestrial laser scanning (TLS) measured data and allometric models. CD: crown diameter, DBH: diameter at breast height, TH: tree height.
Forests 15 01881 g008
Figure 9. Scatter plots of (a) estimated and (b) measured crown diameter (CD) versus diameter at breast height (DBH) with a posterior mean from Bayesian regression and ordinary least square fitted to measured data.
Forests 15 01881 g009
Figure 10. Scatter plots of estimated crown diameter (CD) using (a) calibration data and (b) validation data versus diameter at breast height (DBH) with posterior predictive distribution from Bayesian regression.
Forests 15 01881 g010
Figure 11. Estimated uncertainty of the ordinary least-square-fitted function compared to the result of the probabilistic estimation model with a scatter plot of diameter at breast height (DBH) versus estimated crown diameter (CD).
Forests 15 01881 g011
Figure 12. A scatter plot of estimated crown diameter (CD) versus terrestrial laser scanning (TLS) measured diameter at breast height (DBH) with probabilistic estimation model based on (red) terrestrial laser scanning (TLS) measured DBH and (blue) field survey DBH.
Forests 15 01881 g012
Figure 13. A plot of allometric correlations between tree height (TH) and diameter at breast height (DBH) with measured data using terrestrial laser scanning (TLS) [65,66].
Forests 15 01881 g013
Figure 14. Plots of probabilistic estimation for tree height (TH) using TH allometric correlations based on diameter at breast height (DBH) with measured crown diameter (CD) and TH from terrestrial laser scanning (TLS) [65,66].
Forests 15 01881 g014
Table 1. Specifications of remote sensing equipment used for data collection.
Terrestrial Laser Scanning System (RTC 360, Leica)
Resolution of point clouds [mm]3
Accuracy [mm]
@ Distance from equipment
1.9 @ 10 m
2.9 @ 20 m
5.3 @ 40 m
Precision [mm]
@ Distance from equipment
0.4 @ 10 m
0.5 @ 20 m
Max range [m]130
Laser wavelength [nm]1550
Unmanned Aerial Vehicle (Matrice 300 RTK, DJI)
Flight speed [m/s]12
Flight altitude [m]50
Side and end overlap for photography [%]80
Megapixels20
F-stop3.2
Focal length [mm]8, (effective) 24
Unit length per pixel [mm]11.3
Table 2. Characteristics of the forest and trees from terrestrial laser scanning (TLS) data from Pinus densiflora forest in Gangwon-do, the Republic of Korea. Right column represents the mean and ranges of data.
Stem density [1/ha]678.25 (577.28, 779.22)
Number of samples308 (152, 156)
DBH [cm]17.34 (11.13–27.26)
TH [m]10.84 (8.48–13.13)
CD [m]3.41 (2.09–5.12)
Table 3. R2, RMSE, and bias of allometric models fitted to terrestrial laser scanning (TLS) data. Units of RMSE and bias are cm for CD-DBH and m for other variables. CD: crown diameter, DBH: diameter at breast height, TH: tree height.
Log-LogWeibull
R2RMSEBiasR2RMSEBias
DBHCD0.58290.3508−0.12260.58290.3508−0.1247
TH0.24170.8033−0.02060.24170.8033−0.0289
CDDBH0.58311.7647−0.53580.58311.7647−0.5656
TH0.09840.8691−0.01100.09840.8691−0.0184
Disclaimer/Publisher’s Note: The statements, opinions and data contained in all publications are solely those of the individual author(s) and contributor(s) and not of MDPI and/or the editor(s). MDPI and/or the editor(s) disclaim responsibility for any injury to people or property resulting from any ideas, methods, instructions or products referred to in the content.

