Article

The Distributional Range Changes of European Heterobasidion Under Future Climate Change

College of Water Conservancy and Transportation, Zhengzhou University, Zhengzhou 450001, China
*
Author to whom correspondence should be addressed.
Forests 2024, 15(11), 1863; https://doi.org/10.3390/f15111863
Submission received: 23 September 2024 / Revised: 21 October 2024 / Accepted: 22 October 2024 / Published: 24 October 2024
(This article belongs to the Section Forest Health)

Abstract

:
Heterobasidion, a significant forest pathogen affecting coniferous forests in the Northern Hemisphere, can infect 27 species of coniferous trees, leading to widespread forest mortality. It has already caused considerable damage to both natural and plantation forests in Europe. As essential components of the global ecosystem, forests are increasingly affected by ongoing environmental changes. The ability to accurately predict and effectively respond to pathogen outbreaks across different habitats is becoming increasingly critical. This study employs an optimized MaxEnt model in conjunction with six Global Climate Models (GCMs) to simulate and predict the potentially suitable distributions and changes of three Heterobasidion species in Europe (Heterobasidion abietinum, Heterobasidion annosum sensu stricto, Heterobasidion parviporum) under current conditions and four future climate scenarios (SSP126, SSP245, SSP370, and SSP585) for the period 2081–2100. The objective of this analysis is to assess the potential effects of climate change on the distribution of Heterobasidion species. The results indicate that the distributions of the three Heterobasidion species are influenced by factors such as temperature and precipitation. By 2081–2100, under most climate scenarios, except for the SSP585 scenario, the distribution areas of the three Heterobasidion species show an expansion trend. Notably, Heterobasidion abietinum showed the most significant expansion of its suitable habitat, while the expansion of low-suitability areas for Heterobasidion parviporum and Heterobasidion annosum sensu stricto was more pronounced. Heterobasidion abietinum is projected to shift southward due to factors such as precipitation, while Heterobasidion parviporum and Heterobasidion annosum sensu stricto are expected to migrate northward, influenced by factors such as temperature and host tree species.

1. Introduction

The climate serves as a major driver of species distribution and abundance, interacting with environmental factors such as topography and soil type to determine geographic ranges via variations in temperature and precipitation across latitudes [1]. The rapid increase in population growth and energy consumption has led to a rise in global carbon emissions, significantly impacting the climate system and contributing to the continued rise in global temperatures [2]. Research indicates that the Earth’s average surface temperature from 2011 to 2020 was approximately 1.09 °C higher than that recorded in the 1850–1906 period [3]. This temperature rise further complicates climate change and also affects ecological distributions and habitat suitability for various species. The profound effects of global warming on ecosystems underscore the urgency for future research to explore the intricate relationships between climate and species distribution.
Climate change significantly impacts forest dynamics, with both positive and negative effects on natural and managed ecosystems [4]. To date, most studies have focused primarily on the effects of climate change on tree species distribution and productivity, while relatively little attention has been given to the potential impacts of forest pests and pathogens on tree health. However, the effects of these pathogens and pests are regarded as some of the most significant challenges to global forest health in the context of climate change [5]. Climate change can influence the disruptive effects of forest pathogens through various mechanisms. For instance, changes in temperature and precipitation patterns directly affect the geographic distribution, population structure, interactions with host trees, and evolutionary potential of forest pests and pathogens. Additionally, variations in temperature, precipitation, solar radiation, and atmospheric CO2 concentrations may indirectly affect the ability of forest systems to withstand and tolerate pathogen invasions [6,7]. However, limited research currently exists on predicting the effects of biotic factors and climate change on forest pathogens.
The Heterobasidion is one of the most threatening forest pathogens affecting coniferous trees in the Northern Hemisphere, primarily parasitizing living coniferous trees [8]. It is estimated that economic losses in Europe due to Heterobasidion infections amount to approximately 800 million euros annually [9]. Heterobasidion causes butt rot, a disease that leads to significant economic losses in forestry worldwide, particularly in the northern temperate regions. This disease is widely distributed across the Northern Hemisphere, spanning from northern Finland to northern America and Central America, and is recognized by the international forestry community as one of the most severe forest diseases globally [10,11].
Since the 1980s, research in morphology, genetics, ecology, and molecular biology has expanded the known Heterobasidion species from two to fifteen. The distribution of these species exhibits almost no overlap at the intercontinental level [12,13]. The highly pathogenic Heterobasidion species currently recognized include Heterobasidion abietinum (H. abietinum), Heterobasidion annosum sensu stricto (H. annosum s.str.), Heterobasidion parviporum (H. parviporum), Heterobasidion irregulare (H. irregulare), and Heterobasidion occidentale (H. occidentale), widely distributed throughout Europe and North America. In contrast, the less pathogenic Heterobasidion subparviporum (H. subparviporum) is primarily found in Asia, while other species are mainly saprotrophic (Table 1) [14,15,16,17]. Heterobasidion species are among the most threatening forest pathogens in coniferous forests of the Northern Hemisphere, capable of infecting 27 conifer species and causing large-scale forest mortality. They have already caused significant losses in plantation forests throughout Europe and North America [18]. Therefore, predicting the current and future distributions of Heterobasidion species is critically important for assessing forest losses and developing effective forest protection strategies.
Ecological niche models utilize the relationship between a species’ known occurrence points and environmental factors to infer suitable conditions for its survival. The results are projected across various time periods or geographical spaces to predict potential distribution areas based on probability [19]. With advancements in technology, various ecological niche models have been developed using different algorithms, such as BioClim, DoMain, GARP, GLM, and MaxEnt [20,21]. MaxEnt is now regarded as the most effective tool combined with ArcGIS, known for its high accuracy [22,23]. Consequently, it is an ideal model for researchers, applicable in predicting both prehistoric geological periods and future climate scenarios [24]. It is also preferred in species conservation, phylogeography, and potential species distribution simulations [25]. Its advantages include operating with various sample sizes and managing complex interactions among variables through feature selection [26,27]. Predictions are minimally affected by individual erroneous data. Additionally, MaxEnt provides accurate predictions even when species distribution records are limited (fewer than 20) [28]. Based on these distributions, changes in distribution areas are estimated, migration routes explored, future population threats assessed, and potential refugia identified. Zheng et al. (2021) used the MaxEnt and prioritizr models to simulate potential distributions of 60 native species in the Yanhe River Basin [29]. Similarly, Lee et al. employed MaxEnt to show that a suitable habitat for Solenopsis geminata is expected to expand and shift toward higher latitudes [30].
Forests are critical components of ecosystems worldwide; with ongoing environmental changes, predicting and responding to pathogen outbreaks in various habitats is increasingly important. Heterobasidion species are among the most threatening forest pathogens for coniferous trees in the Northern Hemisphere. Therefore, predicting their habitat distribution, influencing factors, and future trends in Europe is vital for protecting European forests. This study employs an optimized MaxEnt model with six Global Climate Models (GCMs) to simulate and predict suitable distributions and changes of three Heterobasidion species in Europe (H. abietinum, H. annosum s.str., and H. parviporum) under current conditions and four future climate scenarios: SSP126 (low emissions sustainable development), SSP245 (moderate emissions), SSP370 (high emissions), and SSP585 (very high emissions).

2. Materials and Methods

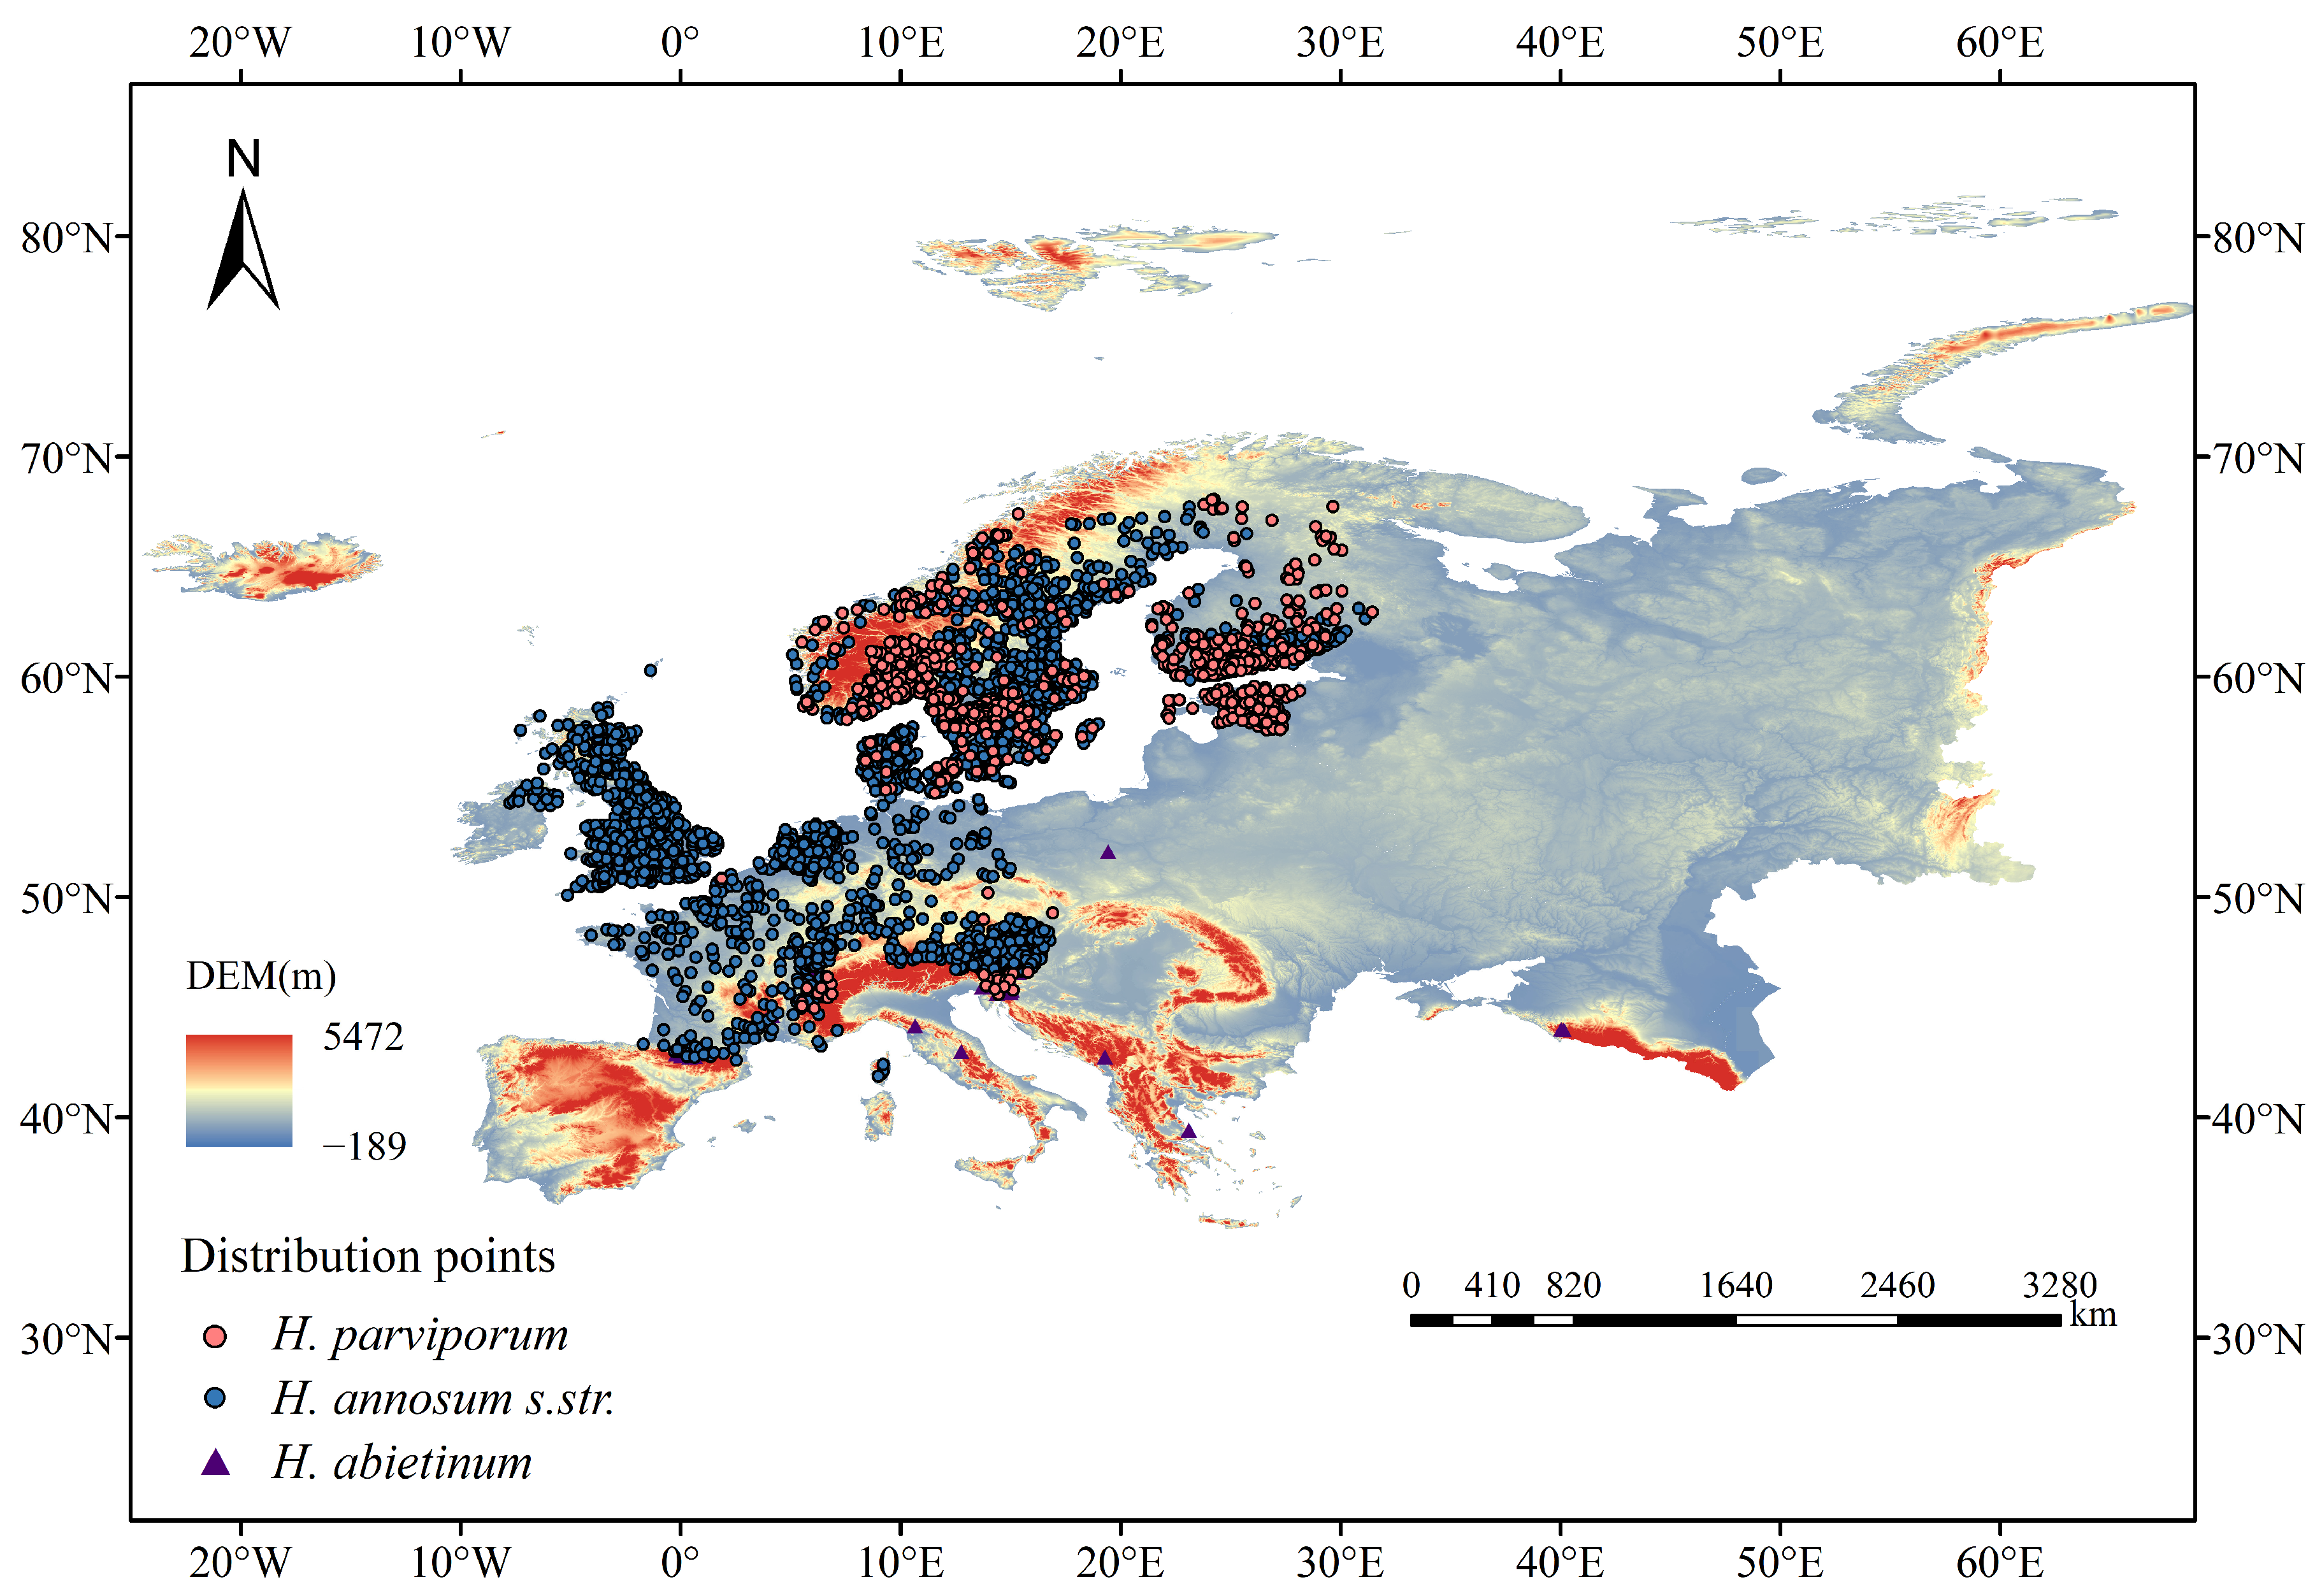
2.1. Collecting and Processing Obtained Species Occurrence Data

The establishment of ecological niche models requires thorough documentation of the target species. In this study, occurrence records for three highly pathogenic European Heterobasidion species (H. abietinum, H. annosum s.str., and H. parviporum) were collected, primarily from the Global Biodiversity Information Facility (GBIF: https://www.gbif.org/ (accessed on 12 June 2024)). We removed erroneous, duplicate records, records lacking geographic coordinates, and those located in non-terrestrial areas to obtain the final species distribution data. To avoid the effects of spatial autocorrelation and model overfitting on the predictions, we utilized the SDM Toolbox (v2.6, Center for Ecological and Environmental Sciences, Springfield, IL, USA.) in ArcGIS (v10.8, Esri, Redlands, CA, USA) to perform data thinning, generating a 1 km radius buffer around each occurrence point. If the buffers of occurrence points overlapped, one was randomly retained while the others were discarded. Ultimately, we collected 45 occurrence records for H. abietinum, 2550 for H. annosum s.str., and 694 for H. parviporum (Figure 1).

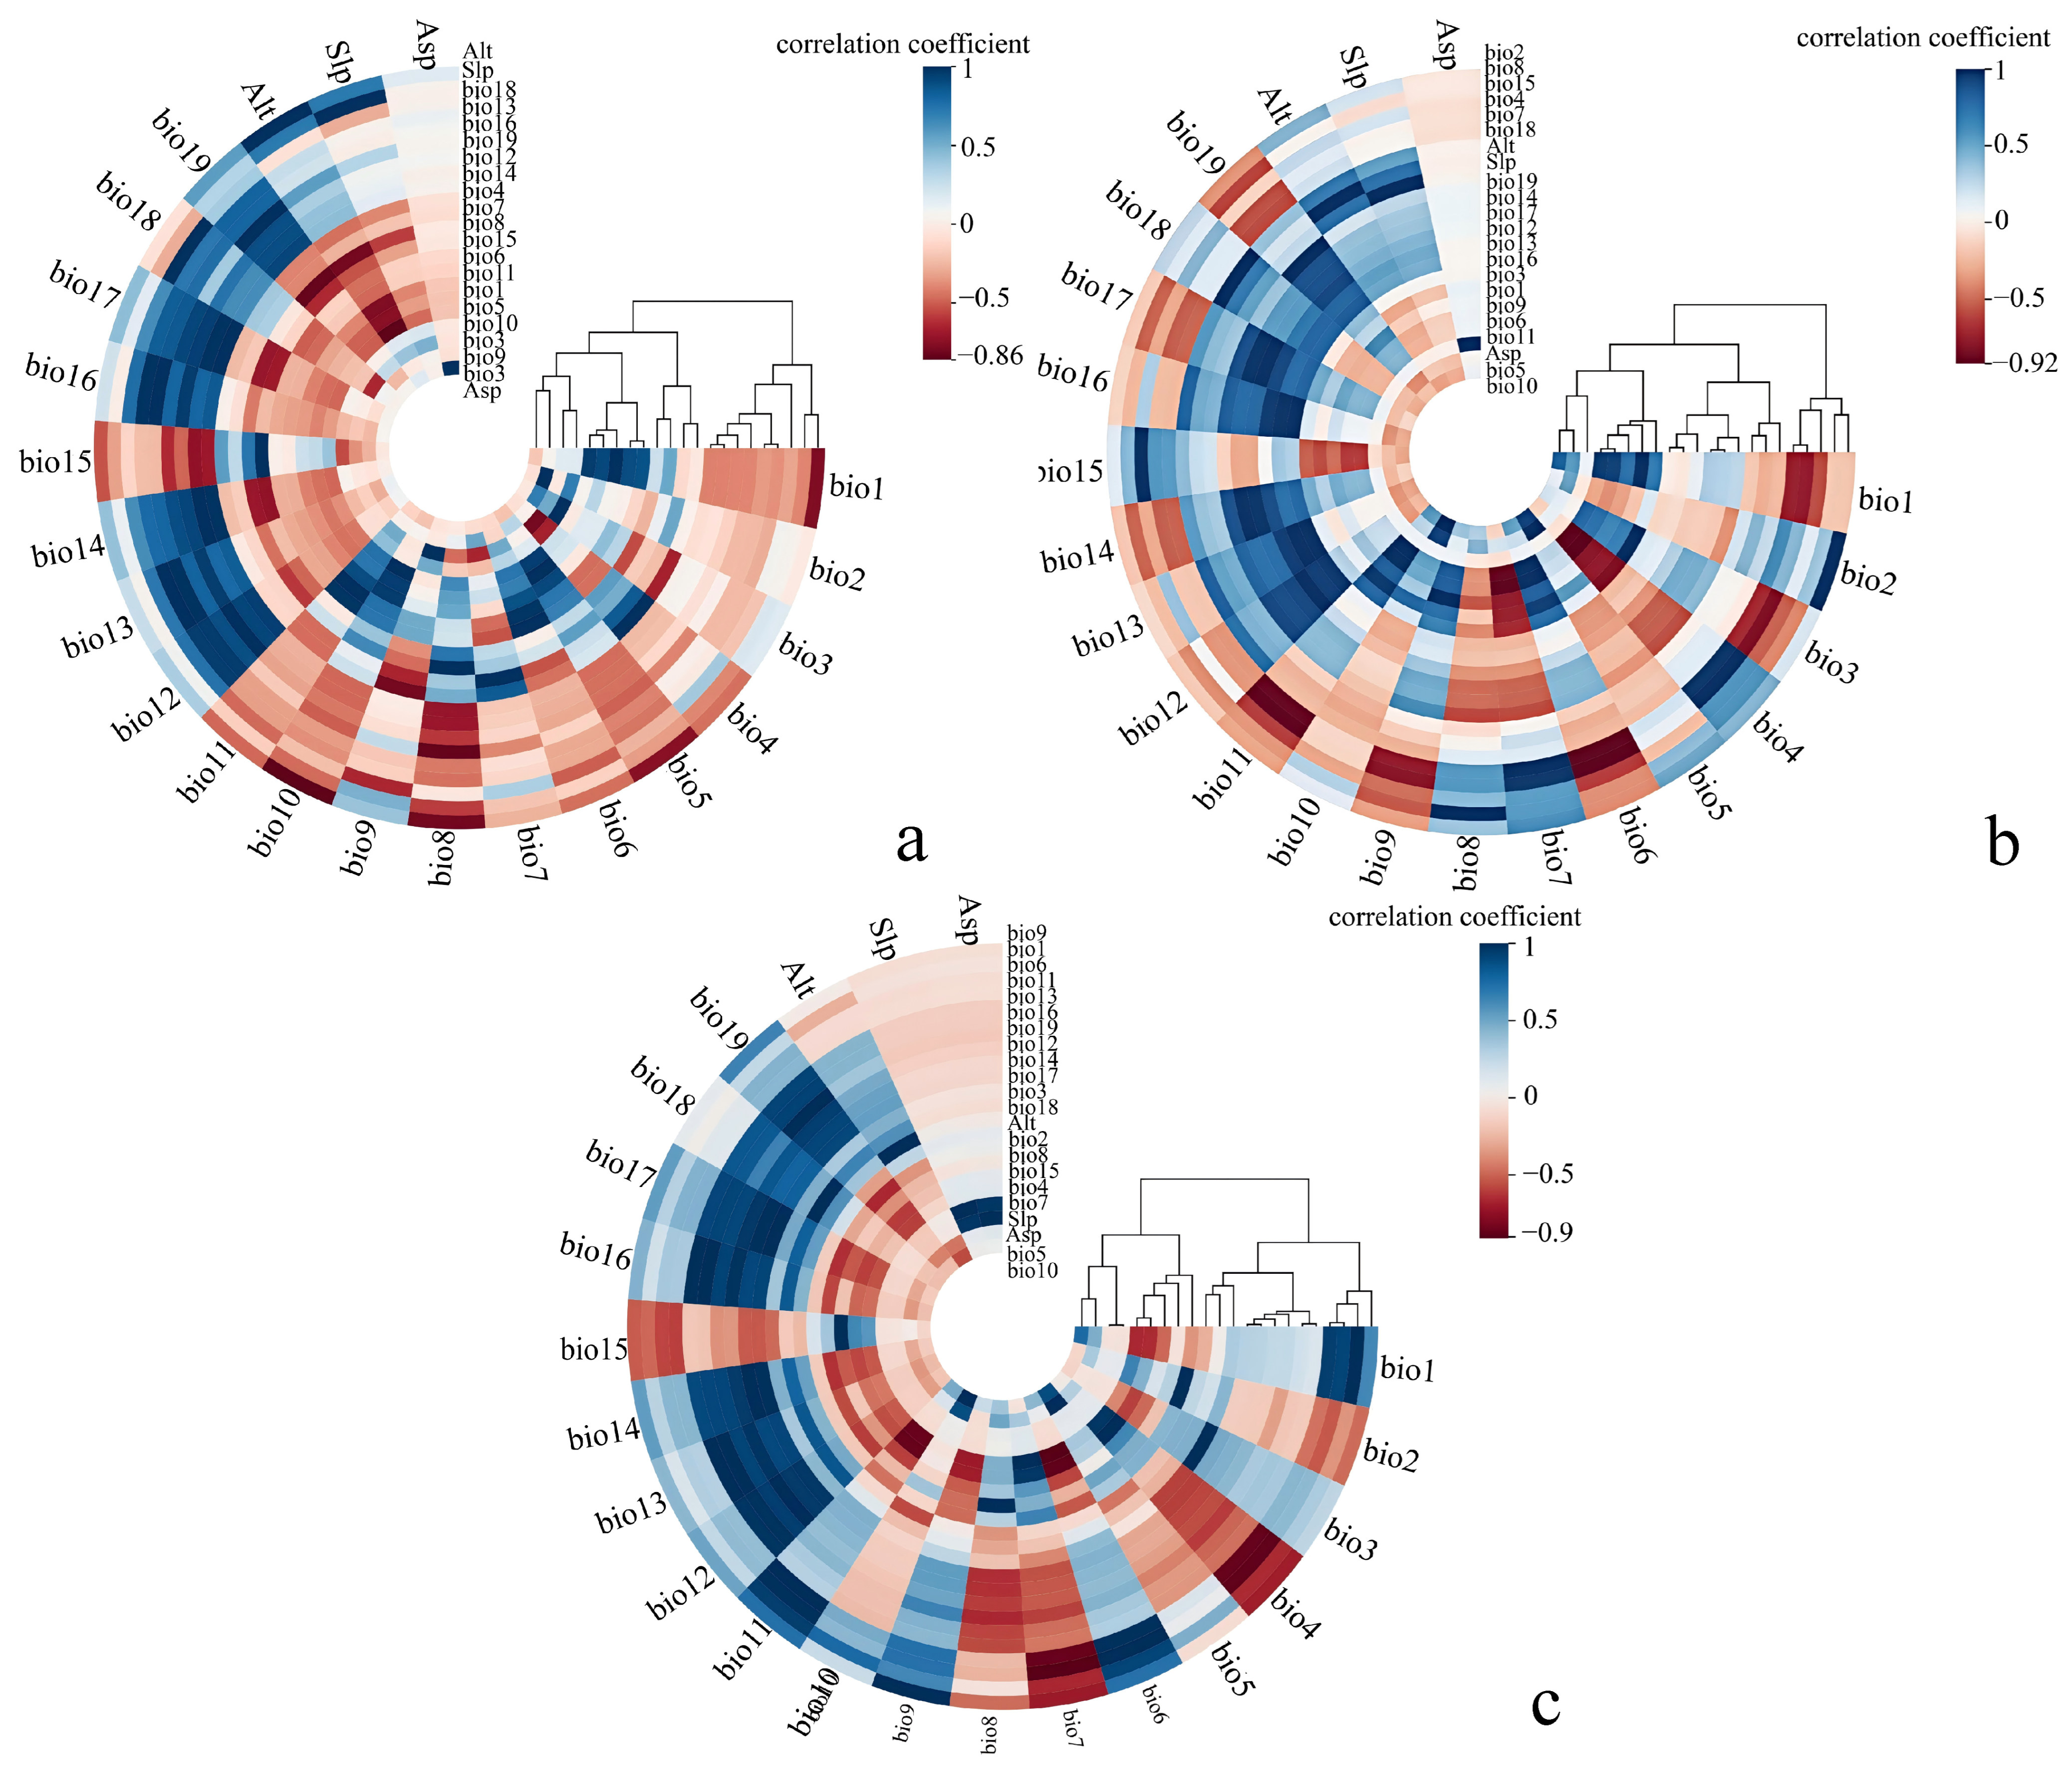
2.2. Collecting and Processing of Environmental Variables

This study downloaded 19 bioclimatic variables for both the current period (1970–2000) and the future period (2081–2100) from the WorldClim v2.1 database (https://www.worldclim.org/ (accessed on 12 June 2024)) (Table 2), at a spatial resolution of 30 arc-seconds (approximately 1 km2). To account for the impact of climate scenarios on model accuracy, we used climate data from six CMIP6 future climate models and applied a multi-model ensemble (MME) approach [31], the six climate models include: CMCC-ESM2 (Italy) [32], EC-Earth3-Veg (Europe) [33], INM-CM5-0 (Russia) [34], MPI-ESM1-2-HR (Germany) [35], MIROC6 (Japan) [36]), and MRI-ESM2-0 (Japan) [37], each model includes four different Shared Socioeconomic Pathways (SSPs): SSP1-2.6 (abbreviated as SSP126), SSP2-4.5 (SSP245), SSP3-7.0 (SSP370), and SSP5-8.5 (SSP585) (Table 3). Additionally, three topographic variables—elevation (Alt), slope (Slp), and aspect (Asp)—were extracted from DEM data with a spatial resolution of 1 km. All predictor variable layers were rasterized to match the boundaries, cell size, and coordinate system of the occurrence data layers. Finally, these layers were converted to ASCII format files for further processing in MaxEnt.
To avoid the negative impact of high spatial multicollinearity among climate variables on model performance, we conducted Pearson correlation tests on the environmental data extracted for each species using SPSS software (v2.7, IBM, Armonk, NY, USA). Correlation coefficients were obtained to identify and filter out variables with high multicollinearity, which could lead to increased model complexity and overfitting [38]. Additionally, we applied a jackknife test to further analyze the contribution and importance of environmental variables to the distribution of each species. Bioclimatic variables with low percentage contributions were removed, and for any pair of variables with a Pearson correlation coefficient |r| ≥ 0.8, the variable with the higher percentage contribution was retained [39]. Based on the percentage contribution and correlation of each variable, a final set of environmental variables was selected for each species.

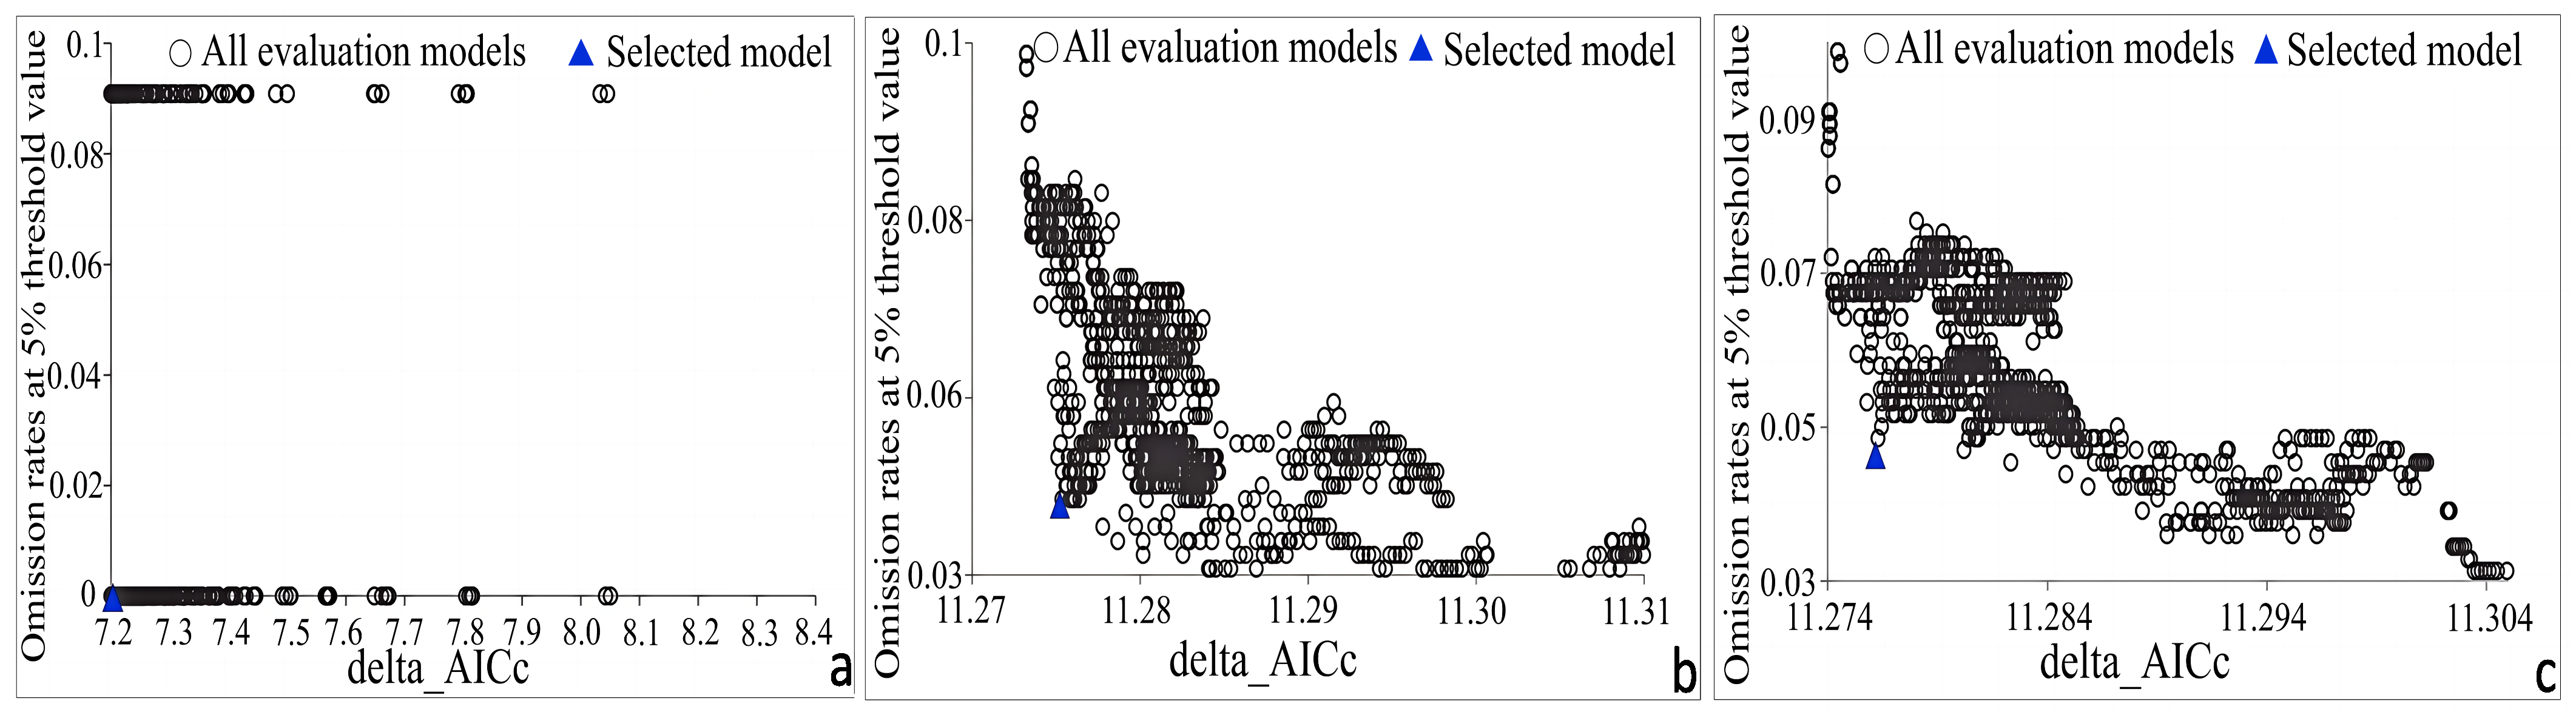
2.3. Model Evaluation

MaxEnt (V3.4.4, California Academy of Sciences and Harvard University, San Francisco, CA, USA) was used to build and analyze suitability models for H. abietinum, H. annosum s.str., and H. parviporum under climate change scenarios. The filtered species occurrence points and corresponding environmental variables were input into the model. A random selection of 75% of the occurrence points was used as the training set, while the remaining 25% served as the test set. The options ‘Create Response Curves’ and ‘Jackknife Test’ were selected. To minimize model error, a 10-fold bootstrap replication was performed, and the final model results were averaged across the ten runs. The output format was set to ASCII.
The AUC (Area Under the Curve) represents the area under the ROC (Receiver Operating Characteristic) curve and is a widely used metric for evaluating the accuracy of classification models. Unlike other evaluation metrics, AUC provides an objective measure without being affected by class imbalance (the proportion of samples) in the dataset. In species distribution modeling (SDM) studies, AUC is commonly used to assess model performance, as it is independent of threshold settings. The effectiveness of different models in predicting species distributions is evaluated by comparing their AUC values [40]. A higher AUC value indicates a stronger correlation between the model and the environmental factors associated with the species’ geographic distribution, reflecting better predictive performance. According to the study results, prediction accuracy is generally classified into five levels: excellent [0.9–1], good [0.8–0.9), fair [0.7–0.8), poor [0.6–0.7), and unacceptable [0.5–0.6).
In the MaxEnt model, complexity is closely related to the feature combination (FC) and the regularization multiplier (RM). The FC corresponds to different environmental variables, enabling MaxEnt to utilize complex mathematical relationships to infer species responses to environmental factors through mathematical transformations. RM is an additional constraint applied to the feature parameters, allowing for optimization of the model’s simulation of response curves by adjusting the multiplier value. By using the ENMeval package, we adjusted these parameters to analyze model complexity under different conditions and selected the optimal parameter settings with the lowest complexity [41]. During this process, we employed the Akaike Information Criterion corrected for small sample sizes (AICc) to evaluate various FCs and RMs, aiming to determine the model with the best predictive performance. Generally, a lower AICc value indicates a model with higher predictive accuracy.

2.4. Changes of Suitable Habitat Area and Centroids

The final predicted results obtained from the MaxEnt model were imported into ArcGIS software (v10.8), where the reclassification tool was used to categorize the potentially suitable areas for Heterobasidion species into four classes: highly suitable, moderately suitable, low suitability, and unsuitable areas. The area of each region was also calculated. To further investigate the habitat changes of Heterobasidion species under current and future climate scenarios, we utilized the SDMtoolbox v2.4 in the ArcGIS toolbox to calculate and analyze the changes in suitable area and centroid shifts from the present to 2100 [42]. The calculation of the centroid was typically performed using a weighted average method, and the computed centroid points were connected in chronological order to form the centroid migration path. Additionally, we mapped and analyzed the geographic distribution patterns and centroid migration paths of Heterobasidion species under current and various future climate scenarios.

3. Results

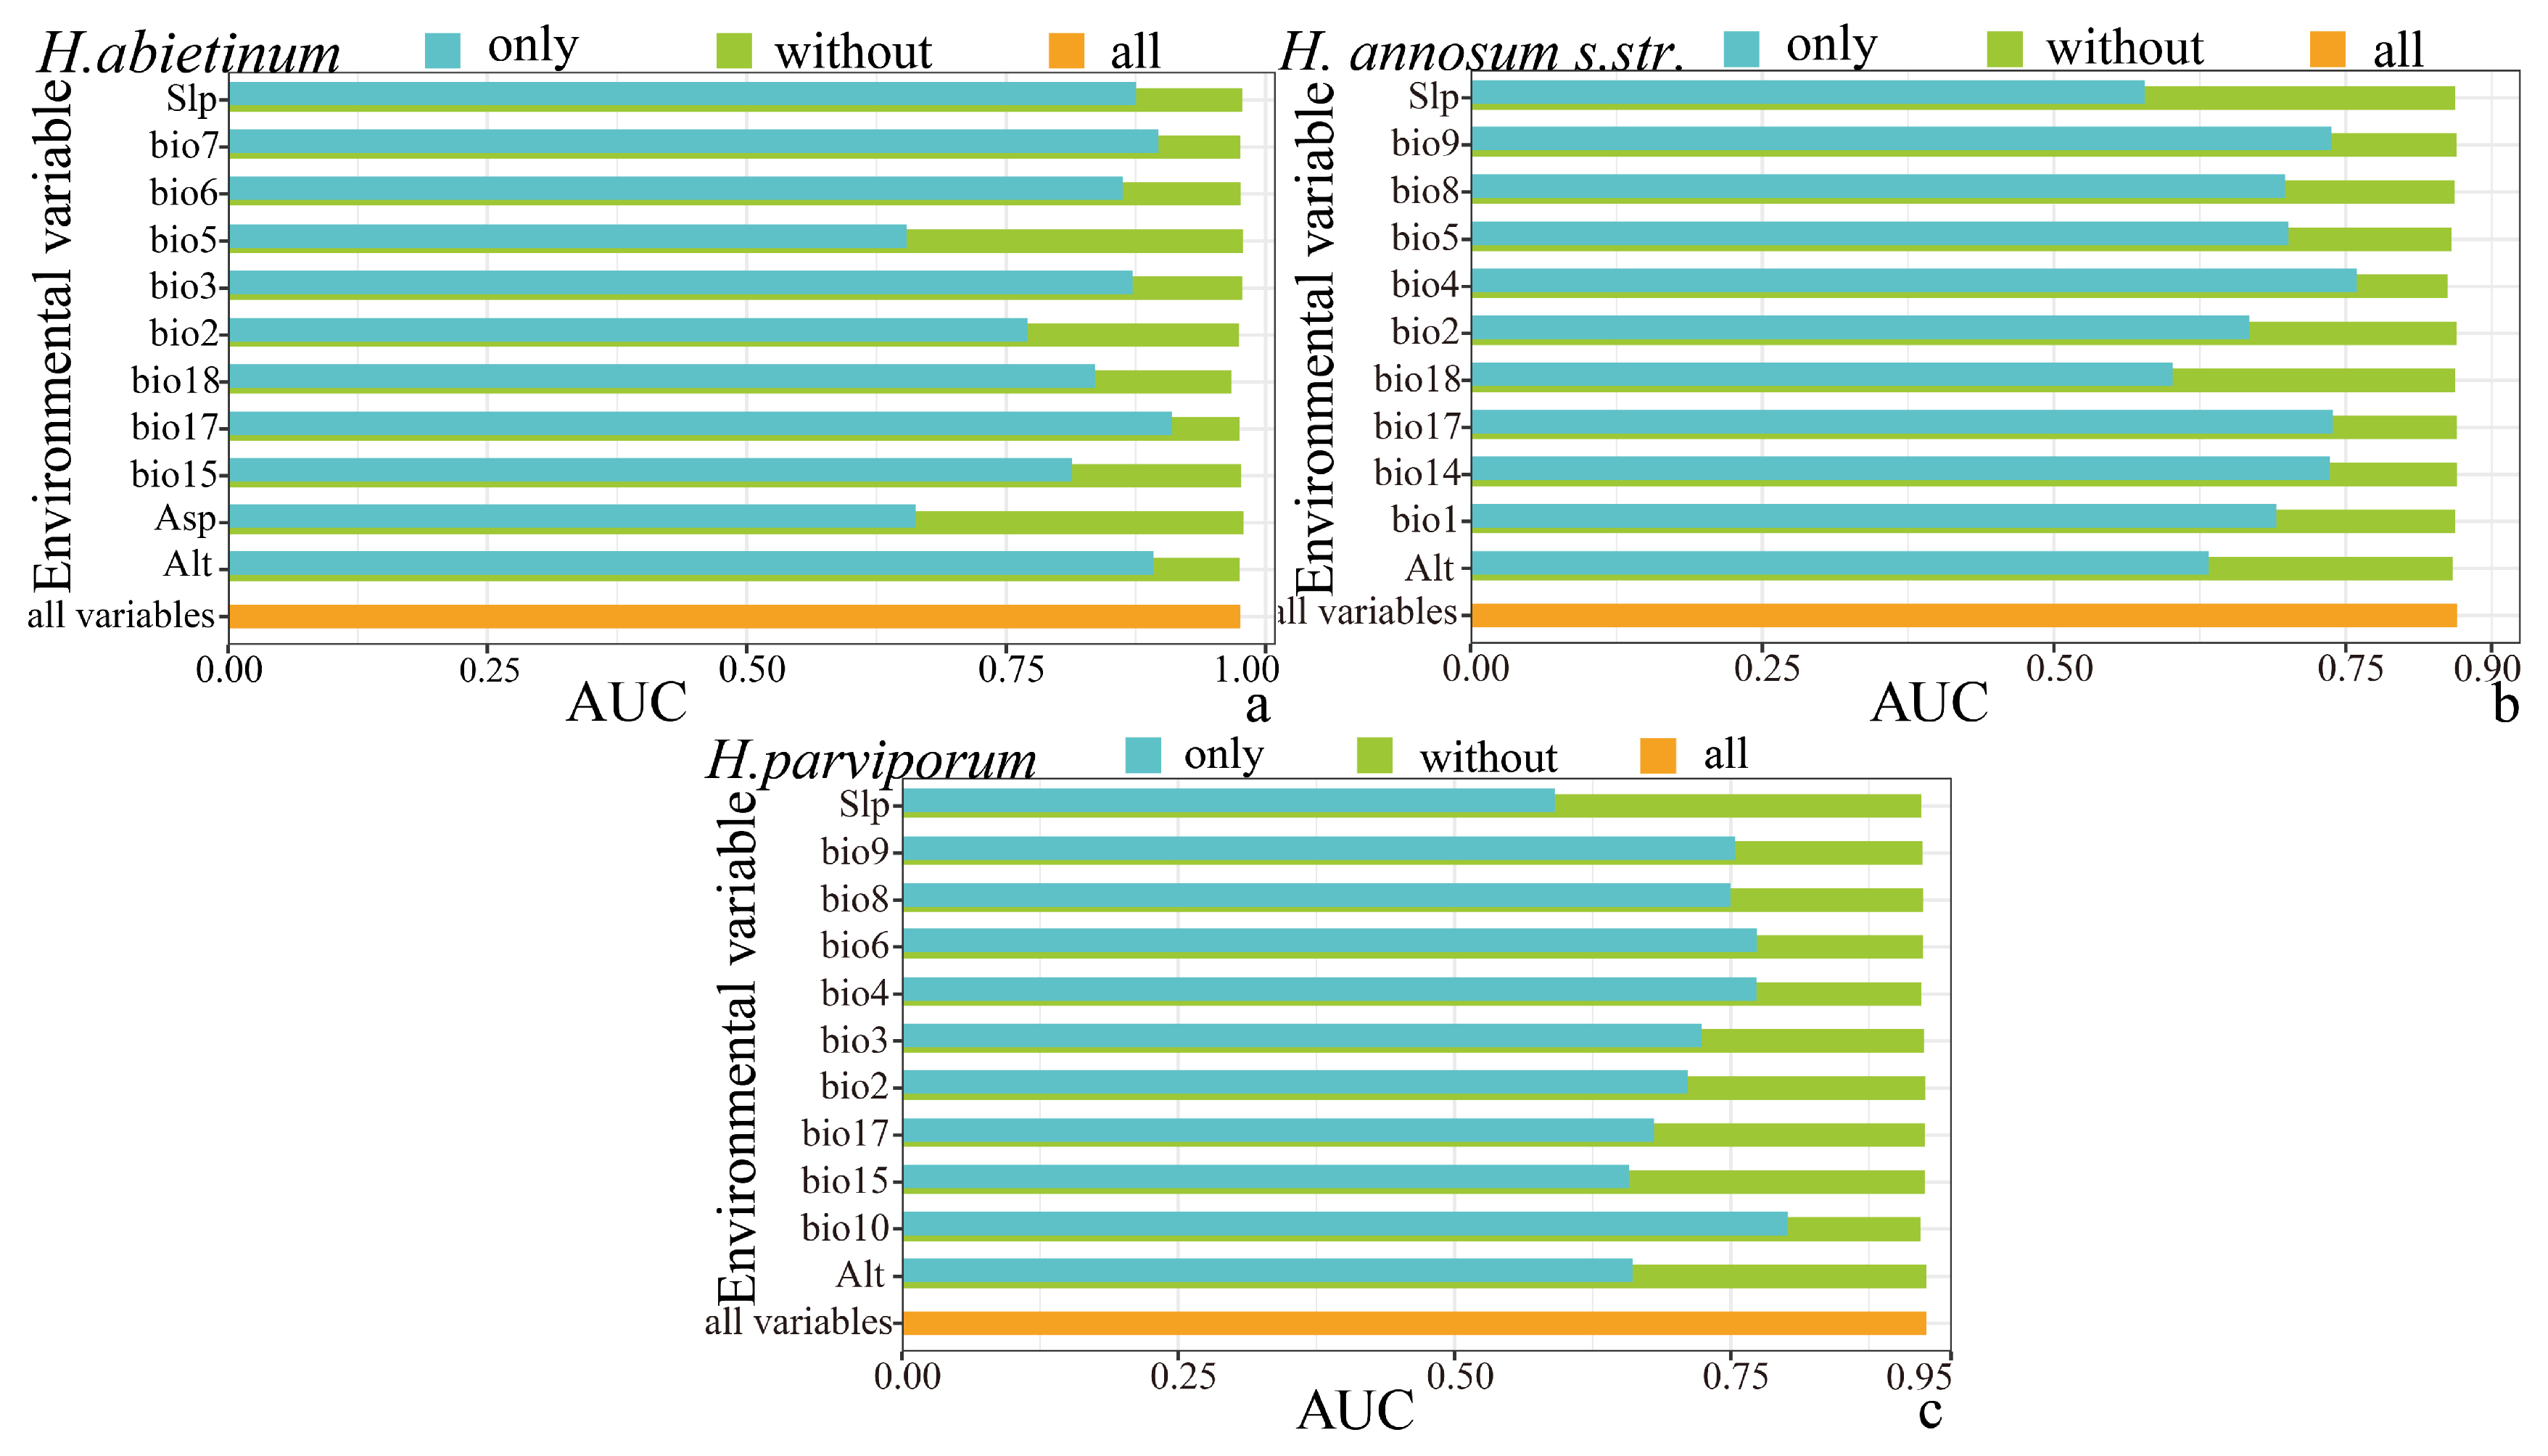
3.1. Model Variables and Performance Evaluation

Based on the Akaike Information Criterion (AIC), the optimal parameters for H. abietinum in the MaxEnt model were RM = 0.8 and FC = L, Q, and P, which resulted in the lowest AIC value. Under these parameters, AICc was 0, the omission rate was 0, and the optimized MaxEnt model produced an AUC value as high as 0.994. For H. annosum s.str., the optimal parameters were RM = 0.3 and FC = L, P, and H, yielding the lowest AIC value. Under these parameters, AICc was 0, the omission rate was 0.049, and the AUC value reached 0.862. The optimal parameters for H. parviporum were RM = 0.4 and FC = L, P, and H, where AICc was 0, the omission rate was 0.049, and the AUC value was 0.951. All the predicted AUC values exceeded 0.8, indicating that the MaxEnt model provides accurate predictions of the potential geographic distribution of the three Heterobasidion species in Europe (Figure 2).

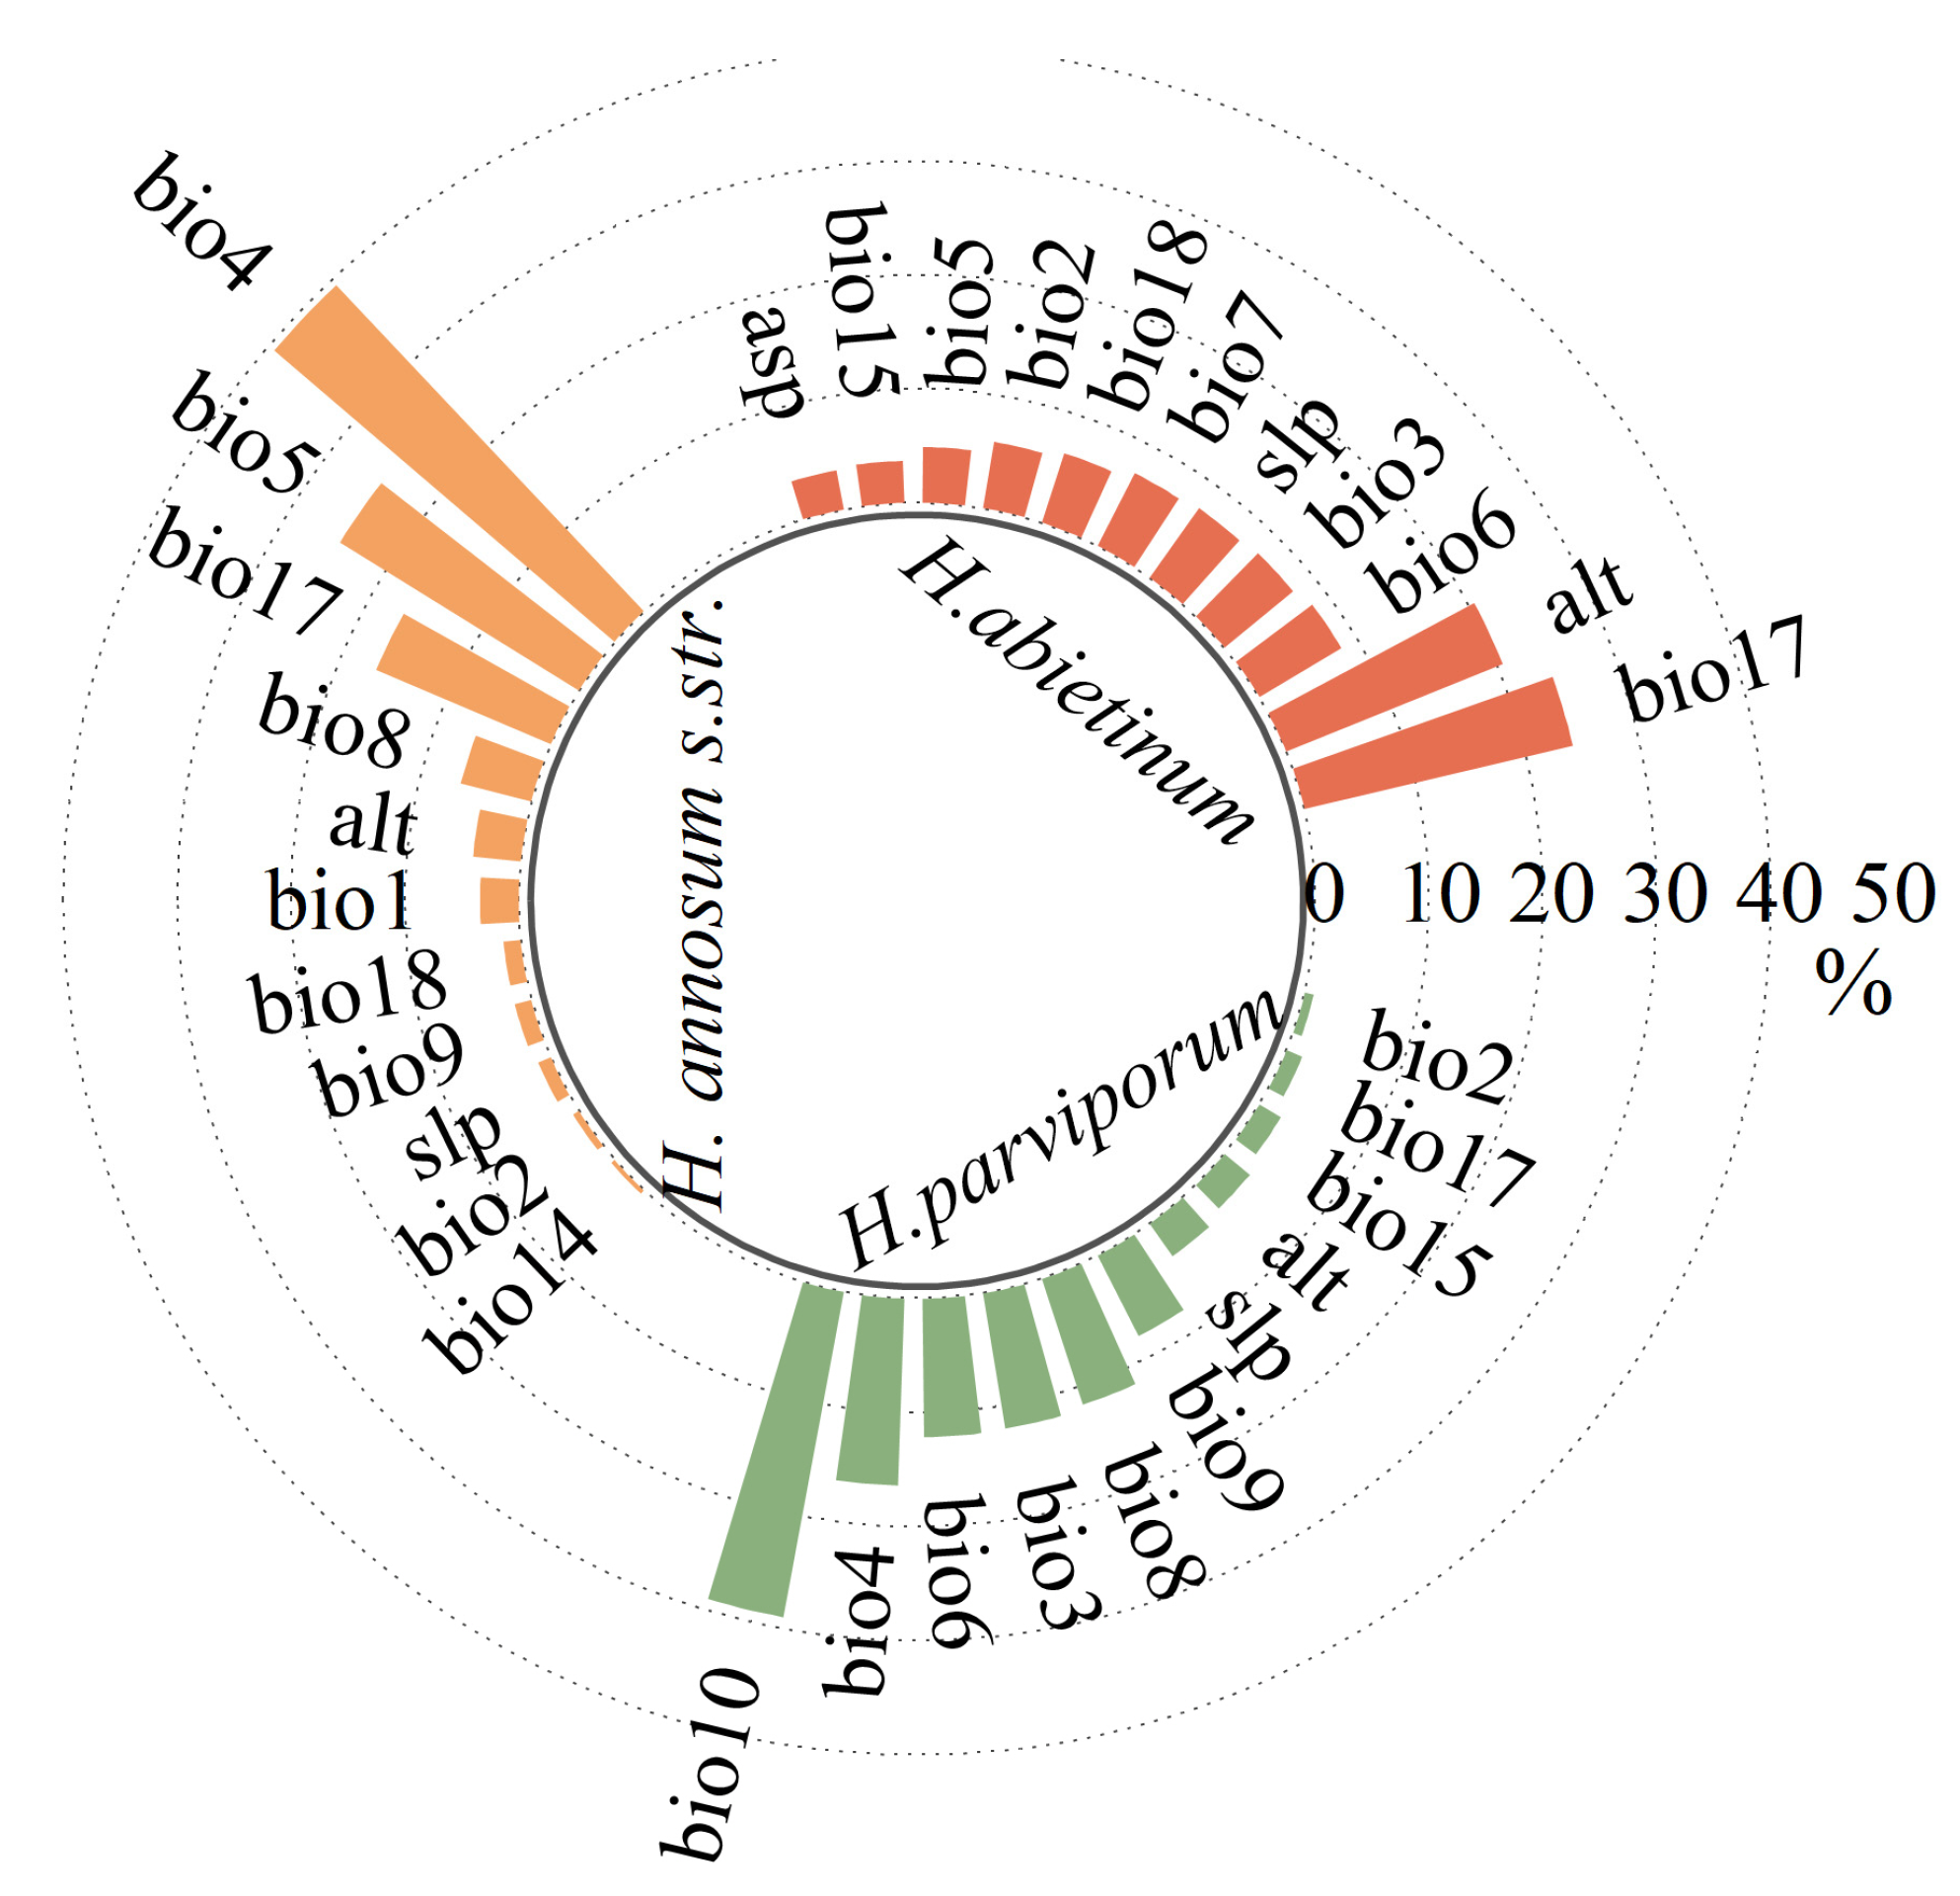
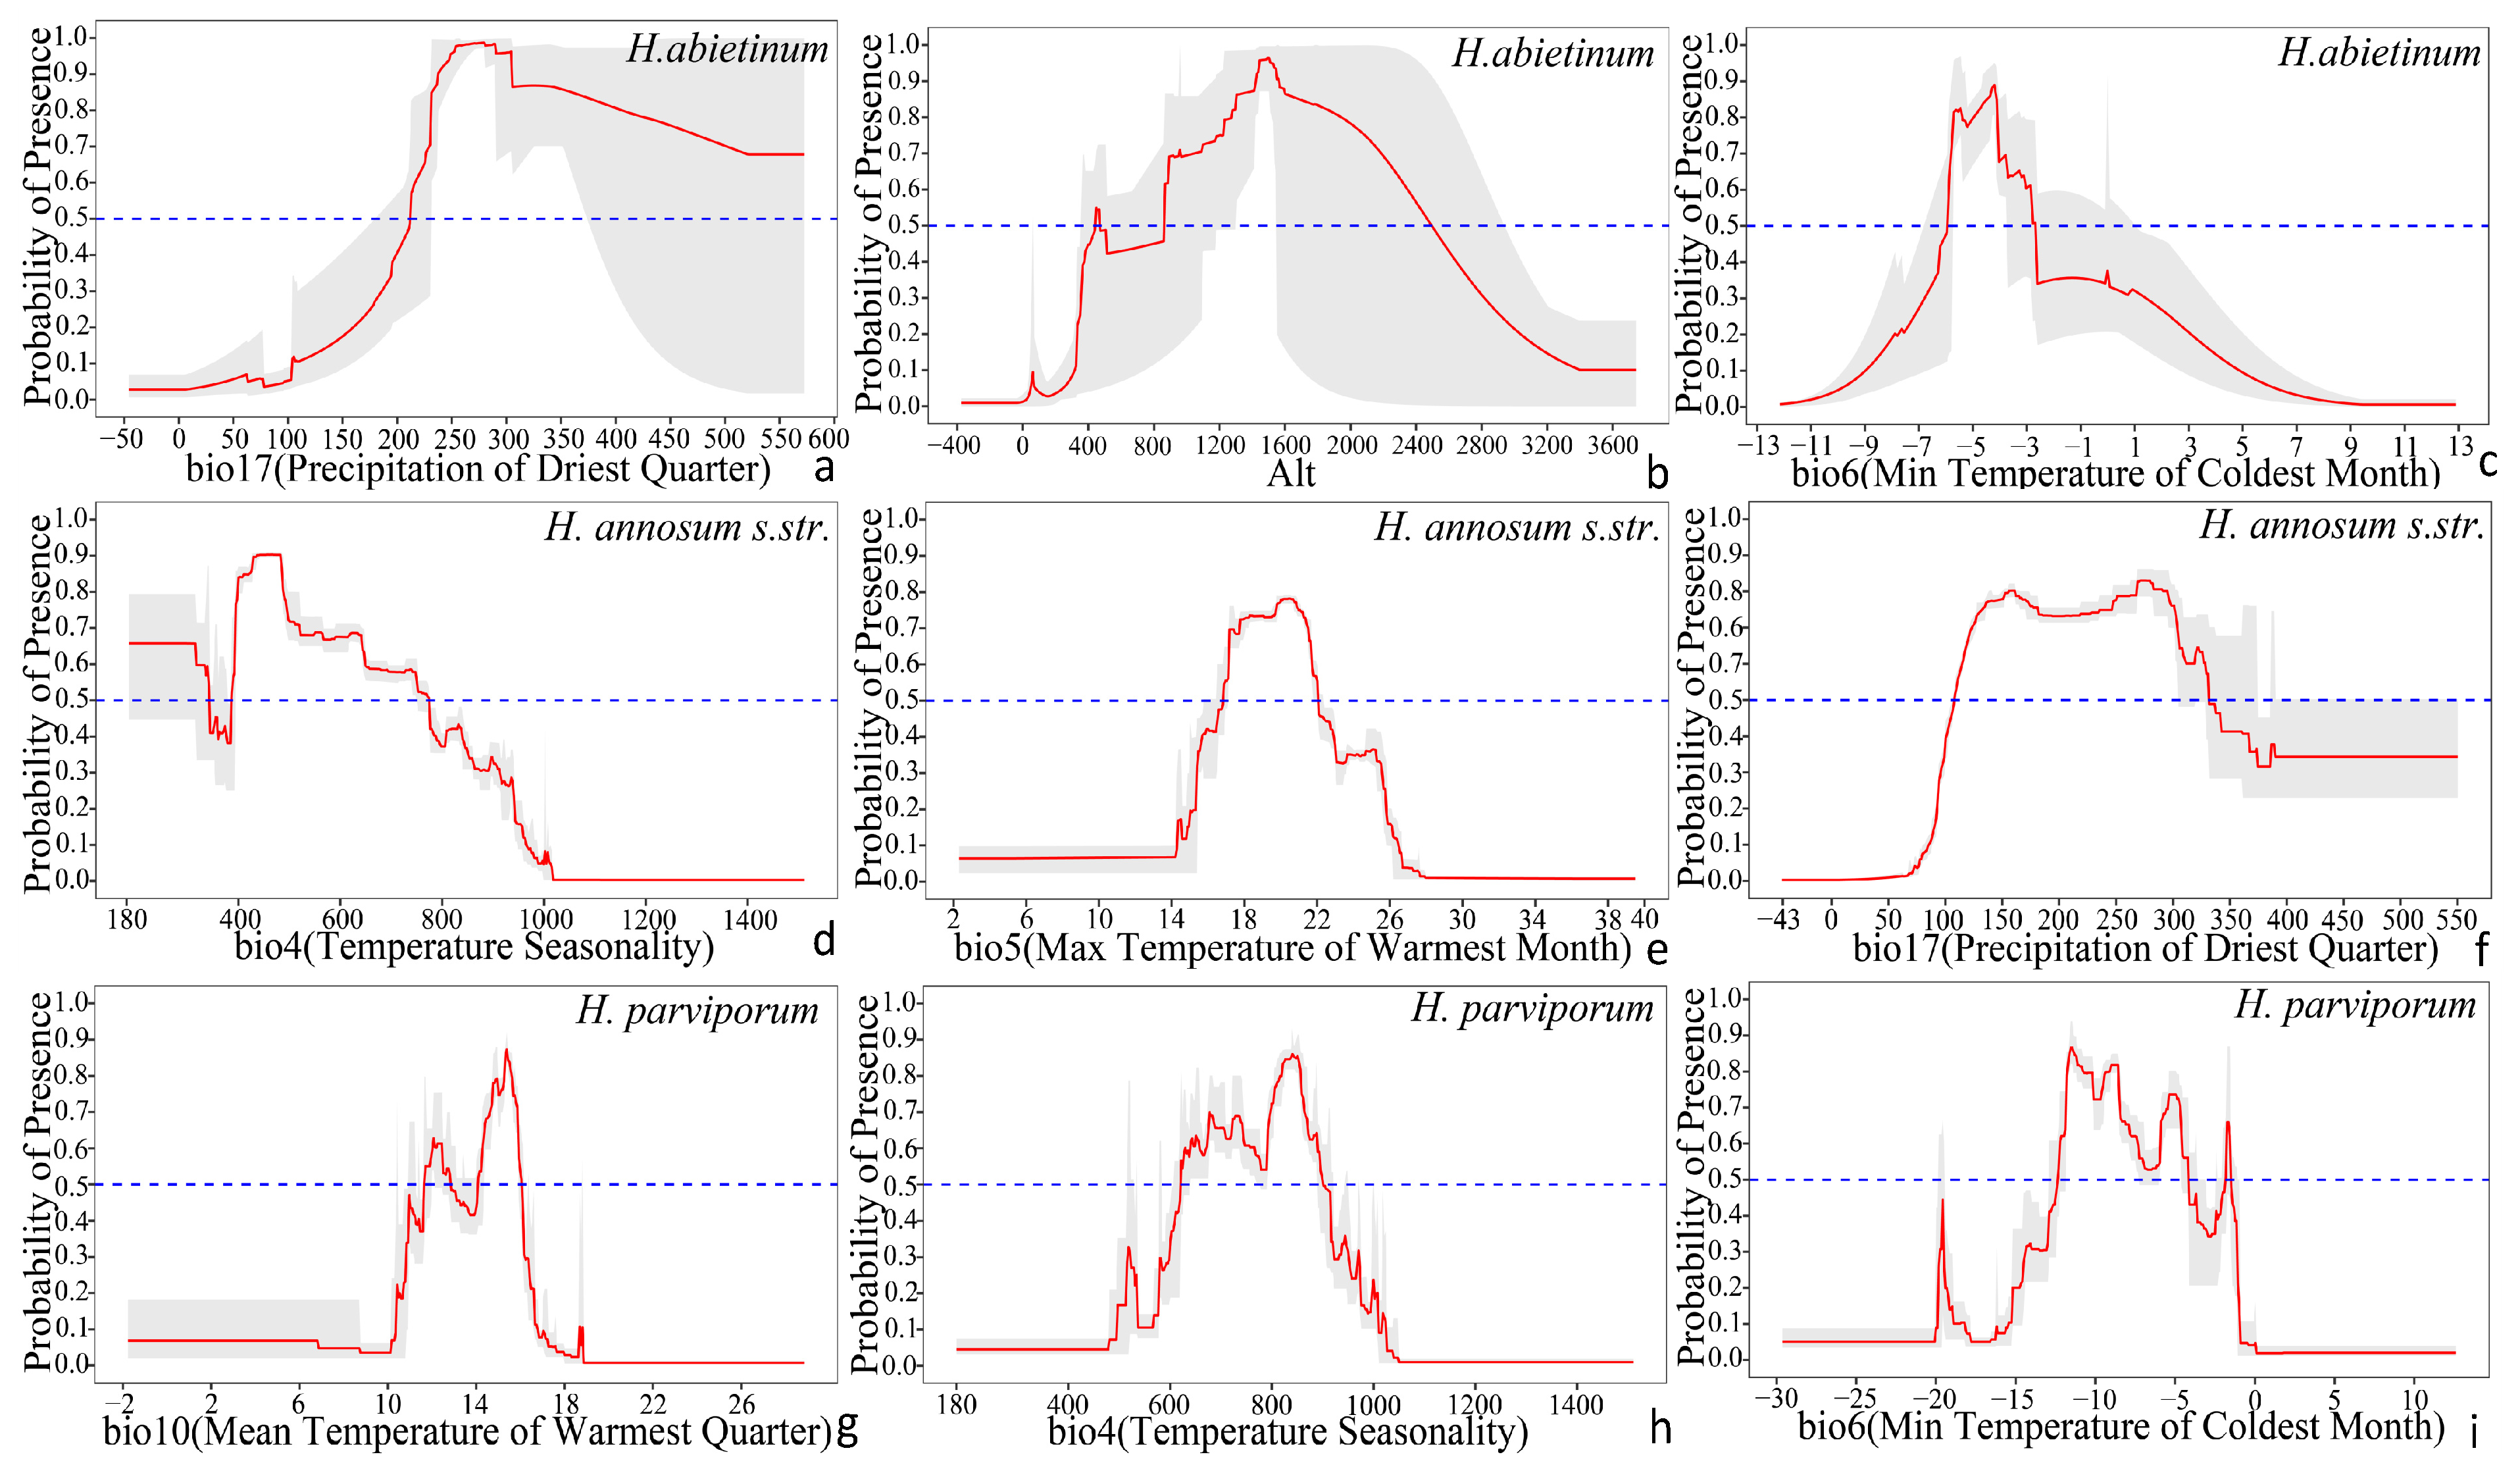
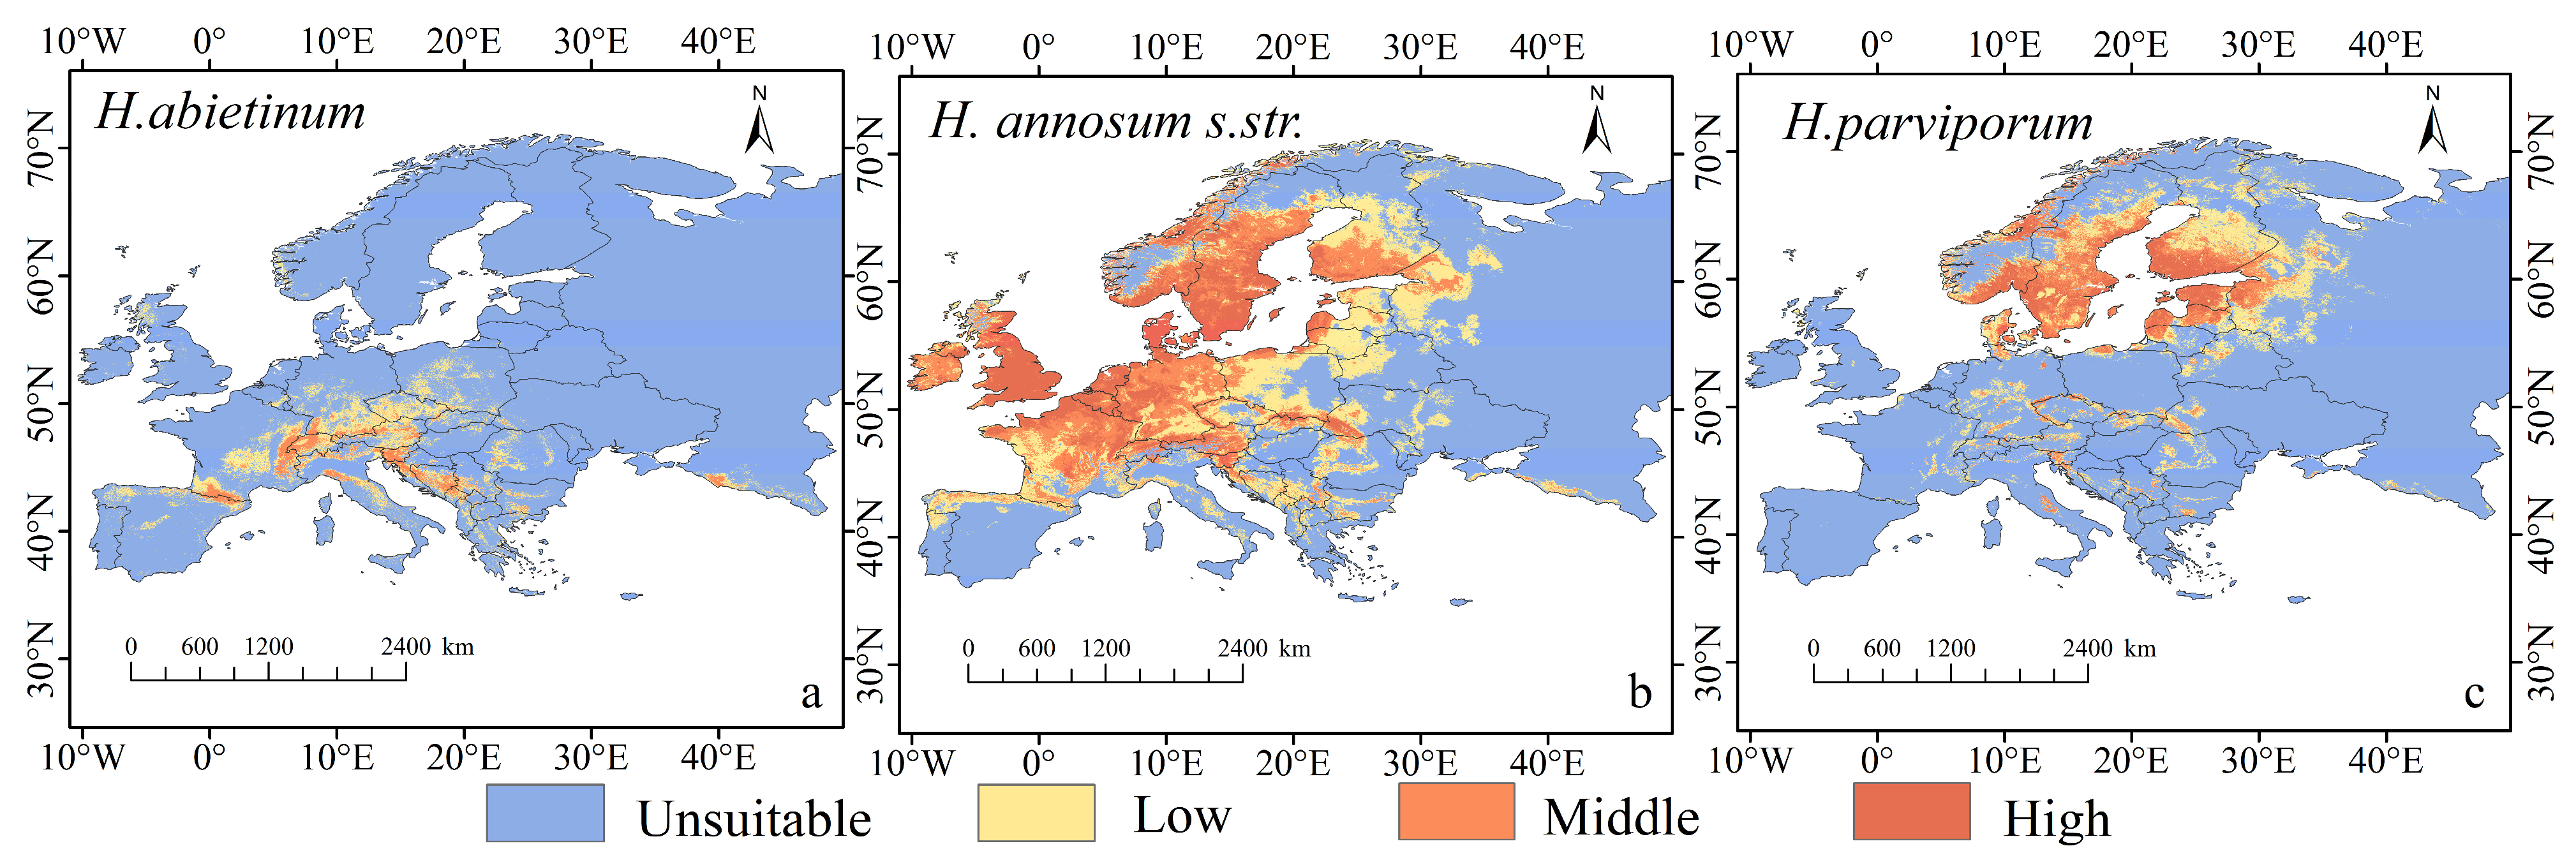
3.2. Current Distribution and Dominant Environmental Variables

Based on the percentage contribution and correlation of each variable, a total of 11 environmental variables were eventually selected for each species. For H. abietinum, the top three contributing environmental factors were precipitation of the driest season (bio17) (24.2%), Alt (20.5%), and minimum temperature of the coldest month (bio6) (8.4%), with a combined contribution of 53.1%. For H. annosum s.str., the top three factors were temperature seasonality (bio4) (39.4%), maximum temperature of the warmest month (bio5) (24.7%), and precipitation of driest quarter (bio17) (16.7%), which together accounted 80.8% of the contribution. For H. parviporum, the leading factors were mean temperature of the warmest quarter (bio10) (29%), temperature seasonality (bio4) (16.4%), and minimum temperature of the coldest month (bio6) (12.1%), with a combined contribution of 57.5% (Figure 3 and Figure 4).
The jackknife test analyzed the influence of environmental factors on the three Heterobasidion species. The results showed that when precipitation of the driest season (bio17) was used independently for H. abietinum, the MaxEnt model achieved an AUC value of 0.9096, higher than any other single environmental factor, which further confirms that precipitation of the driest season (bio17) is the most important environmental factor for H. abietinum. Similarly, when bio4 was used independently for H. annosum s.str., the MaxEnt model produced an AUC value of 0.7595, surpassing all other factors, indicating that temperature seasonality (bio4) is the key environmental factor for H. annosum s.str.. Likewise, mean temperature of the warmest quarter (bio10) was identified as the most important environmental factor for H. parviporum (Figure 5).
Based on the environmental variable responses of the three Heterobasidion species, a suitable growth probability threshold was set at 0.5. When the growth suitability probability exceeds 0.5, the growth conditions for the species are considered optimal. For H. abietinum, the most suitable growth conditions are when the precipitation of the driest quarter (bio17) ranges from 212.8 mm to 572.5 mm, altitude (Alt) from 448.3 m to 2490.4 m, and the minimum temperature of the coldest month (bio6) is between −5.9 °C and −2.7 °C. For H. annosum s.str., optimal growth conditions are when temperature seasonality (bio4) is between 185.3 and 774.1, the maximum temperature of the warmest month (bio5) ranges from 16.9 °C to 22.0 °C, and precipitation of the driest quarter (bio17) is between 108.6 mm and 330.7 mm. For H. parviporum, the ideal conditions are when the mean temperature of the warmest quarter (bio10) is between 11.6 °C and 16.0 °C, temperature seasonality (bio4) ranges from 622.0 mm to 898.6 mm, and the minimum temperature of the coldest month (bio6) is between −12.3 °C and −1.6 °C (Figure 6).
Using species distribution data and bioclimatic variables from the current period (1970–2000), potential distribution maps of three Heterobasidion species under current climate conditions were generated using the MaxEnt model. These maps were then visualized, and area calculations were performed using ArcGIS software. H. abietinum is primarily distributed in the Mediterranean region, with highly suitable areas covering approximately 7.38 × 10⁴ km2, moderately suitable areas covering around 16.34 × 10⁴ km2, and low suitability areas spanning approximately 70.09 × 10⁴ km2. The main countries where H. abietinum is found include Spain, Germany, Switzerland, Italy, Austria, France, Czechia, Poland, Croatia, and Serbia. H. annosum s.str. is widespread across western, southern, eastern, northern, and central Europe; the highly suitable area for this species covers approximately 115.24 × 10⁴ km2, the moderately suitable area spans around 144.75 × 10⁴ km2, and the low suitability area extends over 199.60 × 10⁴ km2, accounting for 36% of the total area of Europe. The highly suitable areas are mainly located in Ireland, the United Kingdom, France, Belgium, the Netherlands, Germany, Czechia, Norway, Sweden, and Finland. H. parviporum is mainly found in northern Europe, with highly suitable areas covering approximately 46.15 × 10⁴ km2, moderately suitable areas covering around 63.87 × 10⁴ km2, and low suitability areas spanning approximately 117.60 × 10⁴ km2, representing 18% of the total European area. The primary countries of distribution include Norway, Sweden, Finland, Estonia, Latvia, Lithuania, Denmark, and Russia (Figure 7).

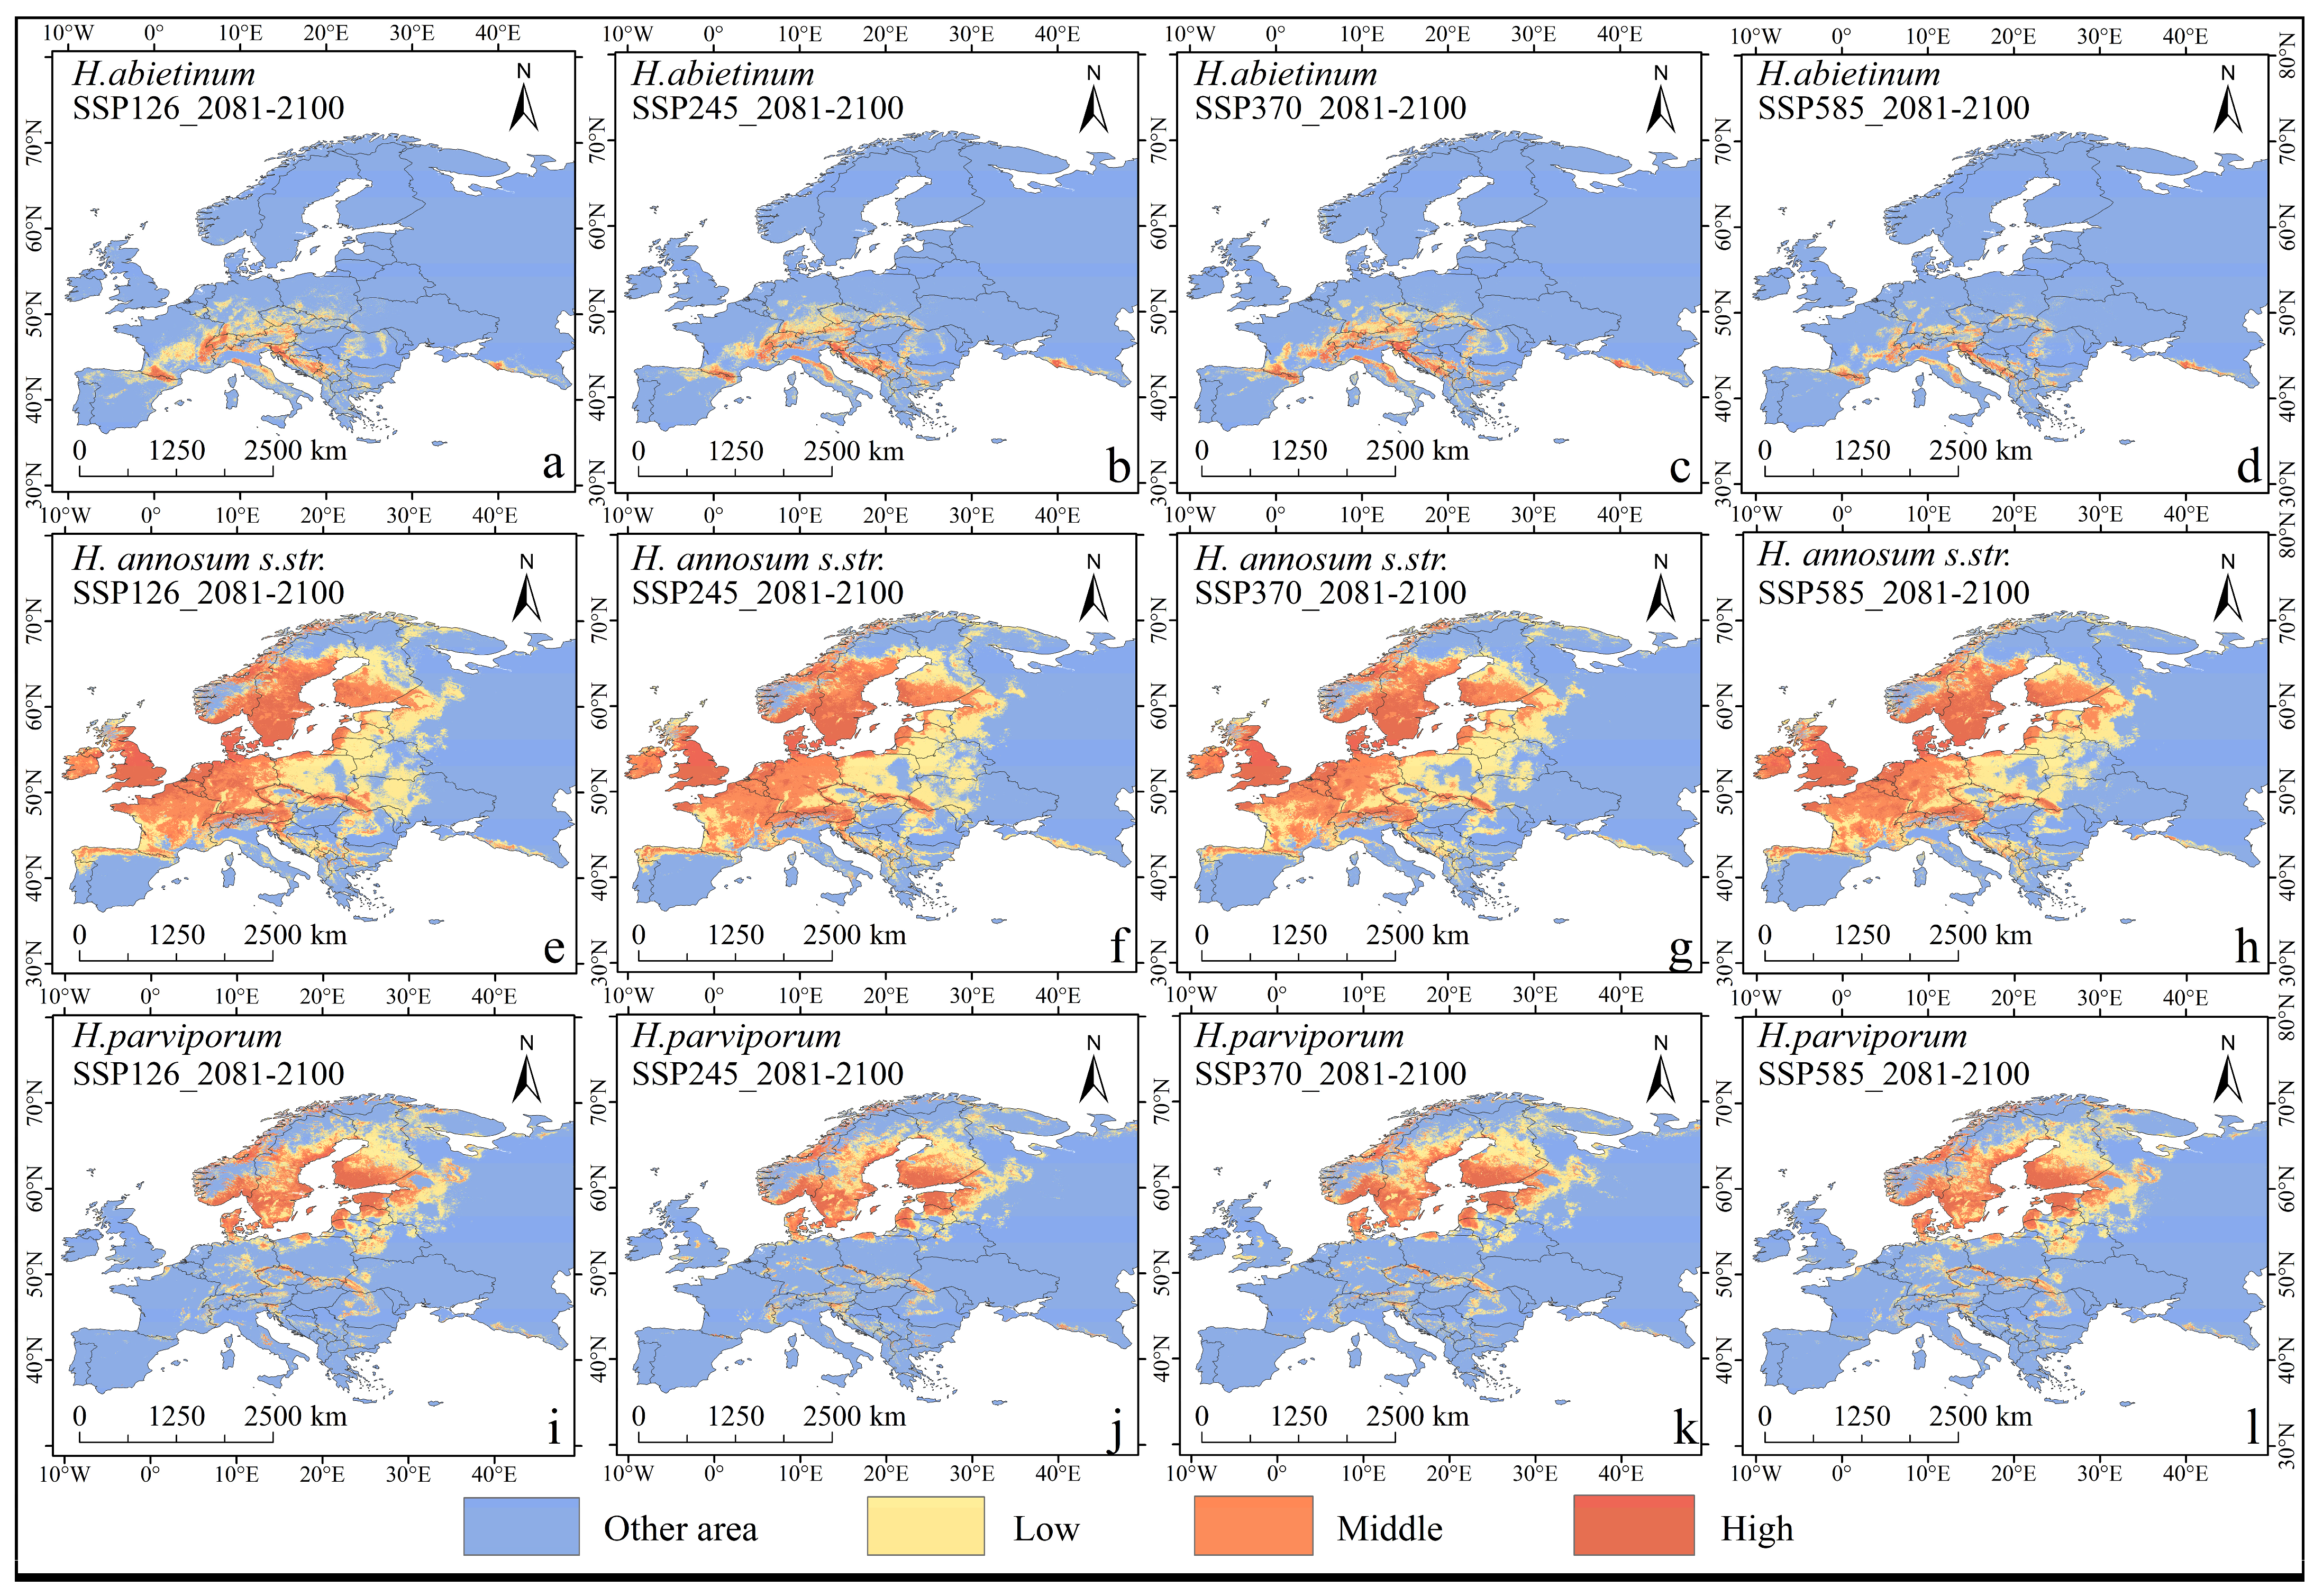
3.3. Distribution Characteristics Under Future Climate Models

This study predicts the potential distributions of three European Heterobasidion species under four different emission scenarios by 2100, focusing on the changes in their distribution range due to future climate change. The potential distributions of the three Heterobasidion species under future climate conditions are similar to their current distribution. H. abietinum is primarily found in the Mediterranean region, H. annosum s.str. is distributed across western, southern, eastern, northern, and central Europe, and H. parviporum is mainly concentrated in northern Europe (Figure 8).
Under the SSP126 climate scenario, the overall potential habitat area shows an increasing trend by 2100. The areas of low and medium suitability are positively correlated with the overall increase, both following an upward trend. However, for high-suitability areas, the potential habitat area of H. abietinum and H. parviporum decreases by 9% and 3%, respectively, while the potential habitat area of H. annosum s.str. increases by 2%.
Under the SSP245 climate scenario, by 2100, the overall potential habitat area of H. abietinum shows a declining trend, with the low-suitability area decreasing by 16%, consistent with the overall decline. In contrast, the medium- and high-suitability areas increase by 23% and 1%, respectively. The potential habitat areas of H. annosum s.str. and H. parviporum show an overall increasing trend. Both species experience growth in their low- and medium-suitability areas while their high-suitability areas decline. Specifically, for H. annosum s.str., the low-suitability area increases by 5%, and the medium-suitability area by 11%, while the high-suitability area decreases by 7%. For H. parviporum, the low-suitability area rises by 12% and the medium-suitability area by 2%, but the high-suitability area decreases by 10%.
Under the SSP370 climate scenario, by the year 2100, the potential suitable habitat areas for H. abietinum and H. annosum s.str. show an overall increasing trend. For H. abietinum, the medium-suitability area increases by 39%, and the high-suitability area rises by 65%, while the low-suitability area decreases by 15%. For H. annosum s.str., the low- and medium-suitability areas decrease by 5% and 2%, respectively, while the high-suitability area drops by 8%. H. parviporum experiences a 12% reduction in its high-suitability area, but its low- and medium-suitability areas increase by 2% and 1%, respectively.
Under the SSP585 climate scenario, by the year 2100, the potential suitable habitat areas for H. abietinum, H. annosum s.str., and H. parviporum all show a decreasing trend (Table 4).

3.4. Changes in Spatial Pattern and Centroid

From 2081 to 2100, under the four climate scenarios, the potential geographic distribution of H. abietinum exhibits a fragmented pattern compared to the current climate conditions. Its suitable habitat is primarily concentrated in high-altitude areas. In various emission scenarios, countries such as France, Czechia, Germany, and Spain show a trend of contraction, while regions in northern Spain, southern France, southern and central Germany, and Slovakia exhibit an expansion trend in suitable areas. Additionally, under the influence of climate change, the centroid of H. abietinum has shifted. Currently, the centroid of H. abietinum is located in northern Italy (32.3° N, 110.2° E), and under the four climate scenarios, it is projected to move towards the southeastern region at lower latitudes. The potential geographic distributions of H. annosum s.str. and H. parviporum exhibit partial overlap, characterized by marginal expansion and contraction. H. annosum s.str.’s suitable habitat is primarily concentrated in high-altitude regions. Under different emission scenarios, areas such as western Ukraine, central Finland, central Italy, and eastern Russia show a contraction in suitable habitat, while regions like Poland, Belarus, and Ukraine exhibit concentrated expansion. Currently, the centroid of H. annosum s.str. is located in northeastern Germany (13.4° N, 53.6° E), and under all four climate scenarios, it is projected to shift northward. H. parviporum’s suitable habitat is primarily concentrated in low-altitude regions. Under different scenarios, areas such as eastern France, central Germany, and northern Belarus show a contraction in suitable habitat, while regions like northern Finland, northern Sweden, and Lithuania exhibit an expansion. Under current climate conditions, the centroid of H. parviporum is located in eastern Sweden (19.4° N, 57.5° E), and under all four scenarios, it is projected to shift northward (Figure 9 and Figure 10).

4. Discussion

4.1. The Impact of Environmental Factors on Distribution

In this study, the MaxEnt model combined with the CMIP6 multi-model ensemble (MME) was used to predict the habitat suitability of three Heterobasidion species that are destructive to European forests. Based on collected species occurrence data and environmental data, we utilized the ENMeval package to optimize the MaxEnt model, improving the accuracy of the model predictions. Previous studies have shown that changes in temperature and precipitation significantly impact the survival, reproduction, spread, and geographic distribution of pathogens by altering their disturbance patterns; these effects are primarily realized through two mechanisms: first, by directly regulating the growth and development processes of the pathogens, and second, by modulating the physiological defense mechanisms of host trees [7]. Pathogen growth and development are most vigorous under optimal temperature and precipitation conditions. However, when temperatures are either too high or too low, the growth and spore production of the pathogens are significantly reduced [43,44,45,46]. This study analyzes the suitable habitats and environmental factors for Heterobasidion species, revealing that H. abietinum thrives in moist and warm regions, primarily influenced by precipitation. Milici et al. demonstrated that changes in precipitation can alter the biological mechanisms of plant pathogens [47], thus emphasizing the critical role of precipitation in the survival and distribution of H. abietinum. In contrast, H. annosum s.str. and H. parviporum exhibit similar habitat preferences, favoring environments with significant seasonal temperature variation that are relatively dry yet maintain some moisture. Both species are mainly affected by temperature fluctuations. Munier et al. asserted that temperature was a crucial determinant of the reproduction, development, migration, and spread of plant pathogens [48], further highlighting the significant impact of temperature changes on H. annosum s.str. and H. parviporum. Notably, both H. annosum s.str. and H. parviporum are unsuitable for extremely high or low temperatures, likely due to the inhibition of enzyme activity at elevated temperatures, which leads to reduced growth or cessation, while low temperatures slow down metabolic processes, consequently decreasing growth rates.

4.2. Changes in Spatial Pattern and Centroid

The geographic distribution of most forest pathogens is generally more restricted than that of their host plants. However, they exhibit a high degree of mobility and can rapidly adjust their distribution in response to favorable changes in climate conditions [49]. Against the backdrop of climate change, the three European Heterobasidion species have already shown adaptive responses. General Circulation Models (GCMs) predict that much of the Mediterranean region will experience a reduction in precipitation in the future [50]. The suitable habitat of H. abietinum is primarily concentrated in the Mediterranean region. It is projected that between 2080 and 2100, under both SSP126 and SSP585 climate scenarios, the area of highly suitable habitat will decrease. This decline is attributed to significant reductions in precipitation and the unfavorable drought conditions expected under these scenarios, which are not conducive to its survival. In contrast, under the SSP245 and SSP370 scenarios, the suitable habitat area for H. abietinum may expand. This could be due to climate changes under these scenarios that still maintain sufficiently favorable conditions, allowing the species to extend its range in certain localized areas. In temperate and boreal forests, rising summer temperatures typically accelerate the development and reproductive potential of pathogens [51,52]. Singh et al. indicate that under future climate change, the number of fungal Phytophthora spp. will increase, leading to widespread mortality of American chestnut [53]. In most climate scenarios, changes in the suitable habitat of H. annosum s.str. and H. parviporum align with previous research on pathogens, with their habitat areas expected to expand by 2081–2100. However, under the SSP585 scenario for H. annosum s.str. and the SSP370 and SSP585 scenarios for H. parviporum, their suitable habitat areas are projected to decrease. This decline may be attributed to the warming levels under SSP585 exceeding the survival thresholds of H. annosum s.str. and H. parviporum. Additionally, the reduction in H. parviporum’s suitable habitat under SSP370 could be due to its lower optimal growth temperature relative to H. annosum s.str., making it more sensitive to rising temperatures and thus more vulnerable to climate warming.
The IPCC Sixth Assessment Report indicates that the most intense extreme high temperatures are projected to occur in the Mediterranean, eastern, and northern regions [54]. The combination of extreme heat and reduced precipitation is expected to increase drought in the Mediterranean, potentially driving the migration of H. abietinum. Under current climate conditions, the centroid of H. abietinum is located in northern Italy (32.3° N, 110.2° E). With future climate change, northern Italy is likely to experience more pronounced drought, while southern regions might be relatively less affected [55], in response to these shifts in precipitation patterns, the centroid of H. abietinum is projected to migrate southeast across all four climate scenarios. On the other hand, the gradual southward shift of H. abietinum may be driven by the increasing summer daytime temperature variability in mid-latitude regions of Europe, which leads to more frequent extreme high temperatures. This increase in temperature accelerates water evaporation, resulting in more frequent droughts [56], in search of more favorable latitudinal zones, H. abietinum is gradually shifting southward. In contrast, H. annosum s.str. and H. parviporum are gradually shifting northward, opposite to the trend observed in H. abietinum. It is estimated that the most intense warming in the future will occur in the mountainous regions of southern Norway, as well as in the inland areas of Finland, Sweden, and Norway [57]. The centroid of H. parviporum is located in eastern Sweden (19.4° N, 57.5° E). As H. parviporum is not well-suited to high temperatures, it is being driven toward the northern edge of Norway. Additionally, H. parviporum primarily parasitizes Norway spruce, and studies have shown that, due to the spruce’s adaptation to colder climates, its current habitat may face deteriorating growth conditions. In the future, Norway spruce may shift to northern and higher-altitude regions [58], which could also explain H. parviporum’s northward migration. The centroid of H. annosum s.str. is located in northeastern Germany. Its suitable habitat overlaps with that of H. parviporum and extends across the mid-latitude regions of Europe, with a broad distribution. The optimal temperature range for the hottest month is between 16 °C and 22 °C, and under future global warming conditions, H. annosum s.str. can only migrate northward to regions more suitable for its survival. H. annosum s.str. primarily parasitizes European Scots pine, a species highly sensitive to temperature changes [59]. Even moderate warming may impact the survival and growth of Scots pine, with northern regions likely to be less affected than southern ones [60]. Consequently, H. annosum s.str. is expected to migrate northward alongside European Scots pine, further explaining the northward shift of its distribution.

4.3. Study Limitations

The limitations of this study primarily lie in predicting the distribution of Heterobasidion species based on observed species distribution records. Due to potential deficiencies in the recorded information, this theoretical assumption may lead to biases in the research results. Secondly, the 22 environmental factors selected in this study do not fully represent all the environmental factors that need to be considered for the growth and development of Heterobasidion species, such as light, air quality, species interactions, and human impacts on species distribution [61], which may result in inaccuracies in model predictions. Furthermore, when predicting the suitable habitats for Heterobasidion species, special attention must be given to the issue of host availability. The potential distribution of these pathogens is closely related to the presence and health status of their host conifer species. Changes in forest composition due to climate change or forest management practices may limit the availability of suitable hosts, thus affecting the actual distribution of Heterobasidion species.
To address these issues, future research should strive to obtain more comprehensive species distribution data to enhance model accuracy. Additionally, it is recommended to incorporate more environmental factors related to the growth and development of Heterobasidion species into the models to improve predictions of their suitable habitats. At the same time, when conducting model predictions, the distribution and health status of host tree species should also be considered to better reflect the actual distribution of Heterobasidion species.

4.4. Future Perspectives

Future research should focus on promoting the sustainable use of both timber and non-timber resources, validating and expanding findings through broader species distribution data, and incorporating additional environmental factors related to Heterobasidion growth. Moreover, investigating the influence of host tree distribution and health on Heterobasidion species will be crucial. Studies on forest management strategies must consider the long-term impacts of climate change on forest ecosystems to formulate effective protective measures for the sustainable development and biodiversity of European forests. Overall, these efforts will provide a scientific basis for addressing the challenges posed by climate change and maintaining the ecological health of European forests.

5. Conclusions

This study predicts the habitat suitability of three Heterobasidion species that are destructive to European forests. We simulated and projected the potential impacts of current and future climate conditions on the distribution of Heterobasidion species, while also analyzing the key environmental factors influencing their spread. The study emphasizes that temperature and precipitation are the critical environmental variables affecting the growth and development of these species. Specifically, bio17 is the most important environmental factor for H. abietinum, while bio4 and bio10 are the key factors for H. annosum s.str. and H. parviporum, respectively. Under current climate conditions, the potential habitat of H. abietinum is concentrated in the Mediterranean region, H. parviporum is primarily found in northern Europe, while H. annosum s.str. has the broadest distribution, covering most of Europe. By 2081–2100, under most climate scenarios, all three Heterobasidion species are expected to exhibit an expansion in suitable habitat areas, though a contraction is projected under SSP585 and certain other specific scenarios. Influenced by precipitation patterns, H. abietinum is likely to shift southward, while H. parviporum and H. annosum s.str., driven by temperature changes and host tree availability, are expected to migrate northward. This study predicts the migration of Heterobasidion species in response to future climate change, aligning with the adaptive responses observed in many species to global warming. For instance, Lee et al. utilized MaxEnt to show that the suitable habitat for Solenopsis geminata is expected to expand and shift toward higher latitudes [30]. Similarly, Singh et al. suggest that the number of fungal Phytophthora spp. will increase under future climate scenarios, resulting in widespread mortality of American chestnut [53].
The predictions from this study hold significant ecological and forestry implications, providing a scientific basis for addressing the challenges posed by climate change. By maintaining the health of European forests and promoting the sustainable use of both timber and non-timber resources, this research supports the long-term stability of the European forest economy and biodiversity conservation. These findings not only reveal the potential impacts of future climate change on the distribution of Heterobasidion species but also underscore the necessity of implementing forest management strategies to mitigate the ecological risks associated with climate change.

Author Contributions

S.J. are the main instructors of this study. S.S. is the main author of this study, responsible for data processing, paper writing and drawing. X.Z. help with raw data and processing methods. All authors have read and agreed to the published version of the manuscript.

Funding

This research was funded by National Key Research Priorities Program of China (2023YFC3209303) (Jian Shengqi); Qian Kehe Zhicheng [2023] Yiban 206 (Jian Shengqi); Qian Kehe Zhicheng [2024] Yiban 130 (Jian Shengqi).

Data Availability Statement

All data and materials used in this manuscript are freely available and comply with field standards. The data presented in this study are available upon request from the corresponding author.

Conflicts of Interest

The authors declare no conflicts of interest.

References

  1. Pauli, H.; Gottfried, M.; Dullinger, S.; Abdaladze, O.; Akhalkatsi, M.; Alonso, J.L.B.; Coldea, G.; Dick, J.; Erschbamer, B.; Calzado, R.F.; et al. Recent Plant Diversity Changes on Europe’s Mountain Summits. Science 2012, 336, 353–355. [Google Scholar] [CrossRef] [PubMed]
  2. Tan, Z.; Yuan, Y.; Huang, S.; Ma, Y.; Hong, Z.; Wang, Y.; Wu, X.; Li, Z.; Ye, J.; Zhang, L. Geographical distribution and predict potential distribution of Angelica L. genus. Environ. Sci. Pollut. Res. 2023, 30, 46562–46573. [Google Scholar] [CrossRef] [PubMed]
  3. Hu, T.; Sun, Y.; Zhang, X. Temperature and precipitation projection at 1.5 and 2 °C increase in global mean temperature. Chin. Sci. Bull. 2017, 62, 3098–3111. [Google Scholar] [CrossRef]
  4. Linnakoski, R.; Kasanen, R.; Dounavi, A.; Forbes, K.M. Editorial: Forest Health Under Climate Change: Effects on Tree Resilience, and Pest and Pathogen Dynamics. Front. Plant Sci. 2019, 10, 1157. [Google Scholar] [CrossRef]
  5. Ostry, M.E.; Laflamme, G. Fungi and diseases—Natural components of healthy forests. Botany 2009, 87, 22–25. [Google Scholar] [CrossRef]
  6. Wingfield, M.J.; Brockerhoff, E.G.; Wingfield, B.D.; Slippers, B. Planted forest health: The need for a global strategy. Science 2015, 349, 832–836. [Google Scholar] [CrossRef]
  7. Ayres, M.P.; Lombardero, M.J. Assessing the consequences of global change for forest disturbance from herbivores and pathogens. Sci. Total Environ. 2000, 262, 263–286. [Google Scholar] [CrossRef]
  8. Maijala, P.; Harrington, T.C.; Raudaskoski, M. A peroxidase gene family and gene trees in Heterobasidion and related genera. Mycologia 2003, 95, 209–221. [Google Scholar] [CrossRef]
  9. Asiegbu, F.O.; Adomas, A.; Stenlid, J. Conifer root and butt rot caused by Heterobasidion annosum (Fr.) Bref. s.l. Mol. Plant Pathol. 2010, 6, 395–409. [Google Scholar] [CrossRef]
  10. Paul, N.C.; Deng, J.X.; Shin, K.S.; Yu, S.H. Molecular and Morphological Characterization of Endophytic Heterobasidion araucariae from Roots of Capsicum annuum L. in Korea. Mycobiology 2012, 40, 85–90. [Google Scholar] [CrossRef]
  11. Hellsten, S.; Helmisaari, H.S.; Melin, Y.; Skovsgaard, J.P.; Kaakinen, S.; Kukkola, M.; Saarsalmi, A.; Petersson, H.; Akselsson, C. Nutrient concentrations in stumps and coarse roots of Norway spruce, Scots pine and silver birch in Sweden, Finland and Denmark. (Special Issue: Environmental effects of tree-stump harvesting). For. Ecol. Manag. 2013, 290, 40–48. [Google Scholar] [CrossRef]
  12. Dai, Y.C.; Korhonen, K. Heterobasidion australe, a new polypore derived from the Heterobasidion insulare complex. Mycoscience 2009, 50, 353–356. [Google Scholar] [CrossRef]
  13. Tokuda, S.; Hattori, T.; Dai, Y.C.; Ota, Y.; Buchanan, P.K. Three species of Heterobasidion (Basidiomycota, Hericiales), H. parviporum, H. orientale sp. nov. and H. ecrustosum sp. nov. from East Asia. Mycoscience 2009, 50, 190–192. [Google Scholar] [CrossRef]
  14. Kashif, M.; Hyder, R.; Perez, D.D.V.; Hantula, J.; Vainio, E. Heterobasidion wood decay fungi host diverse and globally distributed viruses related to Helicobasidium mompa partitivirus V70. Virus Res. 2015, 195, 119–123. [Google Scholar] [CrossRef]
  15. Gaitnieks, T.; Zaļuma, A.; Kenigsvalde, K.; Kļaviņa, D.; Brauners, I.; Piri, T. Susceptibility of Small-Diameter Norway Spruce Understory Stumps to Heterobasidion Spore Infection. Forests 2019, 10, 521. [Google Scholar] [CrossRef]
  16. Hyder, R.; Piri, T.; Hantula, J.; Nuorteva, H.; Vainio, E.J. Distribution of Viruses Inhabiting Heterobasidion annosum in a Pine-Dominated Forest Plot in Southern Finland. Microb. Ecol. Int. J. 2018, 75, 631. [Google Scholar] [CrossRef]
  17. Vainio, E.J.; Hyder, R.; Aday, G.; Hansen, E.; Piri, T.; Doğmuş-Lehtijärvi, T.; Lehtijärvi, A.; Korhonen, K.; Hantula, J. Population structure of a novel putative mycovirus infecting the conifer root-rot fungus Heterobasidion annosum sensu lato. Virology 2012, 422, 366–376. [Google Scholar] [CrossRef]
  18. Woodward, S.; Stenlid, J.; Karjalainen, R.; Hüttermann, A. Heterobasidion annosum: Biology, Ecology, Impact and Control; CAB International: Wallingford, UK, 2000; Volume 148, pp. 127–128. [Google Scholar]
  19. Zu, K.; Wang, Z.; Zhu, X.; Lenoir, J.; Shrestha, N.; Lyu, T.; Luo, A.; Li, Y.; Ji, C.; Peng, S.; et al. Upward shift and elevational range contractions of subtropical mountain plants in response to climate change. Sci. Total Environ. 2021, 783, 146896. [Google Scholar] [CrossRef]
  20. Atwater, D.Z.; Barney, J.N. Climatic niche shifts in 815 introduced plant species affect their predicted distributions. Glob. Ecol. Biogeogr. 2021, 30, 1671–1684. [Google Scholar] [CrossRef]
  21. Qiao, H.; Lin, C.; Ji, L.; Jiang, Z. mMWeb—An Online Platform for Employing Multiple Ecological Niche Modeling Algorithms. PLoS ONE 2012, 7, e43327. [Google Scholar] [CrossRef]
  22. Barbosa, F.G.; Schneck, F. Characteristics of the top-cited papers in species distribution predictive models. Ecol. Model. 2015, 313, 77–83. [Google Scholar] [CrossRef]
  23. Vaz, U.L.; Cunha, H.F.; Nabout, J.C. Trends and biases in global scientific literature about ecological niche models. Braz. J. Biol. 2015, 75, 17–24. [Google Scholar] [CrossRef] [PubMed]
  24. Bertrand, R.; Perez, V.; Gégout, J.-C. Disregarding the edaphic dimension in species distribution models leads to the omission of crucial spatial information under climate change: The case of Quercus pubescens in France. Glob. Chang. Biol. 2012, 18, 2648–2660. [Google Scholar] [CrossRef]
  25. Wang, Y.H.; Jiang, W.M.; Comes, H.P.; Hu, F.S.; Qiu, Y.X.; Fu, C.X. Molecular phylogeography and ecological niche modelling of a widespread herbaceous climber, Tetrastigma hemsleyanum (Vitaceae): Insights into Plio-Pleistocene range dynamics of evergreen forest in subtropical China. New Phytol. 2015, 206, 852–867. [Google Scholar] [CrossRef]
  26. Wisz, M.S.; Hijmans, R.J.; Li, J.; Peterson, A.T.; Graham, C.H.; Guisan, A.; NCEAS Predicting Species Distributions Working Group. Effects of sample size on the performance of species distribution models. Divers. Distrib. 2010, 14, 763–773. [Google Scholar] [CrossRef]
  27. van Proosdij, A.S.; Sosef, M.S.; Wieringa, J.J.; Raes, N. Minimum required number of specimen records to develop accurate species distribution models. Ecography 2016, 39, 366–376. [Google Scholar] [CrossRef]
  28. Kumar, S.; Stohlgren, T.J. Maxent modeling for predicting suitable habitat for threatened and endangered tree Canacomyrica monticola in New Caledonia. J. Ecol. Nat. Environ. 2009, 6, 1–5. [Google Scholar]
  29. Zheng, C.; Wen, Z.M.; Liu, Y.Y.; Guo, Q.; Jiang, Y.M.; Ren, H.Y.; Fan, Y.M.; Yang, Y.T. Integrating Habitat Suitability and the Near-Nature Restoration Priorities into Revegetation Plans Based on Potential Vegetation Distribution. Forests 2021, 12, 218. [Google Scholar] [CrossRef]
  30. Lee, C.M.; Lee, D.-S.; Kwon, T.-S.; Athar, M.; Park, Y.-S. Predicting the Global Distribution of Solenopsis geminata (Hymenoptera: Formicidae) under Climate Change Using the MaxEnt Model. Insects 2021, 12, 229. [Google Scholar] [CrossRef]
  31. Fordham, D.A.; Wigley, T.M.L.; Brook, B.W. Multi-model climate projections for biodiversity risk assessments. Ecol. Appl. 2011, 21, 3317–3331. [Google Scholar] [CrossRef]
  32. Lovato, T.; Peano, D.; Butenschön, M.; Materia, S.; Iovino, D.; Scoccimarro, E.; Fogli, P.G.; Cherchi, A.; Bellucci, A.; Gualdi, S.; et al. CMIP6 Simulations with the CMCC Earth System Model (CMCC-ESM2). J. Adv. Model. Earth Syst. 2022, 14, e2021MS002814. [Google Scholar] [CrossRef]
  33. Wyser, K.; van Noije, T.; Yang, S.T.; von Hardenberg, J.; O’Donnell, D.; Döscher, R. On the increased climate sensitivity in the EC-Earth model from CMIP5 to CMIP6. Geosci. Model Dev. 2020, 13, 3465–3474. [Google Scholar] [CrossRef]
  34. Volodin, E.M. Possible Climate Change in Russia in the 21st Century Based on the INM-CM5-0 Climate Model. Russ. Meteorol. Hydrol. 2022, 47, 327–333. [Google Scholar] [CrossRef]
  35. Müller, W.A.; Jungclaus, J.H.; Mauritsen, T.; Baehr, J.; Bittner, M.; Budich, R.; Bunzel, F.; Esch, M.; Ghosh, R.; Haak, H.; et al. A Higher-resolution Version of the Max Planck Institute Earth System Model (MPI-ESM1.2-HR). J. Adv. Model. Earth Syst. 2018, 10, 1383–1413. [Google Scholar] [CrossRef]
  36. Tatebe, H.; Ogura, T.; Nitta, T.; Komuro, Y.; Ogochi, K.; Takemura, T.; Sudo, K.; Sekiguchi, M.; Abe, M.; Saito, F.; et al. Description and basic evaluation of simulated mean state, internal variability, and climate sensitivity in MIROC6. Geosci. Model Dev. 2019, 12, 2727–2765. [Google Scholar] [CrossRef]
  37. Yukimoto, S.; Kawai, H.; Koshiro, T.; Oshima, N.; Yoshida, K.; Urakawa, S.; Tsujino, H.; Deushi, M.; Tanaka, T.; Hosaka, M.; et al. The Meteorological Research Institute Earth System Model Version 2.0, MRI-ESM2.0: Description and Basic Evaluation of the Physical Component. J. Meteorol. Soc. Jpn. 2019, 97, 931–965. [Google Scholar] [CrossRef]
  38. Kumar, S.; Graham, J.; West, A.M.; Evangelista, P.H. Using district-level occurrences in Max Ent for predicting the invasion potential of an exotic insect pest in India. Comput. Electron. Agric. 2014, 103, 55–62. [Google Scholar] [CrossRef]
  39. Fois, M.; Cuena-Lombraña, A.; Fenu, G.; Bacchetta, G. Using species distribution models at local scale to guide the search of poorly known species: Review, methodological issues and future directions. Ecol. Model. 2018, 385, 124–132. [Google Scholar] [CrossRef]
  40. Wang, E.; Lu, Z.R.; Rohani, E.R.; Ou, J.M.; Tong, X.H.; Han, R.C. Current and future distribution of Forsythia suspensa in China under climate change adopting the MaxEnt model. Front. Plant Sci. 2024, 15, 1394799. [Google Scholar] [CrossRef]
  41. Muscarella, R.; Galante, P.J.; Soley-Guardia, M.; Boria, R.A.; Kass, J.M.; Uriarte, M.; Anderson, R.P.; Mcpherson, J. ENMeval: An R package for conducting spatially independent evaluations and estimating optimal model complexity for Maxent ecological niche models. Methods Ecol. Evol. 2015, 5, 1198–1205. [Google Scholar] [CrossRef]
  42. Yan, X.; Wang, S.; Duan, Y.; Han, J.; Huang, D.; Zhou, J. Current and future distribution of the deciduous shrub Hydrangea macrophylla in China estimated by MaxEnt. Ecol. Evol. 2021, 11, 16099–16112. [Google Scholar] [CrossRef]
  43. Martinez, F.; Blancard, D.; Lecomte, P.; Levis, C.; Dubos, B.; Fermaud, M. Phenotypic Differences Between vacuma and transposa subpopulations of Botrytis cinerea. Eur. J. Plant Pathol. 2003, 109, 479–488. [Google Scholar] [CrossRef]
  44. Brasier, C.M. Phytophthora cinnamomi and oak decline in southern Europe. Environmental constraints including climate change. Ann. Des. Sci. For. 1996, 53, 347–358. [Google Scholar] [CrossRef]
  45. Lonsdale, D. Effects of climate change on fungal disease of trees. Fungi Environ. Chang. 1996, 6, 1253022. [Google Scholar]
  46. Miles, J.W.; Grof, B. Recent advances in studies of anthracnose of Stylosanthes. III. Stylosanthes breeding approaches South America. Trop. Grassl. 1997, 31, 430–434. [Google Scholar]
  47. Milici, V.R.; Dalui, D.; Mickley, J.G.; Bagchi, R. Responses of plant–pathogen interactions to precipitation: Implications for tropical tree richness in a changing world. J. Ecol. 2020, 108, 1800–1809. [Google Scholar] [CrossRef]
  48. Munier, A.; Hermanutz, L.; Jacobs, J.D.; Lewis, K. The interacting effects of temperature, ground disturbance, and herbivory on seedling establishment: Implications for treeline advance with climate warming. Plant Ecol. 2010, 210, 19–30. [Google Scholar] [CrossRef]
  49. Ungerer, M.J.; Lombardero, A.M.J. Climate and the northern distribution limits of Dendroctonus frontalis Zimmermann (Coleoptera: Scolytidae). J. Biogeogr. 1999, 26, 1133–1145. [Google Scholar] [CrossRef]
  50. Burgess, S.S.O. Measuring transpiration responses to summer precipitation in a Mediterranean climate: A simple screening tool for identifying plant water-use strategies. Physiol. Plant 2006, 127, 404–441. [Google Scholar] [CrossRef]
  51. Porter, J.H.; Parry, M.L.; Carter, T.R. The potential effects of climatic change on agricultural insect pests. Agric. For. Meteorol. 1991, 57, 221–240. [Google Scholar] [CrossRef]
  52. Asante, S.K.; Danthanarayana, W.; Heatwole, H. Bionomics and population growth statistics of apterous virginoparae of woolly apple aphid, Eriosoma lanigerum, at constant temperatures. Entomol. Exp. Appl. 1991, 60, 261–270. [Google Scholar] [CrossRef]
  53. Singh, B.K.; Delgado-Baquerizo, M.; Egidi, E.; Guirado, E.; Leach, J.E.; Liu, H.; Trivedi, P. Climate change impacts on plant pathogens, food security and paths forward. Nat. Rev. Microbiol. 2023, 21, 640–656. [Google Scholar] [CrossRef] [PubMed]
  54. IPCC. Climate Change 2021: The Physical Science Basis. Contribution of Working Group I to the Sixth Assessment Report of the Intergovernmental Panel on Climate Change; Masson-Delmotte, V.P., Zhai, A., Pirani, S.L., Connors, C., Péan, S., Berger, N., Caud, Y., Chen, L., Goldfarb, M.I., Gomis, M., et al., Eds.; Cambridge University Press: Cambridge, UK; New York, NY, USA, 2021; p. 2391. [Google Scholar]
  55. Bordi, I.; Sutera, F. The analysis of the Standardized Precipitation Index in the Mediterranean area: Regional patterns. Ann. Geophys. 2001, 44, 964–978. [Google Scholar] [CrossRef]
  56. Muller, M.; Olsson, P.O.; Eklundh, L.; Jamali, S.; Ardo, J. Features predisposing forest to bark beetle outbreaks and their dynamics during drought. For. Ecol. Manag. 2022, 523, 120480. [Google Scholar] [CrossRef]
  57. Benestad, R.E. Climate change scenarios for Northern Europe from multi-model IPCC AR4 climate simulations. Geophys. Res. Lett. 2005, 32, 261. [Google Scholar] [CrossRef]
  58. Lévesque, M.; Saurer, M.; Siegwolf, R.T.W.; Eilmann, B.; Brang, P.; Bugmann, H.; Rigling, A. Drought response of five conifer species under contrasting water availability suggests high vulnerability of Norway spruce and European larch. Glob. Chang. Biol. 2013, 19, 3184–3199. [Google Scholar] [CrossRef]
  59. Rubio-Cuadrado, Á.; Camarero, J.J.; Gómez, C.; Cañellas, I.; Aulló-Maestro, I.; Gil, L.; Montes, F. Scots pine plantations growth adaptation to climate warming in locations at the southernmost distribution limit of the species. Dendrochronologia 2020, 63, 125745. [Google Scholar] [CrossRef]
  60. Reich, P.B.; Oleksyn, J. Climate warming will reduce growth and survival of Scots pine except in the far north. Ecol. Lett. 2008, 11, 588–597. [Google Scholar] [CrossRef]
  61. Wang, C.J.; Wan, J.Z. Envelope, Functional trait perspective on suitable habitat distribution of invasive plant species at a global scale. Perspect. Ecol. Conserv. 2021, 19, 475–486. [Google Scholar]
Figure 1. Pearson correlation heatmap of the 22 environmental variables: a, H. abietinum; b, H. annosum s.str.; c, H. parviporum.
Forests 15 01863 g001
Figure 2. Optimization results of Heterobasidion species models using AICc (the smaller, the better) and omission rate (the lower, the better): (a) H. abietinum; (b) H. annosum s.str; (c) H. parviporum.
Forests 15 01863 g002
Figure 3. Clustering heatmaps of Pearson correlation between 22 environmental variables for the three species: (a), H. abietinum, (b), H. annosum s.str., and (c) H. parviporum. Each heatmap shows the Pearson correlation coefficients between variables, with colors ranging from deep blue (strong negative correlation) to deep red (strong positive correlation).
Forests 15 01863 g003
Figure 4. The contribution percentages of environmental variables for the three Heterobasidion species. Yellow represents H. annosum s.str., red represents H. abietinum, and green represents H. parviporum.
Forests 15 01863 g004
Figure 5. Jackknife test results for the importance of environmental variables. Blue bars represent the AUC when each variable is used in isolation, green bars represent the AUC when each variable is excluded, and orange bars represent the AUC when all 11 environmental variables are included. (a), H. abietinum, (b), H. annosum s.str., and (c) H. parviporum.
Forests 15 01863 g005
Figure 6. Response curves for the top three environmental factors contributing to the climate suitability models of three Heterobasidion species, visualized using R language based on MaxEnt model results (the red line indicates the average, and the gray shading represents the standard deviation from ten repetitions). (ac) H. abietinum, (df) H. annosum s.str., and (gi) H. parviporum.
Forests 15 01863 g006
Figure 7. The potential distribution of the three Heterobasidion species under current climate conditions (1970–2000). Red indicates high suitability areas, orange represents middle suitability areas, yellow denotes low suitability areas, and blue indicates unsuitable areas. (a) H. abietinum, (b) H. annosum s.str., and (c) H. parviporum. This analysis was conducted using the MaxEnt model to predict potential distributions based on environmental variables and species distribution data.
Forests 15 01863 g007
Figure 8. The potential distribution of three European Heterobasidion species under four scenarios (SSP126, SSP245, SSP370, and SSP585) for the years 2081–2100 is depicted, with red areas representing highly suitable regions, orange areas indicating moderately suitable regions, yellow areas denoting low suitability, and blue areas representing unsuitable regions. This analysis was conducted using the MaxEnt model to predict potential distributions based on environmental variables and species distribution data. (ad) H. abietinum, (eh) H. annosum s.str., and (il) H. parviporum.
Forests 15 01863 g008
Figure 9. Analysis of suitable habitat contraction and expansion for Heterobasidion species under future climate scenarios (2081–2100) using ArcGIS and SDMToolbox: Distributional changes among three Heterobasidion species across four climate scenarios, with color representation indicating regions of contraction (blue), unchanged (pink), and expansion (purple).
Forests 15 01863 g009
Figure 10. Current distribution of potential habitats and centroid shifts: Centroid calculation using the weighted average method in ArcGIS.
Forests 15 01863 g010
Table 1. Classification of Heterobasidion species based on pathogenicity and geographic distribution.
GroupSpeciesPathogenicityDistribution
Pine-Parasitic GroupHeterobasidion annosum s.str.Highly pathogenicEurope
Heterobasidion irregulareHighly pathogenicNorth America
Spruce-Parasitic GroupHeterobasidion abietinumHighly pathogenicEurope
Heterobasidion occidentaleHighly pathogenicNorth America
Heterobasidion parviporumHighly pathogenicEurope
Heterobasidion subparviporumWeakly pathogenicAsia
Saprotrophic Conifer GroupHeterobasidion amyloideumSaprotrophicAsia
Heterobasidion araucariaeSaprotrophicOceania
Heterobasidion armandiiSaprotrophicAsia
Heterobasidion australeSaprotrophicAsia
Heterobasidion insulareSaprotrophicAsia
Heterobasidion linzhienseSaprotrophicAsia
Heterobasidion orientaleSaprotrophicAsia
Heterobasidion subinsulareSaprotrophicAsia
Heterobasidion tibeticumSaprotrophicAsia
Table 2. Environmental variables and their characteristics relevant to species distribution modeling.
Environmental VariableVariable DescriptionUnit
Bio1Annual Mean Temperature°C
Bio2Mean Diurnal Range (Mean of monthly (max temp-min temp))°C
Bio3Isothermality-
Bio4Temperature Seasonality-
Bio5Max Temperature of Warmest Month°C
Bio6Min Temperature of Coldest Month°C
Bio7Temperature Annual Range°C
Bio8Mean Temperature of Wettest Quarter°C
Bio9Mean Temperature of Driest Quarter°C
Bio10Mean Temperature of Warmest Quarter°C
Bio11Mean Temperature of Coldest Quarter°C
Bio12Annual Precipitationmm
Bio13Precipitation of Wettest Monthmm
Bio14Precipitation of Driest Monthmm
Bio15Precipitation Seasonality (Coefficient of Variation)mm
Bio16Precipitation of Wettest Quartermm
Bio17Precipitation of Driest Quartermm
Bio18Precipitation of Warmest Quartermm
Bio19Precipitation of Coldest Quartermm
SlpSlope-
AspAspect-
AltAltitudem
Table 3. Definitions and characteristics of climate scenarios based on SSP framework.
Climate ScenarioDefinitionCharacteristics
SSP126Low emissions sustainable development pathwayEmphasizes the use of renewable energy, reducing greenhouse gas emissions, and implementing sustainable economic policies to achieve low emission targets.
SSP245Moderate emissions pathwayCombines economic growth with greenhouse gas reduction, adopting moderate policies to address climate change, resulting in medium-level emissions.
SSP370High emissions pathwayContinues current economic and energy policies, leading to a continuous rise in greenhouse gas emissions, with a lack of effective climate policies.
SSP585Very high emissions pathwayFaces significant environmental challenges with insufficient policy responses, resulting in very high greenhouse gas emissions and severe impacts of climate change.
Table 4. Changes in the area of suitable habitats for three Heterobasidion species under different climate scenarios and percentage variation relative to the current period.
SpeciesClimate ScenarioArea of Suitable Areas at Different Levels (×104 km2)
and Variation Relative to Current Period (%)
UnsuitableLowMiddleHigh
×104 km2%×104 km2%×104 km2%×104 km2%
H. abietinumCurrent1187.93-70.09-16.34-7.38-
SSP1261177.74−0.973.61517.8896.75−9
SSP2451189.670.158.58−1620.02237.461
SSP3701180.94−0.659.82−1522.793912.1865
SSP5851211.67253.50−2414.81−95.76−22
H. annosum s.str.Current816.15-199.60-144.75-115.24-
SSP126770.05−6232.7816155.237117.692
SSP245782.85−4224.075161.3111107.51−7
SSP370812.69−0.4208.925147.962106.17−8
SSP585816.480.04196.98−1150.704111.57−3
H. parviporumCurrent1048.12-117.60-63.87-46.15-
SSP1261015.47−3142.582172.691444.99−3
SSP2451036.38−1132.701365.01241.65−10
SSP3701050.810.3120.19264.31140.42−12
SSP5851061.431108.76−866.01339.55−14
Disclaimer/Publisher’s Note: The statements, opinions and data contained in all publications are solely those of the individual author(s) and contributor(s) and not of MDPI and/or the editor(s). MDPI and/or the editor(s) disclaim responsibility for any injury to people or property resulting from any ideas, methods, instructions or products referred to in the content.

