Enhanced Estimation of Crown-Level Leaf Dry Biomass of Ginkgo Saplings Based on Multi-Height UAV Imagery and Digital Aerial Photogrammetry Point Cloud Data
Abstract
1. Introduction
2. Materials and Methods
2.1. Overview of the Study Area
2.2. Experimental Design
2.3. Field Data Collection and Processing
2.4. UAV RGB Image Acquisition and Processing
2.5. Remote Sensing Metric Extraction
2.5.1. Color Feature Parameters
2.5.2. Texture Feature Parameters
2.5.3. Extraction of Crown-Level Structural Parameters
2.5.4. Height-Related and Density-Related Metrics Extraction
2.6. Pearson Correlation Analysis
2.7. Regression Analysis and Backward Elimination of Optimal Metrics
2.7.1. GPR Models
2.7.2. PLSR Models
2.8. Estimation Accuracy Evaluation Method
3. Results
3.1. The Leaf Biomass and Height of Ginkgo Saplings under Different Nitrogen Level Treatments
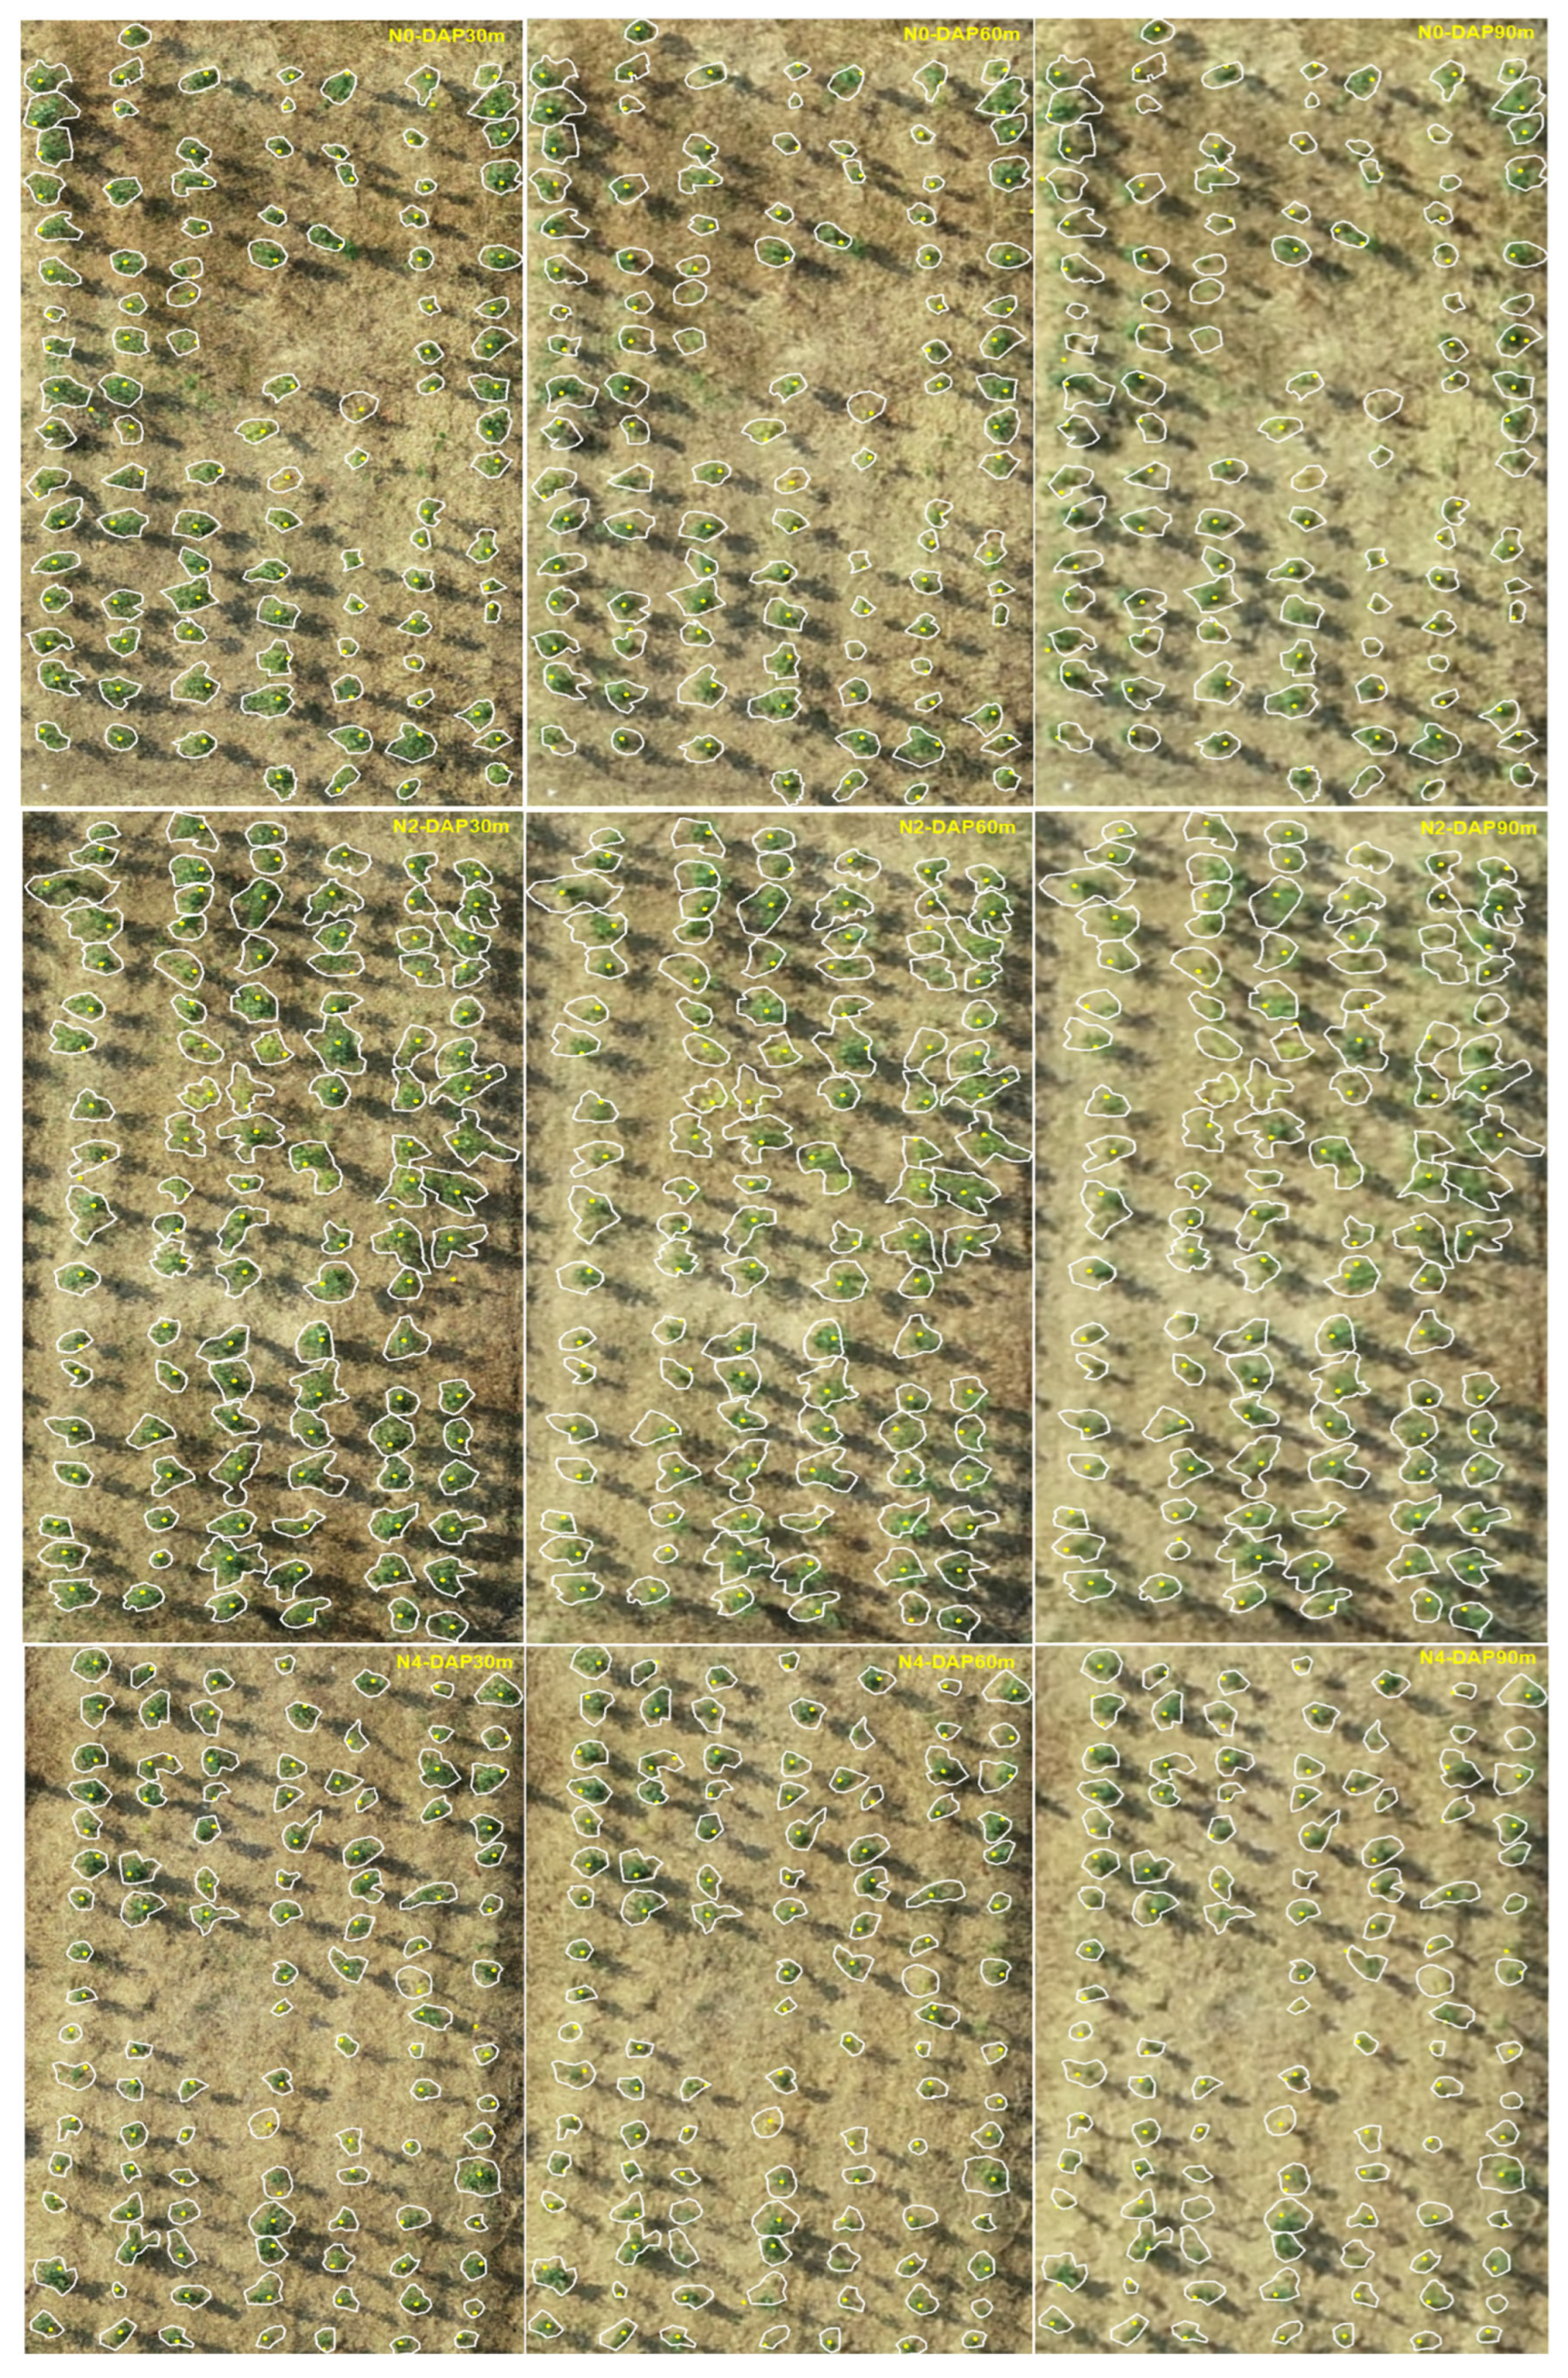
3.2. Tree Top Detection of Ginkgo Saplings
3.3. Correlation Analysis between Leaf Biomass and Remote Sensing Metrics
3.3.1. Correlation Analysis between Leaf Biomass and Image Metrics
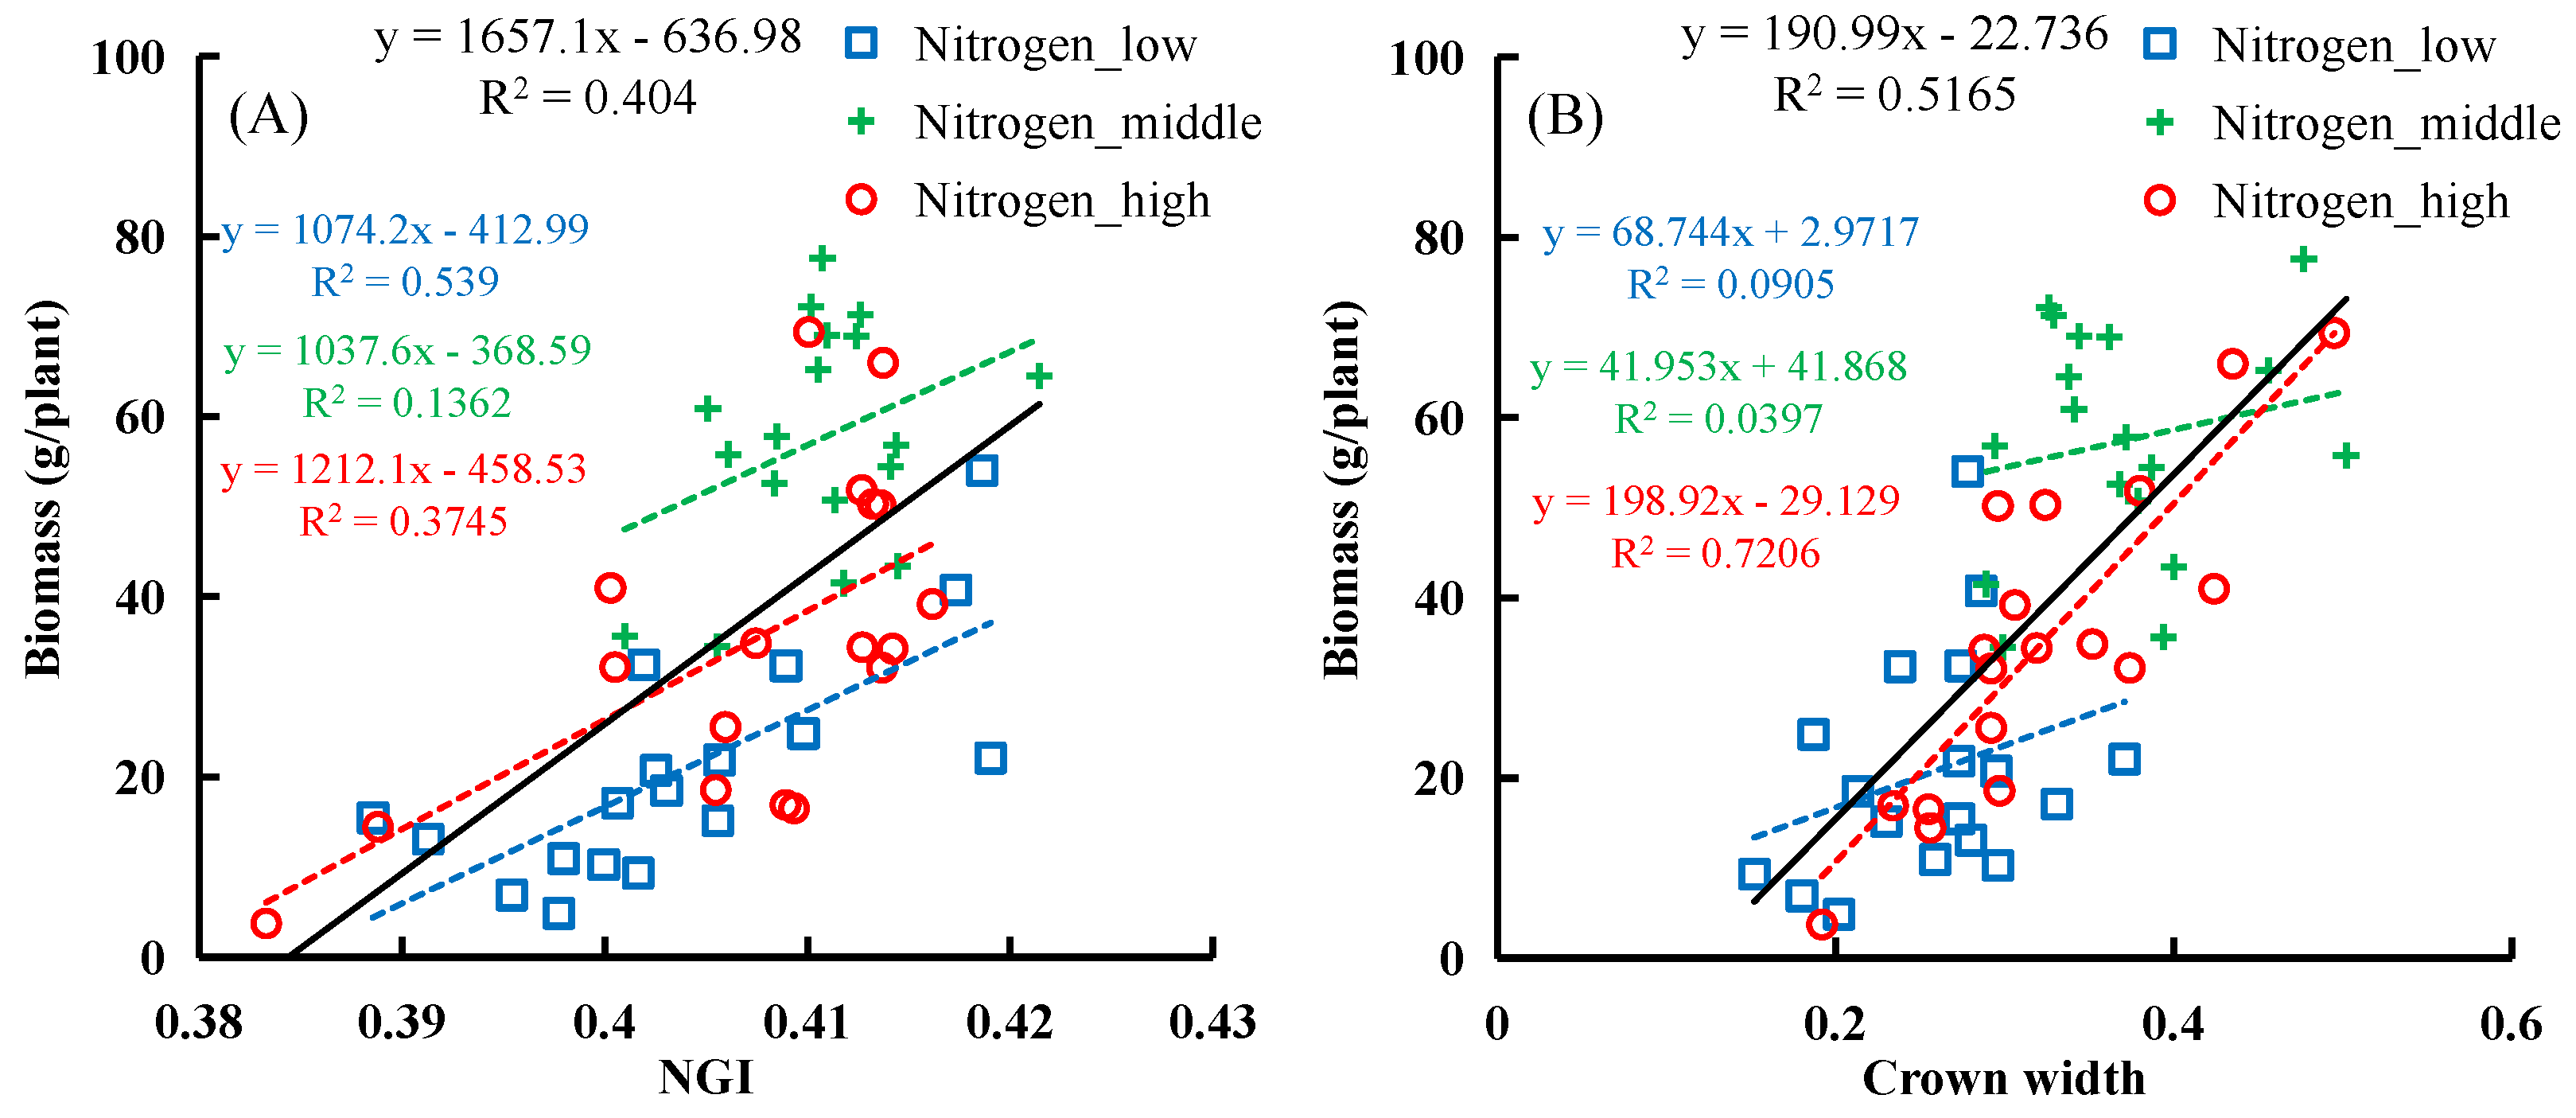
3.3.2. Correlation Analysis between DAP Metrics and Leaf Biomass
3.4. Estimation of Leaf Biomass Based on PLSR and GPR Models with Optimal Metrics
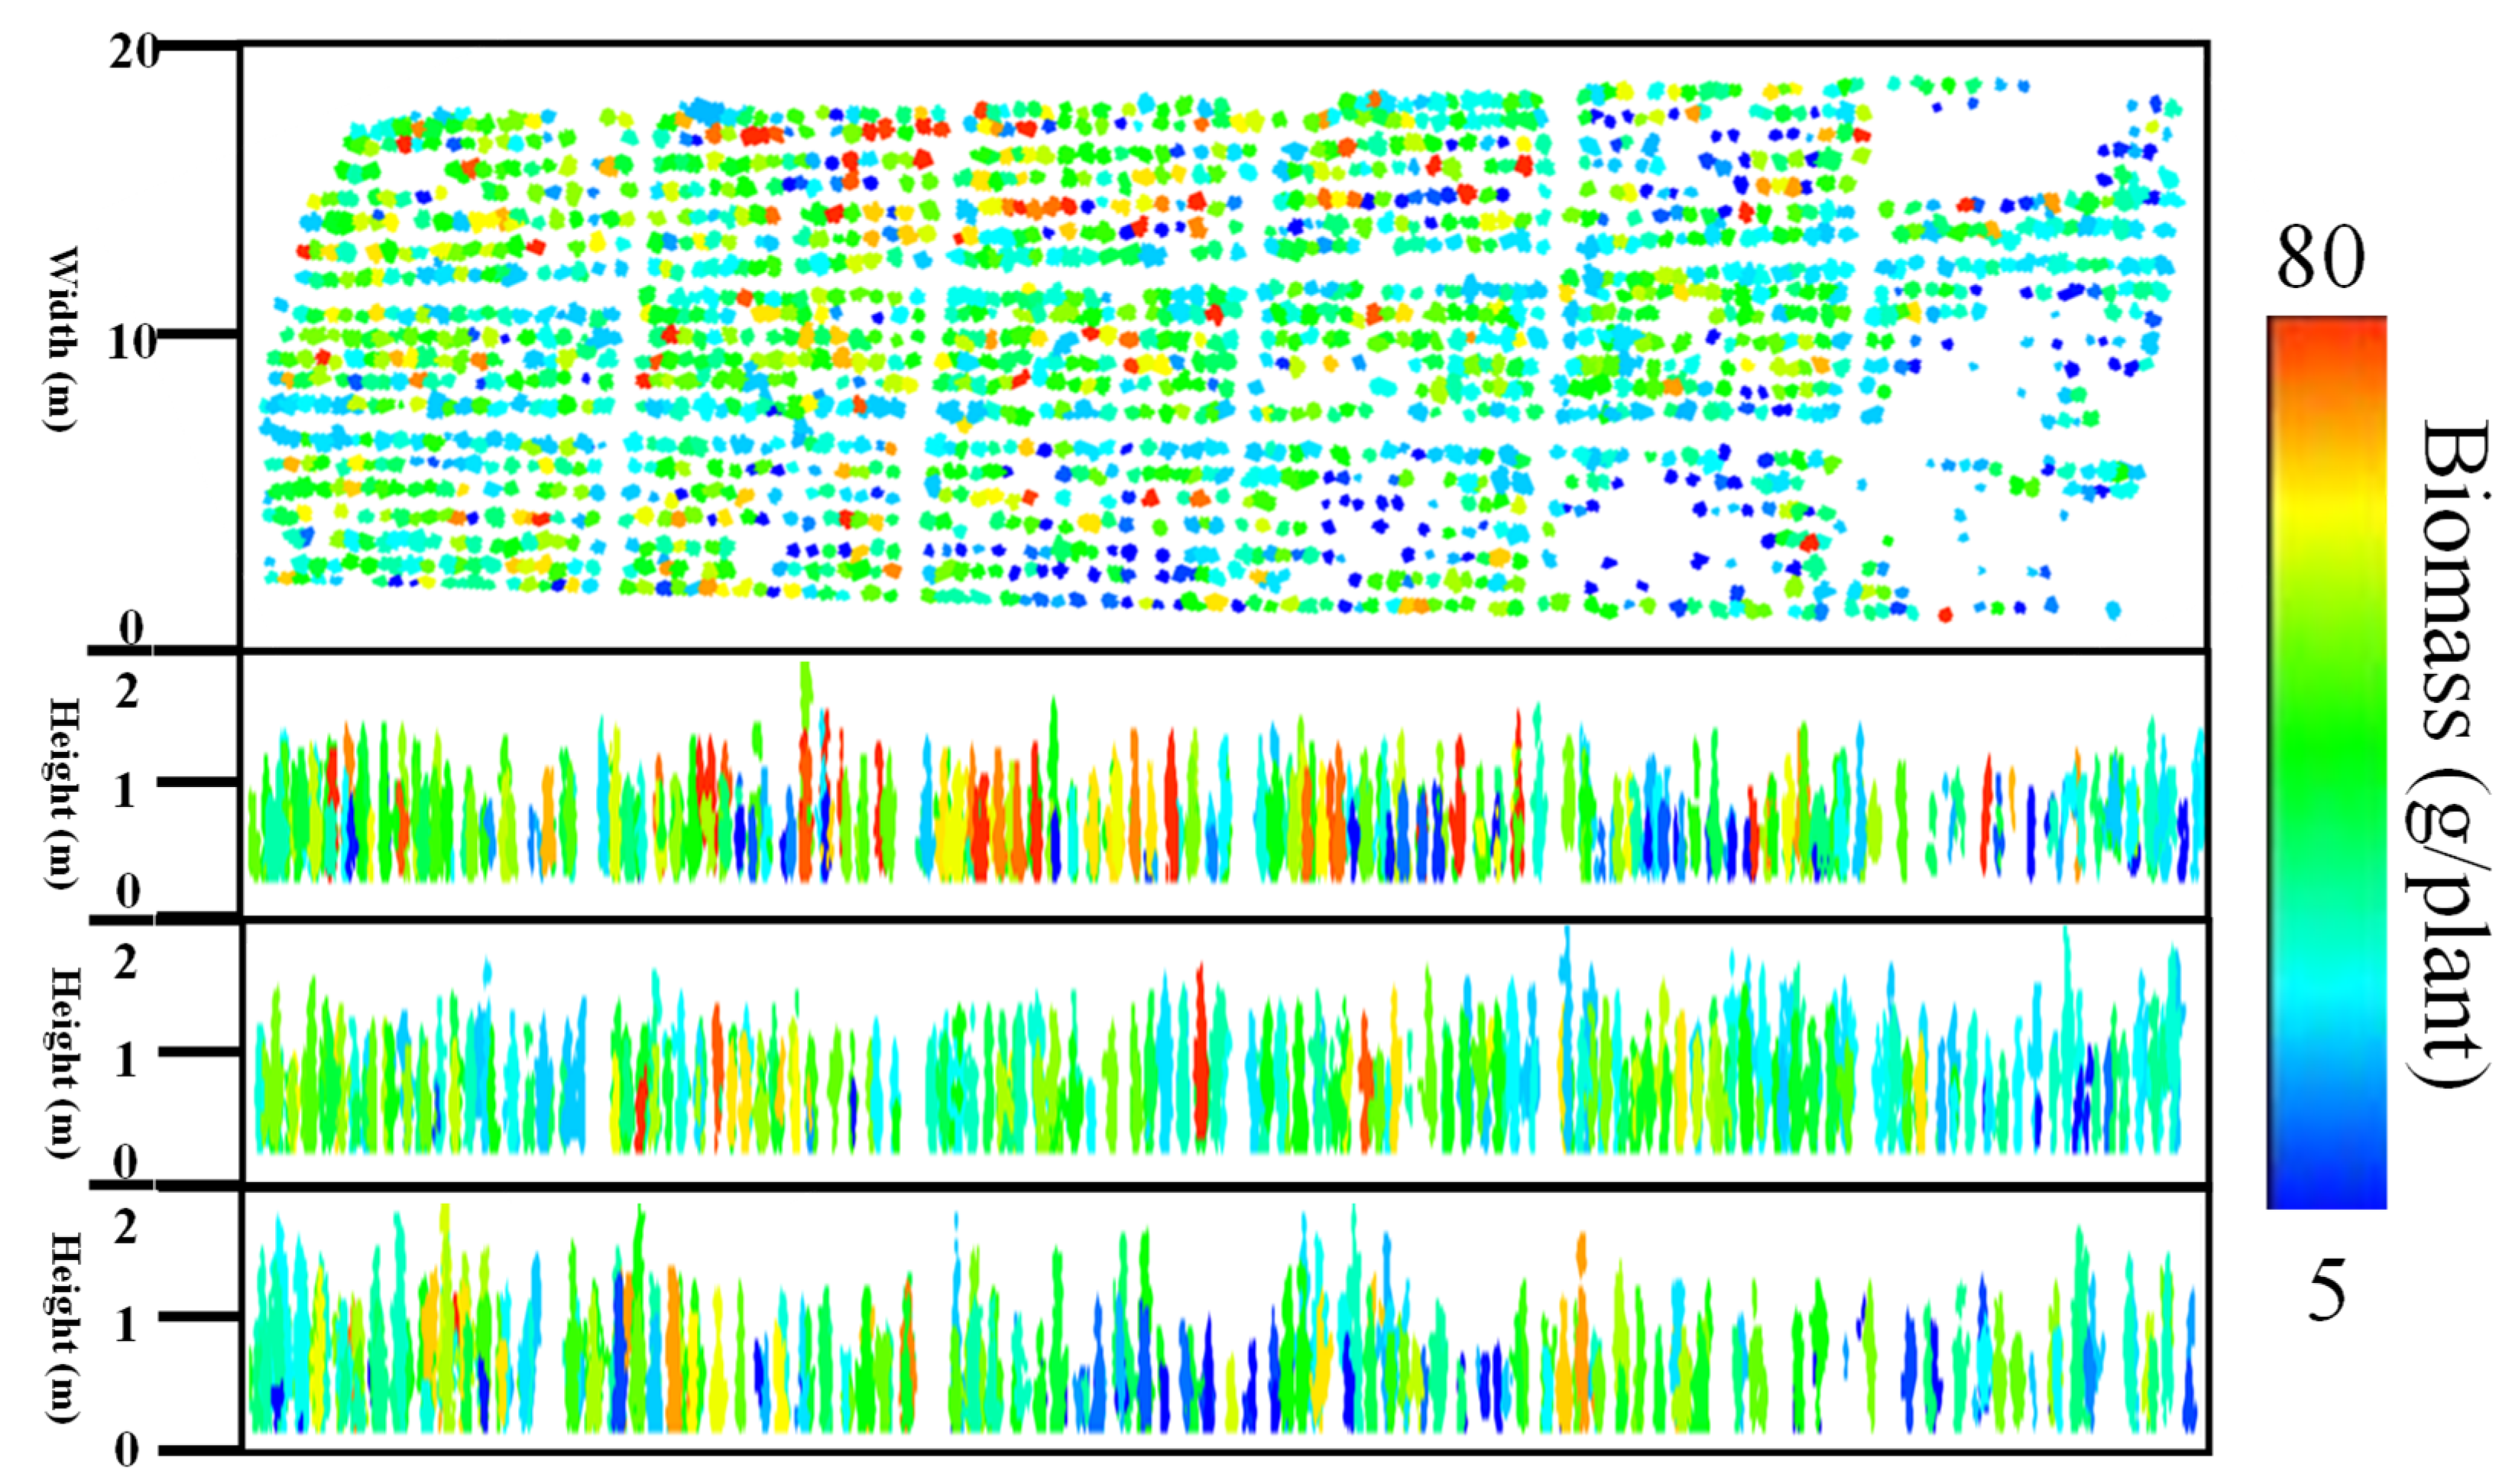
3.5. Mapping the Distribution of Crown-Level Leaf Biomass for Ginkgo Saplings
4. Discussion
4.1. Comparison of Measured Structural Parameters of Ginkgo Saplings under Different Nitrogen Treatments
4.2. Comparison of Image Metrics and DAP Metrics for Estimating Leaf Biomass
4.3. Comparison between PLSR and GPR Models and Optimal Metric Selection
4.4. Potentials and Limitations
5. Conclusions
- (1)
- The integration of 60 m height image metrics with 30 m height DAP metrics, derived from the best-performing DAP point cloud datasets for tree top detection, significantly improves leaf biomass estimation.
- (2)
- GPR models generally outperformed PLSR models, regardless of using image metrics only or combined datasets, achieving a maximum R2 of 0.79 in the best-case scenario.
- (3)
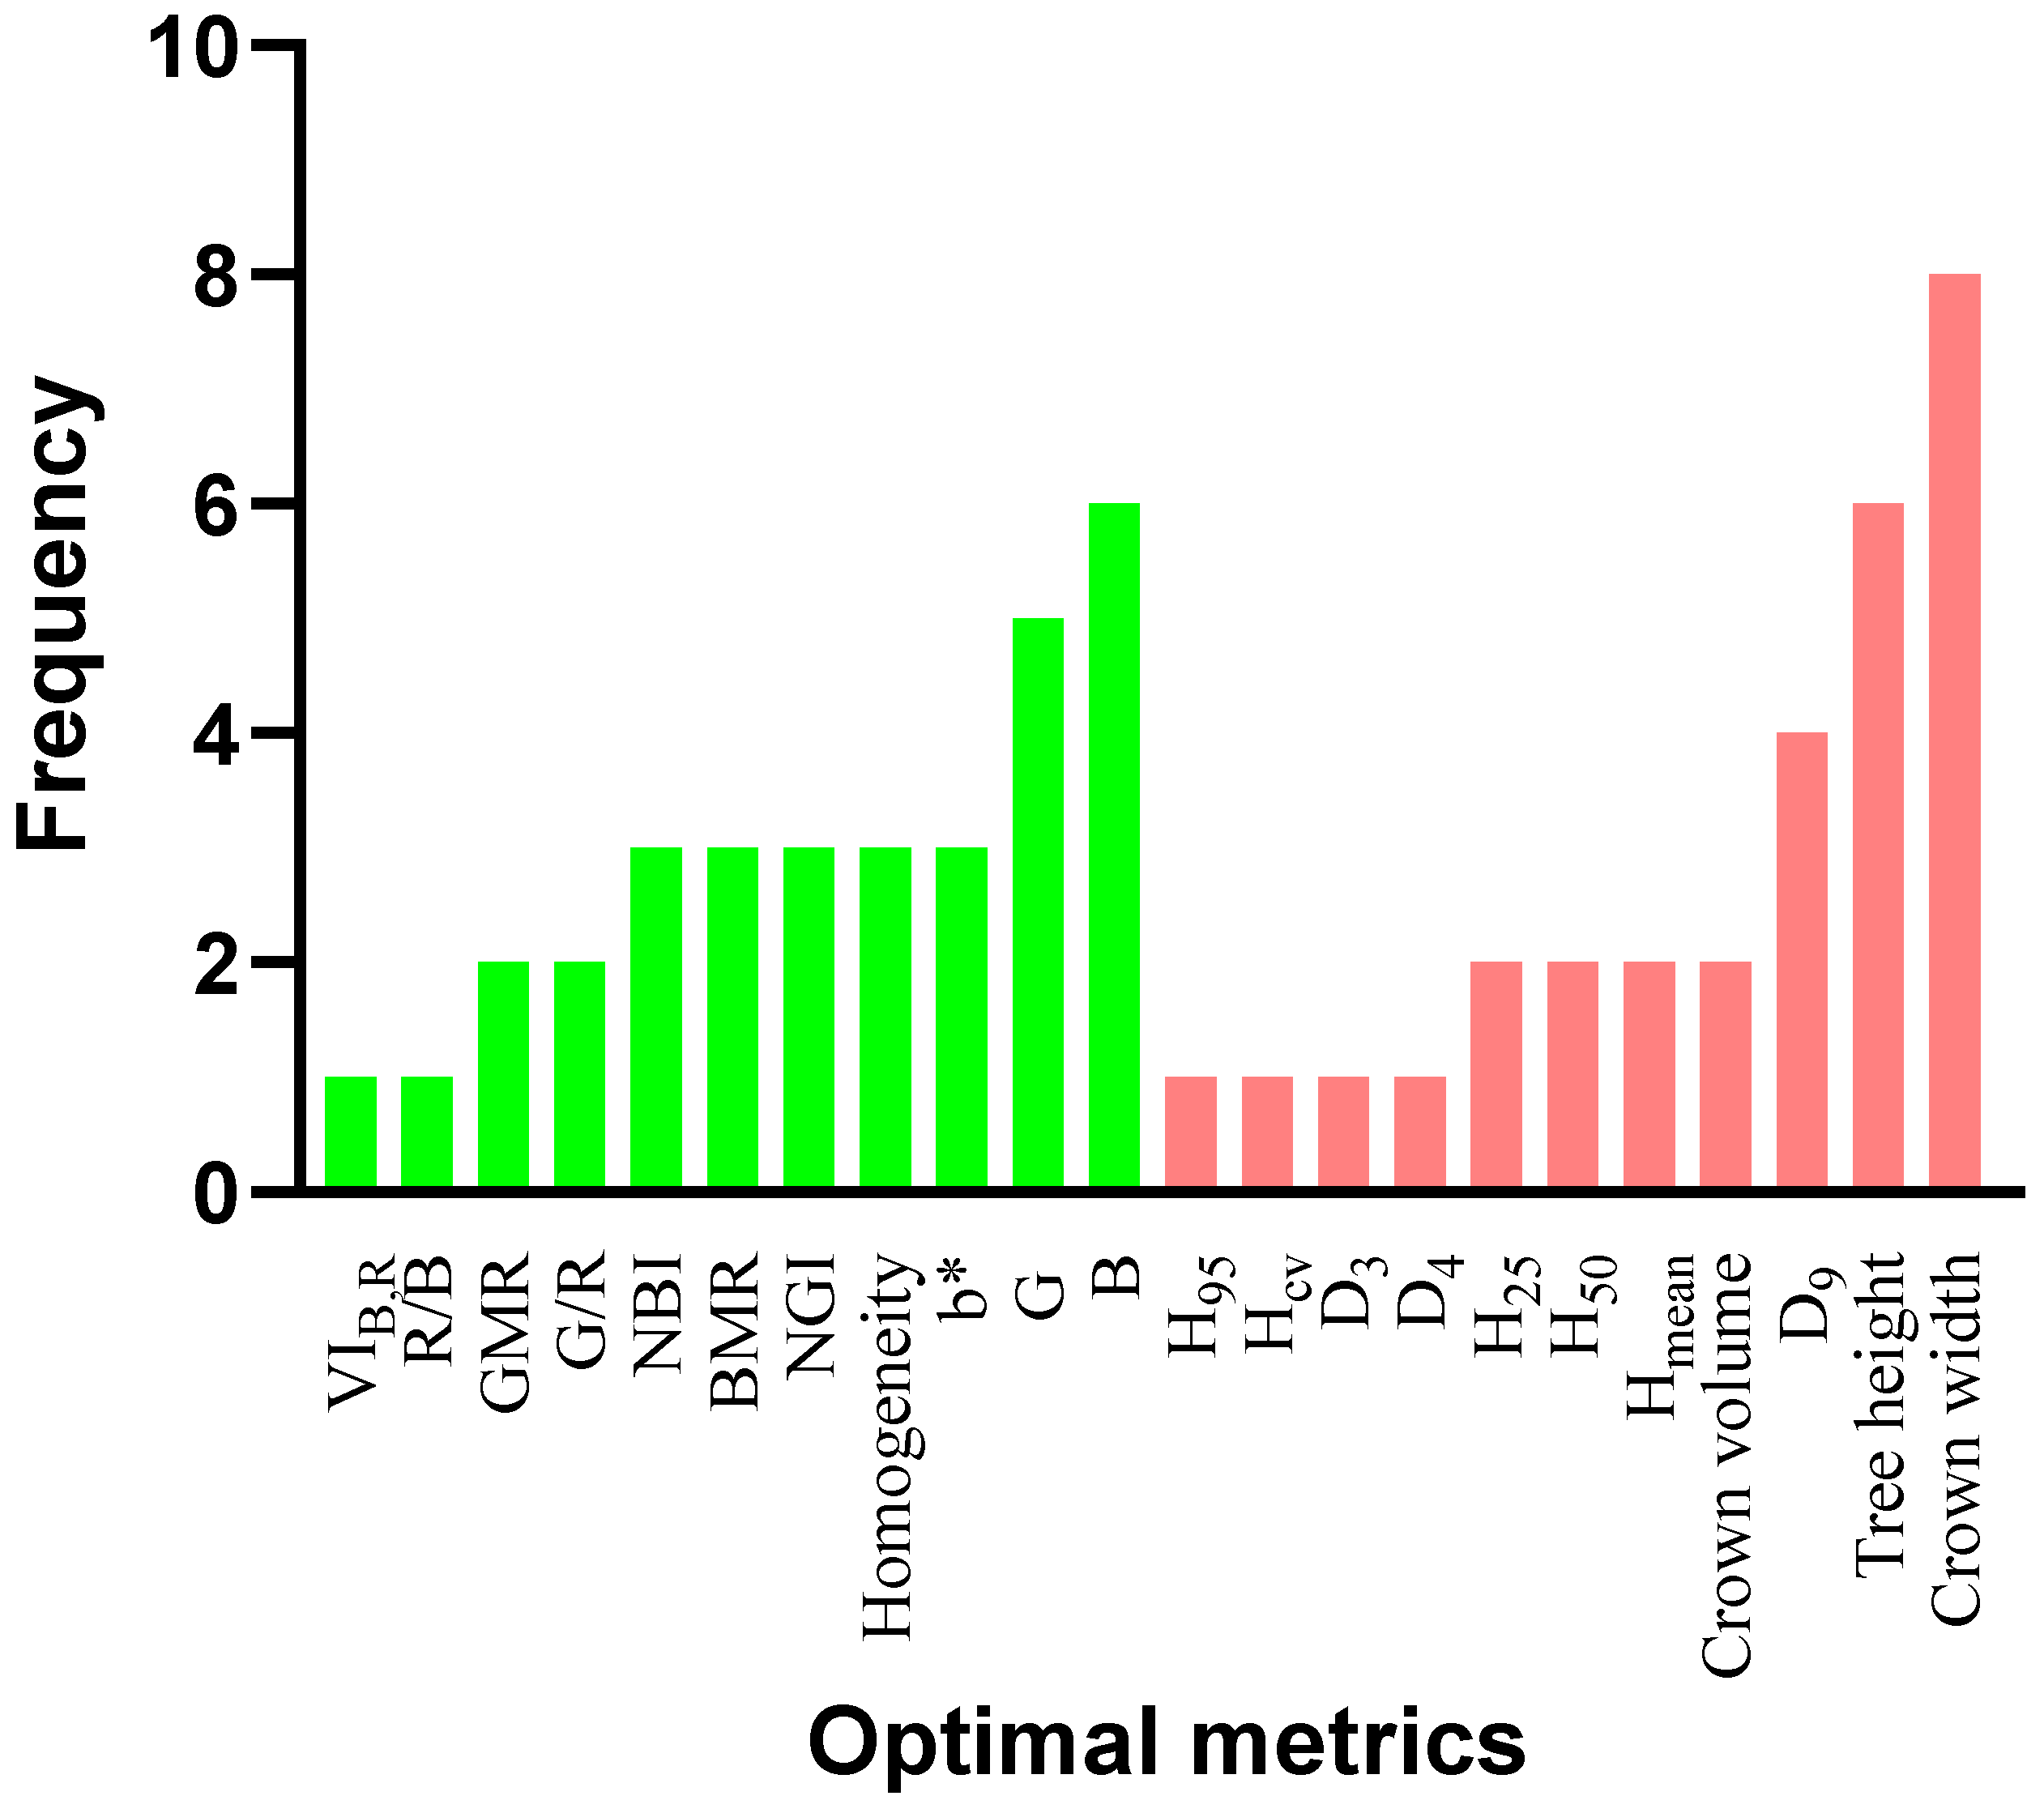
- The commonly selected optimal image and DAP metrics for both PLSR and GPR models included G, B, NGI, Tree height, and Crown width.
Author Contributions
Funding
Data Availability Statement
Acknowledgments
Conflicts of Interest
References
- Shan, J.; Yao, Y. Effects of Different Foliar Fertilizer on the Physiological Characteristics of the Flower Bud of Gingko at Idiophase. J. Shanxi Agric. Univ. 2009, 29, 412–414. [Google Scholar]
- Cao, F. Chinese Ginkgo Biloba; China Forestry Publishing House: Beijing, China, 2007. [Google Scholar]
- Kumar, L.; Mutanga, O. Remote sensing of above-ground biomass. Remote Sens. 2017, 9, 935. [Google Scholar] [CrossRef]
- Kumar, L.; Sinha, P.; Taylor, S.; Alqurashi, A.F. Review of the use of remote sensing for biomass estimation to support renewable energy generation. J. Appl. Remote Sens. 2015, 9, 097696. [Google Scholar] [CrossRef]
- Yang, X.; Zan, M.; Maimaiti, M. Estimation of above ground biomass of Populus euphratica forest using UAV and satellite remote sensing. Trans. CSAE 2021, 37, 77–83. [Google Scholar]
- Wulder, M.A.; White, J.C.; Stinson, G.; Hilker, T.; Kurz, W.A.; Coops, N.C.; St-Onge, B.; Trofymow, J. Implications of differing input data sources and approaches upon forest carbon stock estimation. Environ. Monit. Assess. 2010, 166, 543–561. [Google Scholar] [CrossRef] [PubMed]
- Cao, L.; She, G.; Dai, J.; Xu, J. Status and prospects of the LiDAR-based forest biomass estimation. J. Nanjing For. Univ. 2013, 37, 163–169. [Google Scholar]
- Colomina, I.; Molina, P. Unmanned aerial systems for photogrammetry and remote sensing: A review. ISPRS J. Photogramm. 2014, 92, 79–97. [Google Scholar] [CrossRef]
- Liu, K.; Shen, X.; Cao, L.; Wang, G.; Cao, F. Estimating forest structural attributes using UAV-LiDAR data in Ginkgo plantations. ISPRS J. Photogramm. 2018, 146, 465–482. [Google Scholar] [CrossRef]
- Shi, Y.; Zhou, K.; Shen, X.; Cui, T.; Cao, L. Research progress and prospect on forest tree phenotyping using UAV remote sensing. J. Cent. South Univ. For. Technol. 2023, 43, 13–27. [Google Scholar]
- Zhai, W.; Li, C.; Cheng, Q.; Mao, B.; Li, Z.; Li, Y.; Ding, F.; Qin, S.; Fei, S.; Chen, Z. Enhancing Wheat Above-Ground Biomass Estimation Using UAV RGB Images and Machine Learning: Multi-Feature Combinations, Flight Height, and Algorithm Implications. Remote Sens. 2023, 15, 3653. [Google Scholar] [CrossRef]
- Tao, H.; Xu, L.; Feng, H.; Yang, G.; Yang, X.; Miao, M.; Dai, Y. Estimation of plant height and biomass of winter wheat based on UAV digital image. Trans. CSAE 2019, 35, 107–116. [Google Scholar]
- Lin, J.; Chen, D.; Wu, W.; Liao, X. Estimating aboveground biomass of urban forest trees with dual-source UAV acquired point clouds. Urban For. Urban Green. 2022, 69, 127521. [Google Scholar] [CrossRef]
- Juan-Ovejero, R.; Elghouat, A.; Navarro, C.; Reyes-Martín, M.; Jiménez Morales, M.; Navarro, F.; Alcaraz-Segura, D.; Castro, J. Estimation of aboveground biomass and carbon stocks of Quercus ilex L. saplings using UAV-derived RGB imagery. Ann. For. Sci. 2023, 80, 44. [Google Scholar] [CrossRef]
- Ye, N.; van Leeuwen, L.; Nyktas, P. Analysing the potential of UAV point cloud as input in quantitative structure modelling for assessment of woody biomass of single trees. Int. J. Appl. Earth Obs. Geoinf. 2019, 81, 47–57. [Google Scholar] [CrossRef]
- Fu, X.; Cao, L.; Coops, N.; Goodbody, T.; Liu, H.; Shen, X.; Wu, X. Assessment of approaches for monitoring forest structure dynamics using bi-temporal digital aerial photogrammetry point clouds. Remote Sens. Environ. 2021, 255, 112300. [Google Scholar] [CrossRef]
- Cao, L.; Liu, H.; Fu, X.; Zhang, Z.; Shen, X.; Ruan, H. Comparison of UAV LiDAR and Digital Aerial Photogrammetry Point Clouds for Estimating Forest Structural Attributes in Subtropical Planted Forests. Forests 2019, 10, 145. [Google Scholar] [CrossRef]
- Mao, P.; Qin, L.; Hao, M.; Zhao, W.; Luo, J.; Qiu, X.; Xu, L.; Xiong, Y.; Ran, Y.; Yan, C. An improved approach to estimate above-ground volume and biomass of desert shrub communities based on UAV RGB images. Ecol. Indic. 2021, 125, 107494. [Google Scholar] [CrossRef]
- Lu, N.; Zhou, J.; Han, Z.; Li, D.; Cao, Q.; Yao, X.; Tian, Y.; Zhu, Y.; Cao, W.; Cheng, T. Improved estimation of aboveground biomass in wheat from RGB imagery and point cloud data acquired with a low-cost unmanned aerial vehicle system. Plant Methods 2019, 15, 1–16. [Google Scholar] [CrossRef] [PubMed]
- Niu, Y.; Zhang, L.; Zhang, H.; Han, W.; Peng, X. Estimating above-ground biomass of maize using features derived from UAV-based RGB imagery. Remote Sens. 2019, 11, 1261. [Google Scholar] [CrossRef]
- Xu, Z.; Li, W.; Li, Y.; Shen, X.; Ruan, H. Estimation of secondary forest parameters by integrating image and point cloud-based metrics acquired from unmanned aerial vehicle. J. Appl. Remote Sens. 2020, 14, 022204. [Google Scholar] [CrossRef][Green Version]
- Fan, K.; Hu, M.; Zhao, M.; Qi, L.; Xie, W.; Zou, H.; Wu, B.; Zhao, S.; Wang, X. RMSRGAN: A Real Multispectral Imagery Super-Resolution Reconstruction for Enhancing Ginkgo Biloba Yield Prediction. Forests 2024, 15, 859. [Google Scholar] [CrossRef]
- Jiang, Q.; Fang, S.; Peng, Y.; Gong, Y.; Zhu, R.; Wu, X.; Ma, Y.; Duan, B.; Liu, J. UAV-Based Biomass Estimation for Rice-Combining Spectral, TIN-Based Structural and Meteorological Features. Remote Sens. 2019, 11, 890. [Google Scholar] [CrossRef]
- Verrelst, J.; Alonso, L.; Caicedo, J.P.R.; Moreno, J.; Camps-Valls, G. Gaussian process retrieval of chlorophyll content from imaging spectroscopy data. IEEE J. Sel. Top. Appl. Earth Obs. Remote Sens. 2013, 6, 867–874. [Google Scholar] [CrossRef]
- Tao, S.; Xie, Y.; Luo, J.; Wang, J.; Zhang, L.; Wang, G.; Cao, L. Superior Clone Selection in a Eucalyptus Trial Using Forest Phenotyping Technology via UAV-Based DAP Point Clouds and Multispectral Images. Remote Sens. 2023, 15, 899. [Google Scholar] [CrossRef]
- Li, W.; Guo, Q.; Jakubowski, M.K.; Kelly, M. A new method for segmenting individual trees from the lidar point cloud. Photogramm. Eng. Remote Sens. 2012, 78, 75–84. [Google Scholar] [CrossRef]
- Kawashima, S.; Nakatani, M. An algorithm for estimating chlorophyll content in leaves using a video camera. Ann. Bot. 1998, 81, 49–54. [Google Scholar] [CrossRef]
- Cheng, L.; Zhu, X.; Gao, L.; Li, C.; Wang, L.; Zhao, G.; Jiang, Y. Estimation of Chlorophyll Content in Apple Leaves Based on RGB Model Using Digital Camera. Acta Hortic. Sin. 2017, 44, 381–390. [Google Scholar]
- Tewari, V.; Arudra, A.K.; Kumar, S.P.; Pandey, V.; Chandel, N.S. Estimation of plant nitrogen content using digital image processing. Agric. Eng. Int. CIGR J. 2013, 15, 78–86. [Google Scholar]
- Santos, D.A.E.; Daniela, V.S.; Letícia, D.A.; Cristina, S.A.; Carla, D.N.; Schramm, M.M. Relationships between reflectance and absorbance chlorophyll indices with RGB (Red, Green, Blue) image components in seedlings of tropical tree species at nursery stage. New For. 2018, 50, 377–388. [Google Scholar]
- Fu, Y.; Guijun, Y.; Li, Z.; Song, X.; Li, Z.; Xu, X.; Wang, P.; Zhao, C. Winter Wheat Nitrogen Status Estimation Using UAV-Based RGB Imagery and Gaussian Processes Regression. Remote Sens. 2020, 12, 3778. [Google Scholar] [CrossRef]
- Saberioon, M.; Amin, M.; Anuar, A.; Gholizadeh, A.; Wayayok, A.; Khairunniza-Bejo, S. Assessment of rice leaf chlorophyll content using visible bands at different growth stages at both the leaf and canopy scale. Int. J. Appl. Earth Obs. Geoinf. 2014, 32, 35–45. [Google Scholar] [CrossRef]
- Gonzalez, R.C.; Woods, R.E. Digital Image Processing; Pearson Education Inc.: New York, NY, USA, 2018. [Google Scholar]
- Shi, P.; Wang, Y.; Xu, J.; Zhao, Y.; Yang, B.; Yuan, Z.; Sun, Q. Rice nitrogen nutrition estimation with RGB images and machine learning methods. Comput. Electron. Agric. 2020, 180, 105860. [Google Scholar] [CrossRef]
- Zhao, X.; Guo, Q.; Su, Y.; Xue, B. Improved progressive TIN densification filtering algorithm for airborne LiDAR data in forested areas. ISPRS J. Photogramm. 2016, 117, 79–91. [Google Scholar] [CrossRef]
- Zhou, K.; Cao, L.; Yin, S.; Wang, G.; Cao, F. An advanced bidirectional reflectance factor (BRF) spectral approach for estimating flavonoid content in leaves of Ginkgo plantations. ISPRS J. Photogramm. 2022, 193, 1–16. [Google Scholar] [CrossRef]
- Zhou, K.; Cao, L.; Liu, H.; Zhang, Z.; Wang, G.; Cao, F. Estimation of volume resources for planted forests using an advanced LiDAR and hyperspectral remote sensing. Resour. Conserv. Recycl. 2022, 185, 106485. [Google Scholar] [CrossRef]
- Zhou, K.; Cheng, T.; Zhu, Y.; Cao, W.; Ustin, S.L.; Zheng, H.; Yao, X.; Tian, Y. Assessing the Impact of Spatial Resolution on the Estimation of Leaf Nitrogen Concentration Over the Full Season of Paddy Rice Using Near-Surface Imaging Spectroscopy Data. Front. Plant Sci. 2018, 9, 964. [Google Scholar] [CrossRef]
- Verrelst, J.; Muñoz, J.; Alonso, L.; Delegido, J.; Rivera, J.P.; Camps-Valls, G.; Moreno, J. Machine learning regression algorithms for biophysical parameter retrieval: Opportunities for Sentinel-2 and-3. Remote Sens. Environ. 2012, 118, 127–139. [Google Scholar] [CrossRef]
- Verrelst, J.; Rivera, J.P.; Gitelson, A.; Delegido, J.; Moreno, J.; Camps-Valls, G. Spectral band selection for vegetation properties retrieval using Gaussian processes regression. Int. J. Appl. Earth Obs. Geoinf. 2016, 52, 554–567. [Google Scholar] [CrossRef]
- Verrelst, J.; Malenovský, Z.; Van der Tol, C.; Camps-Valls, G.; Gastellu-Etchegorry, J.-P.; Lewis, P.; North, P.; Moreno, J. Quantifying vegetation biophysical variables from imaging spectroscopy data: A review on retrieval methods. Surv. Geophys. 2019, 40, 589–629. [Google Scholar] [CrossRef]
- Vaglio Laurin, G.; Chen, Q.; Lindsell, J.A.; Coomes, D.A.; Frate, F.D.; Guerriero, L.; Pirotti, F.; Valentini, R. Above ground biomass estimation in an African tropical forest with lidar and hyperspectral data. ISPRS J. Photogramm. 2014, 89, 49–58. [Google Scholar] [CrossRef]
- Zhu, X.; Liu, D. Improving forest aboveground biomass estimation using seasonal Landsat NDVI time-series. ISPRS J. Photogramm. 2015, 102, 222–231. [Google Scholar] [CrossRef]
- Inoue, Y.; Sakaiya, E.; Zhu, Y.; Takahashi, W. Diagnostic mapping of canopy nitrogen content in rice based on hyperspectral measurements. Remote Sens. Environ. 2012, 126, 210–221. [Google Scholar] [CrossRef]
- Wang, Z.; Townsend, P.; Schweiger, A.; Couture, J.; Singh, A.; Hobbie, S.; Cavender-Bares, J. Mapping foliar functional traits and their uncertainties across three years in a grassland experiment. Remote Sens. Environ. 2018, 221, 405–416. [Google Scholar] [CrossRef]
- Wu, J.; Ying, Y.; Cao, F.; Zhang, W. Effects of nitrogen application on leaf output and flavone content in ginkgo leaves. J. Zhejiang For. Coll. 2002, 19, 372–375. [Google Scholar]
- Wang, Y.; Wang, D.; Zhang, G.; Wang, J. Estimating nitrogen status of rice using the image segmentation of G-R thresholding method. Field Crops Res. 2013, 149, 33–39. [Google Scholar] [CrossRef]
- Wang, Y.; Wang, D.; Shi, P.; Omasa, K. Estimating rice chlorophyll content and leaf nitrogen concentration with a digital still color camera under natural light. Plant Methods 2014, 10, 36. [Google Scholar] [CrossRef]
- Escolà, A.; Peña, J.M.; López-Granados, F.; Rosell-Polo, J.R.; de Castro, A.I.; Gregorio, E.; Jiménez-Brenes, F.M.; Sanz, R.; Sebé, F.; Llorens, J. Mobile terrestrial laser scanner vs. uav photogrammetry to estimate woody crop canopy parameters–part 1: Methodology and comparison in vineyards. Comput. Electron. Agric. 2023, 212, 108109. [Google Scholar] [CrossRef]
- Torres-Sánchez, J.; Escolà, A.; De Castro, A.I.; López-Granados, F.; Rosell-Polo, J.R.; Sebé, F.; Jiménez-Brenes, F.M.; Sanz, R.; Gregorio, E.; Peña, J.M. Mobile terrestrial laser scanner vs. UAV photogrammetry to estimate woody crop canopy parameters–Part 2: Comparison for different crops and training systems. Comput. Electron. Agric. 2023, 212, 108083. [Google Scholar] [CrossRef]
- Li, M.; Shamshiri, R.R.; Schirrmann, M.; Weltzien, C.; Shafian, S.; Laursen, M.S. UAV oblique imagery with an adaptive micro-terrain model for estimation of leaf area index and height of maize canopy from 3D point clouds. Remote Sens. 2022, 14, 585. [Google Scholar] [CrossRef]
- Buunk, T.; Vélez, S.; Ariza-Sentís, M.; Valente, J. Comparing nadir and oblique thermal imagery in UAV-based 3D crop water stress index applications for precision viticulture with LiDAR validation. Sensors 2023, 23, 8625. [Google Scholar] [CrossRef]
- Tian, L.; Wu, X.; Tao, Y.; Li, M.; Qian, C.; Liao, L.; Fu, W. Review of remote sensing-based methods for forest aboveground biomass estimation: Progress, challenges, and prospects. Forests 2023, 14, 1086. [Google Scholar] [CrossRef]
- Svendsen, D.H.; Morales-Álvarez, P.; Ruescas, A.B.; Molina, R.; Camps-Valls, G. Deep Gaussian Processes for Biogeophysical Parameter Retrieval and Model Inversion. ISPRS J. Photogramm. 2020, 166, 68–81. [Google Scholar] [CrossRef] [PubMed]
- Feilhauer, H.; Asner, G.P.; Martin, R.E. Multi-method ensemble selection of spectral bands related to leaf biochemistry. Remote Sens. Environ. 2015, 164, 57–65. [Google Scholar] [CrossRef]



| UAV | Sensors | Flight Heights | Remote Sensing Metrics | Estimation Method | Monitoring Levels | Plant Species |
|---|---|---|---|---|---|---|
| Octocopter | Cyber-shot DSC- QX10 | 55 m | Color parameters | MLR | Plot-level AGB | Wheat [12] |
| DJI Phantom 3 and 4 | FC350 and FC6310 | 30 m | Color parameters; Height-related metrics | MLM | Plot-level AGB | Wheat [19] |
| DJI Phantom 4 PRO | FC6310 | 30 m | Color parameters; Height-related metrics | MLR | Plot-level AGB | Maize [20] |
| DJI MAVIC 3M | Hasselblad L2D-20c | 30 m, 60 m and 90 m | Color parameters; Texture features; Height-related metrics | MLM | Plot-level AGB | Wheat [11] |
| E-DO (A fixed-wing UAV) | Canon EOS 5D Mark II | 800 m | Color parameters; Height-related metrics; Density-related metrics | MLR | Plot-level AGB | Beech and paper mulberry trees [21] |
| E-DO (A fixed-wing UAV) | Canon EOS 5D Mark II | 500 m | Height-related metrics; Density-related metrics | MLR | Plot-level AGB | Dawn redwood and poplar trees [16]; Dawn redwood and poplar trees [17] |
| DJI Phantom 4 PRO and 4 Advanced | FC6310 | 40 m | Structural parameters | AE | Individual crown-level AGB | Dawn redwood trees [13]; Holm oak saplings [14] |
| DJI Phantom 4 | FC6310 | 20 m | Structural parameters | AE | Individual crown-level wood biomass | American sweetgum [15] |
| DJI Phantom 4 PRO | FC6310 | 10 m | Color parameters; Texture features; Structural parameters | MLR | Individual crown-level AGB | Desert shrub [18] |
| Metrics Type | Characteristic Parameters | Calculation Formula | Reference |
|---|---|---|---|
| Single-band metrics | R | Red | [27] |
| G | Green | [27] | |
| B | Blue | [27] | |
| Ratio metrics | G/R | G/R | [28] |
| G/B | G/B | [28] | |
| R/B | R/B | [28] | |
| Normalized metrics | NRI | R/(R + G + B) | [27,29] |
| NGI | G/(R + G + B) | [27,29] | |
| NBI | B/(R + G + B) | [27,29] | |
| VIG,R | (G − R)/(G + R) | [29,30] | |
| VIG,B | (G − B)/(G + B) | [29,31] | |
| VIB,R | (B − R)/(B + R) | [29,30] | |
| VARI | (NGI − NRI)/(NGI + NRI-NBI) | [32] | |
| GLI | (2 × NGI − NBI − NRI)/(2 × NGI + NBI + NRI) | [32] | |
| Difference metrics | GMR | G − R | [28,29] |
| GMB | G − B | [28,29] | |
| BMR | B − R | [28,29] | |
| ExG | 2 × NGI − NRI − NBI | [32] | |
| ExR | 1.4 × NRI − NGI | [32] | |
| ExGR | ExG − ExR | [32] | |
| HSI color model metrics | H | arccos [0.5 × [(R − G) + (R − B)]/[(R − G)2 +(R − B)(G − B)]0.5] | [33] |
| S | 1 − (3 × [min(R, G, B)])/(R + G + B) | [33] | |
| I | (R + G + B)/3 | [33] | |
| Lab color model metrics | L* | 116 × (0.299R + 0.587G + 0.114B)1/3 -16 | [31,34] |
| a* | 500 × [1.006 × (0.607R + 0.174G + 0.201B)1/3 − (0.299R + 0.587G + 0.114B)1/3] | [31,34] | |
| b* | 200 × [(0.299R + 0.587G + 0.114B)1/3 − 0.846 × (0.066G + 1.117B)]1/3 | [31,34] |
| Parameters | Value Settings |
|---|---|
| Grid size (m) | 0.0826 |
| Buffer size (pixels) | 50 |
| Height above ground point (m) | 0.4 |
| Smallest tree height (m) | 0.78 |
| Parameters | Meaning |
|---|---|
| Tree height | The height for individual segmented saplings derived from DAP point clouds |
| Crown width | The crown width for individual segmented saplings derived from DAP point clouds |
| Crown area | The crown area for individual segmented saplings derived from DAP point clouds |
| Crown volume | The crown volume for individual segmented saplings derived from DAP point clouds |
| Metrics Name | Meaning |
|---|---|
| Height-related metrics | |
| H25 | The 25th, 50th, 75th, and 95th percentiles of the canopy height distributions for the first returns within the statistical cell of individual sapling crowns |
| H50 | |
| H75 | |
| H95 | |
| Hcv | The coefficient of variation (CV) represents the variability of Z-values across all points within a specific statistical cell of individual sapling crowns |
| Hmean | The average height is calculated by taking the mean of all the heights of all first returns within a specific statistical cell of individual sapling crowns |
| Density-related metrics | |
| D3 | The proportion of points exceeding the 30th, 40th, 50th, 70th, and 90th quantiles to the total number of points within a specific statistical cell of individual sapling crowns |
| D4 | |
| D5 | |
| D7 | |
| D9 |
| Height | N0 (Number = 105) | N2 (Number = 105) | N4 (Number = 106) | |||||||||
|---|---|---|---|---|---|---|---|---|---|---|---|---|
| CD | OE | CE | DT | CD | OE | CE | DT | CD | OE | CE | DT | |
| 30 m | 105 (100.00%) | 0 (0.00%) | 2 (1.90%) | 0 (0.00%) | 104 (99.05%) | 1 (0.95%) | 3 (2.86%) | 1 (0.95%) | 106 (100.00%) | 0 (0.00%) | 1 (0.94%) | 1 (0.94%) |
| 60 m | 98 (93.33%) | 7 (6.67%) | 4 (3.81%) | 0 (0.00%) | 99 (94.29%) | 6 (5.71%) | 3 (2.86%) | 1 (0.95%) | 98 (92.45%) | 8 (7.55%) | 2 (1.89%) | 2 (1.89%) |
| 90 m | 81 (77.14%) | 24( 22.86%) | 5 (4.76%) | 2 (1.90%) | 92 (87.62%) | 13 (12.38%) | 3 (2.86%) | 1 (0.95%) | 86 (81.13%) | 20 (18.87%) | 5 (4.72%) | 2 (1.89%) |
| Image Metrics | AL_30m | AL_60m | AL_90m | BL_30m | BL_60m | BL_90m | DL_30m | DL_60m | DL_90m |
|---|---|---|---|---|---|---|---|---|---|
| Color parameters | |||||||||
| R | −0.58 ** | −0.62 ** | −0.59 ** | −0.47 ** | −0.46 ** | −0.40 * | −0.60 ** | −0.61 ** | −0.56 ** |
| G | −0.54 ** | −0.54 ** | −0.53 ** | −0.51 ** | −0.40 * | −0.35 * | −0.61 ** | −0.46 ** | −0.46 ** |
| B | −0.23 | −0.41 * | −0.47 ** | −0.20 | −0.18 | −0.15 | −0.38 * | −0.34 * | −0.37 * |
| NRI | −0.62 ** | −0.69 ** | −0.60 ** | −0.39 * | −0.53 ** | −0.56 ** | −0.56 ** | −0.69 ** | −0.65 ** |
| NGI | 0.41 * | 0.64 ** | 0.55 ** | −0.15 | 0.01 | 0.01 | 0.27 * | 0.45 ** | 0.43* |
| NBI | 0.57 ** | 0.53 ** | 0.24 | 0.54 ** | 0.56 ** | 0.49 ** | 0.53 ** | 0.53 ** | 0.38 * |
| G/R | 0.61 ** | 0.73 ** | 0.62 ** | 0.23 | 0.37 * | 0.37 * | 0.48 ** | 0.65 ** | 0.59 ** |
| G/B | −0.49 ** | −0.34 * | 0.06 | −0.54 ** | −0.45 ** | −0.36 * | −0.40 * | −0.27 | −0.07 |
| R/B | −0.60 ** | −0.62 ** | −0.46 ** | −0.51 ** | −0.58 ** | −0.57 ** | −0.59 ** | −0.65 ** | −0.58 ** |
| VIG,R | 0.61 ** | 0.73 ** | 0.62 ** | 0.23 | 0.37 * | 0.37 * | 0.49 ** | 0.65 ** | 0.60 ** |
| VIG,B | −0.49 ** | −0.34 * | 0.08 | −0.54 ** | −0.45 ** | −0.36 * | −0.40 * | −0.26 | −0.07 |
| VIB,R | 0.60 ** | 0.62 ** | 0.45 ** | 0.50 ** | 0.58 ** | 0.57 ** | 0.57 ** | 0.64 ** | 0.57 ** |
| GMR | 0.59 ** | 0.71 ** | 0.63 ** | 0.22 | 0.37 * | 0.36 * | 0.43 * | 0.60 ** | 0.58 ** |
| GMB | −0.59 ** | −0.54 ** | −0.43 * | −0.62 ** | −0.50 ** | −0.47 ** | −0.68 ** | −0.48 ** | −0.47 ** |
| BMR | 0.61 ** | 0.64 ** | 0.60 ** | 0.52 ** | 0.57 ** | 0.56 ** | 0.63 ** | 0.68 ** | 0.66 ** |
| H | 0.62 ** | 0.72 ** | 0.61 ** | 0.23 | 0.36 * | 0.35 * | 0.51 ** | 0.65 ** | 0.60 ** |
| S | −0.60 ** | −0.62 ** | −0.44 ** | −0.50 ** | −0.58 ** | −0.57 ** | −0.57 ** | −0.64 ** | −0.56 ** |
| I | −0.54 ** | −0.57 ** | −0.56 ** | −0.45 ** | −0.39 * | −0.33 * | −0.58 ** | −0.52 ** | −0.49 ** |
| L* | −0.55 ** | −0.57 ** | −0.56 ** | −0.49 ** | −0.41 * | −0.35 * | −0.60 ** | −0.52 ** | −0.50 ** |
| a* | −0.58 ** | −0.73 ** | −0.62 ** | −0.08 | −0.24 | −0.22 | −0.39 * | −0.56 ** | −0.53 ** |
| b* | −0.60 ** | −0.59 ** | −0.47 ** | −0.59 ** | −0.56 ** | −0.53 ** | −0.66 ** | −0.59 ** | −0.57 ** |
| ExG | 0.41 * | 0.64 ** | 0.55 ** | −0.15 | 0.01 | 0.01 | 0.27 * | 0.45 ** | 0.43 * |
| ExR | −0.61 ** | −0.72 ** | −0.63 ** | −0.27 * | −0.41 * | −0.42 * | −0.50 ** | −0.66 ** | −0.61 ** |
| ExGR | 0.57 ** | 0.72 ** | 0.60 ** | 0.07 | 0.22 | 0.20 | 0.40 * | 0.58 ** | 0.53 ** |
| VARI | 0.61 ** | 0.73 ** | 0.62 ** | 0.23 | 0.37 * | 0.37 * | 0.48 ** | 0.65 ** | 0.59 ** |
| GLI | 0.41 * | 0.64 ** | 0.55 ** | −0.15 | 0.01 | 0.01 | 0.27 * | 0.45 ** | 0.43 * |
| Texture parameters | |||||||||
| Mean | 0.55 ** | −0.58 ** | 0.57 ** | 0.47 ** | −0.41 * | 0.35 * | 0.59 ** | −0.53 ** | 0.51 ** |
| Variance | −0.01 | −0.17 | −0.02 | 0.05 | 0.24 | 0.27 * | −0.03 | −0.09 | 0.15 |
| Homogeneity | 0.04 | 0.21 | 0.01 | −0.01 | −0.13 | −0.19 | 0.12 | 0.25 | 0.01 |
| Contrast | 0.02 | −0.16 | −0.08 | 0.13 | 0.25 | 0.12 | −0.03 | −0.18 | −0.02 |
| Dissimilarity | 0.00 | −0.18 | −0.07 | 0.10 | 0.20 | 0.14 | −0.06 | −0.23 | −0.03 |
| Entropy | 0.04 | −0.09 | 0.14 | 0.00 | 0.11 | 0.18 | −0.18 | −0.22 | 0.10 |
| Second Moment | −0.06 | 0.09 | −0.15 | 0.00 | −0.09 | −0.20 | 0.20 | 0.19 | −0.15 |
| Correlation | −0.29 * | −0.08 | 0.13 | −0.34 * | −0.10 | 0.29 * | −0.31 * | −0.22 | 0.14 |
| DAP Metrics | Correlation Coefficients (r) |
|---|---|
| Structural parameters | |
| Tree height | 0.74 ** |
| Crown width | 0.72 ** |
| Crown area | 0.69 ** |
| Crown volume | 0.68 ** |
| Height-related metrics | |
| H25 | 0.40 * |
| H50 | 0.45 ** |
| H75 | 0.50 ** |
| H95 | 0.61 ** |
| Hcv | 0.42 * |
| Hmean | 0.53 ** |
| Density-related metrics | |
| D3 | 0.26 |
| D4 | 0.31 * |
| D5 | 0.18 |
| D7 | 0.08 |
| D9 | −0.37 * |
| Metrics | PLSR Models | GPR Models | ||||||
|---|---|---|---|---|---|---|---|---|
| CV-R2 | RMSE (g/Plant) | rRMSE (%) | SelectedMetrics | CV-R2 | RMSE (g/Plant) | rRMSE (%) | Selected Metrics | |
| Image_AL_30m | 0.33 | 17.01 | 45.12 | B, NBI | 0.33 | 17.00 | 45.09 | BMR |
| Image_AL_60m | 0.51 | 14.49 | 38.44 | BMR, VIB,R, G, B, NGI, GMR, Homogeneity | 0.57 | 13.57 | 35.99 | B, GMR, Homogeneity |
| Image_AL_90m | 0.38 | 16.34 | 43.36 | b*, R/B, B, G/R | 0.40 | 16.05 | 42.58 | BMR, b*, NBI, G/R |
| DAP_30m | 0.62 | 12.85 | 34.10 | Tree height, Crown width, H25, H95, Hcv, Hmean, D9 | 0.60 | 13.05 | 34.63 | Tree height, Crown width, D4 |
| Image_AL_30m+DAP_30m | 0.62 | 12.77 | 33.87 | NBI, Tree height, Crown width, Crown volume, D9 | 0.64 | 12.44 | 32.99 | G, B, Crown width, H50 |
| Image_AL_60m+DAP_30m | 0.71 | 11.18 | 29.67 | NGI, Homogeneity, Tree height, Crown width, D9 | 0.79 | 9.63 | 25.56 | G, NGI, Homogeneity, Crown width, H25, Hmean |
| Image_AL_90m+DAP_30m | 0.65 | 12.32 | 32.68 | G, B, Tree height, Crown width, Crown volume, D3, D9 | 0.67 | 11.95 | 31.69 | G, Tree height, Crown width, H50 |
Disclaimer/Publisher’s Note: The statements, opinions and data contained in all publications are solely those of the individual author(s) and contributor(s) and not of MDPI and/or the editor(s). MDPI and/or the editor(s) disclaim responsibility for any injury to people or property resulting from any ideas, methods, instructions or products referred to in the content. |
© 2024 by the authors. Licensee MDPI, Basel, Switzerland. This article is an open access article distributed under the terms and conditions of the Creative Commons Attribution (CC BY) license (https://creativecommons.org/licenses/by/4.0/).
Share and Cite
Qiu, S.; Zhu, X.; Zhang, Q.; Tao, X.; Zhou, K. Enhanced Estimation of Crown-Level Leaf Dry Biomass of Ginkgo Saplings Based on Multi-Height UAV Imagery and Digital Aerial Photogrammetry Point Cloud Data. Forests 2024, 15, 1720. https://doi.org/10.3390/f15101720
Qiu S, Zhu X, Zhang Q, Tao X, Zhou K. Enhanced Estimation of Crown-Level Leaf Dry Biomass of Ginkgo Saplings Based on Multi-Height UAV Imagery and Digital Aerial Photogrammetry Point Cloud Data. Forests. 2024; 15(10):1720. https://doi.org/10.3390/f15101720
Chicago/Turabian StyleQiu, Saiting, Xingzhou Zhu, Qilin Zhang, Xinyu Tao, and Kai Zhou. 2024. "Enhanced Estimation of Crown-Level Leaf Dry Biomass of Ginkgo Saplings Based on Multi-Height UAV Imagery and Digital Aerial Photogrammetry Point Cloud Data" Forests 15, no. 10: 1720. https://doi.org/10.3390/f15101720
APA StyleQiu, S., Zhu, X., Zhang, Q., Tao, X., & Zhou, K. (2024). Enhanced Estimation of Crown-Level Leaf Dry Biomass of Ginkgo Saplings Based on Multi-Height UAV Imagery and Digital Aerial Photogrammetry Point Cloud Data. Forests, 15(10), 1720. https://doi.org/10.3390/f15101720


