Article

Vegetation History Characteristics of Planted Forests in Japan: Analysis of the 1960 World Census of Agriculture and Forestry

1
Graduate School of Bioresource and Bioenvironmental Sciences, Kyushu University, Fukuoka 819-0395, Japan
2
Faculty of Agriculture, Kyushu University, Fukuoka 819-0395, Japan
*
Authors to whom correspondence should be addressed.
Forests 2024, 15(1), 59; https://doi.org/10.3390/f15010059
Submission received: 27 November 2023 / Revised: 18 December 2023 / Accepted: 24 December 2023 / Published: 28 December 2023

Abstract

:
This study aimed to clarify the vegetation history of planted forests that are still in use today by comparing the types of land afforested in 1960 with the post-war afforestation period in Japan’s Hokkaido, Kyushu, and Kinki regions. It was during that time that the majority of the planted forest in these regions was established. We calculated the afforestation ratios (afforested area of each type of land/total afforested area) for the smallest survey unit, the 1950 administrative sections, using data from the 1960 World Agriculture and Forestry Census on the afforested areas of various types of land (i.e., deforested areas resulting from natural forests, deforested areas resulting from planted forests, and areas other than forests). The afforestation ratios were then sorted into ten categories for each municipality in the three regions and mapped using GIS. The analysis results showed that the vegetation history in Kyushu, even within the same municipality, was frequently mixed in 1960; in Hokkaido, the afforestation ratio for deforested areas resulting from natural forests was extremely high, while the afforestation ratio for deforested areas resulting from planted forests was low. In contrast, the Kinki region has a low afforestation ratio for non-forest regions. This study provides useful information for ecosystem management.

1. Introduction

There have been significant changes in the forest landscape during the Anthropocene. There was a sudden change in Asia. For instance, with the large amount of forest loss occurring in Cambodia, forest area is decreasing at approximately 166,000 ha per year [1]. Malaysia lost 8.12 ha of forest between 2000 and 2019 (28% for the year 2000) [2]. Following World War II, the Japanese archipelago underwent major changes. Since 1955, the Japanese government has promoted afforestation by converting existing natural forests into planted forests as part of a “long-term comprehensive economic plan” [3]. As a result of these policies, planted forests made up of cedar and cypress are found in the temperate zone in west Japan. Planted forest made up of larch are mainly found in the boreal zone in north Japan. Now, Japan’s forests cover about 25 million hectares, which accounts for two-thirds of the national land area. About 40% of them are planted forests [4].
Nowadays, wood production is increasing [5] as the accumulation of Japan’s planted forest is increasing [4]. Additionally, climate change is expected to cause an average temperature increase of 2.5–3.5 °C and a 5% increase in annual rainfall by the end of the 21st century (2076–2095) compared with the end of the 20th century (1980–1999), as well as an increase in the frequency of short-term intense rainfall and heavy rain [6]. In Japan, forests play an important role in the preservation of land by protecting soil and water sources. They help prevent and mitigate mountain disasters such as landslides and floods [4]. Therefore, it is crucial to carefully consider land use decisions for deforested areas, taking into account future changes in climate. Natural regeneration is gaining popularity as a land use option for deforested areas; however it is influenced by the amount of buried seed, which is determined by the planted forest’s vegetation history (referred to as “vegetation history” hereafter) [7]. Moreover, in Japan, the increasing population of Sika deer (Cervus nippon) has become a major social problem, as deer cause the most forest damage [8]. Japanese Sika deer have a major impact on vegetation and can inhibit forest regeneration because they eat a wide variety of foods and congregate in groups [9]. Therefore, understanding the vegetation history of planted forests is necessary when selecting natural regeneration as a land use option following felling. It is suggested that the expansion of afforestation has provided a suitable environment for Shika deer and that their numbers have increased [10]. Thus, understanding the vegetation history of planted forests can help clarify forest landscapes and reveal the source of current wildlife damage, which is important for ecological conservation. Global ecosystem modification has occurred rapidly since the end of the 20th century, resulting in the degradation of many ecosystem services [11]. These ecosystem changes can be recognized as changes in land cover and landscape at the regional level [12]. Therefore, understanding changes in forest landscapes as a result of land use change is critical when evaluating changes in ecosystem services at a regional level [13].
When considering ecosystem conservation, having an understanding of the vegetation history of each region’s planted forests can be helpful in recognizing how the changes in land use in various areas have affected the forest landscape. Prior research on landscape ecology, geography, and rural planning has documented cases of changes in the landscape and land use of mountainous areas (for example, the Sendai River basin in Tottori Prefecture [14], Moroga Village in Tottori Prefecture [15], the Hitotsugawa upstream area in Kyushu Mountains [13], Oguni Town in Kumamoto Prefecture [16], Kuroiwa Village in Ashikita Town, Kumamoto Prefecture [17], Higashisefuri Village in Saga Prefecture [18], Omogo Village in Ehime Prefecture [19], Hiwa Town in Hiroshima Prefecture [20], Kukino in Minamata City [21], and the mid-stream area of the Aritagawa River in Wakayama Prefecture [22]). According to these studies, abandoned grasslands, forests left after fuelwood harvesting during the energy revolution, logging areas for wood processing plants, slash-and-burn areas, and poorly conditioned terraces have all been used to develop planted forests. However, these studies did not quantitatively analyze the vegetation history of planted forests. A regional study [23] examined the progress of afforestation on a prefecture-by-prefecture basis. Although it clarified the characteristics of human-induced changes in terrestrial ecosystems by defining disturbed biomes as anthropogenic and analyzing land use change globally using the HYDE data model, which is a comprehensive database that compiles past global environmental data with an emphasis on demographic and land use changes [24], it did not analyze vegetation history. Land use and land cover changes in Japan from 1900 to 1985 were investigated using the Geographic Information System (GIS) based on the Land Use Information System (LUIS) dataset [25], but no systematic vegetation history analysis was performed. The vegetation history on a prefecture-by-prefecture basis [23] was considered coarse because of the influence of natural environmental factors, such as altitude and slope [26]. In addition, mixed broadleaf forests and planted cedar and cypress forests were allocated as mixed forests [25]. This makes accurate analysis of the vegetation history of planted forests difficult.
Based on previous studies, this study aims to capture vegetation history at the macro level, rather than focusing on a single region as a case study. This study examines the vegetation history of land use on a municipal unit basis used in 1950 to determine the differences in vegetation history between regions. A previous study classified Kyushu’s vegetation history in 1960 into municipalities with afforestation rates greater than 50% as natural forest conversion, reforestation, and non-forestry conversion types and municipalities with afforestation rates less than 50% as mixed type [27]. Despite comparisons with other regions, mainly Hokkaido and Kinki, the vegetation history analysis remained an approximation. We compare the vegetation histories of Hokkaido and Kyushu, which currently produce a substantial volume of raw materials, with that of Kinki, an area where raw material production is now low, despite being considered a forestry region from pre-modern times.
In this study, we identify the patterns of land use change in 1960 in more detail by categorizing them into ten groups and comparing the vegetation history of the three regions using classifications based on afforestation rates as a reference [27]. By clarifying the vegetation history of planted forests in the three regions established after World War II, this study provides useful information for determining the land use of clear-cut areas.

2. Materials and Methods

2.1. Study Region

The study focuses on three regions of Japan: Hokkaido, Kyushu, and Kinki (Figure 1). Kyushu is Japan’s main island in the west. It consists of seven prefectures: Fukuoka, Saga, Nagasaki, Oita, Kumamoto, Miyazaki, and Kagoshima. Kinki is one of the Japanese regions in Honshu Island, Japan’s largest island. Kinki consists of six prefectures: Osaka, Kyoto, Nara, Shiga, Wakayama, and Hyogo. Kyushu and Kinki are in the temperate zone. Hokkaido is one of the main islands in northern Japan. It is in the boreal zone. It has been developed by the government since the late 19th century. At the time of the study in 2022, Hokkaido and Kyushu accounted for approximately 40% of the total national raw material production, with 2850 million m3 and 4825 million m3, respectively [28]. Despite the growth of intensive forestry from pre-modern times to the present and the same climate and vegetation as Kyushu, Kinki has a relatively low raw material production of 746 million m3 (about 4% of the total) [28].

2.2. The 1960 World Census of Agriculture and Forestry

The analysis relied on data from the 1960 World Census of Agriculture and Forestry (hereafter, the ‘60-year census’). The 60-year census is officially known as “Forest Region Survey by City and Town in the 1960 World Agricultural and Forestry Census”. The survey aimed to understand local aspects such as forest areas, government afforestation areas, forest plantation areas, and major tree species. This study used the Area by Type of Afforested Land dataset in the 60-year census to analyze pre-afforestation conditions. The dataset is based on a survey conducted on all forests, including state and private forests, from April 1959 to March 1960. The unit of area is “cho”, which is approximately 0.99 hectares. The pre-afforestation areas were divided into three categories: (1) deforested areas of natural forests, (2) deforested areas of planted forests, and (3) land outside the mountains (hereafter referred to as non-forest land). This allowed us to understand the many types of afforested land. The census defined territory beyond the mountains as “low-vegetation land, such as meadows and unplanted land planned to become forest, arable land, and residential land”. Although the 60-year census and the 1970 World Agricultural and Forestry Census (hereafter referred to as the “70-year census”) surveyed the location of afforestation, the survey unit of the 70-year census was municipalities from 1970 onwards following the Showa-era municipal mergers. Therefore, using data from the 60-year census, it is possible to generate a more detailed vegetation history than by using the 70-year census. Timber harvesting and afforestation were near their peaks in Japan’s post-war reforestation program in 1960 [29]. Today, the area of 12th-stage planted forests, including 60-year-old planted forests, accounts for approximately 14% of the entire area of planted forests, reaching approximately 1.4 million hectares [30]. Therefore, it is possible to quantitatively assess the vegetation history of planted forests established at the peak of post-war reforestation in Japan by analyzing data from the 60-year census.

2.3. Study Area

The study area was set at administrative districts (referred to as “50-year districts”), which are the smallest survey units in the 60-year census, to understand the vegetation history at a smaller geographical scale than the prefecture level. This corresponds to the Meiji administrative villages before the Great Showa Consolidation. In 1950, Hokkaido had 276 municipalities, Kyushu had 1306 municipalities, and Kinki had 1220 municipalities. Table 1 presents the minimum, median, average, and maximum areas of the 50-year districts in each region based on the data of municipalities in the 60-year census. There was no significant difference between Kyushu and Kinki in the minimum and median areas of the 50-year districts. However, the minimum and median sizes of the 50-year districts in Hokkaido were approximately ten times larger than those of the other two regions.

2.4. Data Analysis Process

In this study, the vegetation history was analyzed using the following procedures:

2.4.1. Digitization

The 60-year census data on afforested areas of different land categories in Hokkaido, Kinki, and Kyushu regions were manually entered and digitized using Microsoft Excel for Microsoft 365 MSO version 2302 (Redmond, WA, USA). The data were saved in the CSV format. Each land classification in the 60-year census was designated as (1) natural forest clear-cut land, (2) planted forest clear-cut land, and (3) non-mountainous forest.

2.4.2. Calculation and Graphing of Afforestation Percentages for Old Towns and Municipalities

In 1950, afforestation percentages for different land classes in each old town and municipality were calculated as the ratio of afforested areas to the total afforested area. The formula for the afforestation rate is as follows: Afforestation Rate = {(Area afforested for different land classes/Total afforested area) × 100}. A ternary graph was created to depict the differences in vegetation history between the three regions using the three factors defined in the 60-year census. The ternary graph was created using Microsoft Excel.

2.4.3. Classification of Afforestation Rates

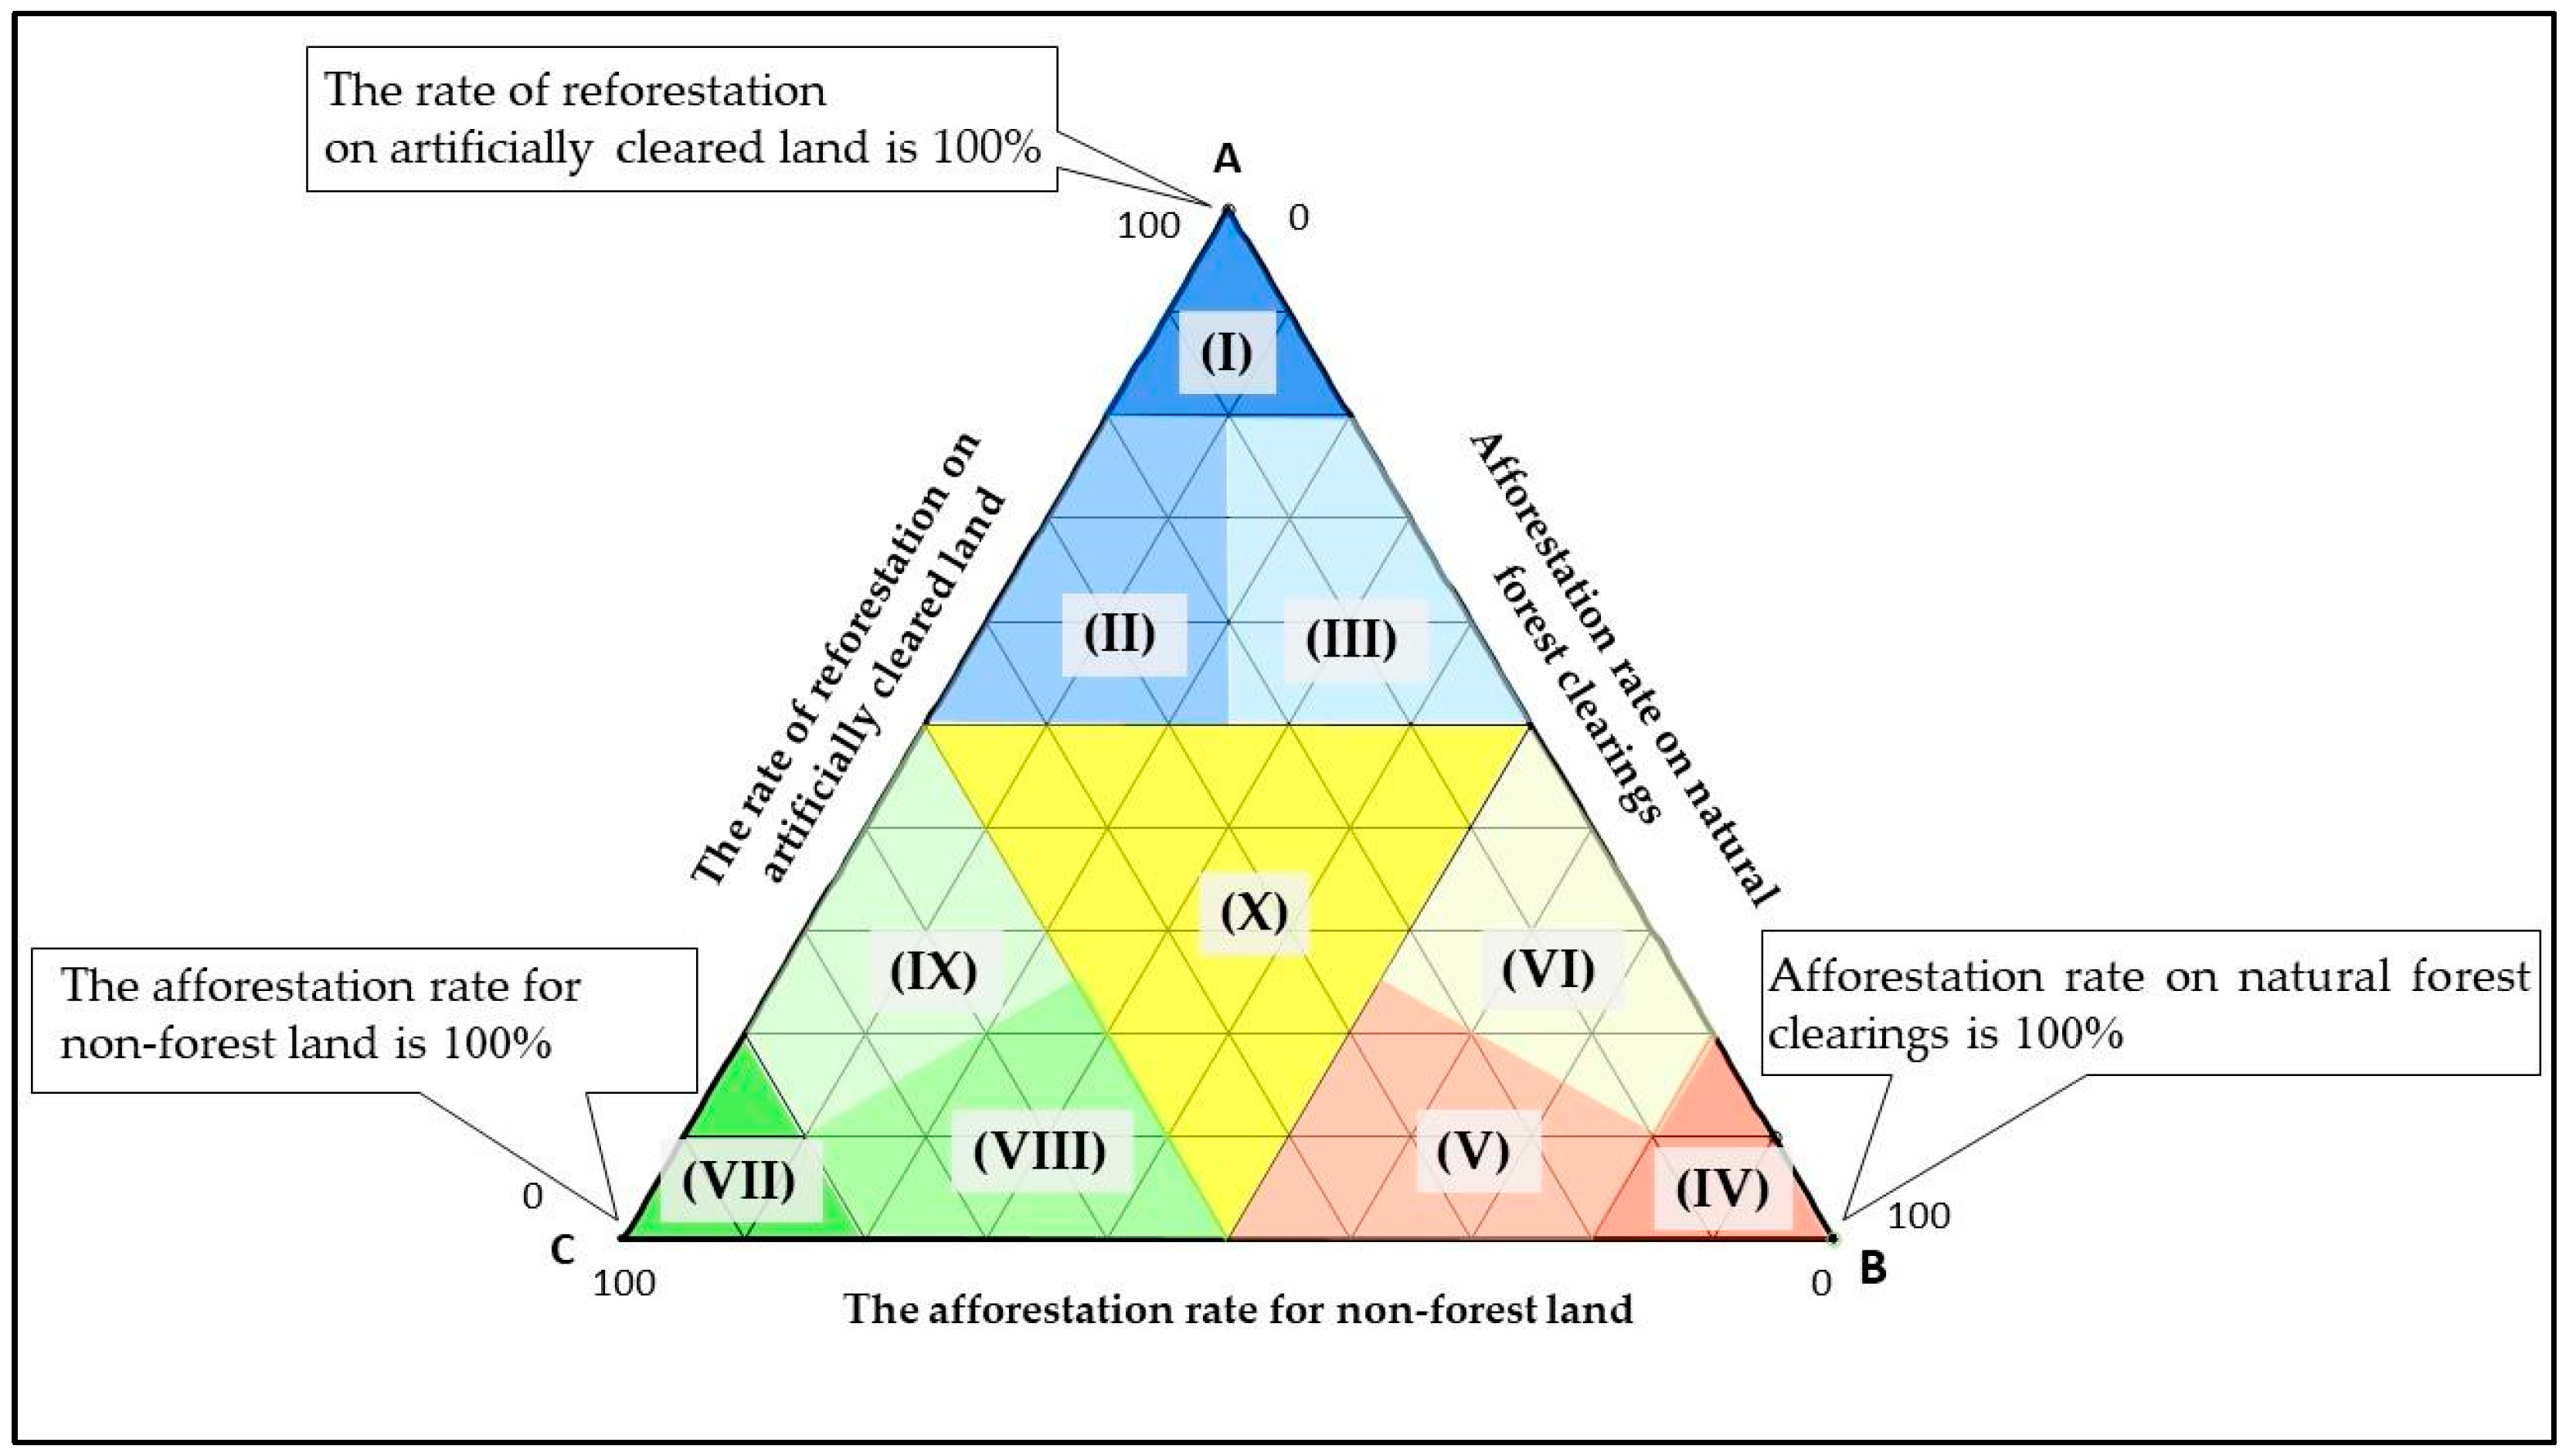
The municipalities in the three regions were classified into the following 10 categories based on the percentage of afforestation (Figure 2):
   I.
Planted forest specialization: municipalities with a reforestation rate of more than 80 percent in areas cleared of planted forest;
  II.
Planted forest and non-forest land: municipalities where the reforestation rate in planted forest harvesting areas is greater than 50% but less than or equal to 80%, and where the reforestation rate in areas other than mountain forests is higher than the reforestation rate in natural forest harvesting areas;
 III.
Planted forest and natural forest: municipalities having a planted forest reforestation rate greater than 50% but less than or equal to 80%, and natural forest reforestation rates greater than that in non-forest land;
  IV.
Natural forest specialization: municipalities with an afforestation percentage of more than 80% for clear-cut natural forest land;
   V.
Natural forest and non-forest land: municipalities where the reforestation rate on natural forest harvesting sites is greater than 50% but less than or equal to 80%, and where the reforestation rate in areas other than non-forest land is higher than the rate on planted forest harvesting sites;
  VI.
Natural forest and planted forest: municipalities where the reforestation rate of natural forest areas is greater than 50% but less than or equal to 80%, and where the reforestation rate of planted forest areas is higher than the rate in areas other than mountain forests;
 VII.
Non-forest land specialization: municipalities where the afforestation percentage for non-forest land other than planted forest clear-cut land is greater than 80%;
VIII.
Non-forest land and natural forest: municipalities where the reforestation rate in areas other than mountain forests is greater than 50% but less than or equal to 80%, and where the reforestation rate in natural forest harvesting areas is greater than that in planted forest harvesting areas;
  IX.
Non-forest land and planted forest: municipalities where the reforestation rate in areas other than mountain forests is greater than 50% but less than or equal to 80%, and where the reforestation rate in planted forest harvesting areas is higher than in natural forest harvesting areas;
   X.
Mix: municipalities with afforestation rates of 50% or less for each land classification.
Mixed-type municipalities refer to those with reforestation on different types of land. Municipalities with zero reforestation areas or missing data are categorized as “others”.
Figure 2. The ten categories of vegetation history.
Forests 15 00059 g002

2.4.4. Mapping of Afforestation Percentages

The afforestation area data in CSV format were combined with the data from the 50-year administrative districts and tables based on city, town, and village names and mapped in ArcGIS Pro (Esri, Redlands, CA, USA) using geographic information systems. Polygons for the 50-year administrative districts were obtained from the Ministry of Land, Infrastructure, Transport, and Tourism’s National Land Information [31]. The coordinate system for maps in Kyushu used the rectangular and plane coordinate systems (zone 2), whereas that for Hokkaido used the rectangular and plane coordinate systems (zone 12), and Kinki used the rectangular and plane coordinate systems (zone 6).

2.4.5. Calculation of Grassland Area and Utilization Rates in the Three Regions

To understand the afforestation situation outside of mountainous areas, the total area (measured in towns) of “non-forested wilderness” and “unforested land with trees” for each city, town, and village listed in the 60-year census was added together and the “grassland area” was calculated for each region. Additionally, the “utilization rate of grassland” for each region was calculated by adding together the areas designated for “haying and grazing” in “non-forested wilderness” and “unforested land with trees”.

3. Results

Ternary graphs and maps of the three regions are shown in Figure 3 (Hokkaido), Figure 4 (Kyushu), and Figure 5 (Kinki).

3.1. Characteristics of the Planted Forest Vegetation History in Hokkaido
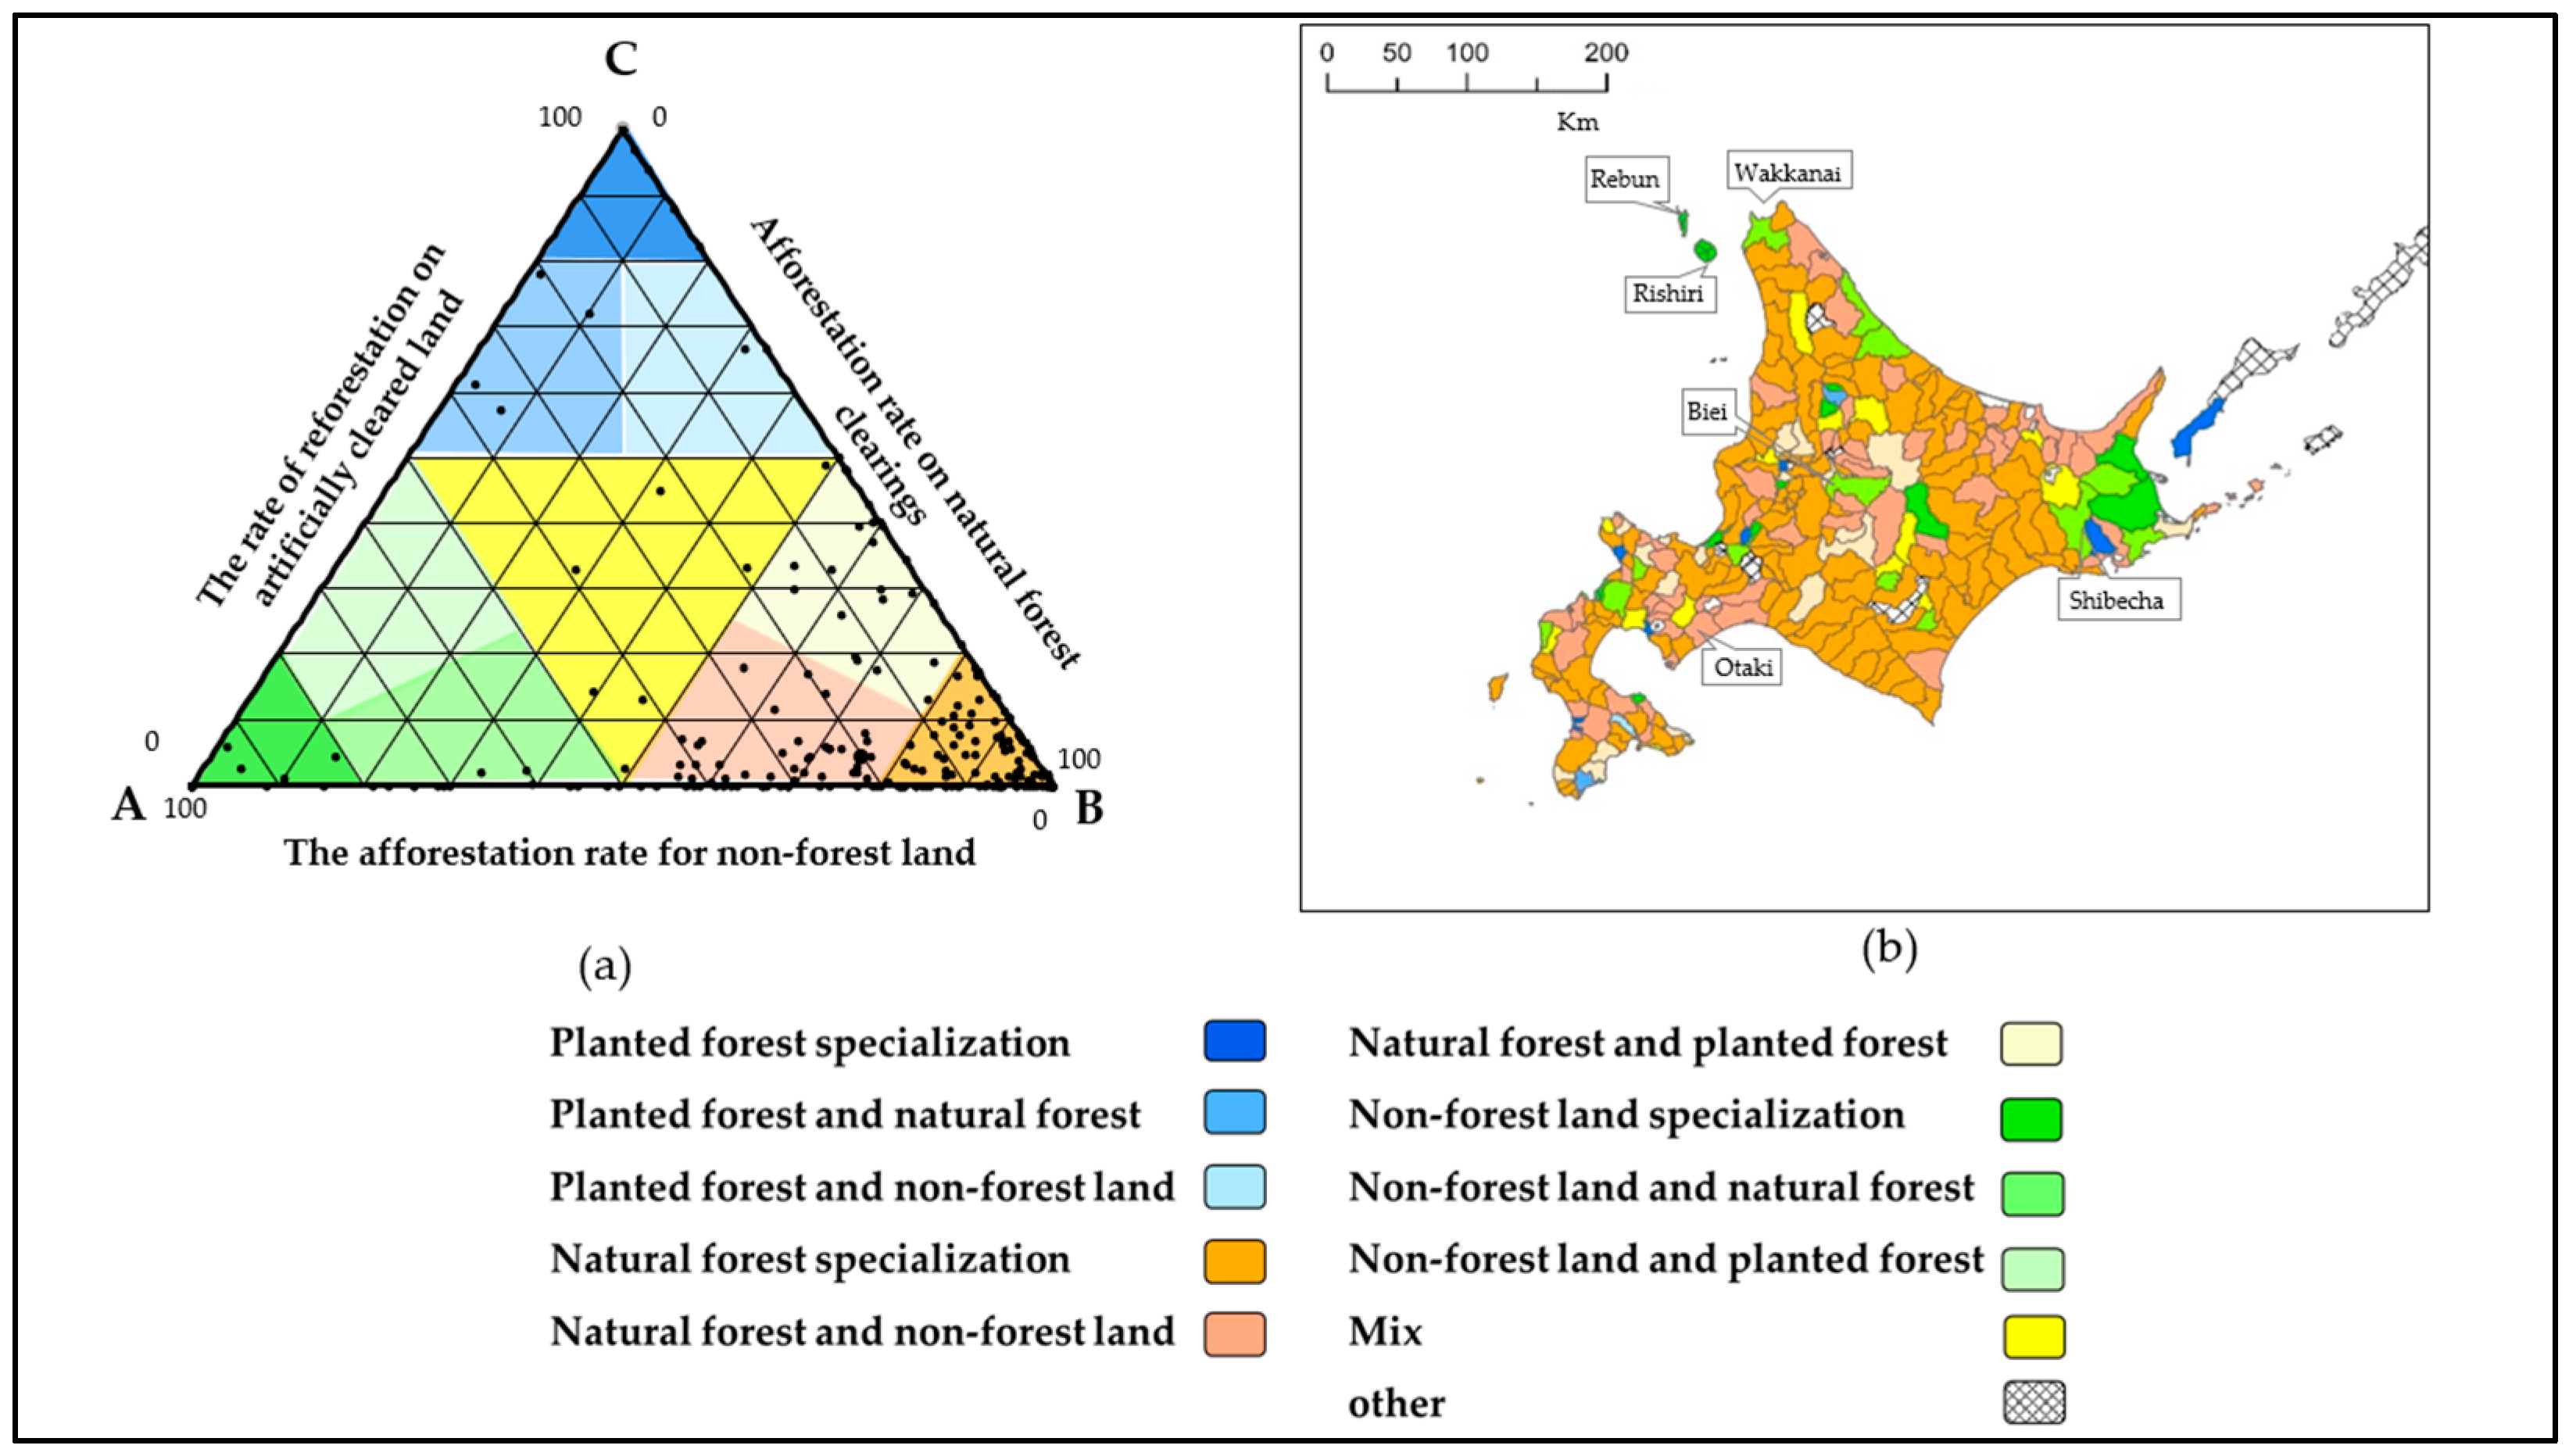
According to the 60-year census, the total afforested area of Hokkaido was approximately 59,370 ha. Over the entire Hokkaido region, the percentage of afforested land per category was 20% non-forest land, 4% reforestation, and approximately 76% for natural forest logging sites. This indicates a high percentage of forest conversion. Conversely, Figure 3, which displays the percentage of afforested land by category for each former city and town, indicates that approximately 80% of the 276 municipalities in Hokkaido are located in the B-side area, which corresponds to the area where afforestation on natural forest clearings exceeds 50% (Sections (IV), (V) and (VI)). In addition, 50% (137 municipalities) of these areas are in Section (IV), which specializes in the afforestation of natural forest clearings. Section (V), which includes natural forest and non-forest land, accounts for 21% of the total (59 municipalities), while Section (VI), which includes natural forests and planted forests, accounts for approximately 7% (19 municipalities). Only 18 municipalities were located in the A-side area, where afforestation on non-forest land exceeded 50% (Sections (I), (II), and (III)), in contrast to the right corner of the triangular graph (Figure 3). Therefore, in 1960, the proportion of afforestation for planted forest clearings was lower than that for natural forest clearings in Hokkaido.
Figure 3. Map of Hokkaido: (a) Ternary graph; (b) Distribution maps for each category.
Forests 15 00059 g003
According to the map in Figure 3b, Section (IV), which specializes in natural forests, is widely distributed in Hokkaido. Section (V) consists of natural forest and non-forest land and is distributed in the eastern part of the Soya, Abashiri, and Iburi Regions, as well as the Oshima Peninsula. Sections (VII) and (VIII) are non-forest land and natural forest, and non-forest land beyond forest, respectively, and are concentrated around Wakkanai, the Rebun and Rishiri Islands, and the Nemuro Plateau.
Based on these findings, the following characteristic features of the vegetation history of Hokkaido are proposed: first, there is a large percentage (approximately 50%) of Section (IV) natural forest specialization and Section (V) natural forests and non-forest land (approximately 21%); second, compared with that of others, the proportion of Section (I) planted forest specialization (approximately 0.02%), Section (II) planted forest and non-forest land (approximately 0.01%), and Section (III) planted forest and natural forests (approximately 0.004%) was lower; third, the rate of reforestation in Hokkaido’s planted forests was lower than that in other regions.

3.2. Characteristics of the Planted Forest Vegetation History in Kyushu
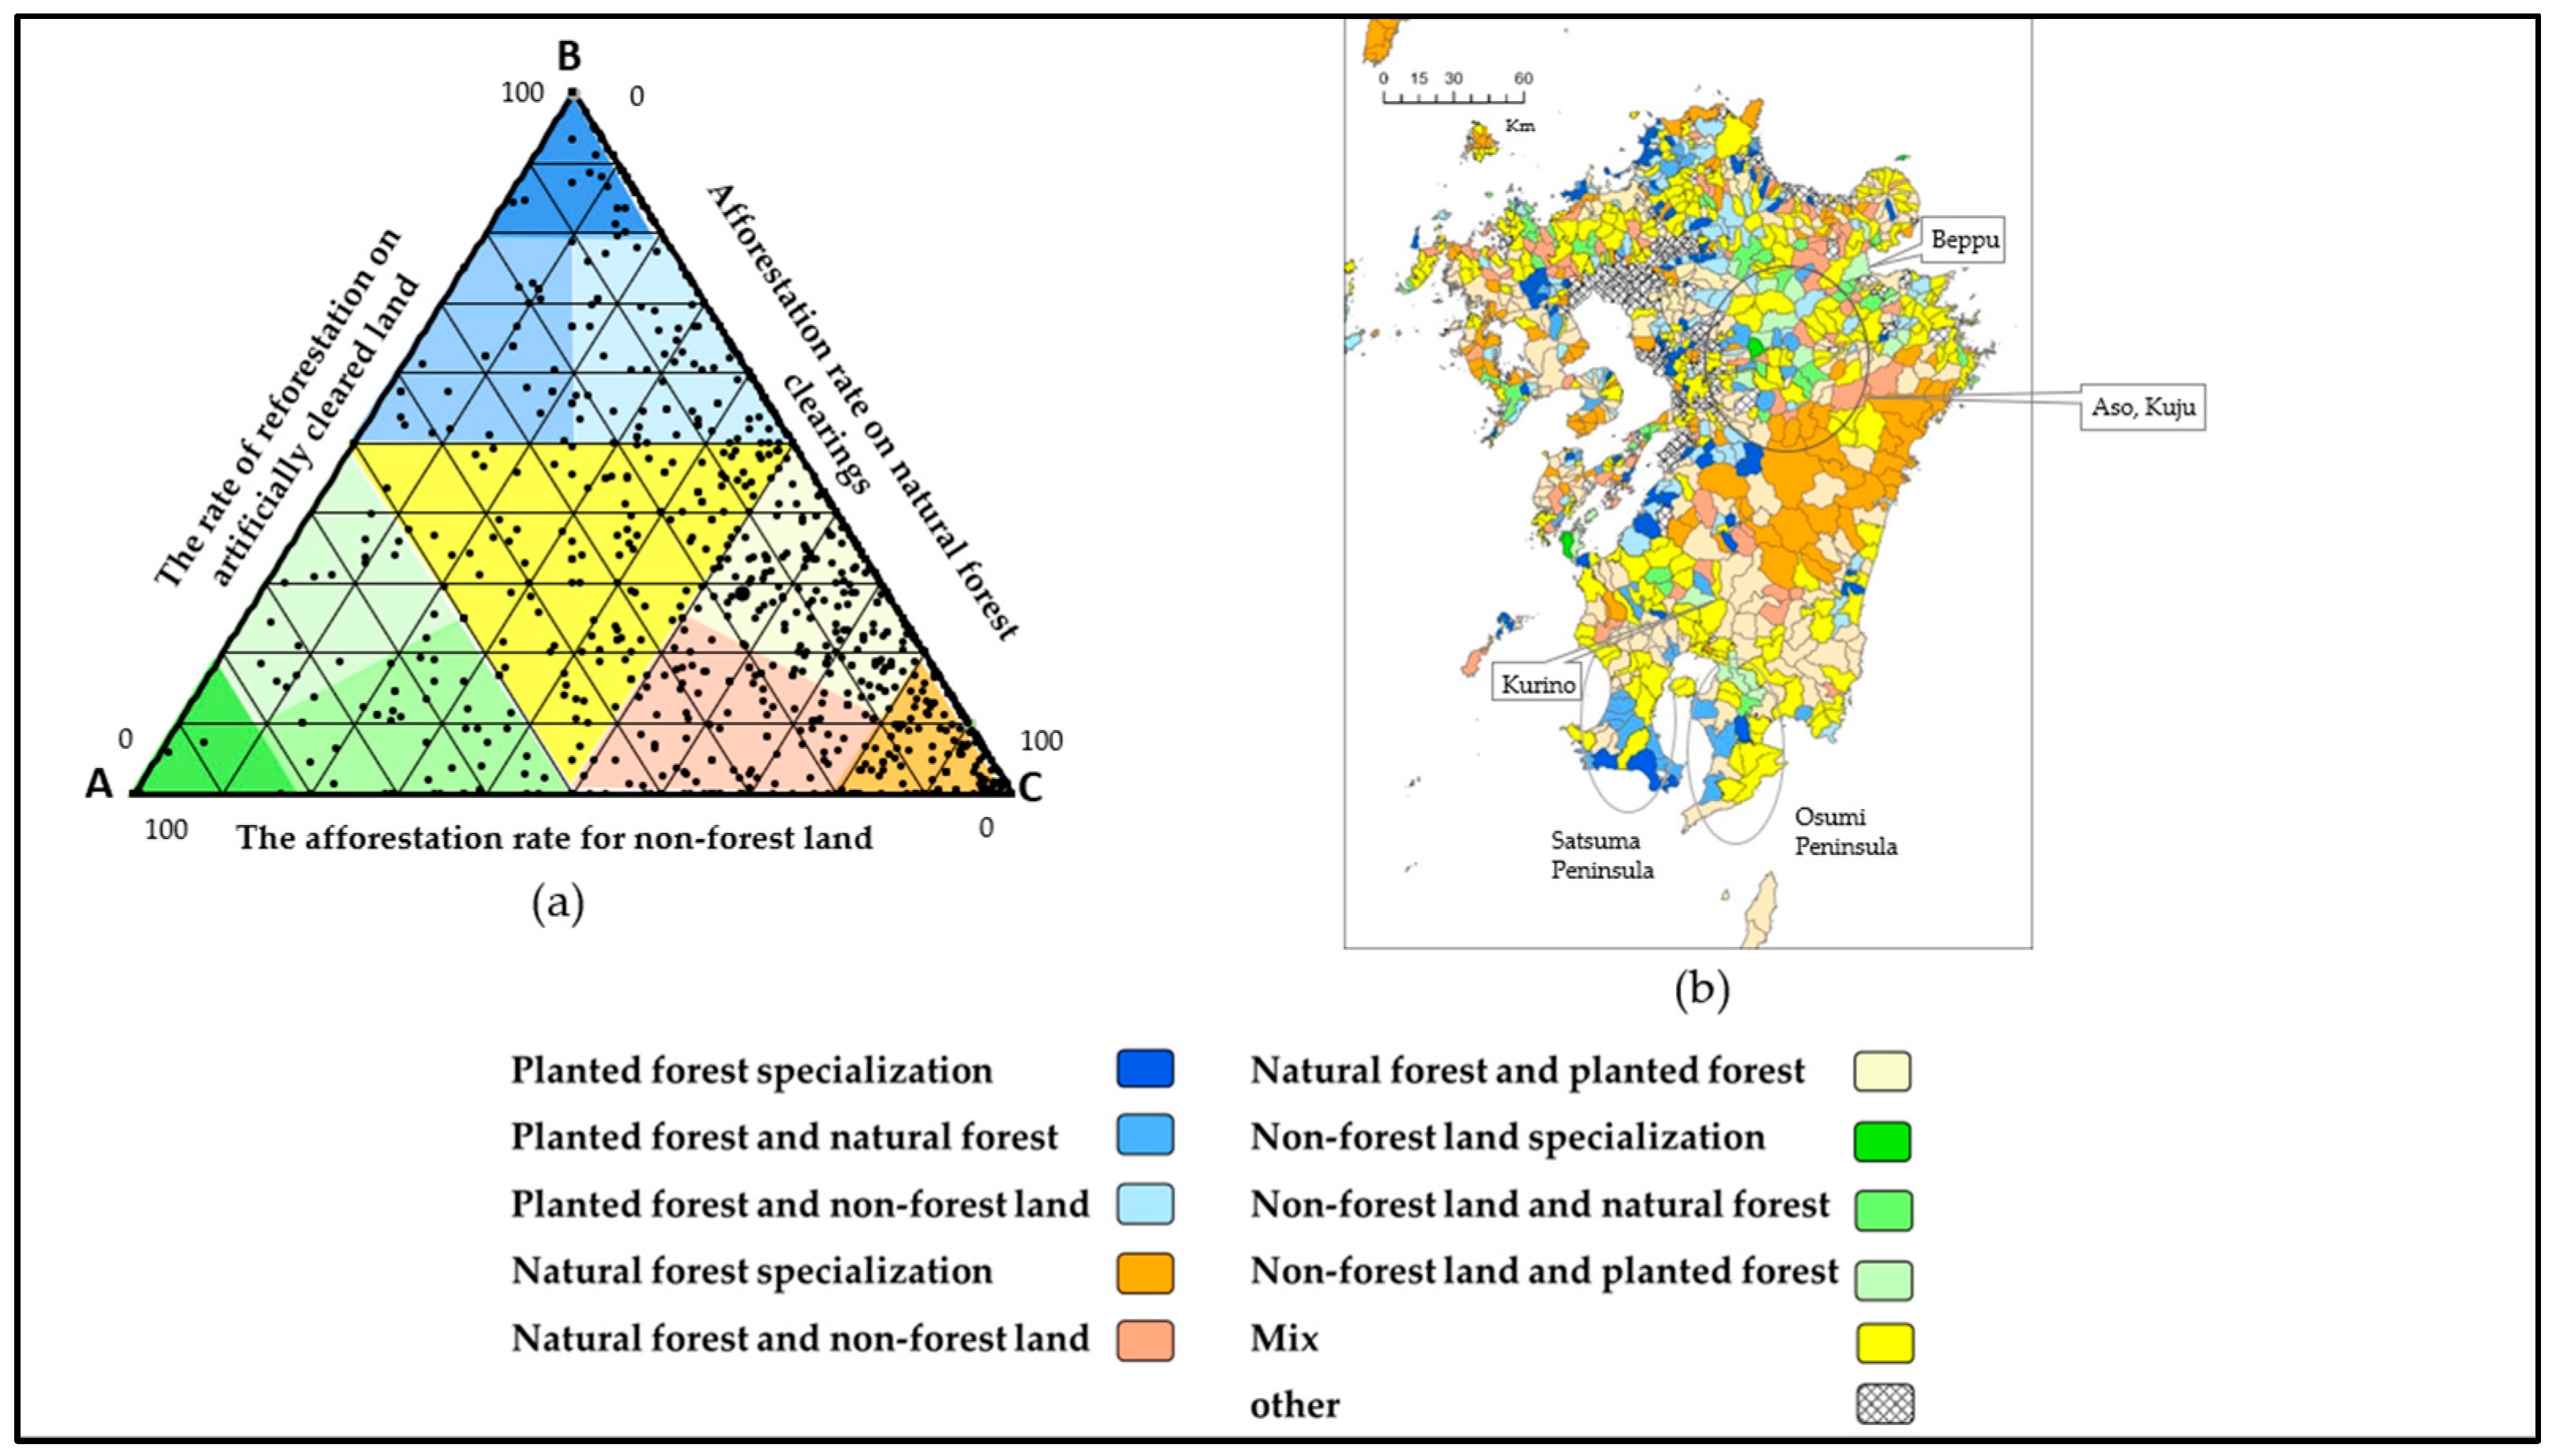
According to the 60-year census, the total afforested area in Kyushu is approximately 68,200 ha. The percentage of land afforested per category in Kyushu was approximately 55% natural forest clearing, 16% non-forest land, and 29% reforestation. This indicates a high proportion of forest conversion. However, when compared with the forest conversion rate in Hokkaido, the proportion converted in Kyushu was low but the proportion of reforestation was high. When comparing the proportion of land afforested by category for each former city and town, together with the triangular graphs of other regions, Kyushu stands out because the points are distributed evenly throughout the entire triangle (Figure 4a). This distribution demonstrates that in 1960, afforestation was carried out in several land categories in Kyushu’s former cities and towns, diversifying the vegetation history of Kyushu.
Figure 4. Map of Kyushu: (a) Ternary graph; (b) Distribution maps for each category.
Forests 15 00059 g004
According to the findings, the percentage of mixed types (Section (X)) was higher than that in the Hokkaido and Kinki regions, and the number of cities, towns, and villages included in the three specialized types was 244 (approximately 20% of the total). This indicates that afforestation has been conducted on two or more land-types in many municipalities. Therefore, it can be inferred that afforestation was carried out on many types of land in Kyushu compared with other regions.
According to the map in Figure 4, Section (IV), which specializes in natural forests, is concentrated in the area corresponding to the ridge of the Kyushu Mountains from the northern part of Miyazaki Prefecture to the southern part of Kumamoto Prefecture. Section (VI), natural and planted forest, is widely distributed from Kagoshima Prefecture to southern Kyushu. In areas where the afforestation ratio for natural forest clearings exceeds 50%, the conversion of secondary and primitive natural forests is expected to be active. Section (VII), which is natural forests and non-forest land, Section (IX), which is non-forest land and planted forests, and Section (V), which is natural forests and non-forest land, are distributed in regions such as the Aso and Kuju area to Beppu and the Kurinocho in the Seseragi and Kirishima Mountains. Section (I), which describes planted forest specialization, is scattered throughout the southern Satsuma Peninsula, Saga Prefecture, the Kuma River basin in Kumamoto Prefecture, and numerous locations in Kyushu. Furthermore, Section (VII), which includes planted forests and non-forests, is widespread in the Satsuma and Osumi Peninsulas, whereas Section (III), which includes planted forests and natural forests, is common in Fukuoka and Kumamoto prefectures. According to the map in Figure 4b, mixed-type cities, towns, and villages are scattered throughout northern Kyushu, Kagoshima Prefecture, and southern Miyazaki Prefecture.

3.3. Characteristics of the Planted Forest Vegetation History in Kinki
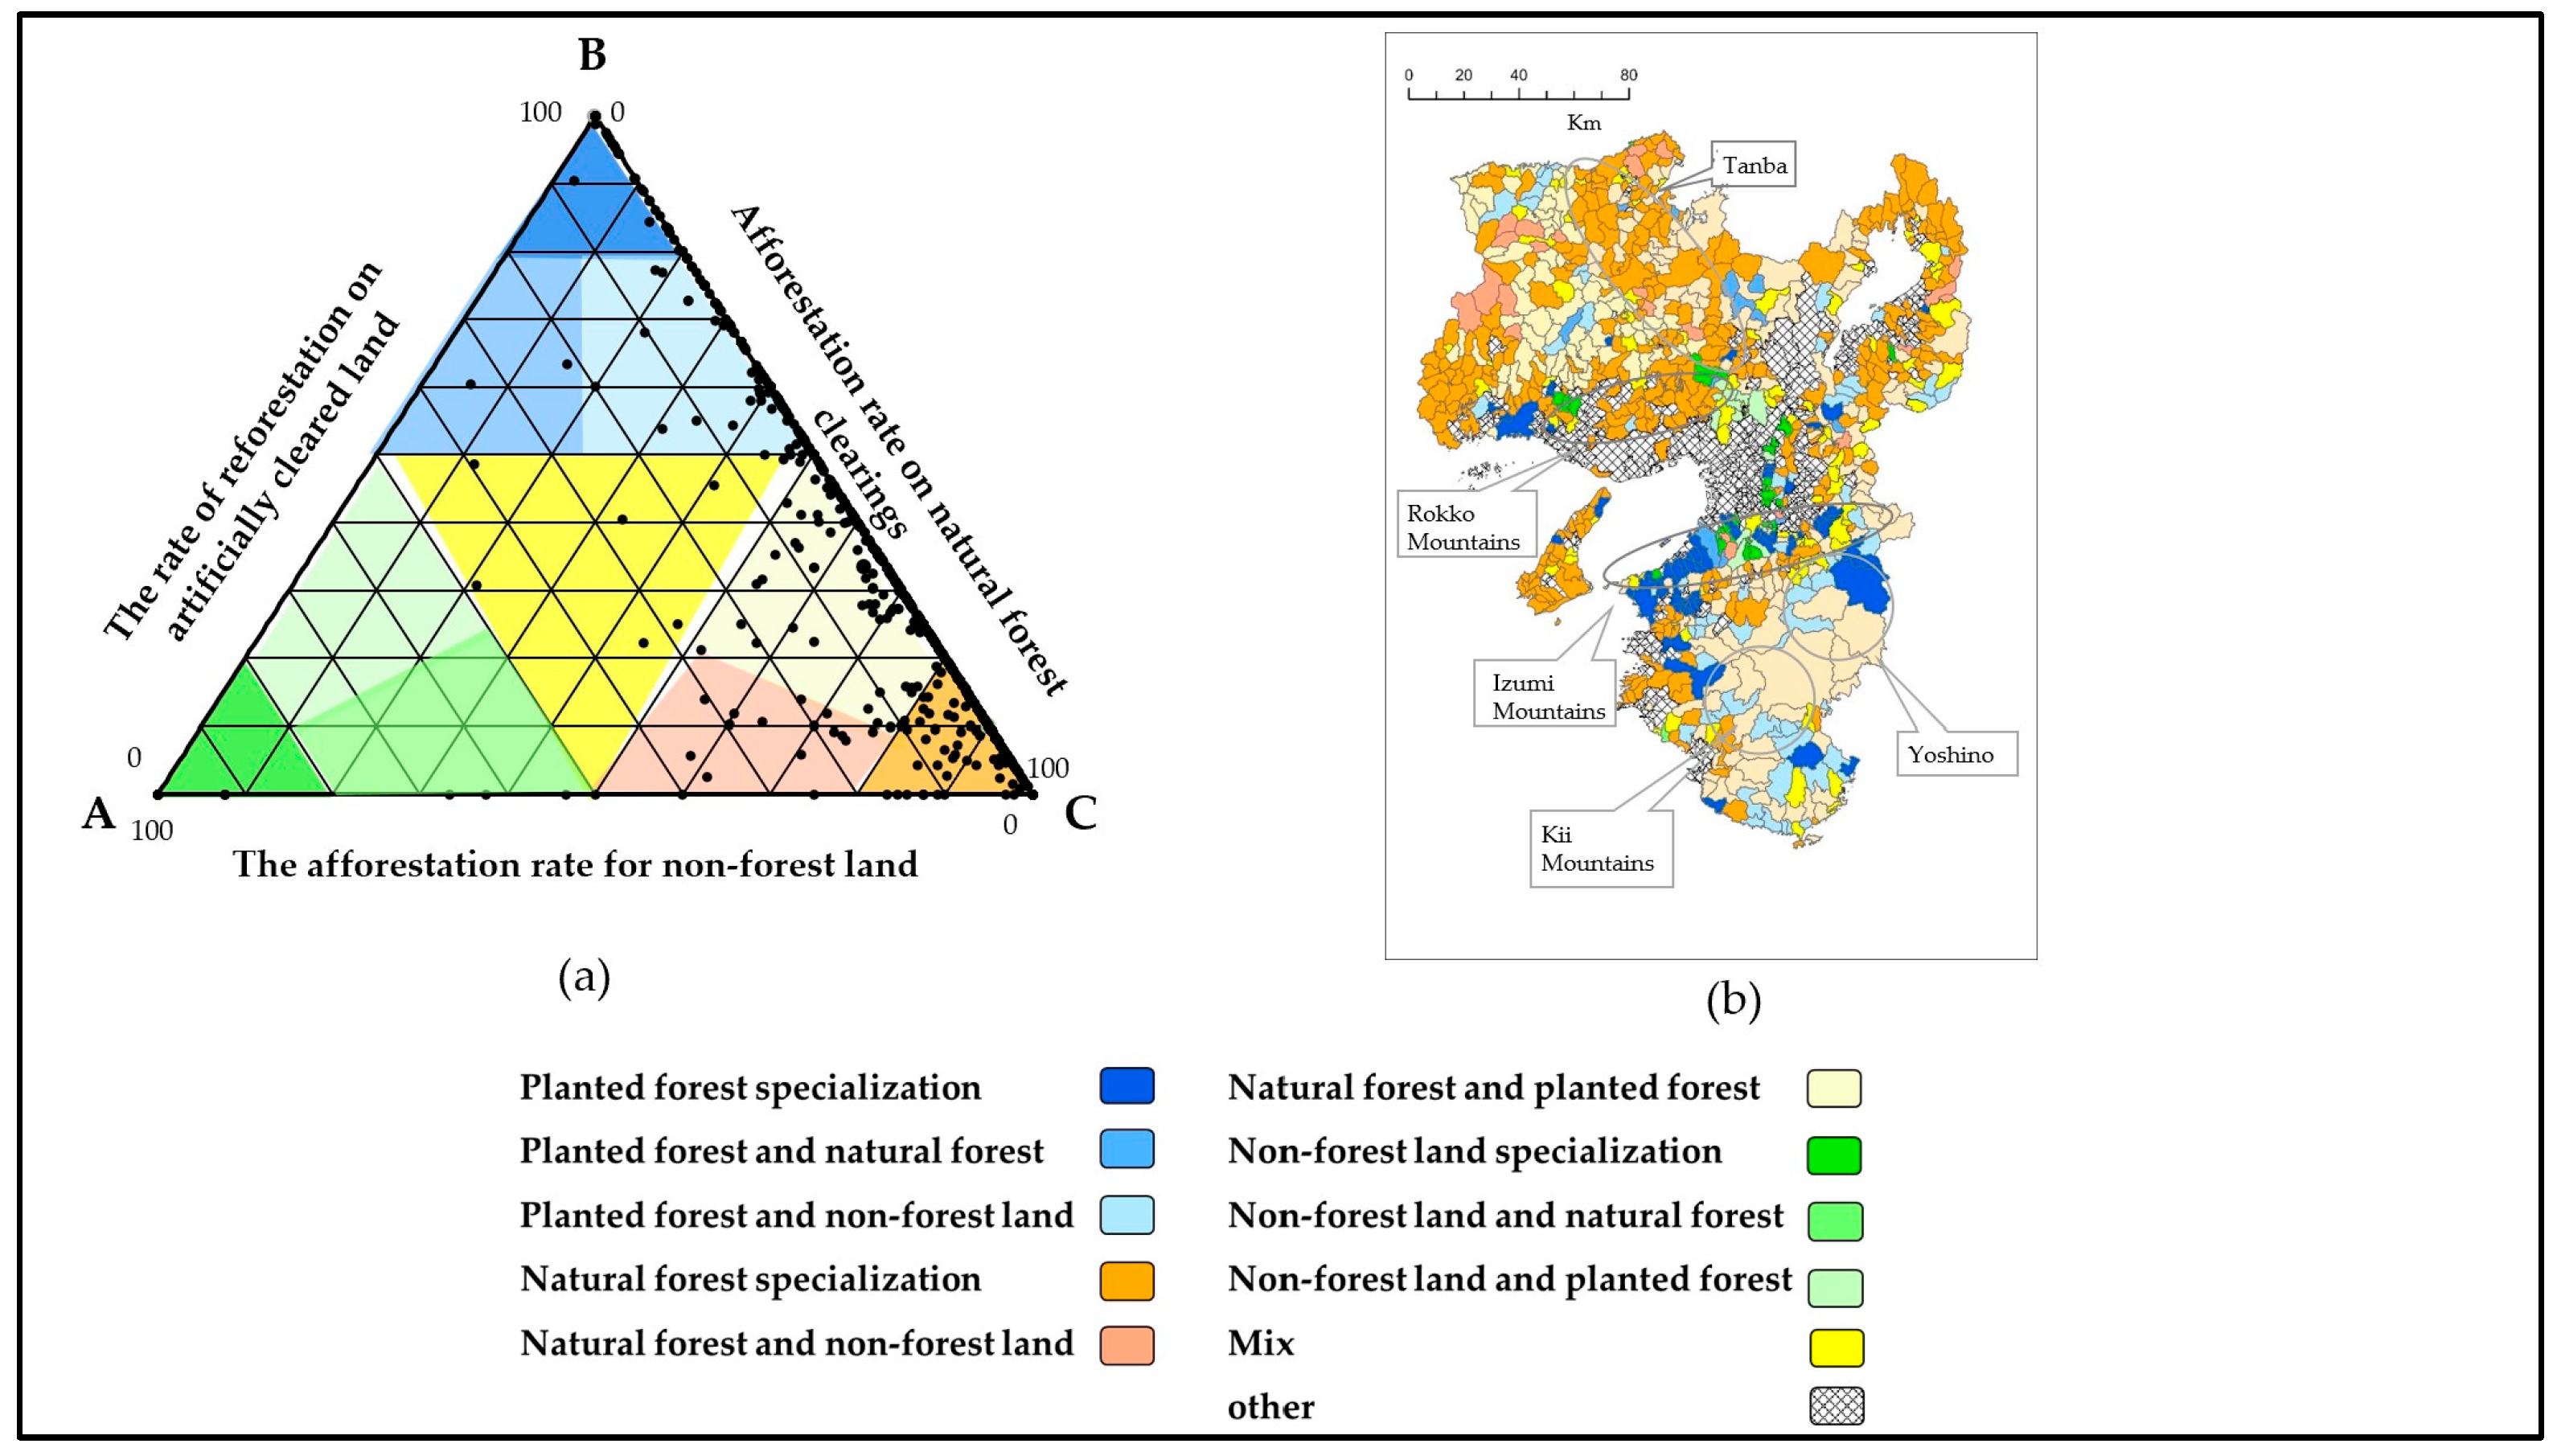
According to the 60-year census, the total afforested area in the Kinki region is approximately 30,850 ha. The percentage of afforested land per category in Kinki was approximately 65% natural forest clearing, 3% non-forest land, and 32% afforestation, indicating a high proportion of forest conversion. Kinki had a lower proportion of non-forested land afforestation than either Hokkaido or Kyushu. There are 751 municipalities (approximately 50% of the total) where afforestation of natural forest clearings exceeds 50%, even for every former city and town in Kinki. In contrast, there were only 10 municipalities in the area where afforestation of non-forested land exceeded 50% (Section C, Figure 5). The proportion of municipalities in the Kinki region with an afforestation rate of more than 50% on non-forested land in 1960 was lower than that in other regions.
Figure 5. Map of Kinki: (a) Ternary graph; (b) Distribution maps for each category.
Forests 15 00059 g005
Section (IV), which specializes in natural forests, is distributed throughout the Rokko Mountains in the northern to western parts of Hyogo Prefecture, Shiga Prefecture, and Awaji Island (Figure 5). Section (VI), consisting of natural and planted forests, is widespread in the Kii Mountains, central Hyogo Prefecture, and Tanba region. Section (I), which includes planted specialized forests, is found in the Yoshino area of Nara Prefecture and in the Izumi Mountains. Section (III), planted forest and natural forest, is found in the Kii Mountains, southern Wakayama Prefecture, and northern Hyogo Prefecture. Section (V), which consists of natural forest and non-forest land, is found in some parts of the western Hyogo Prefecture and eastern Shiga Prefecture.

3.4. Comparison of the Percentage of Grassland in Three Regions since 1960

Table 2 compares the grassland area and utilization rates in the three regions based on the vegetation data of the 60-year census. The proportion of grassland area (grassland utilization rate) to the total forest area in Hokkaido was 12.9%, the highest of the three regions, with the Kinki region having the lowest value at approximately 2.6% (Table 2). Furthermore, the grassland utilization rate in the Kyushu region in 1960 was 67.5% {(utilized grassland area + utilized non-forest area)/(total non-forest area + total grassland area)}, which was greater than the average grassland utilization rate (25.9%) in Hokkaido during the same period. Therefore, it can be assumed that more low-vegetation areas were used in areas other than forested areas where afforestation was carried out in the Kyushu Region than in Hokkaido.

4. Discussion

Based on the above findings, all three regions had high rates of conversion from natural to planted forests; however, the proportion of this conversion in Hokkaido was higher than that in Kyushu and Kinki, and afforestation was implemented on a variety of land types in Kyushu. In the 60-year census, secondary and primeval deep natural forests were not classified separately and were simply referred to as natural forests. Therefore, the change in forest landscape in areas categorized as (IV) natural forest specialization, (V) natural forest and non-forest land, and (VI) natural forests and planted forests, where the afforestation of timber-harvesting areas of natural forests exceeds 50%, is estimated to include the transformation of primeval deep natural forests and secondary forests.

4.1. Hokkaido

In Hokkaido, the government owns most of the mountainous areas above 200 m in elevation, where primeval deep natural forests were present until shortly after World War II [32]. In 1957, the Forestry Agency proposed to raise the productivity of government-owned forests by converting low-quality mature natural forests into vigorously growing planted forests [33]. In fact, clearcutting of primeval deep natural forests continued until the 1980s in the Takiyama government forest in Hokkaido [29]. In the 1960s, secondary broad-leaved forests that had become unused as a result of the post-war energy revolution converted to privately owned forests [33]. Additionally, based on Table 2 and the literature, it is estimated that in Hokkaido in 1960, there were many cases of unused low-vegetation areas, except for farmland, which was afforested into planted forests outside mountainous forests. For example, on Rebun Island, where non-forest land specialization is concentrated, afforestation with trees such as Abies sachalinensis and Betula ermanii has been conducted since the Meiji era [34] on abandoned plains formed by mountain fires or charcoal gathering. Otaki Village and Biei Town are located on non-forest land and natural forest, respectively, where extensive reforestation efforts were undertaken following the 1954 typhoon, which caused extensive damage to fallen trees after they were cut down. These areas were located within government-owned forests [33]. Afforestation efforts were carried out in Wakkanai City, which is classified as a non-forest land and natural forest, from the late Meiji period to the early Taisho period to eliminate treeless land caused by deforestation and forest fires [35]. In Shibecha Village, which falls in the categories of non-forest land and natural forest, a large-scale afforestation project called Pilot Forest was implemented to address the problem of degraded land caused by forest fires since the Meiji era [36].

4.2. Kyushu

Documentation indicates that before the energy revolution, charcoal production thrived in Miyazaki Prefecture in Kyushu, where natural forest specialization forests are concentrated in the northern part [37], and it is estimated that changes to secondary forests were the main form of transformation. Transitions from grasslands were most common in non-mountainous terrain in Kyushu, according to Table 2, which is corroborated by the literature. For example, natural land in Beppu City, categorized as non-forest land and planted forest, was used for grazing and grass-collecting. There are plans to reforest unused city-owned land [38]. In addition, records suggest that afforestation was carried out in the mountains of Saga Prefecture, where non-forest land and natural forest are distributed, at sites that were destroyed by cutting trees and grass for green manure during World War II [39]. In the Aso region, where non-forest land specialization, non-forest land, and natural forests are concentrated, grasslands have been kept as pastures and grasslands since ancient times. Because of their topography and size, the vast plains of Aso and Kuju were target sites for afforestation as extensions of planted forests after the war [40]. The regeneration of steep slopes using afforestation has been emphasized in the Aso region [41].

4.3. Kinki

Large cities such as Heijokyo and Heiankyo have flourished in the Kinki region since ancient times, and human activity has prospered in this area. Since the Middle Ages, primary primitive forests have transitioned into secondary forests [42]. Furthermore, since the Meiji era, grassy hills that covered low vegetation areas have progressed to secondary forests, with oaks as the main tree type [42]. As a result, in the Kinki region in the 1960s, most afforestation in government-owned forests, with the exception of primeval natural forest transformation in certain remote areas, is thought to have involved transformation of secondary forests, such as oak and red pine, that were artificially disrupted.
It is estimated that in cities and towns categorized as afforested on planted forest harvesting areas, over 50% of total afforestation specialized in harvested planted forest, planted forest and non-forest land, and planted forest and natural forest. The main form of afforestation in 1960 was replanting on harvested, planted forests, rather than clearing for new afforestation. This study focuses on three types of afforested land and it is difficult to reveal whether these locations had high planted forest coverage in 1960 or whether replanting was chosen for harvested planted forests rather than expanding afforestation. Thus, to determine this, verification using planted forest coverage data, vegetation data, and multiple document resources is necessary (Table 3).
Additionally, the 60-year census did not distinguish between primary and secondary forests; therefore, additional information is needed to accurately identify the types of natural forests that have been converted to plantations. In a future study, we plan to use vegetation maps and aerial photographs to analyze the types of natural forests that have been converted to plantations in each region.

5. Conclusions

Using data from the 60-year census, we attempted to quantify the vegetation history of planted forests in Hokkaido, Kyushu, and Kinki. The analysis showed that the proportion of natural forest conversion was high, and the proportion of afforestation in artificially harvested forest areas was relatively low compared with other regions in Hokkaido’s vegetation history. In addition, afforestation outside mountain forests was noticeable, and it is believed that it reflected afforestation in unused grasslands based on the value of unused grassland rates. The analysis showed that the proportion of afforestation outside mountain forests in Kinki was extremely low compared with that in other regions, as shown in Table 2.
Compared with Kyushu, where there is a diversity of land use, more than 80% of municipalities in Hokkaido and Kinki focused on converting their land to planted forests. Hokkaido and Kyushu share high wood production and forestry activity, whereas Kyushu has a diverse land use history that makes it difficult to identify areas for natural forest regeneration. Hokkaido could support regeneration due to the abundance of natural forest seeds in the soil. In Kyushu, a more detailed local analysis beyond 50-year-old administrative boundaries is needed to identify potential areas for natural regeneration.
In this study, we quantitatively evaluated vegetation history on a more detailed scale than in previous studies using data from the 60-year census. Data from the 60-year census are useful for investigating the differences in the vegetation history of planted forests in regions established after World War II. In the future, we plan to analyze regional differences in the progress of post-war afforestation by including afforestation areas and rates for each type of land use. We would also like to further investigate their relevance to current forest harvesting.

Author Contributions

Conceptualization, R.U., T.F. and N.S.; methodology, R.U. and N.S.; software, R.U.; validation, J.I., T.F. and N.S.; formal analysis, R.U.; data curation, R.U.; writing—original draft preparation, R.U.; writing—review and editing, J.I., T.F. and N.S.; visualization, R.U.; supervision, T.F.; funding acquisition, N.S. All authors have read and agreed to the published version of the manuscript.

Funding

This work was supported by JSPS KAKENHI Grant Number JP18H04152 and Matsumoto System Engineering, Inc.

Data Availability Statement

The original data for this paper is available from the 1960 World Census of Agriculture and Forestry.

Acknowledgments

We deeply appreciate and thank Toshiya Yoshida of Hokkaido University’s Field Science Center for Northern Biosphere for providing advice on Hokkaido’s forestry.

Conflicts of Interest

The authors declare no conflict of interest.

References

  1. Southworth, J.; Nagendra, H.; Cassidy, L. Forest transition pathways in Asia—Studies from Nepal, India, Thailand, and Cambodia. J. Land Use. Sci. 2012, 7, 51–65. [Google Scholar] [CrossRef]
  2. Brookfield, H.; Byron, Y. Deforestation and timber extraction in Borneo and the Malay Peninsula. Glob. Environ. Chang. 1990, 1, 42–56. [Google Scholar] [CrossRef]
  3. Fujita, Y. How We Created 10 million hectares of Planted Forests? Forest Sci. 1997, 19, 9–14. (In Japanese) [Google Scholar]
  4. Annual Report on Forest and Forestry in Japan Fiscal Year 2022 (Summary). “Intensification and Morphological Changes of Mountain Disasters Caused by Climate Change and Forestry” and” Rural Communities in Hilly and Mountainous Areas”. Available online: https://www.rinya.maff.go.jp/j/kikaku/hakusyo/r4hakusyo/attach/pdf/index-6.pdf (accessed on 27 October 2023).
  5. Forestry Agency. Current Status of Forest Resources 2022. Trend of Forest Area and Accumulation. Available online: https://www.rinya.maff.go.jp/j/keikaku/genkyou/r4/attach/pdf/2-2.pdf (accessed on 27 January 2023). (In Japanese)
  6. Japan Meteorological Agency. Prediction Information for Global Warming; Japan Meteorological Agency: Tokyo, Japan, 2013; Volume 8. (In Japanese)
  7. Ito, S.; Nakayama, R.; Buckley, G.P. Effects of previous land-use on plant species diversity in semi-natural and plantation forests in a warm-temperate region in Southeastern Kyushu, Japan. Forest. Ecol. Manag. 2004, 196, 213–225. [Google Scholar] [CrossRef]
  8. Rebellion of the Wild. Available online: https://www.nippon.com/en/features/c03914/ (accessed on 20 November 2023).
  9. Takatsuki, S. Effects of sika deer on vegetation in Japan: A review. Biol. Conserv. 2009, 142, 1922–1929. [Google Scholar] [CrossRef]
  10. Koike, S. The relationship with betwenn with forest and, animal, human beings. In Forest and Wildfire, 2nd ed.; Koike, S., Yamaura, Y., Taki, H., Eds.; Kyoritsu Publishing: Tokyo, Japan, 2019; pp. 10–11. (In Japanese) [Google Scholar]
  11. Millennium Ecosystem Assessment. Ecosystem and Human Well-Being: Synthesis; Island Press: Washington, DC, USA, 2005. [Google Scholar]
  12. Mitsuda, Y.; Ito, S. Analysis of the effects of natural and social environment on land-use type using the National Land Numerical Information: A case study in Miyazaki Prefecture. Bull. Int. Assoc. Landsc. Ecol.-Jpn. 2003, 8, 23–31. (In Japanese) [Google Scholar]
  13. Soen, N.; Ito, S.; Mituda, Y. Land-use changes and their factors in mountainous forest landscapes in mountainous region of Kyushu, southern Japan. Landsc. Ecol. Manag. 2009, 14, 129–138. (In Japanese) [Google Scholar] [CrossRef]
  14. Shiba, E.; Nagasawa, R. Analysis on the seminatural grassland landscape changes in the Sendaigawa Watershed, Tottori Prefecture using temporal geographic information. Landsc. Ecol. Manag. 2019, 14, 153–161. (In Japanese) [Google Scholar]
  15. Itohl, A.; Nagasawa, R. The Land Use and Landscape Changes in the Rural Mountainous Area since Meiji Era 1890’s)—A case study in Moroga village. Landsc. Ecol. Manag. 2007, 11, 93–104. (In Japanese) [Google Scholar] [CrossRef]
  16. Sato, Y. Forest utilization and human cognition of the environment: Afforestation of common land in Oguni-machi. Kumamoto Prefecture. Geogr. Rev. Jpn Ser. A Chirigaku Hyoron 2001, 74, 63–82. (In Japanese) [Google Scholar] [CrossRef]
  17. Yoshida, K. Changes in mountain slope landscape by expanding planted forests in Ashikita, Kumamoto Prefecture: Focusing on the working styles of residents before and after the decline in shifting cultivation. Geogr. Rev. Jpn. 2017, 5, 459–474. (In Japanese) [Google Scholar]
  18. Nakajima, K. Traditional environmental use at the foot of MT. Sefuri—Through the Subjective Environmental Division. Hum. Geogr. 1986, 38, 41–55. (In Japanese) [Google Scholar] [CrossRef]
  19. Sekido, A. The social-spatial organization of forest-lands and the subjective classification of its lands in a shifting cultivation village. Hum. Geogr. 1994, 46, 144–165. (In Japanese) [Google Scholar] [CrossRef]
  20. Someya, T.; Kamada, M.; Nakagoshi, N.; Nehira, K. Pattern and process of vegetation landscape in a mountainous Farrn village-A case Studyat Hiwa-cho, Hiroshirna Prefecture. Geogr. Sci. 1989, 44, 53–69. (In Japanese) [Google Scholar]
  21. Sakai, S.; Ichinose, T. Land use change and the factors in the hilly and mountainous area: A case of study in Kugino, Minamata city. Rep. City Plan. Inst. Jpn. 2019, 17, 393–399. (In Japanese) [Google Scholar] [CrossRef] [PubMed]
  22. Okano, T.; Hara, Y. Digital spatial data construction and land cover change analysis of terraced paddies using 1953 large-scale aerial photographs in the middle part of Arida River watershed. J. Rural. Plan. 2019, 38, 128–135. [Google Scholar] [CrossRef]
  23. Fujita, Y. Theory of the Formation of Japan’s Afforestation Regional Areas; Kokon Shoin: Tokyo, Japan, 1995; pp. 366–382. (In Japanese) [Google Scholar]
  24. Ellis, E.C.; Klein Goldewijk, K.; Siebert, S.; Lightman, D.; Ramankutty, N. Anthropogenic transformation of the biomes, 1700 to 2000. Glob. Ecol. Biogeogr. 2010, 19, 589–606. [Google Scholar] [CrossRef]
  25. Harada, I.; Matsumura, T.; Hara, K.; Kondoh, A. Spatial analysis of changes in Japanese forests during the process of modernization. Landsc. Ecol. Manag. 2011, 16, 17–32. (In Japanese) [Google Scholar] [CrossRef]
  26. Mitsuda, Y.; Ito, S. Comparison of the effect of natural and social environment on land-use selection between artificial and natural-forest. Landsc. Ecol. Manag. 2004, 9, 63–70. (In Japanese) [Google Scholar] [CrossRef]
  27. Ueno, R.; Fujiwara, T.; Sato, N.; Fujioka, Y. Where did people plant trees during the expansion of afforestation? An analysis of Kyushu using the 1960 world agricultural and forestry census. Kyushu For. Res. 2022, 75, 97–100. (In Japanese) [Google Scholar]
  28. Forestry Agency. Forest and Forestry Statistics Overview. In Part IV; Forest Products Communications. 2022. Available online: https://www.rinya.maff.go.jp/j/kikaku/toukei/attach/pdf/youran_mokuzi2022-12.pdf (accessed on 27 January 2023). (In Japanese)
  29. Seiwa, K. Changes in Forests and Trees in Changes in Forests in Relation to Human, 2nd ed.; Nakashizuka, T., Kikusawa, K., Eds.; Kyoritsu Publishing: Tokyo, Japan, 2018; p. 145. [Google Scholar]
  30. Forestry Agency. Forest and Forestry Statistics Overview. National Economy and Forest Resources. Part I. 2022. Available online: https://www.rinya.maff.go.jp/j/kikaku/toukei/attach/pdf/youran_mokuzi2022-11.pdf (accessed on 27 January 2023). (In Japanese)
  31. Ministry of Land, Infrastructure, Transport and Tourism. National Land Numerical Information Download Administrative District 3.0 Edition. Available online: https://nlftp.mlit.go.jp/ksj/gml/datalist/KsjTmplt-N03-v3_0.html (accessed on 7 November 2021).
  32. Twara, H. Landscape of Hokkaido: Historical review of environmental change and conservation. J. Jpn. Inst. Landsc. Archit. 1994, 58, 22–27. (In Japanese) [Google Scholar] [CrossRef]
  33. Postwar History of Forestry in Hokkaido Editing Committee Meeting. Postwar History of Forestry in Hokkaido; Hokkaido Ringyoukaikan: Hokkaido, Japan, 1983; Volume 249, pp. 257, 817–820, 833, 863–865. (In Japanese) [Google Scholar]
  34. Forestry Agency. Overview of the Rebun Forest office. Introduction to Rebun Island. Available online: https://www.rinya.maff.go.jp/hokkaido/soya/kannnaigaiyou/pdf/h24rebun.pdf (accessed on 15 November 2022).
  35. Wakkanai City. Trends in Agriculture and Forestry in Wakkanai City—Section 6: Overview of Forestry. Available online: https://www.city.wakkanai.hokkaido.jp/files/00010300/00010363/20160803170417.pdf (accessed on 3 January 2022). (In Japanese).
  36. Obihiro District Forestry Office; National Forestry Extension Association in Japan. A Prayer and Outlook for 100 Years of Forestry in Eastern Hokkaido; Obihiro District Forestry Office: Obihiro, Japan, 1969; p. 409. (In Japanese)
  37. History of Hyuga Charcoal Editing Committee. History of Hyuga Charcoal Meeting; Miyazaki Prefecture: Miyazaki, Japan, 1965; pp. 1–3. (In Japanese) [Google Scholar]
  38. Nakajima, K. Expansion of Greening Activities in Ōita Prefecture during the Afforestation Boom Period: From the Perspective of “Social Nature”. Kansai Sociol. Rev. 2009, 8, 64–75. (In Japanese) [Google Scholar]
  39. National Land Afforestation Promotion Organization. 70th Anniversary Commemorative Photo Collection of the National Tree Planting Festival; National Land Afforestation Promotion Organization: Tokyo, Japan, 2019; p. 47. (In Japanese) [Google Scholar]
  40. Isamoto, N. A Review of Grasslands Afforestation (BI-Soils) in Central Kyushu. Jpn. J. Forest. Environ. 1980, 22, 15–21. (In Japanese) [Google Scholar]
  41. Ministry of the Environment. Aso Grassland Regeneration—A Millennium of Grasslands Handed Down to Children—2. History of Aso’s Grasslands. Available online: https://www.aso-sougen.com/now/01/keep_02.html (accessed on 3 January 2020). (In Japanese).
  42. Osumi, K. Historical changes in forests in the Japanese Archipelago. In Relation to People in Changes in Forests in Relation to Human, 2nd ed.; Nakashizuka, T., Kikusawa, K., Eds.; Kyoritsu Publishing: Tokyo, Japan, 1965; pp. 80–81, 88, 94, 98–99, 104. [Google Scholar]
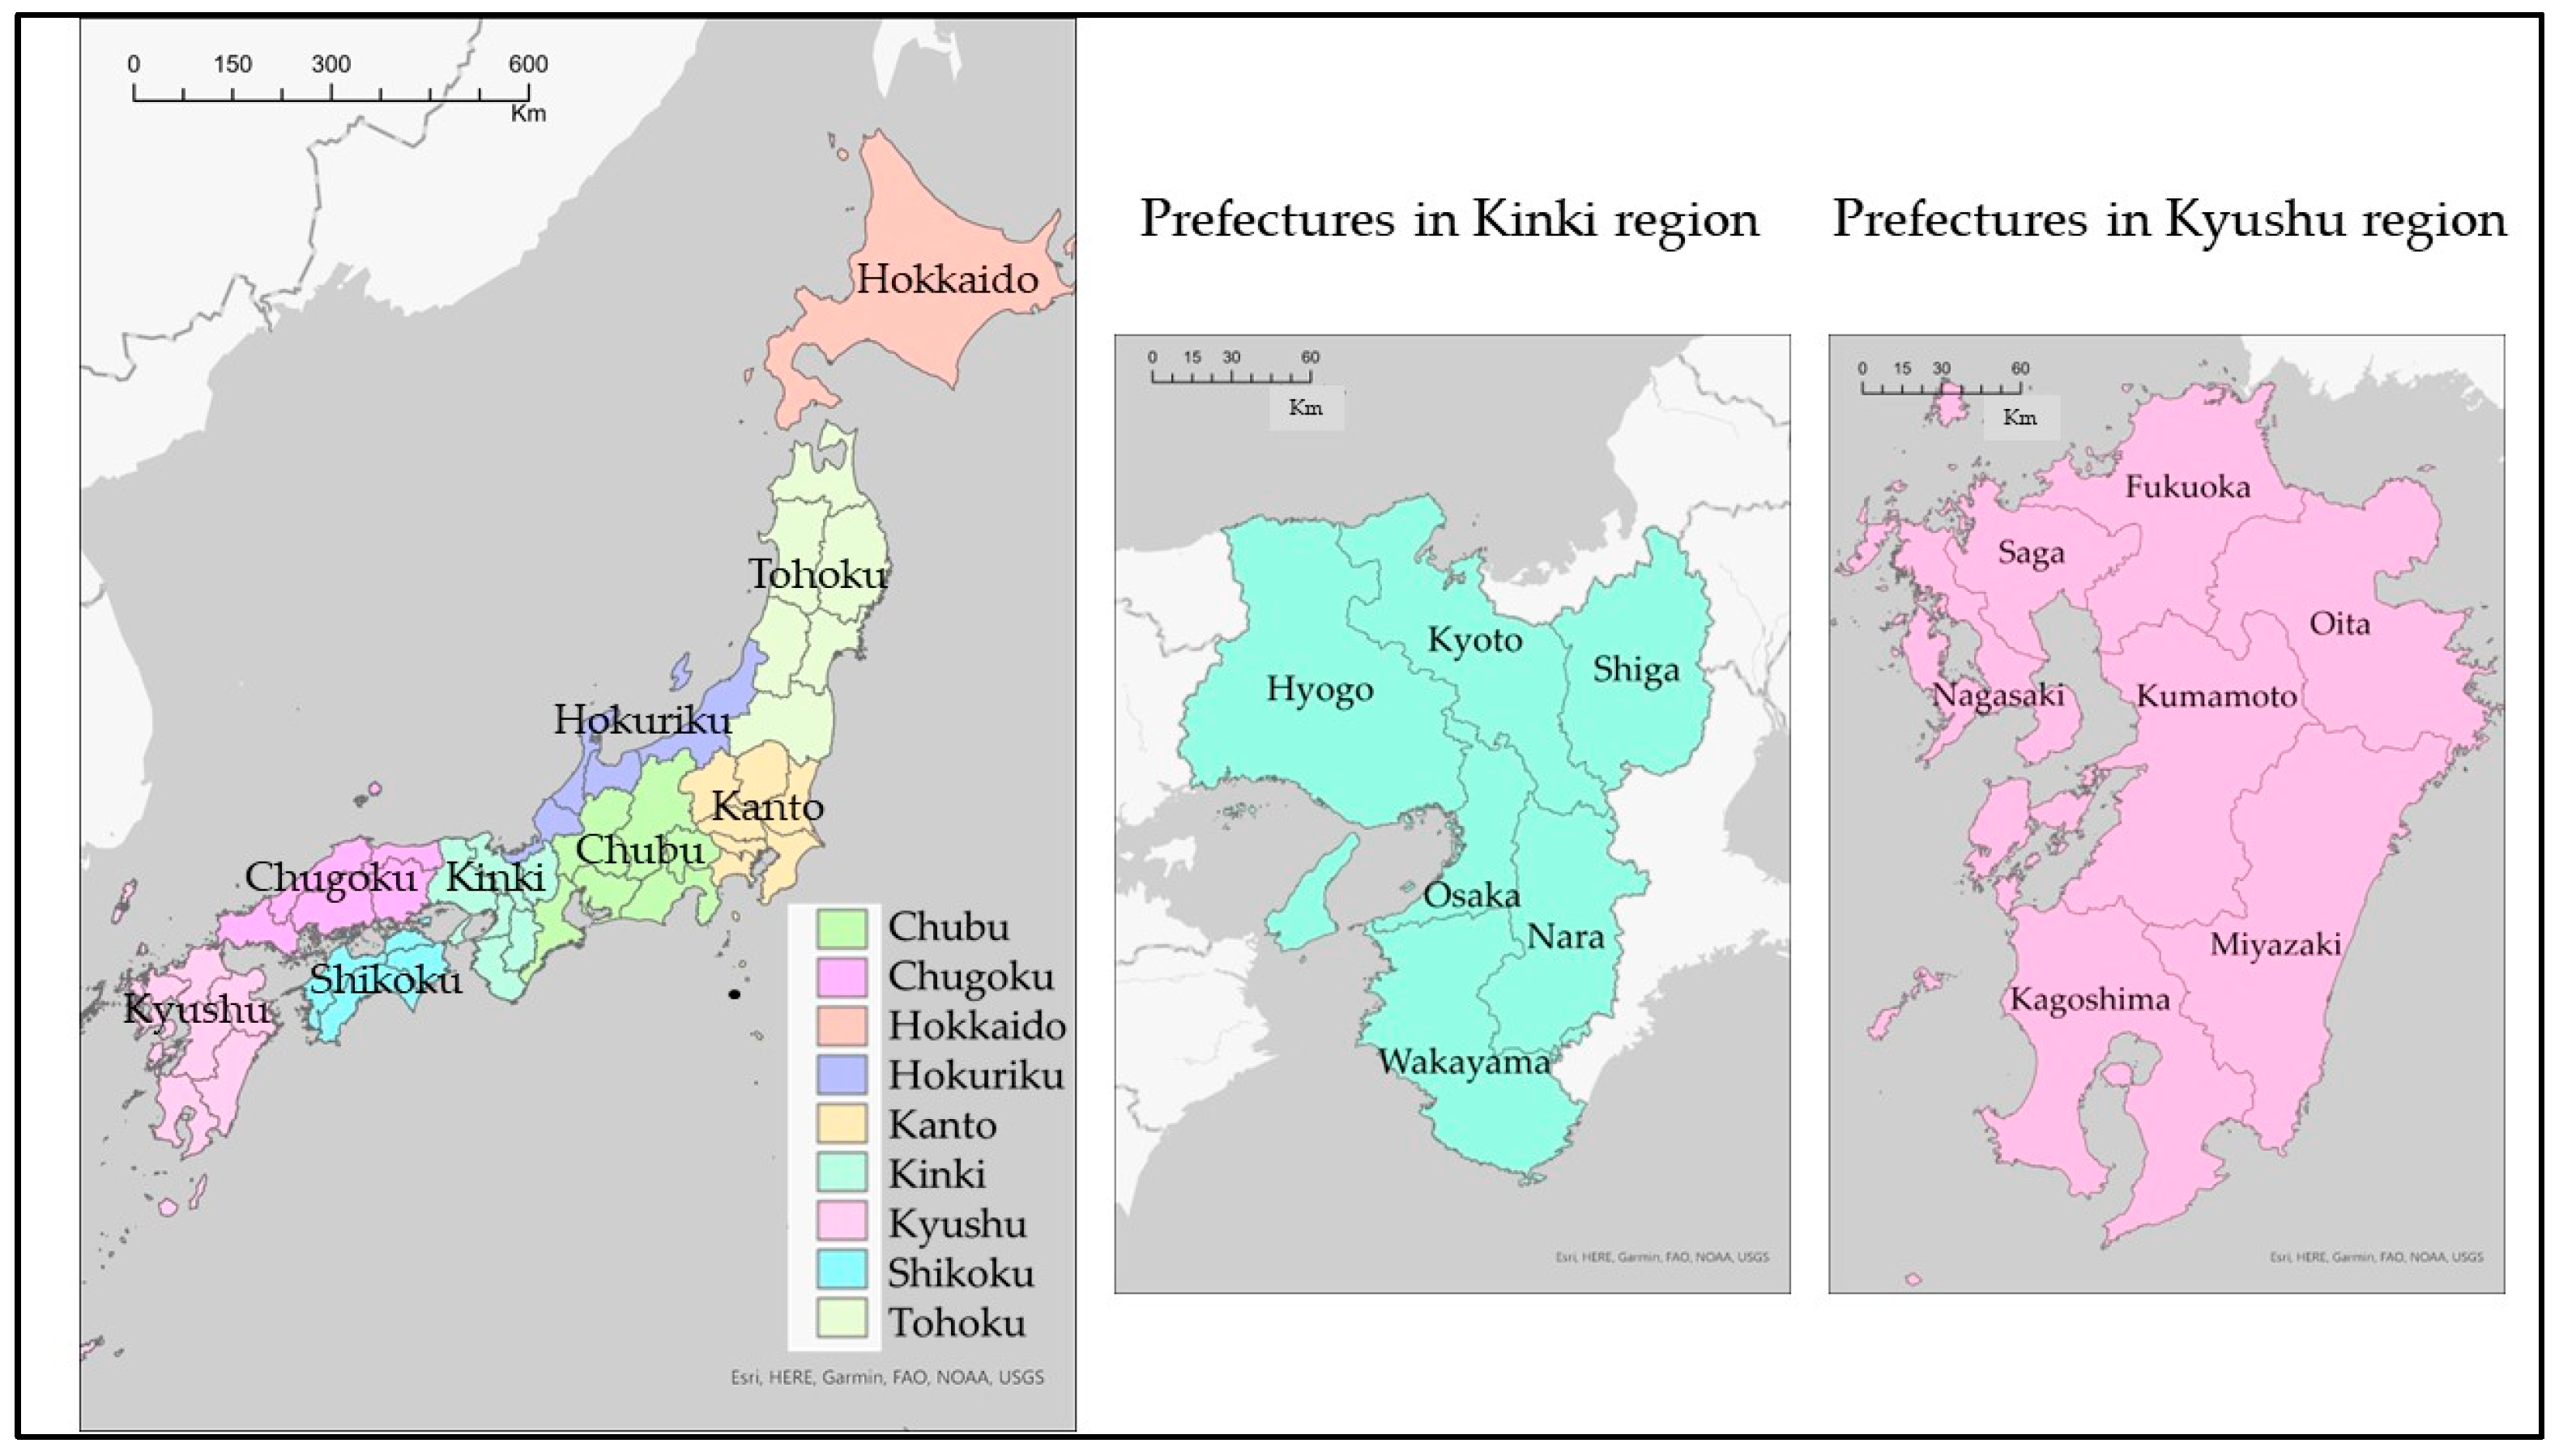
Figure 1. Japanese region.
Forests 15 00059 g001
Table 1. Area of 50-year administrative districts in regions.
Number of
Municipalities
Max (ha)Minimum (ha)Mean (ha)Median (ha)
Hokkaido276147,18052528,35520,819
Kinki122067,3591521071317
Kyushu130653,7004731751916
Source: The 1960 World Census of Agriculture and Forestry.
Table 2. Comparison of grassland area and rates in three regions in Japan.
Grassland (ha)Used Grassland (ha)The Percentage of Grassland (%)The Proportion of Grassland in Use (%)
Hokkaido756,773196,16512.925.9
Kinki59,13231,6392.653.5
Kyushu208,913141,0687.867.5
Source: The 1960 World Census of Agriculture and Forestry.
Table 3. Summary of vegetation history in three regions in Japan.
RegionKey Points
Hokkaido80% of municipalities are area with over 50% natural forest clearings.
18 municipalities are area with over 50% non-forest land afforestation.
Kyushu20% of municipalities are mixed types.
vegetation history is diverse.
KinkiOnly 5 municipalities in the region
are non-forest land afforestation.
Disclaimer/Publisher’s Note: The statements, opinions and data contained in all publications are solely those of the individual author(s) and contributor(s) and not of MDPI and/or the editor(s). MDPI and/or the editor(s) disclaim responsibility for any injury to people or property resulting from any ideas, methods, instructions or products referred to in the content.