
Heavy Ungulate Pressure behind the Disappearance of Regeneration in Hungarian Forests


Abstract
:1. Introduction
2. Materials and Methods
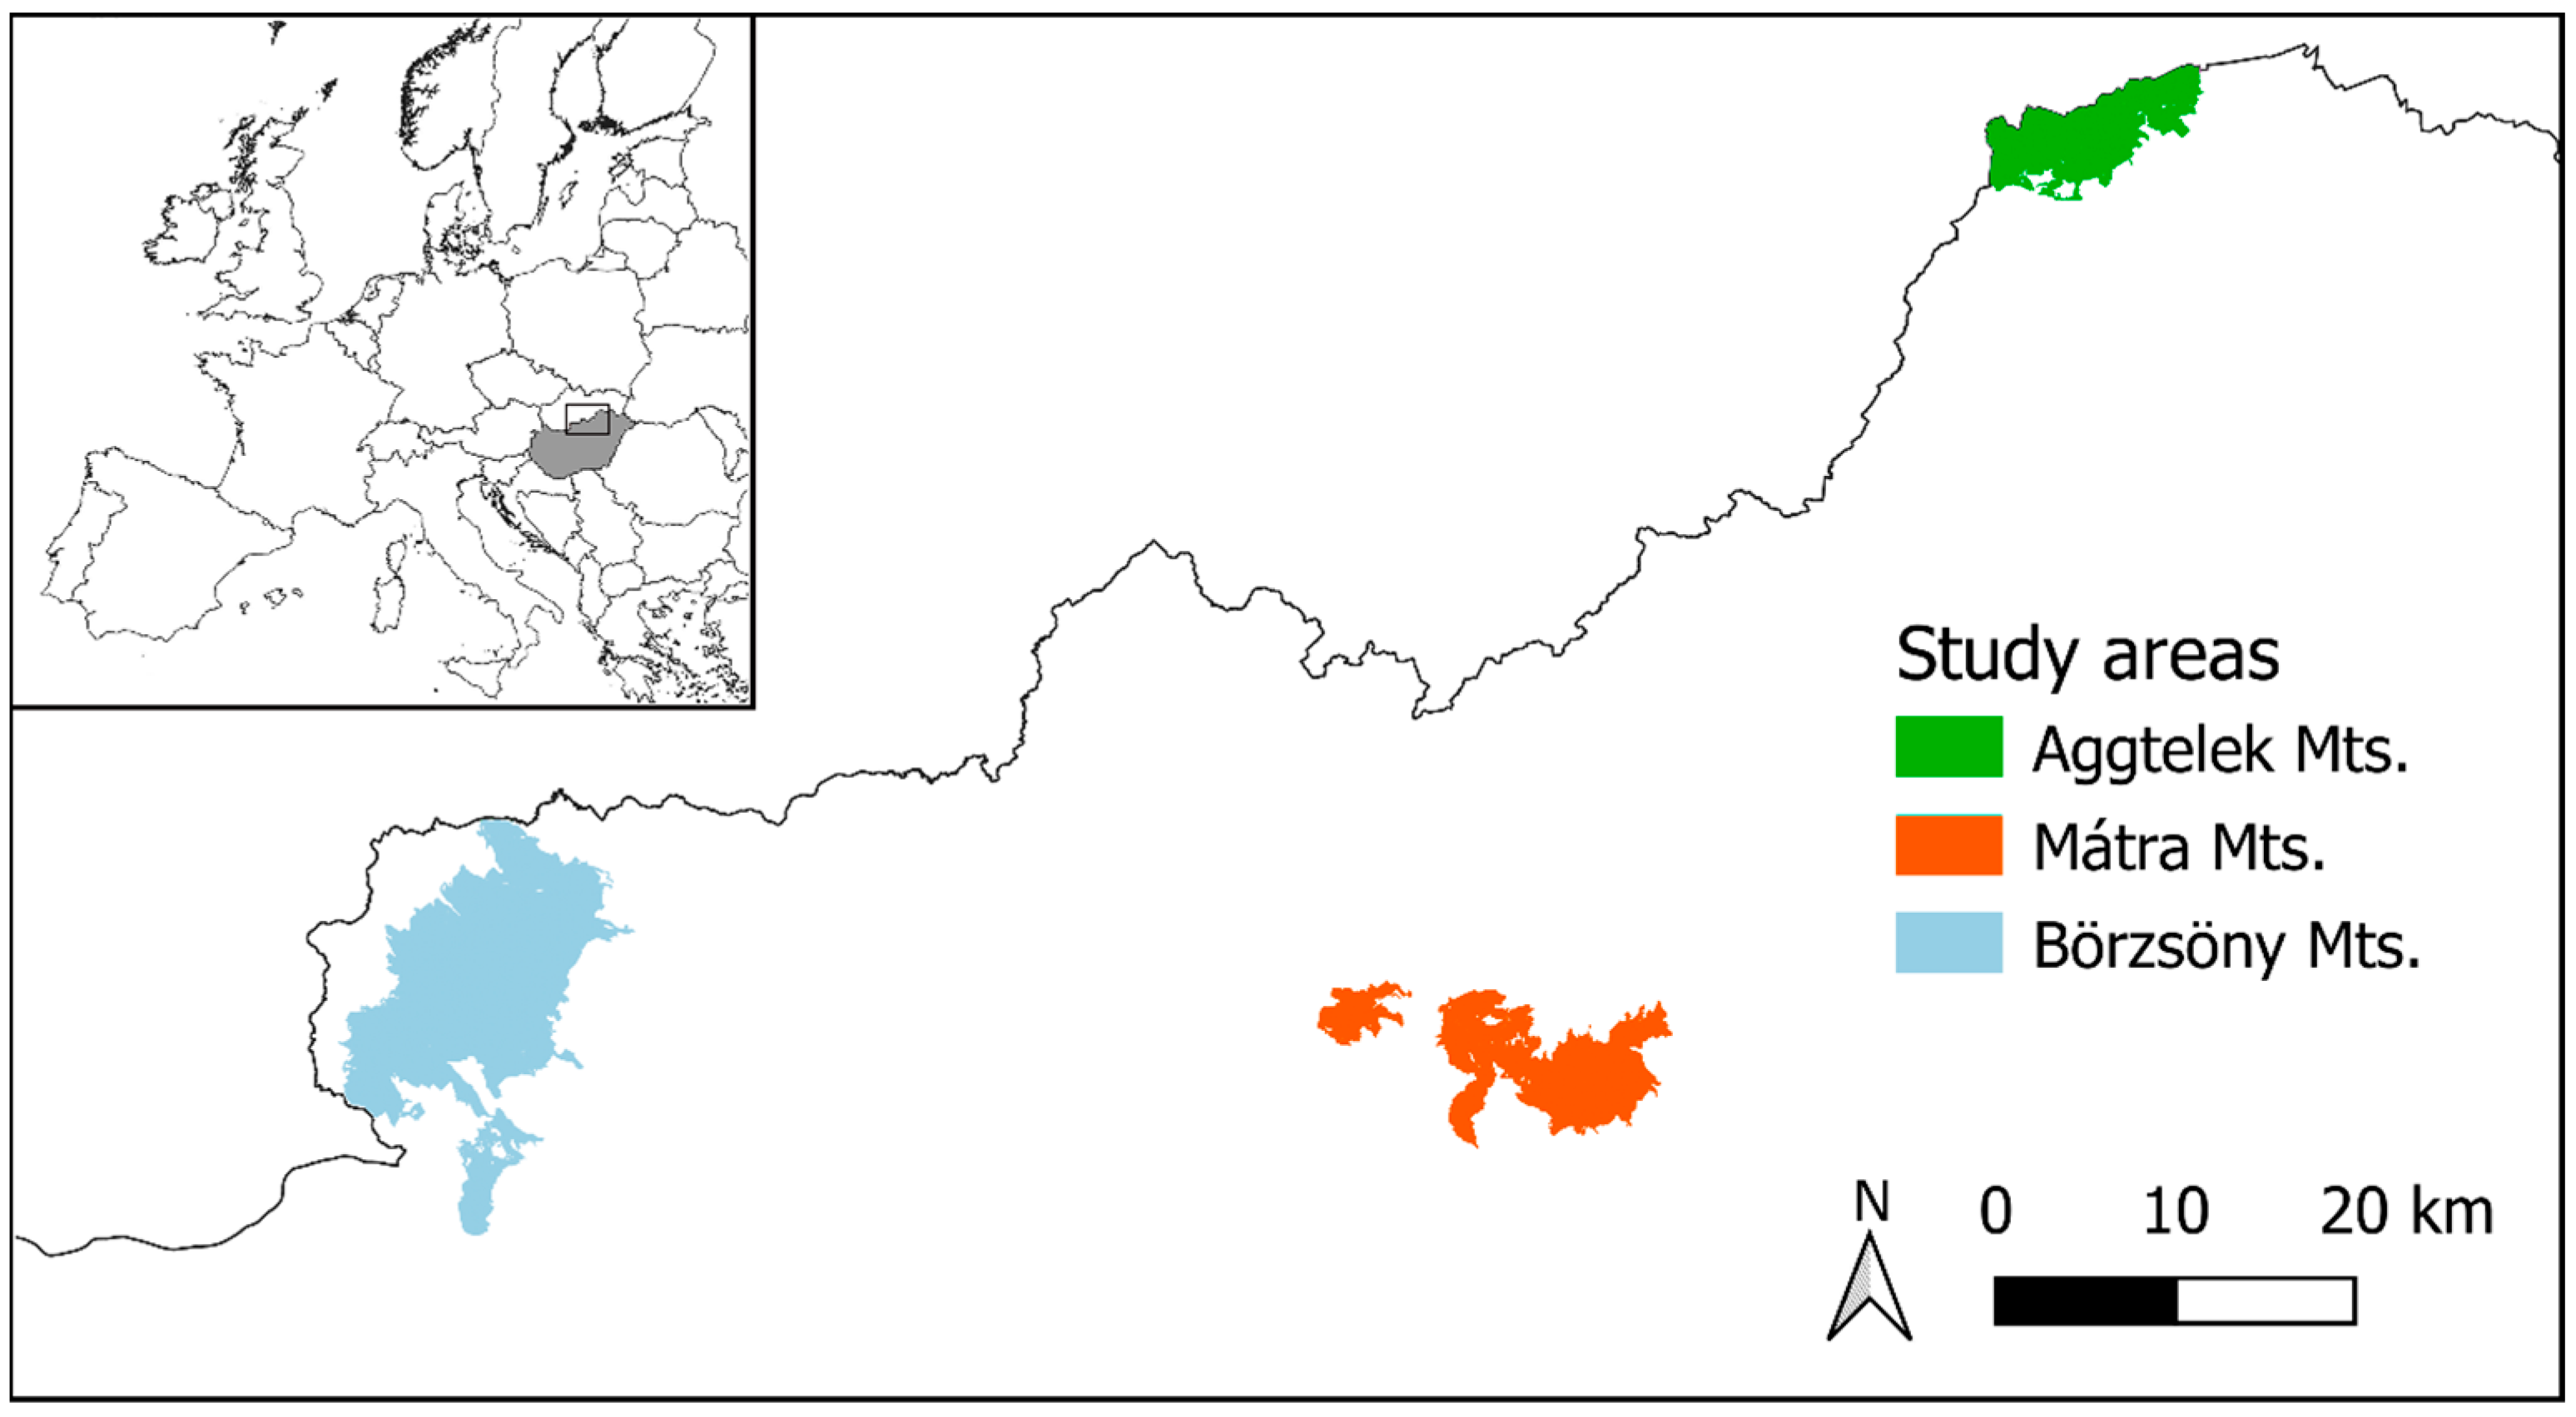
2.1. Study Areas
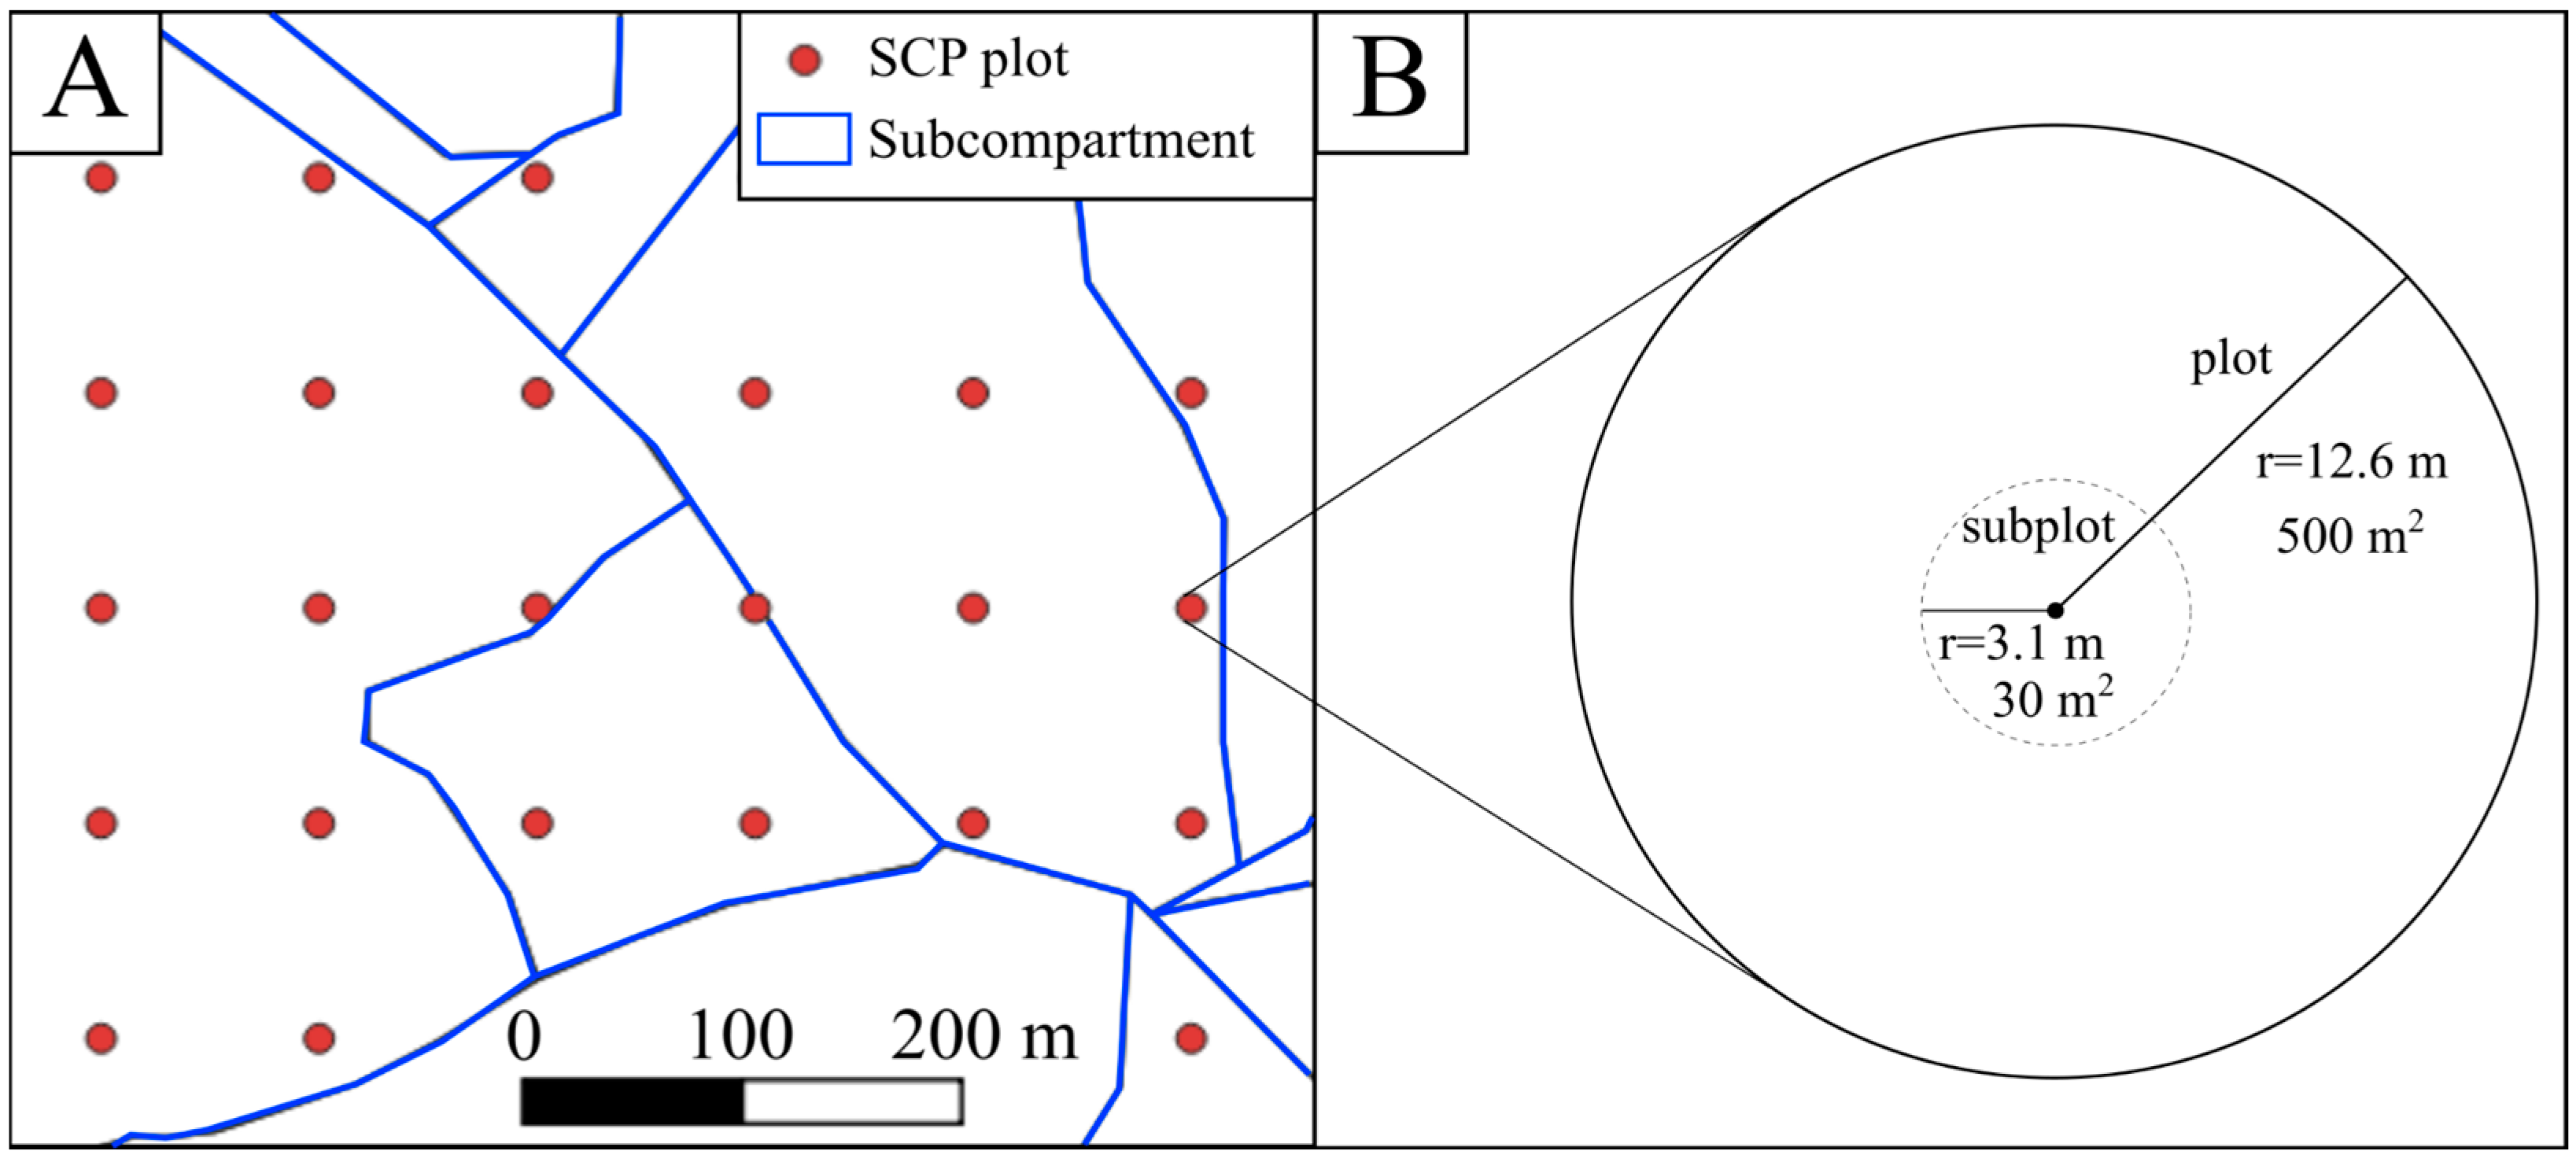
2.2. Data
2.3. Data Analysis
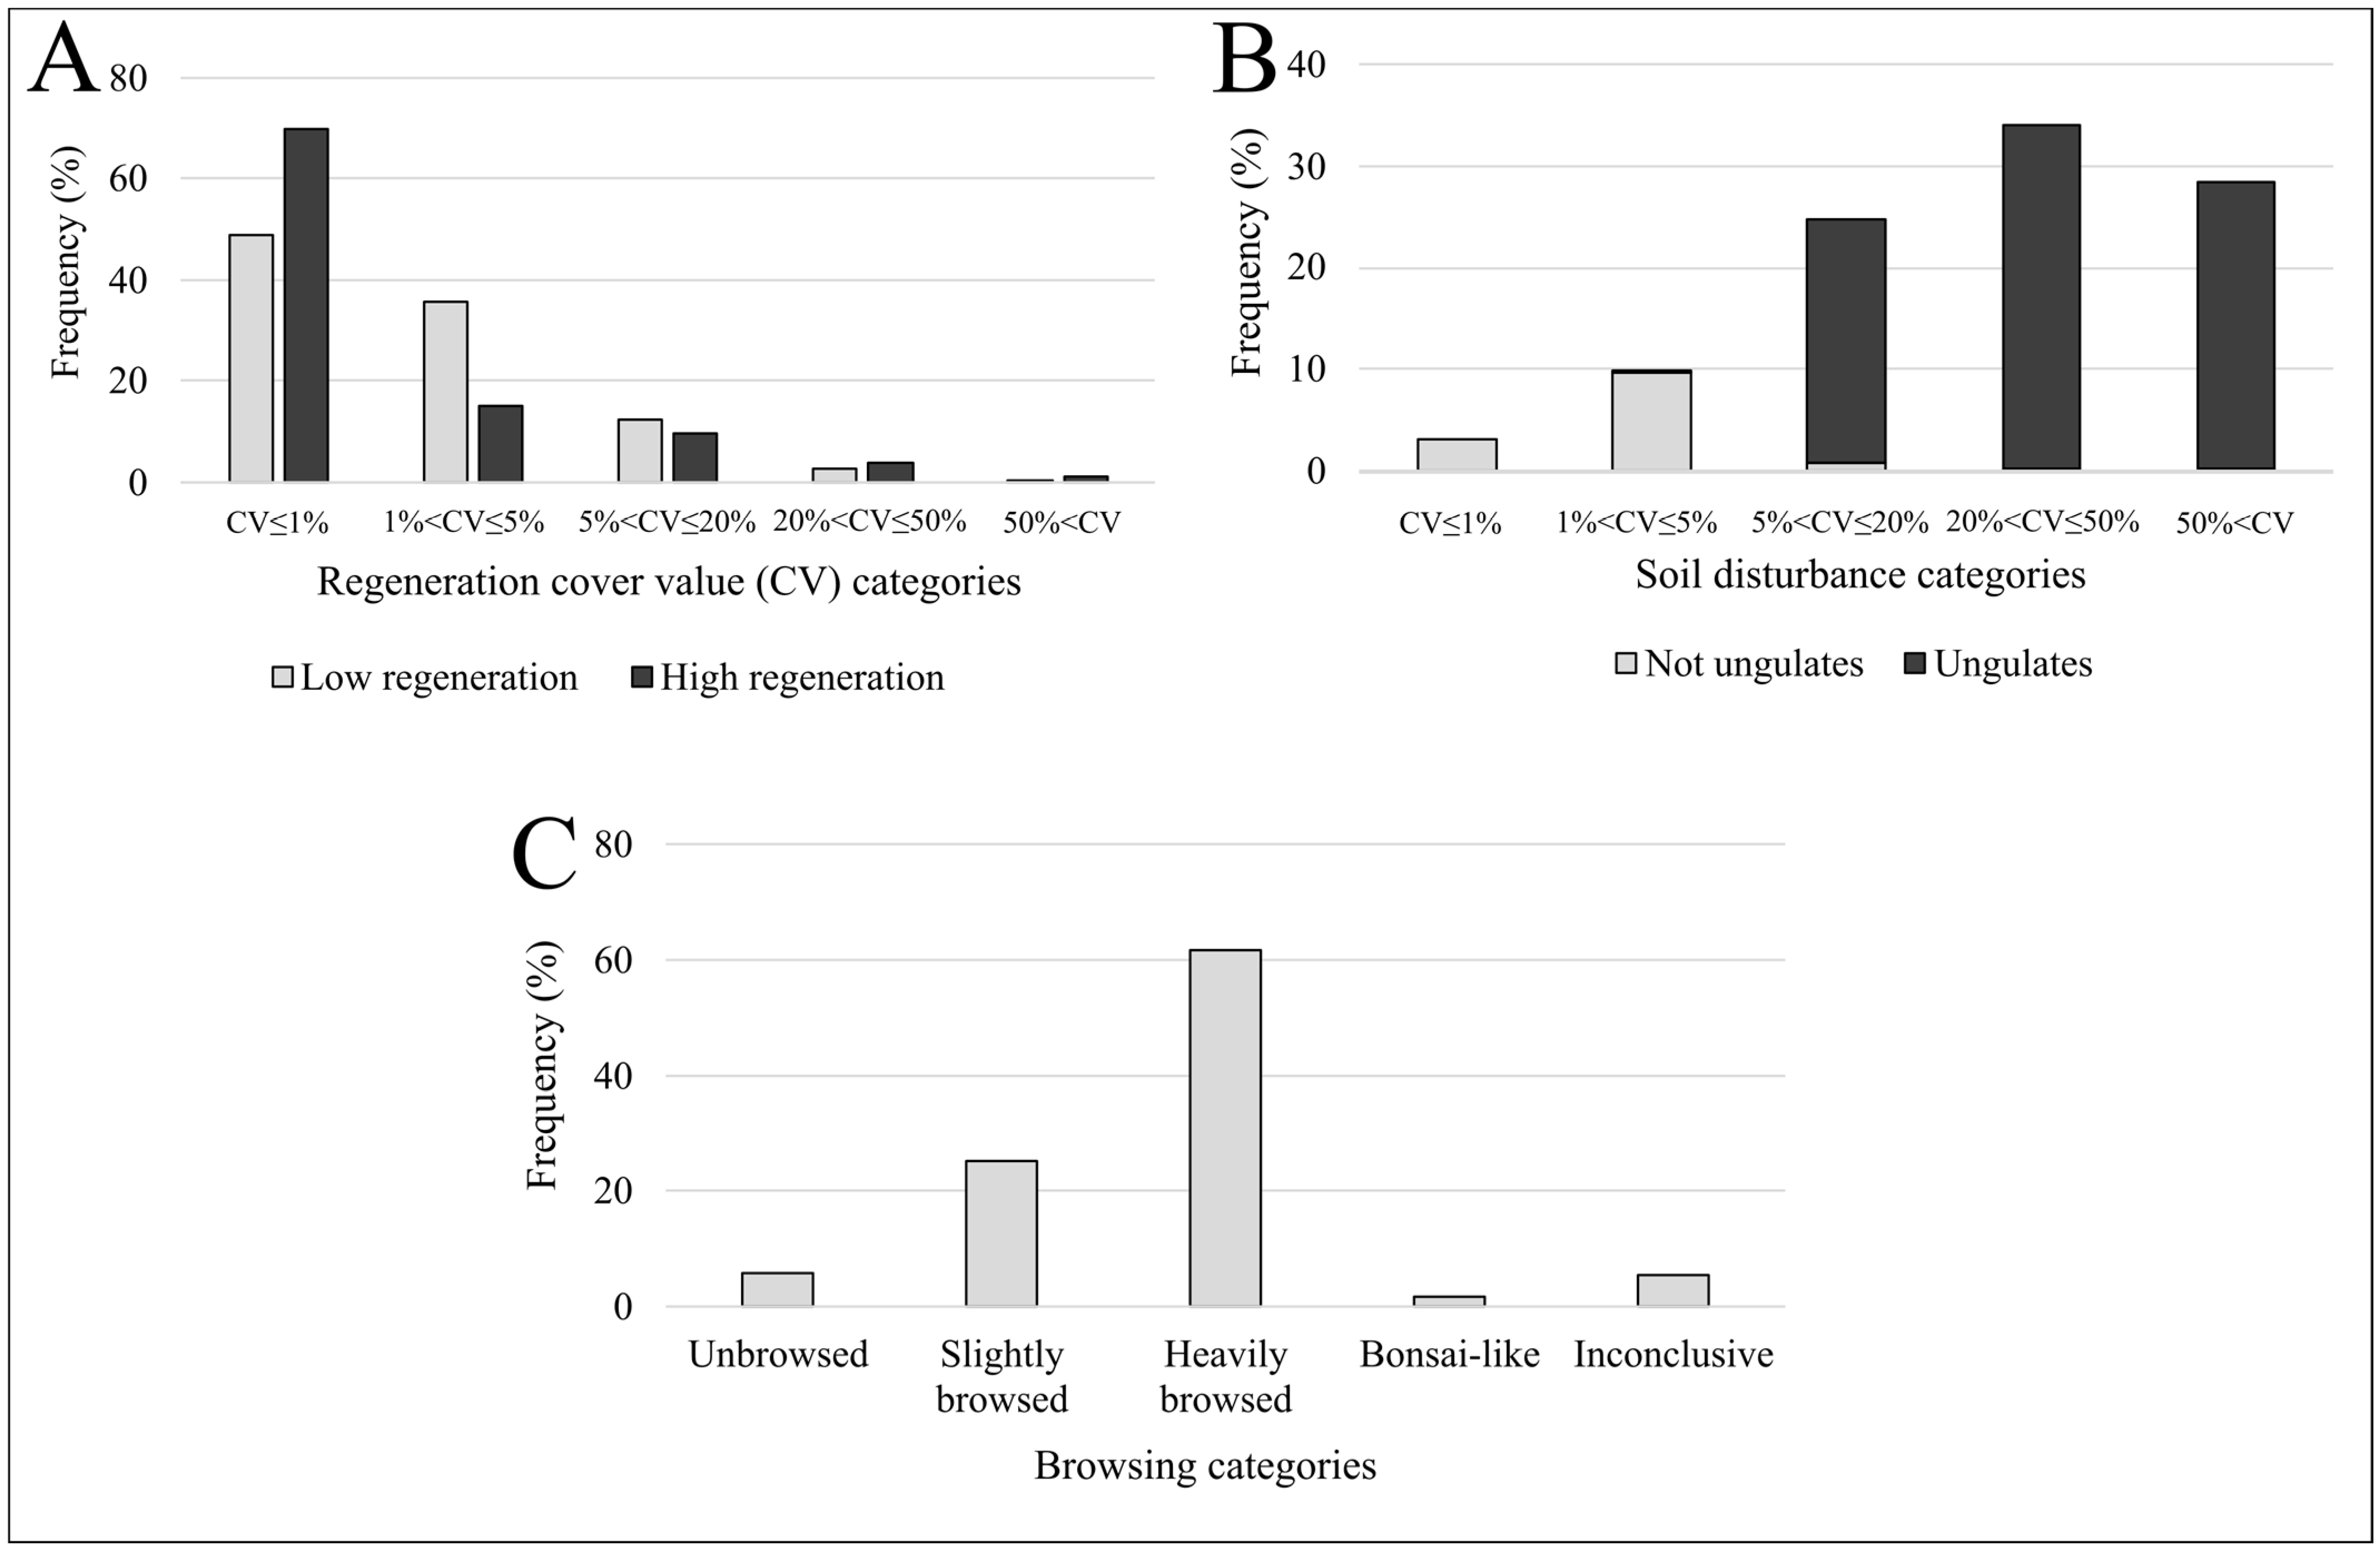
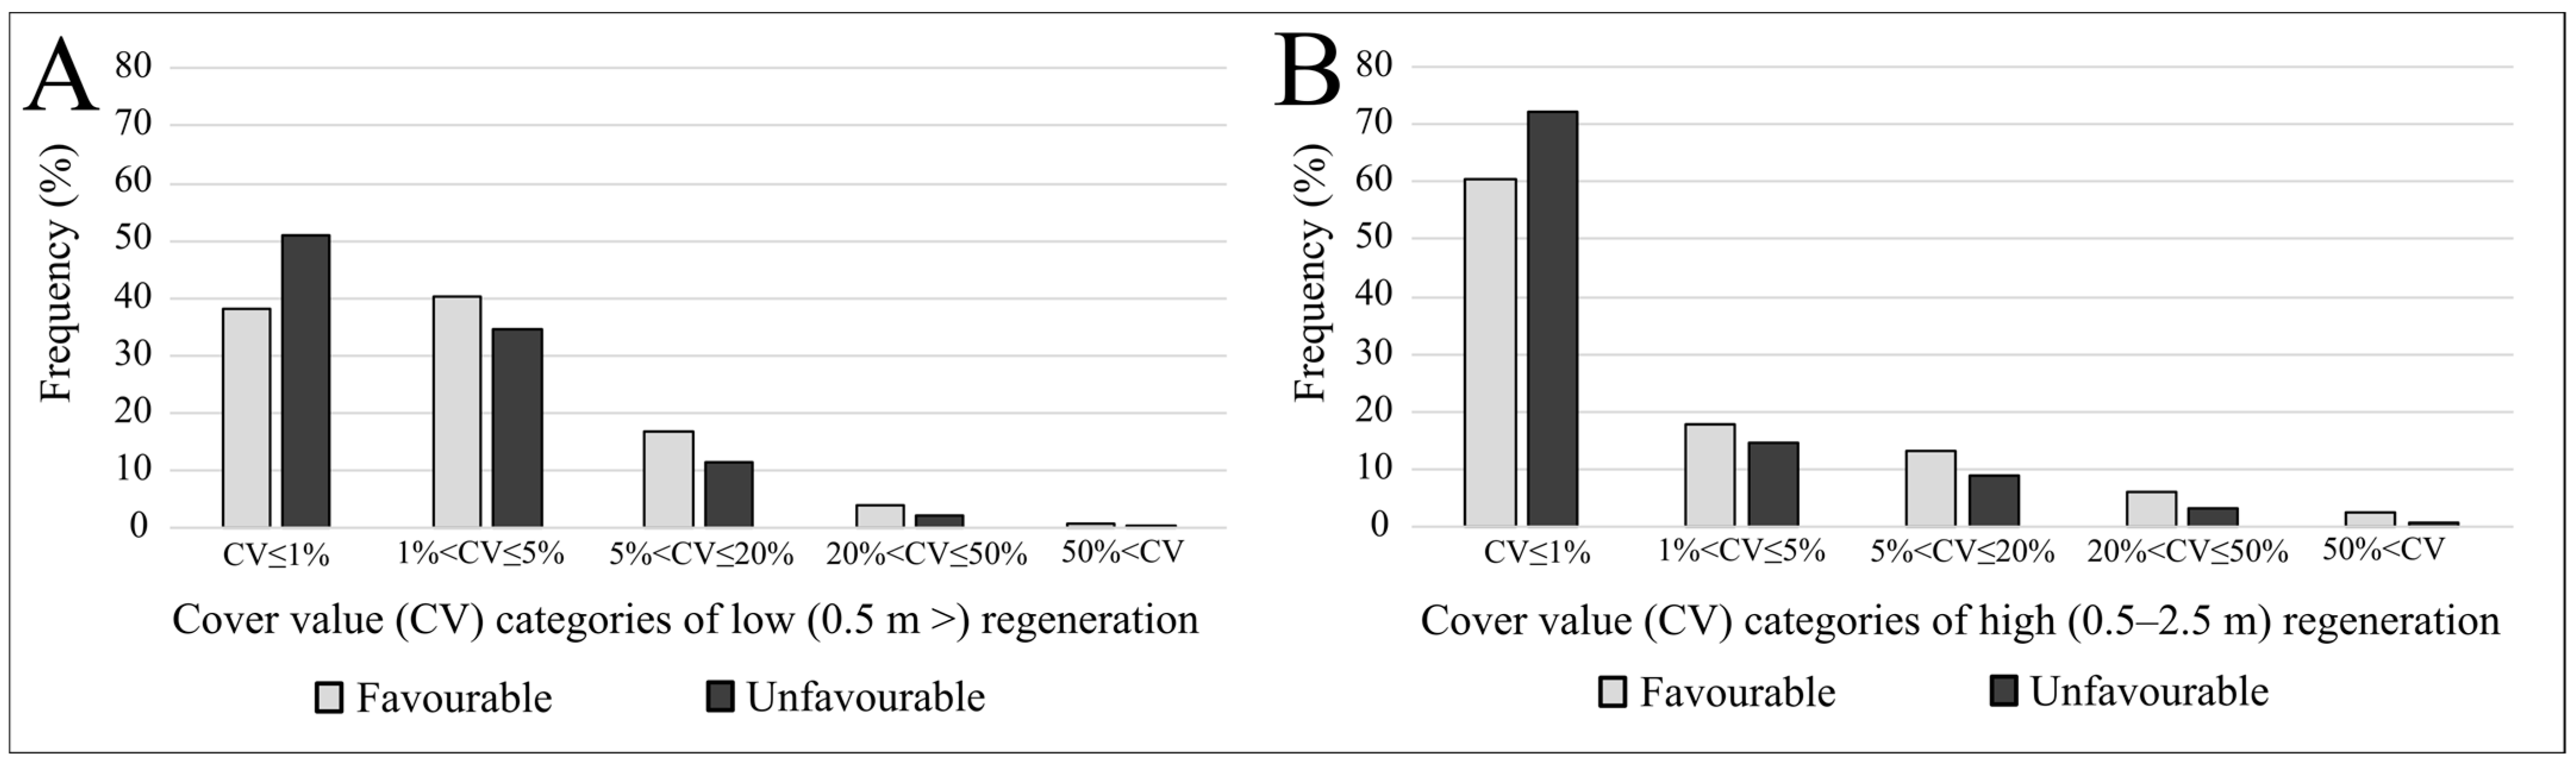
3. Results
4. Discussion
4.1. Frequency Distributions
4.2. The Lack of the Regeneration
4.3. Population Density
4.4. Interplay between Natural Disturbances, Forest Management and Ungulate Effects
4.5. Close-to-Nature Game Management
5. Conclusions
Author Contributions
Funding
Data Availability Statement
Acknowledgments
Conflicts of Interest
References
- Reimoser, F.; Putman, R. Impacts of Wild Ungulates on Vegetation: Costs and Benefits. In Ungulate Management in Europe: Problems and Practices; Putman, R., Apollonio, M., Andersen, R., Eds.; Cambridge University Press: Cambridge, UK, 2011; pp. 144–191. [Google Scholar]
- Groot Bruinderink, G.W.T.A.; Hazebroek, E.; Van Der Voot, H. Diet and Condition of Wild Boar, Sus Scrofa Scrofa, without Supplementary Feeding. J. Zool. 1994, 233, 631–648. [Google Scholar] [CrossRef]
- Ramirez, J.I.; Jansen, P.A.; Poorter, L. Effects of Wild Ungulates on the Regeneration, Structure and Functioning of Temperate Forests: A Semi-Quantitative Review. For. Ecol. Manag. 2018, 424, 406–419. [Google Scholar] [CrossRef]
- Wisdom, M.J.; Vavra, M.; Boyd, J.M.; Hemstrom, M.A.; Ager, A.A.; Johnson, B.K. Understanding Effects on Ungulate Needs Disturbance Dynamics: Knowledge Gaps and Vegetation Management Needs. Wildl. Soc. Bull. 2009, 34, 283–292. [Google Scholar] [CrossRef]
- Linnell, J.D.C.; Zachos, F.E. Status and Distribution Patterns of European Ungulates: Genetics, Population History and Conservation. In Ungulate Management in Europe: Problems and Practices; Putman, R., Apollonio, M., Reidar, A., Eds.; Cambridge University Press: Cambridge, UK, 2011; pp. 12–53. [Google Scholar]
- Carpio, A.J.; Apollonio, M.; Acevedo, P. Wild Ungulate Overabundance in Europe: Contexts, Causes, Monitoring and Management Recommendations. Mammal Rev. 2021, 51, 95–108. [Google Scholar] [CrossRef]
- Valente, A.M.; Acevedo, P.; Figueiredo, A.M.; Fonseca, C.; Torres, R.T. Overabundant Wild Ungulate Populations in Europe: Management with Consideration of Socio-Ecological Consequences. Mammal Rev. 2020, 50, 353–366. [Google Scholar] [CrossRef]
- Linnell, J.D.C.; Cretois, B.; Nilsen, E.B.; Rolandsen, C.M.; Solberg, E.J.; Veiberg, V.; Kaczensky, P.; Van Moorter, B.; Panzacchi, M.; Rauset, G.R.; et al. The Challenges and Opportunities of Coexisting with Wild Ungulates in the Human-Dominated Landscapes of Europe’s Anthropocene. Biol. Conserv. 2020, 244, 108500. [Google Scholar] [CrossRef]
- Ramirez, J.I.; Jansen, P.A.; den Ouden, J.; Goudzwaard, L.; Poorter, L. Long-Term Effects of Wild Ungulates on the Structure, Composition and Succession of Temperate Forests. For. Ecol. Manag. 2019, 432, 478–488. [Google Scholar] [CrossRef]
- Putman, R.; Langbein, J.; Green, P.; Watson, P. Identifying Threshold Densities for Wild Deer in the UK above Which Negative Impacts May Occur. Mammal Rev. 2011, 41, 175–196. [Google Scholar] [CrossRef]
- Motta, R. Impact of Wild Ungulates on Forest Regeneration and Tree Composition of Mountain Forests in the Western Italian Alps. For. Ecol. Manag. 1996, 88, 93–98. [Google Scholar] [CrossRef]
- Pfeffer, S.E.; Dressel, S.; Wallgren, M.; Bergquist, J.; Kalén, C. Browsing Damage on Scots Pine: Direct and Indirect Effects of Landscape Characteristics, Moose and Deer Populations. Diversity 2022, 14, 734. [Google Scholar] [CrossRef]
- Petersson, L.K.; Milberg, P.; Bergstedt, J.; Dahlgren, J.; Felton, A.M.; Götmark, F.; Salk, C.; Löf, M. Changing Land Use and Increasing Abundance of Deer Cause Natural Regeneration Failure of Oaks: Six Decades of Landscape-Scale Evidence. For. Ecol. Manag. 2019, 444, 299–307. [Google Scholar] [CrossRef]
- Spake, R.; Bellamy, C.; Gill, R.; Watts, K.; Wilson, T.; Ditchburn, B.; Eigenbrod, F. Forest Damage by Deer Depends on Cross-Scale Interactions between Climate, Deer Density and Landscape Structure. J. Appl. Ecol. 2020, 57, 1376–1390. [Google Scholar] [CrossRef]
- Reimoser, F. Steering the Impacts of Ungulates on Temperate Forests. J. Nat. Conserv. 2003, 10, 243–252. [Google Scholar] [CrossRef]
- Barrios-Garcia, M.N.; Ballari, S.A. Impact of Wild Boar (Sus Scrofa) in Its Introduced and Native Range: A Review. Biol. Invasions 2012, 14, 2283–2300. [Google Scholar] [CrossRef]
- Standovár, T.; Zoltán, L. A Gerecse, Száz-Völgy Erdőrezervátum Állapotfelmérése. Report; Danube-Ipoly National Park Directorate: Budapest, Hungary, 2019. [Google Scholar]
- Côté, S.D.; Rooney, T.P.; Tremblay, J.P.; Dussault, C.; Waller, D.M. Ecological Impacts of Deer Overabundance. Annu. Rev. Ecol. Evol. Syst. 2004, 35, 113–147. [Google Scholar] [CrossRef]
- Simon, T. Habitat Change Due to Stock of Game. In Forest Monitoring and Observation System (FMOS) (1988–2008); Kolozs, L., Ed.; Central Agriculture Office Centre, Forest Directorate: Budapest, Hungary, 2009; pp. 99–111. [Google Scholar]
- Csányi, S.; Lehoczki, R.; Sonkoly, K.; Bognár, G. Vadgazdálkodási Adattár 2004/2005, Vadászati Év; Department of Wildlife Biology and Management, Szent István University: Gödöllő, Hungary, 2005; p. 68. [Google Scholar]
- Fehér, Á.; Katona, K.; Szemethy, L. Okozhatnak-e a Csülkös Vadfajok Térségi Szintű Problémákat a Mátra Erdőiben? Vadbiológia 2016, 18, 17–26. [Google Scholar]
- Bajnai, C. Aktuális Gondolatok Az Erdei Vadkár Jelentőségéről. Erdészeti Lapok 2023, CLVIII, 190–191. [Google Scholar]
- Arany, I.; Török, P.; Aszalós, R. Vadkizárás Hatásának Vizsgálata Egy Déli-Bükki Endemikus Erdőtársulásban: Kompozíció, Produktivitás És Virágzási Siker. Természetvédelmi Közlemények 2007, 13, 81–92. [Google Scholar]
- Baráth, N.; Bartha, S.; Házi, J.; Wichmann, B.; Penksza, K. A Dolomitsziklagyepek Degradációjának És a Muflon (Ovis Musimon) Jelenlétének Összefüggései a Budai -Hegységben. Vadbiológia 2013, 15, 72–85. [Google Scholar]
- Csányi, S.; Lehoczki, R. Ungulates and Their Management in Hungary. In European Ungulates and their Management in the 21st Century; Apollonio, M., Andersen, R., Putman, R., Eds.; Cambridge University Press: Cambridge, UK, 2009; pp. 291–318. ISBN 9780521760614. [Google Scholar]
- NGMD National Game Management Database. Available online: http://www.ova.info.hu/index-en.html (accessed on 15 May 2023).
- Standovár, T.; Szmorad, F.; Kovács, B.; Kelemen, K.; Plattner, M.; Roth, T.; Pataki, Z. A Novel Forest State Assessment Methodology to Support Conservation and Forest Management Planning. Community Ecol. 2016, 17, 167–177. [Google Scholar] [CrossRef]
- Nagy, J. A Börzsöny Hegység Edényes Flórája. Rosalia 2; Duna-Ipoly Nemzeti Park Igazgatóság: Budapest, Hungary, 2007; ISBN 9789638768704. [Google Scholar]
- Bartholy, J.; Pongrácz, R. Éghajlattan; Edutus Főiskola: Budapest, Hungary, 2011. [Google Scholar]
- Székely, A. A Mátra Természeti Földrajza. Földrajzi Közlemények 1964, 12, 199–218. [Google Scholar]
- Újvárosy, A. Földrajzi Helyzet, Éghajlati Viszonyok. In Az Aggteleki Nemzeti Park; Baross, G., Ed.; Mezőgazda Kiadó: Budapest, Hungary, 1998; pp. 22–25. [Google Scholar]
- Zoltán, L.; Friedl, Z.; Pacskó, V.; Orbán, I.; Tanács, E.; Magyar, B.; Kristóf, D.; Standovár, T. Application of Sentinel-1 Radar Data for Mapping Ice Disturbance in a Forested Area. Eur. J. Remote Sens. 2021, 54, 568–587. [Google Scholar] [CrossRef]
- Csányi, S. A 2019/2020. Vadászati Év Vadgazdálkodási Eredményei Valamint a 2020. Tavaszi Vadállomány Becslési Adatok És Vadgazdálkodási Tervek; Department of Wildlife Biology and Management, Szent István University: Gödöllő, Hungary, 2020. [Google Scholar]
- Csányi, S. Red Deer Population Dynamics in Hungary: Management Statistics Versus Modeling. In The Biology of Deer; Brown, R.D., Ed.; Springer: New York, NY, USA, 1992; pp. 37–42. ISBN 9781461227823. [Google Scholar]
- Faragó, S. Vadászati Állattan; Mezőgazda Kiadó: Budapest, Hungary, 2002; ISBN 9632861795. [Google Scholar]
- Kolozs, L.; Szepesi, A. Chapter 16—Hungary. In National Forest Inventories: Pathways for Common Reporting; Tomppo, E., Gschwantner, T., Lawrence, M., McRoberts, R.E., Eds.; Springer: Berlin, Germany, 2010; pp. 269–276. ISBN 9789048132324. [Google Scholar]
- R Core Team. R: A Language and Environment for Statistical Computing; R Foundation for Statistical Computing: Vienna, Austria, 2022. [Google Scholar]
- Dinno, A. R Package, Version 1.3.5; Dunn.Test: Dunn’s Test of Multiple Comparisons Using Rank Sums. Available online: https://cran.r-project.org/web/packages/dunn.test/index.html (accessed on 15 December 2022).
- Didion, M.; Kupferschmid, A.D.; Bugmann, H. Long-Term Effects of Ungulate Browsing on Forest Composition and Structure. For. Ecol. Manag. 2009, 258S, S44–S55. [Google Scholar] [CrossRef]
- Singer, F.J.; Swank, W.T.; Clebsch, E.E.C. Effects of Wild Pig Rooting in a Deciduous Forest. J. Wildl. Manag. 1984, 48, 464–473. [Google Scholar] [CrossRef]
- Standovár, T.; Bán, M.; Kézdy, P. Erdőállapot-Értékelés Középhegységi Erdeinkben. Tanulmánygyűjtemény. Rosalia 9; Duna-Ipoly Nemzeti Park Igazgatóság: Budapest, Hungary, 2017. [Google Scholar]
- Szmorad, F.; Standovár, T. Az Erdei Vadhatás És a Természetes Újulat Térségi Szintű Vizsgálata Az Északi-Középhegységben. Erdészettudományi Közlemények 2023, 13. in press. [Google Scholar]
- Zoltán, L.; Standovár, T. A 2014-Es Jégtörés Tulajdonságai És Az Azt Követő Erdészeti Fakitermelés Hatásai a Börzsöny Erdeiben. Természetvédelmi Közlemények 2018, 24, 208–216. [Google Scholar] [CrossRef]
- Vera, F.W.M. Grazing Ecology and Forest History; CABI Publishing: Wallingford, UK, 2000; ISBN 0851994423. [Google Scholar]
- Jensen, A.M.; Löf, M.; Witzell, J. Effects of Competition and Indirect Facilitation by Shrubs on Quercus Robur Saplings. Plant Ecol. 2012, 213, 535–543. [Google Scholar] [CrossRef]
- Gill, R.M.A. A Review of Damage by Mammals in North Temperate Forests: 1. Deer. Forestry 1992, 65, 145–169. [Google Scholar] [CrossRef]
- Kouki, J.; Arnold, K.; Martikainen, P. Long-Term Persistence of Aspen—A Key Host for Many Threatened Species—Is Endangered in Old-Growth Conservation Areas in Finland. J. Nat. Conserv. 2004, 12, 41–52. [Google Scholar] [CrossRef]
- Sütő, D.; Farkas, J.; Katona, K. Vadfajok Hatása Egy Szálaló Üzemmódú Száraz Tölgyes Felújulására. Tájökológiai Lapok 2017, 15, 31–41. [Google Scholar] [CrossRef]
- Kenderes, K.; Král, K.; Vrška, T.; Standovár, T. Natural Gap Dynamics in a Central European Mixed Beech-Spruce-Fir Old-Growth Forest. Ecoscience 2009, 16, 39–47. [Google Scholar] [CrossRef]
- Hagge, J.; Müller, J.; Bässler, C.; Biebl, S.S.; Brandl, R.; Drexler, M.; Gruppe, A.; Hotes, S.; Hothorn, T.; Langhammer, P.; et al. Deadwood Retention in Forests Lowers Short-Term Browsing Pressure on Silver Fir Saplings by Overabundant Deer. For. Ecol. Manag. 2019, 451, 117531. [Google Scholar] [CrossRef]
- Schulze, E.D.; Bouriaud, O.; Wäldchen, J.; Eisenhauer, N.; Walentowski, H.; Seele, C.; Heinze, E.; Pruschitzki, U.; Dănilă, G.; Marin, G.; et al. Ungulate Browsing Causes Species Loss in Deciduous Forests Independent of Community Dynamics and Silvicultural Management in Central and Southeastern Europe. Ann. For. Res. 2014, 57, 267–288. [Google Scholar] [CrossRef]
- Fehér, Á.; Katona, K. Spontán Beerdősülő Területek És a Nagytestű Növényevők Hatása: Lehetőség a Fenntartható Gazdálkodásra. Tájökológiai Lapok 2013, 11, 197–204. [Google Scholar] [CrossRef]
- NÉBIH ASP Előfordulások/Esetek. Available online: https://portal.nebih.gov.hu/asp-elofordulasok (accessed on 15 November 2023).
- Csányi, S.; Márton, M.; Bőti, S.; Gergely, S. Hungarian Game Management Database, 2022/2023 Hunting Year; Institute for Wildlife Management and Nature Conservation, Hungarian University of Agriculture and Life Sciences: Gödöllő, Hungary, 2023. [Google Scholar]
- Gilbert, N.A.; Clare, J.D.J.; Stenglein, J.L.; Zuckerberg, B. Abundance Estimation of Unmarked Animals Based on Camera-Trap Data. Conserv. Biol. 2021, 35, 88–100. [Google Scholar] [CrossRef] [PubMed]
- Henrich, M.; Hartig, F.; Dormann, C.F.; Kühl, H.S.; Peters, W.; Franke, F.; Peterka, T.; Šustr, P.; Heurich, M. Deer Behavior Affects Density Estimates With Camera Traps, but Is Outweighed by Spatial Variability. Front. Ecol. Evol. 2022, 10, 881502. [Google Scholar] [CrossRef]
- Marcon, A.; Battocchio, D.; Apollonio, M.; Grignolio, S. Assessing Precision and Requirements of Three Methods to Estimate Roe Deer Density. PLoS ONE 2019, 14, e0222349. [Google Scholar] [CrossRef]
- Weisberg, P.J.; Bugmann, H. Forest Dynamics and Ungulate Herbivory: From Leaf to Landscape. For. Ecol. Manag. 2003, 181, 1–12. [Google Scholar] [CrossRef]
- Kenderes, K.; Aszalós, R.; Ruff, J.; Barton, Z.; Standovár, T. Effects of Topography and Tree Stand Characteristics on Susceptibility of Forests to Natural Disturbances (Ice and Wind) in the Börzsöny Mountains (Hungary). Community Ecol. 2007, 8, 209–220. [Google Scholar] [CrossRef]
- Hejel, P.; Katona, K.; Békési, S.; Szemethy, L. Bükkös Felújítások Szerpe a Növényevő Nagyvad Táplálkozó Területenként. Vadbiológia 2013, 15, 9–16. [Google Scholar]
- Kuijper, D.P.J.; Jedrzejewska, B.; Brzeziecki, B.; Churski, M.; Jedrzejewski, W.; Zybura, H. Fluctuating Ungulate Density Shapes Tree Recruitment in Natural Stands of the Białowieza Primeval Forest, Poland. J. Veg. Sci. 2010, 21, 1082–1098. [Google Scholar] [CrossRef]
- Tanentzap, A.J.; Burrows, L.E.; Lee, W.G.; Nugent, G.; Maxwell, J.M.; Coomes, D.A. Landscape-level Vegetation Recovery from Herbivory Progress after Four Decades of Invasive Red Deer Control. J. Appl. Ecol. 2009, 46, 1064–1072. [Google Scholar] [CrossRef]
- Faragó, S.; Pintér, I. A Fenntartható Természetközeli Vadgazdálkodás Feltételrendszere. In Proceedings of the X. Wood-Tech Erdészeti Szakmai Konferencia Előadásai; Péterfalvi, J., Ed.; Faculty of Forestry, University of West Hungary: Sopron, Hungary, 2002; pp. 57–67. [Google Scholar]
- Apollonio, M.; Belkin, V.V.; Borkowski, J.; Borodin, O.I.; Borowik, T.; Cagnacci, F.; Danilkin, A.A.; Danilov, P.I.; Faybich, A.; Ferretti, F.; et al. Challenges and Science-Based Implications for Modern Management and Conservation of European Ungulate Populations. Mammal Res. 2017, 62, 209–217. [Google Scholar] [CrossRef]
- Evt. Évi XXXVII. Törvény Az Erdőről, Az Erdő Védelméről És Az Erdőgazdálkodásról. (Act No. XXXVII of 2009 on Forests, on the Protection and Management of Forests). 2009. Available online: https://nfk.gov.hu/download.php?id_file=44885 (accessed on 15 May 2023).
- van Beeck Calkoen, S.T.S.; Mühlbauer, L.; Andrén, H.; Apollonio, M.; Balčiauskas, L.; Belotti, E.; Carranza, J.; Cottam, J.; Filli, F.; Gatiso, T.T.; et al. Ungulate Management in European National Parks: Why a More Integrated European Policy Is Needed. J. Environ. Manag. 2020, 260, 110068. [Google Scholar] [CrossRef]


| Ungulate Species | Population (103 ind.) | Harvest (103 ind.) | ||
|---|---|---|---|---|
| 1960 | 2020 | 1960 | 2020 | |
| Red deer (Cervus elaphus L.) | 14.0 | 119.1 | 3.8 | 65.6 |
| European fallow deer (Dama dama L.) * | 0.9 | 40.9 | 0.7 | 16.9 |
| Roe deer (Capreolus capreolus L.) | 68.8 | 375.5 | 3.7 | 108.7 |
| European mouflon (Ovis aries musimon Pall.) * | 1.4 | 12.8 | 0.2 | 3.6 |
| Wild boar (Sus scrofa L.) | 8.3 | 83.0 | 3.9 | 181.1 |
| Ungulate Species | Population Density (ind./km2) in Game Management Regions | ||
|---|---|---|---|
| Börzsöny-Gödöllő GMR | Bükk GMR | Cserehát-Aggtelek GMR | |
| Red deer (Cervus elaphus L.) | 2.0 | 1.7 | 1.5 |
| European fallow deer (Dama dama L.) * | 0.3 | 0.1 | 0.0 |
| Roe deer (Capreolus capreolus L.) | 3.0 | 2.4 | 2.6 |
| European mouflon (Ovis aries musimon Pall.) * | 0.4 | 0.5 | 0.0 * |
| Wild boar (Sus scrofa L.) | 2.1 | 1.5 | 1.7 |
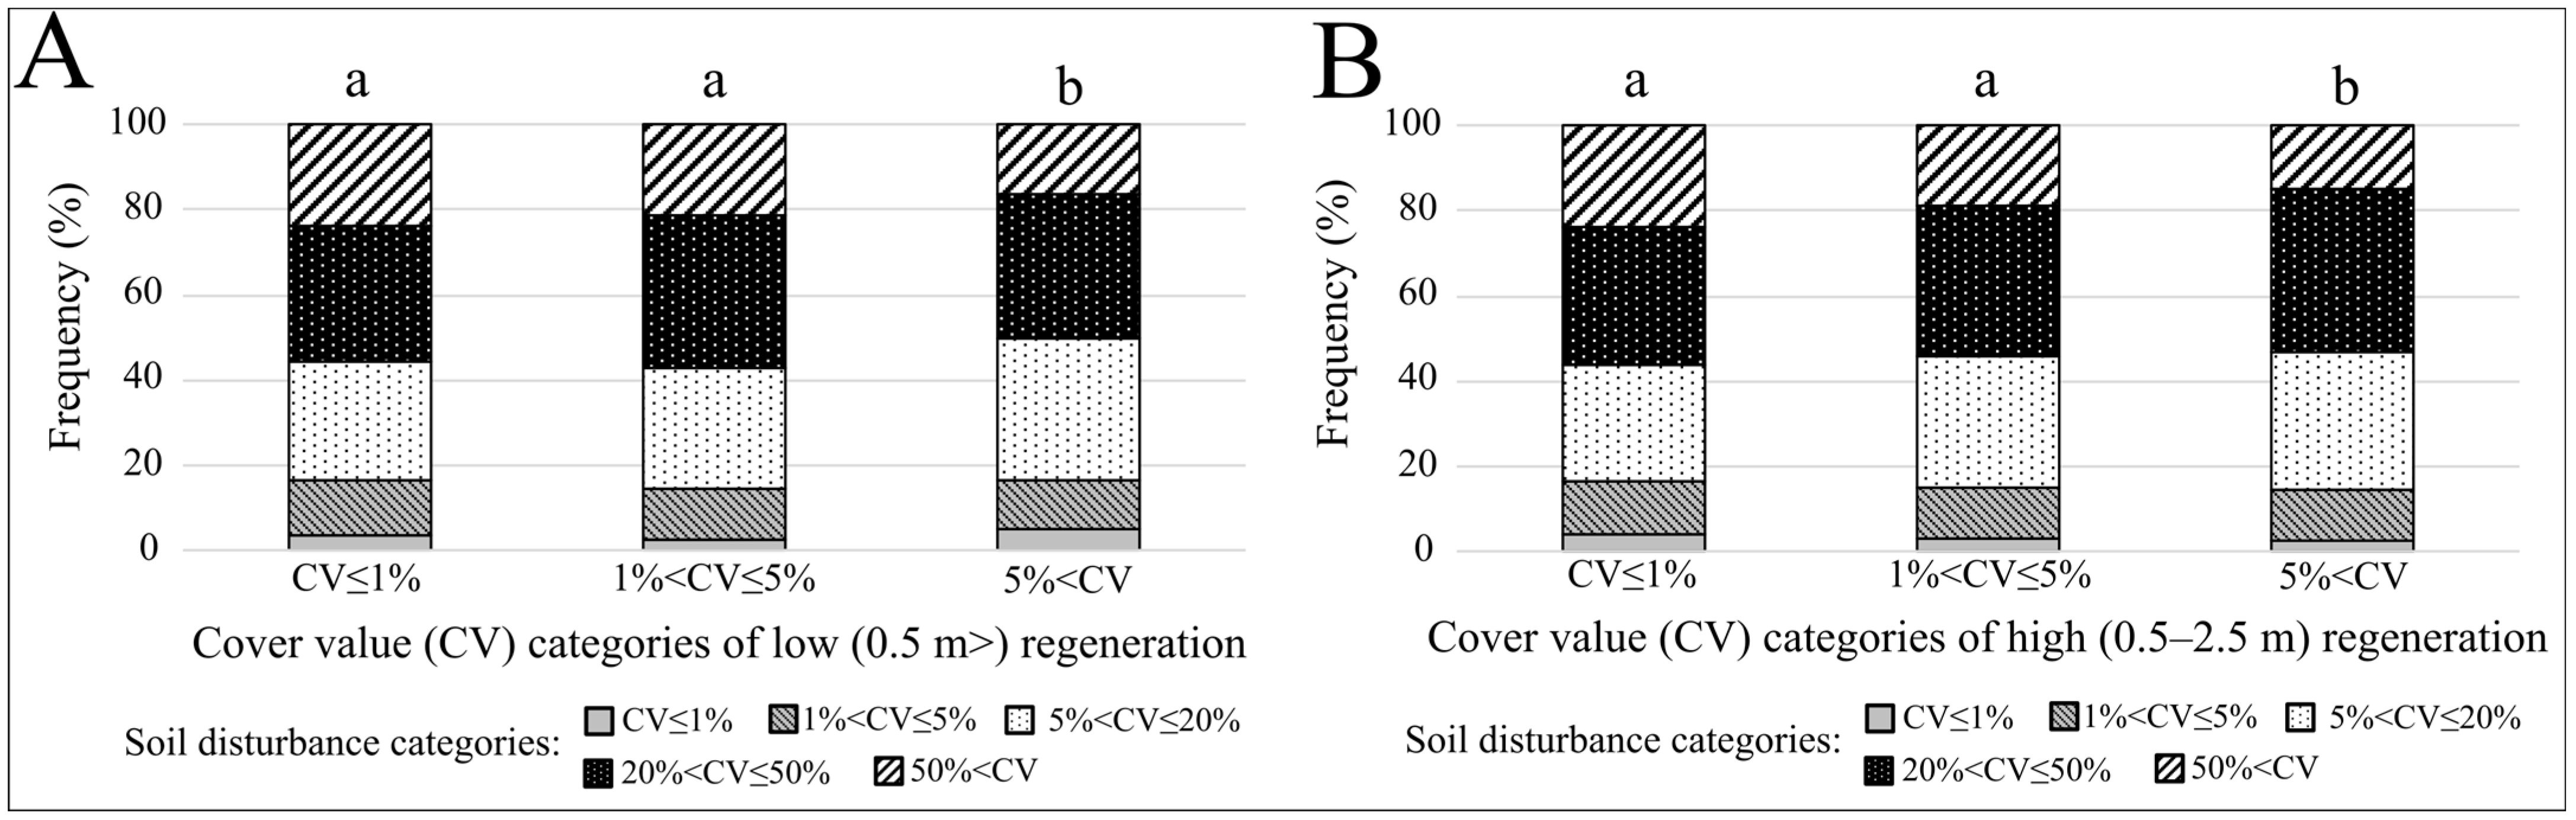
| Low (<0.5 m) Regeneration | High (0.5–2.5 m) Regeneration | |||||
|---|---|---|---|---|---|---|
| Cover Value (CV) Categories | CV ≤ 1% | 1% < CV ≤ 5% | 5% < CV | CV ≤ 1% | 1% < CV ≤ 5% | 5% < CV |
| CV ≤ 1% | ||||||
| 1% < CV ≤ 5% | p = 0.28 d = −0.57 | p = 0.17 d = −0.95 | ||||
| 5% < CV | p < 0.001 d = 5.34 | p < 0.001 d = 5.89 | p < 0.001 d = 4.76 | p < 0.001 d = 4.41 | ||
Disclaimer/Publisher’s Note: The statements, opinions and data contained in all publications are solely those of the individual author(s) and contributor(s) and not of MDPI and/or the editor(s). MDPI and/or the editor(s) disclaim responsibility for any injury to people or property resulting from any ideas, methods, instructions or products referred to in the content. |
© 2023 by the authors. Licensee MDPI, Basel, Switzerland. This article is an open access article distributed under the terms and conditions of the Creative Commons Attribution (CC BY) license (https://creativecommons.org/licenses/by/4.0/).
Share and Cite
Zoltán, L.; Szmorad, F.; Standovár, T. Heavy Ungulate Pressure behind the Disappearance of Regeneration in Hungarian Forests. Forests 2024, 15, 54. https://doi.org/10.3390/f15010054
Zoltán L, Szmorad F, Standovár T. Heavy Ungulate Pressure behind the Disappearance of Regeneration in Hungarian Forests. Forests. 2024; 15(1):54. https://doi.org/10.3390/f15010054
Chicago/Turabian StyleZoltán, László, Ferenc Szmorad, and Tibor Standovár. 2024. "Heavy Ungulate Pressure behind the Disappearance of Regeneration in Hungarian Forests" Forests 15, no. 1: 54. https://doi.org/10.3390/f15010054
APA StyleZoltán, L., Szmorad, F., & Standovár, T. (2024). Heavy Ungulate Pressure behind the Disappearance of Regeneration in Hungarian Forests. Forests, 15(1), 54. https://doi.org/10.3390/f15010054