Article

The Diversity and Community Pattern of Liverworts on Sygera Mountain, Tibet

1
College of Resources and Environmental Sciences, China Agricultural University, Beijing 100193, China
2
Beijing Key Laboratory of Biodiversity and Organic Farming, China Agricultural University, Beijing 100193, China
3
Resources & Environment College, Tibet Agriculture & Animal Husbandry University, Nyingchi 860000, China
4
Key Laboratory of Forest Ecology and Management, Institute of Applied Ecology, Chinese Academy of Sciences, Shenyang 110016, China
5
Institute of Tibet Plateau Ecology, Tibet Agriculture & Animal Husbandry University, Nyingchi 860000, China
6
Key Laboratory of Forest Ecology in Tibet Plateau, Tibet Agriculture & Animal Husbandry University, Ministry of Education, Nyingchi 860000, China
*
Author to whom correspondence should be addressed.
These authors contributed equally to this work.
Forests 2024, 15(1), 48; https://doi.org/10.3390/f15010048
Submission received: 26 October 2023 / Revised: 15 December 2023 / Accepted: 21 December 2023 / Published: 25 December 2023

Abstract

:
Elevation has been a cornerstone of biodiversity research, and changes in the environmental factors behind it influence biodiversity and community patterns. Exploring the potential reasons behind liverwort community patterns has been a matter of multiplied interest for ecologists. In the present study, we recorded the liverwort taxa of Sygera Mountain growing on decaying wood, trees, soil, and rocks along an elevational gradient from 3100 m to 4500 m using complex field surveys in 2017 and 2019; we investigated the effects of elevation and various climatic factors on the liverworts’ diversity and community composition. Furthermore, we used mixed effect modeling, NMDS, ANOSIM, and CCA to help us critically assess liverwort diversity with respect to environmental variables. The results of the study showed a bimodal variation in the richness of liverwort communities according to elevation, with peaks occurring at 3500 m and 4100 m, respectively. The variation in elevation was significant, with communities at 4300 m being associated with high mean diurnal range environments and those at 3100 m and 3300 m favoring areas of higher solar radiation and the precipitation of the wettest month. Among the climatic factors, the variation in the mean diurnal range was found to be the determinant of liverwort communities. The results suggest that the mean diurnal range plays a crucial role in the distribution and community structure formation of mountain liverwort. This study deepens our understanding of liverwort ecology and emphasizes the importance of climatic variables in determining liverwort community composition.

1. Introduction

Deciphering the patterns and drivers of biodiversity is one of the fundamental challenges in the fields of biogeography and ecology. Elevational gradients as natural laboratories provide valuable insights into this field. The relationship between elevation and diversity has been a focus of ecological research since Humboldt’s early 19th-century observations of changes in Andean vegetation [1]. While early studies largely outlined descriptive patterns, recent advances, supported by sophisticated field tools and mathematical statistical methods, have delved into the mechanistic underpinnings of these patterns [2,3].
Elevational gradients have long been used as natural laboratories for studying species diversity and distribution [4]. Traditionally, mountainous areas have commonly shown a pattern of declining species diversity as elevation increases, primarily due to climatic limitations [5]. However, a number of studies have revealed that many mountain ranges display puzzling peaks in intermediate elevation diversity and have challenged the classical paradigm [6]. Several hypotheses—ranging from evolutionary dynamics and habitat heterogeneity to species interactions—have been posited to explain these intricate patterns [7].
Elevation reflects a series of interrelated biotic and abiotic determinants. As an elevation rises or falls, there are certain changes in climate, soil composition, and geographic processes [8,9,10]. The role of climate in shaping biological processes is well known. As elevation increases, decreases in temperature and pressure become pronounced, which affect the physiological and metabolic activities of organisms [11]. Changes in diurnal temperature differences, the frequency of frost events, and changes in precipitation patterns across the elevation gradient determine species’ life strategies [12]. Parallel to climatic influences, elevation significantly alters the soil profile of an area. From depth and texture to nutrient content, soils change with elevation gradients [13]. Geology and topography resulting from a variety of geographic processes further amplify the biological impacts of elevation [14]. Processes such as erosion, glaciation, and tectonic activity can both create barriers to species dispersal and open up new habitats [15]. The orientation of hillsides can determine sunlight exposure, drainage patterns, and windbreaks, all of which can regulate local microclimates and influence the life histories of species [16,17].
The diverse ecological niches presented by mountain ranges on different continents create a rich tapestry of environments for bryophytes. This provides an unparalleled opportunity to study their adaptations and survival strategies under varying climatic and geographical conditions [18,19,20,21]. This global perspective not only enriches our understanding of bryophytes’ role in ecological networks but also deepens our insights into how environmental factors contribute to their diversity and distribution. Furthermore, comparative studies across these mountain ranges present a compelling narrative on the universality and specificity of ecological factors influencing bryophyte communities [22]. By examining the similarities and differences in bryophyte diversity across diverse mountainous landscapes, these studies illuminate the complex interplay between local and global ecological dynamics [23].
Liverworts, among the earliest groups of land plants, have an evolutionary history that can be traced back according to periods ranging from 29.7 to 37.6 million years ago [24,25]. They are usually non-vascular bundles and lack the special tissue system found in more evolved plants [26]. On the contrary, they have a simple structure that is either thalloid (flat and banded) or leafy [27]. They mainly fix themselves on wet substrates, from soil and rotten wood to rocks, usually in a cool or humid environment [28]. Some species have even adapted to more challenging terrains, such as bare rocks or tree trunks. In liverworts, rhizoids are recognized as slender, hair-like appendages primarily functioning to secure the plant to its substrate. While they do assist in the absorption of water and nutrients, this role is somewhat limited compared with the entire plant body [29,30]. Liverworts show innumerable forms of adaptability to survive in different environments. Many species are resistant to dehydration, can withstand drying, and then rehydrate when water is available [31]. Others form a symbiotic relationship with fungi to promote nutrient absorption [32]. They thrive in habitats such as forests, riverbanks, and moist meadows [33]. Furthermore, their adaptability enables them to settle in a range of habitats from tropical rain forests to Arctic tundra [34,35].
Tibet is located in the western part of China, with an average elevation exceeding 4000 m. Its intricate geological and climatic history has shaped a diverse range of habitats, barriers, and crossroads, with the southern regions being relatively humid and the northern and western parts relatively dry [36]. Such a unique combination of climatic and topographic features makes Tibet a significant reservoir of liverwort flora [16]. Studying liverwort plants in this extreme environment offers insights into the resilience and diversity of plants in challenging habitats. Given their role as ecological indicators, liverworts in Tibet can highlight subtle biome shifts and broader climatic changes, enhancing our comprehension of biodiversity dynamics in alpine settings. Specifically, we chose Sygera Mountain in Tibet, which lies at the transition point between semi-arid and humid zones for our investigation into the elevational distribution of bryophytes. Thus, this study aims to address the following questions: (1) How does the diversity of liverwort change along the significant elevational gradient in Tibet? (2) What are the main factors that drive or limit liverwort diversity? (3) Which environmental variables play a crucial role in shaping the liverwort community patterns?

2. Materials and Methods

2.1. Study Area

Sygera Mountain is situated in the southern region of the Qinghai-Tibet plateau and is characterized by its rugged and varied topography, spanning from 29°30′ to 29°50′ N, latitude, to 94°30′ to 94°54′ E, longitude. The elevation here varies greatly, from steep cliffs to gentle aspects and from deep valleys to towering ridges, and forms a series of habitats. The complex topography has created a large number of microhabitats, each of which has its own unique niche. The vegetation of Sygera Mountain reflects the transitional nature of the southern Qinghai-Tibet plateau. At low elevations, forests are mainly composed of deciduous species; with the increase in elevation, forests gradually transition to coniferous ones. In alpine areas, there are meadows and bushes. There are two aspects of Sygera Mountain. The southern aspect is warmer with more direct sunlight, whereas the northern aspect is cooler and wetter with less direct sunlight [37]. The northern aspect is more shaded, receives less direct sunlight, and is cooler and wetter. The climate of Sygera Mountain is affected by its elevation gradient and the position of the southeastern edge of the Qinghai-Tibet plateau. Generally speaking, it belongs to subalpine and alpine climates. Summer is relatively mild, with more precipitation. The winter is cold, and there is a large amount of snow in high elevation areas. The unique climatic conditions of the region, coupled with changes in topography, form different temperature and humidity regions, each with its own special flora and fauna.

2.2. Sampling and Identification

In August 2017, systematic field investigations targeting liverworts were conducted on Sygera Mountain. Sampling efforts were strategically dispersed across eight distinct elevational zones, spanning elevations of approximately 3100 m to 4500 m at intervals of 200 m. Within each of these elevation brackets, multiple substrates were sampled to provide a holistic understanding of liverwort ecology in the region. Specifically, from each aspect, liverworts were sourced from three individual trees, three distinct rock formations, three decaying logs, and two soil sample plots.
For the tree quadrats, we conducted our sampling at various locations along the trunk, precisely at 0 m, 0.5 m, 1.0 m, and 1.5 m. At each of these locations, we collected samples from the four cardinal directions—east, south, west, and north—with each quadrat spanning an area of 0.1 m × 0.1 m. Regarding the decaying log quadrats, we meticulously selected a total of 16 quadrats, maintaining the dimensions of each at 0.1 m × 0.1 m. For the soil and rock quadrats, we standardized the size of each quadrat to 0.5 m × 0.5 m, ensuring consistency across all samples. Additionally, each sample quadrat box consisted of one hundred grids; we counted these grids to calculate the species coverage. At the same time, pieces of information such as longitude, latitude, and elevation were recorded. This rigorous sampling strategy ensured an encompassing representation of liverwort diversity across these elevational gradients. A total of 38 plots were set up. All procured specimens have been archived at the Herbarium of China Agricultural University (BAU) for future study.

2.3. Environmental Variables

Environmental parameters serve as a fundamental framework to understand the intricate interactions and feedback mechanisms within ecosystems. Therefore, we sourced high-resolution datasets from globally recognized repositories. Specifically, we extracted metrics for solar radiation, water vapor pressure, wind, temperature, mean diurnal range, temperature, isothermality, and the precipitation of the wettest month from the WorldClim database, which shows a resolution of approximately 1 km [38]. Additionally, the aridity index and potential evapotranspiration were procured from the CGIAR-CSI repository through Figshare and presented at an analogous spatial granularity of 30 s (circa 1 km) [39].
Concurrently, we used R language (R 4.2.3 version) to extract and synthesize the environmental parameters for each plot. To reduce the impact of multicollinearity, we retained only one variable from a pair of environmental variables with an absolute correlation coefficient greater than 0.7 (|r| > 0.7) (Figure 1) (Origin 2022 version). Finally, we selected solar radiation, mean diurnal range in temperature, isothermality, and the precipitation of the wettest month for subsequent analysis.

2.4. Data Analyses

In order to delineate the role of environmental determinants on liverwort diversity, the generalized mixed effect model was used [40]. Specifically, elevation, aspect, solar radiation, mean diurnal range in temperature, isothermality, the precipitation of the wettest month, and matrix were incorporated as fixed effects. Crucially, to account for inherent variability and site-specific deviations, location was integrated as a random effect in the model [41,42,43,44,45].
In our effort to understand the differences in liverwort community composition at various elevations, we used non-metric multidimensional scaling (NMDS). Subsequent to this, a Hellinger transformation was applied to the species-location matrix, which enhanced the analytical robustness. By calculating a 95% confidence ellipse around the centroid, we were able to define a representation for a “typical” elevation sample [46]. Moreover, to test distinctions across elevation, orientation, and liverwort species communities, an analysis of similarity (ANOSIM) was conducted using 999 permutations based on Bray–Curtis distances [47].
To thoroughly examine the relationship between liverwort community patterns and environmental factors, we conducted canonical correspondence analysis (CCA) [47]. The community data analysis utilizes a species-plot coverage matrix. The environmental variables selected for this study include elevation, solar radiation, mean diurnal range in temperature, isothermality, and precipitation of wettest month. Pairwise distances for each environmental variable were meticulously computed. Leveraging partial Mantel tests with 9999 permutations, we delineated the intricate associations between liverwort community composition and the environmental parameters under investigation.

3. Results

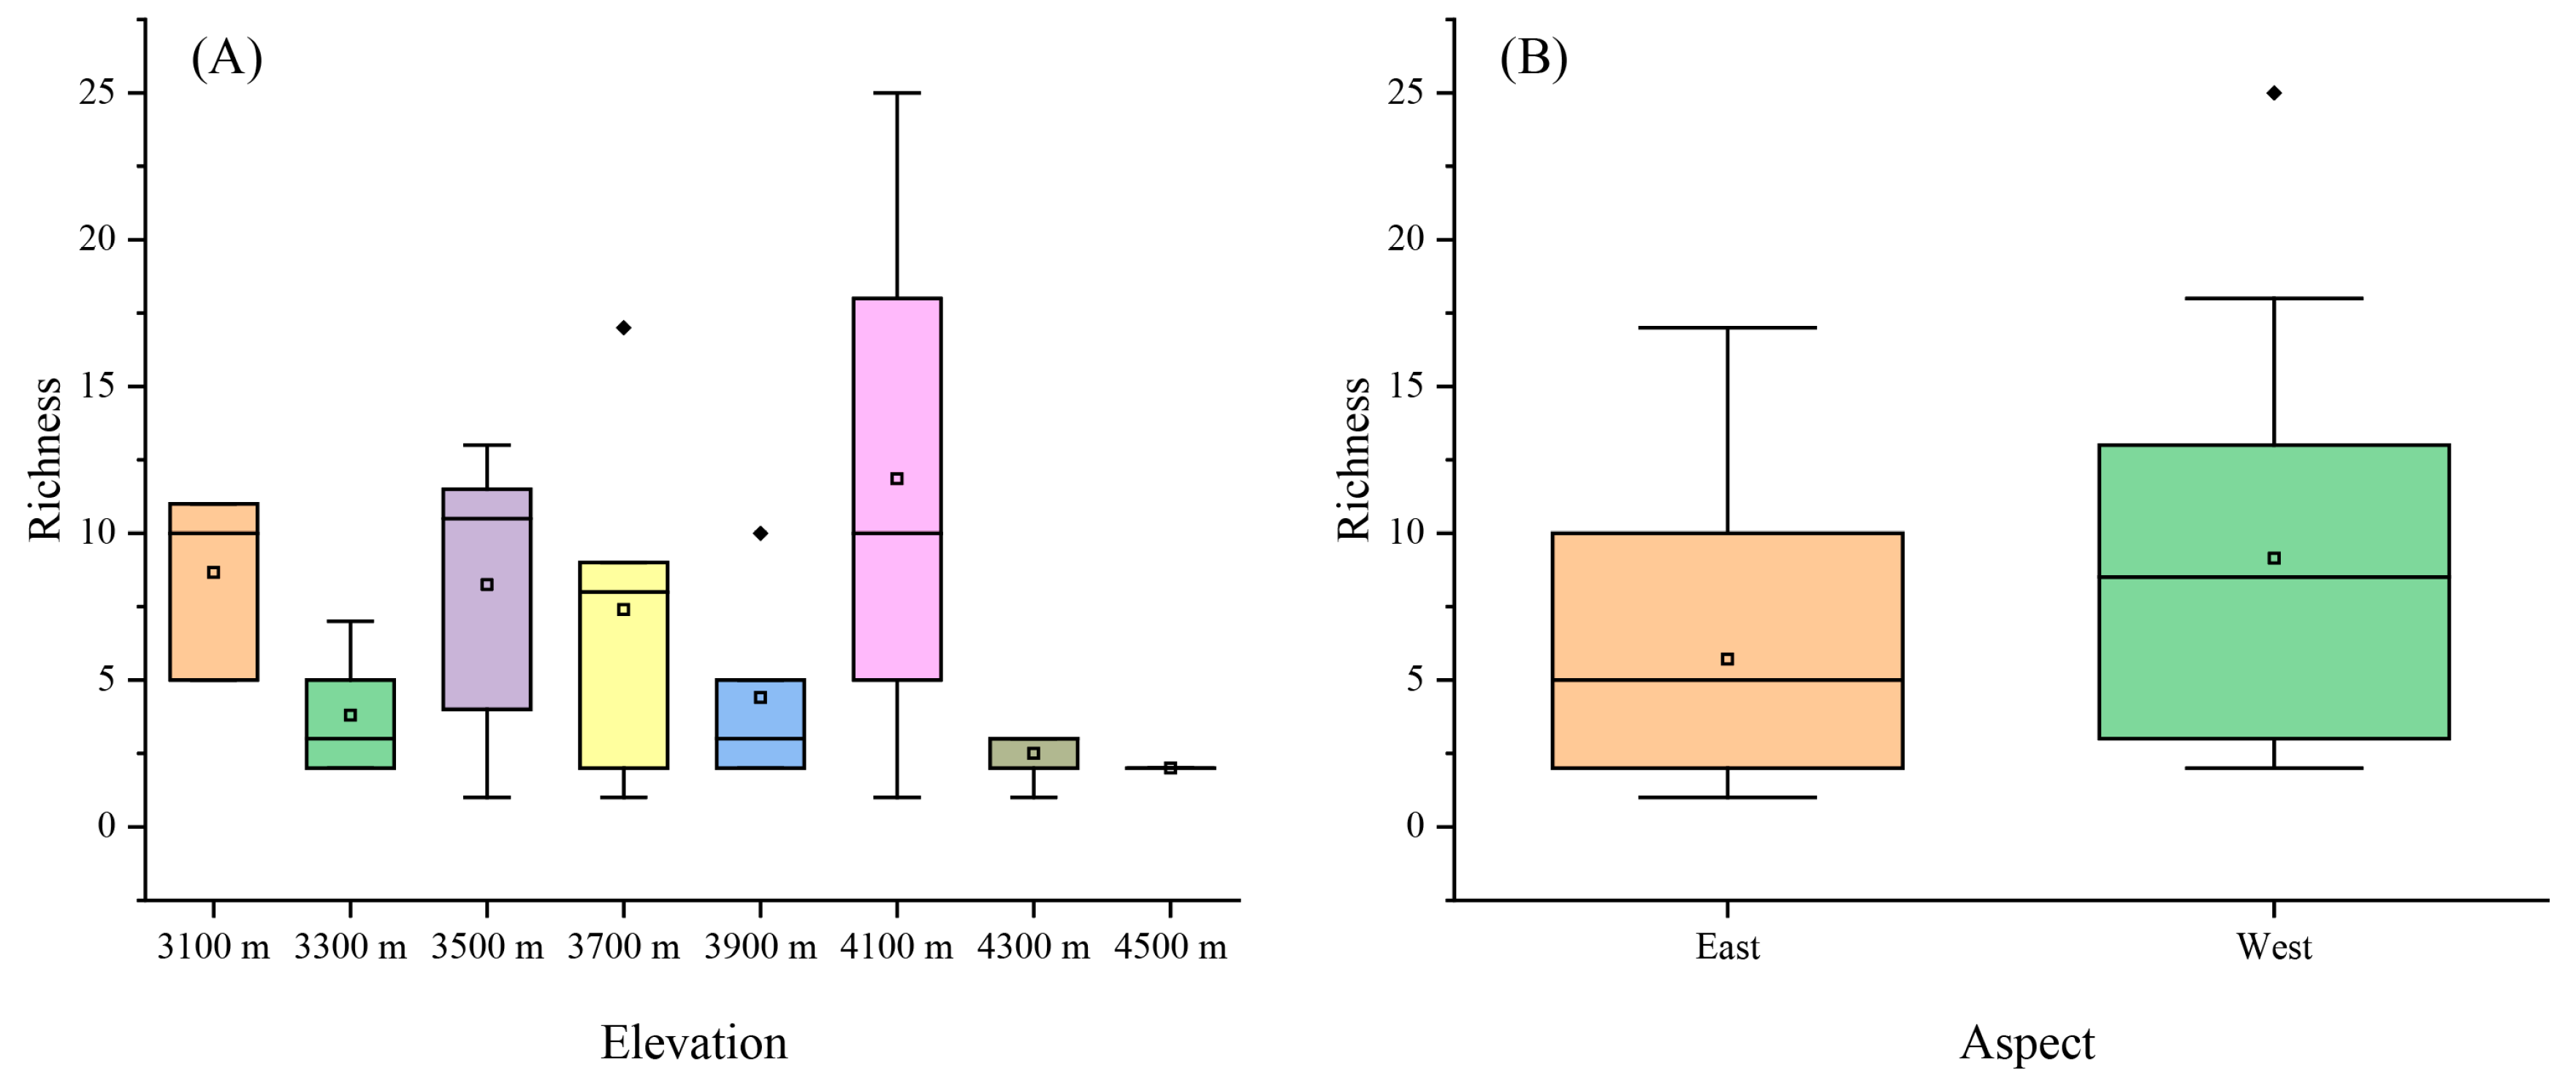
3.1. Variation in Liverwort Diversity with Elevation and Aspect

There are a total of 103 species of liverworts in our sample area from 42 genera in 8 families (Supplementary Materials, File S1). The richness of liverworts exhibited a bimodal distribution with elevation, varying significantly across different elevations (Figure 2A). At lower elevations (3100 m), species richness was moderately high. As elevation increased to 3500 m, an increase in species richness was observed, reaching the first peak. At 4100 m of elevation, there was a notable increase in richness, reaching a peak that signifies the highest species richness amongst the studied elevations. The richness declined steeply from elevations of 4100 m to 4300 m and then maintained a low richness.
When we compared the mountains’ aspects, liverwort richness exhibited a difference between the east and west aspects (Figure 2B). The eastern aspect demonstrated a lower median species richness compared with the western, which displayed higher variability in richness.
The mixed-effect model analysis identified several key environmental predictors of liverwort species richness. The most influential fixed effect was elevation, and that alone accounted for a substantial portion of model variance (individual effect size = 0.335), highlighting its dominant role in shaping liverwort distribution patterns (Figure 3). This was followed by matrix complexity, which had an individual effect size of 0.196, indicating its importance in liverwort habitat heterogeneity. Other environmental variables, which included mean diurnal temperature range, solar radiation, aspect, the precipitation of the wettest month, and isothermality, also contributed to explaining the richness of liverworts, albeit to a lesser extent. Their individual effect sizes ranged from 0.071 for the mean diurnal range to 0.020 for isothermality, demonstrating that these factors, while relevant, were less critical than elevation and matrix structure.
The fixed effects of the model (R2m) accounted for 0.749 of the variance in liverwort richness, which suggested that most of the variability can be explained through the environmental variables included in the model. The combined determination coefficient (R2c), which encompasses both fixed and random effects, was slightly higher at 0.788. It indicated that site factors also play a small role in shaping the richness patterns observed.

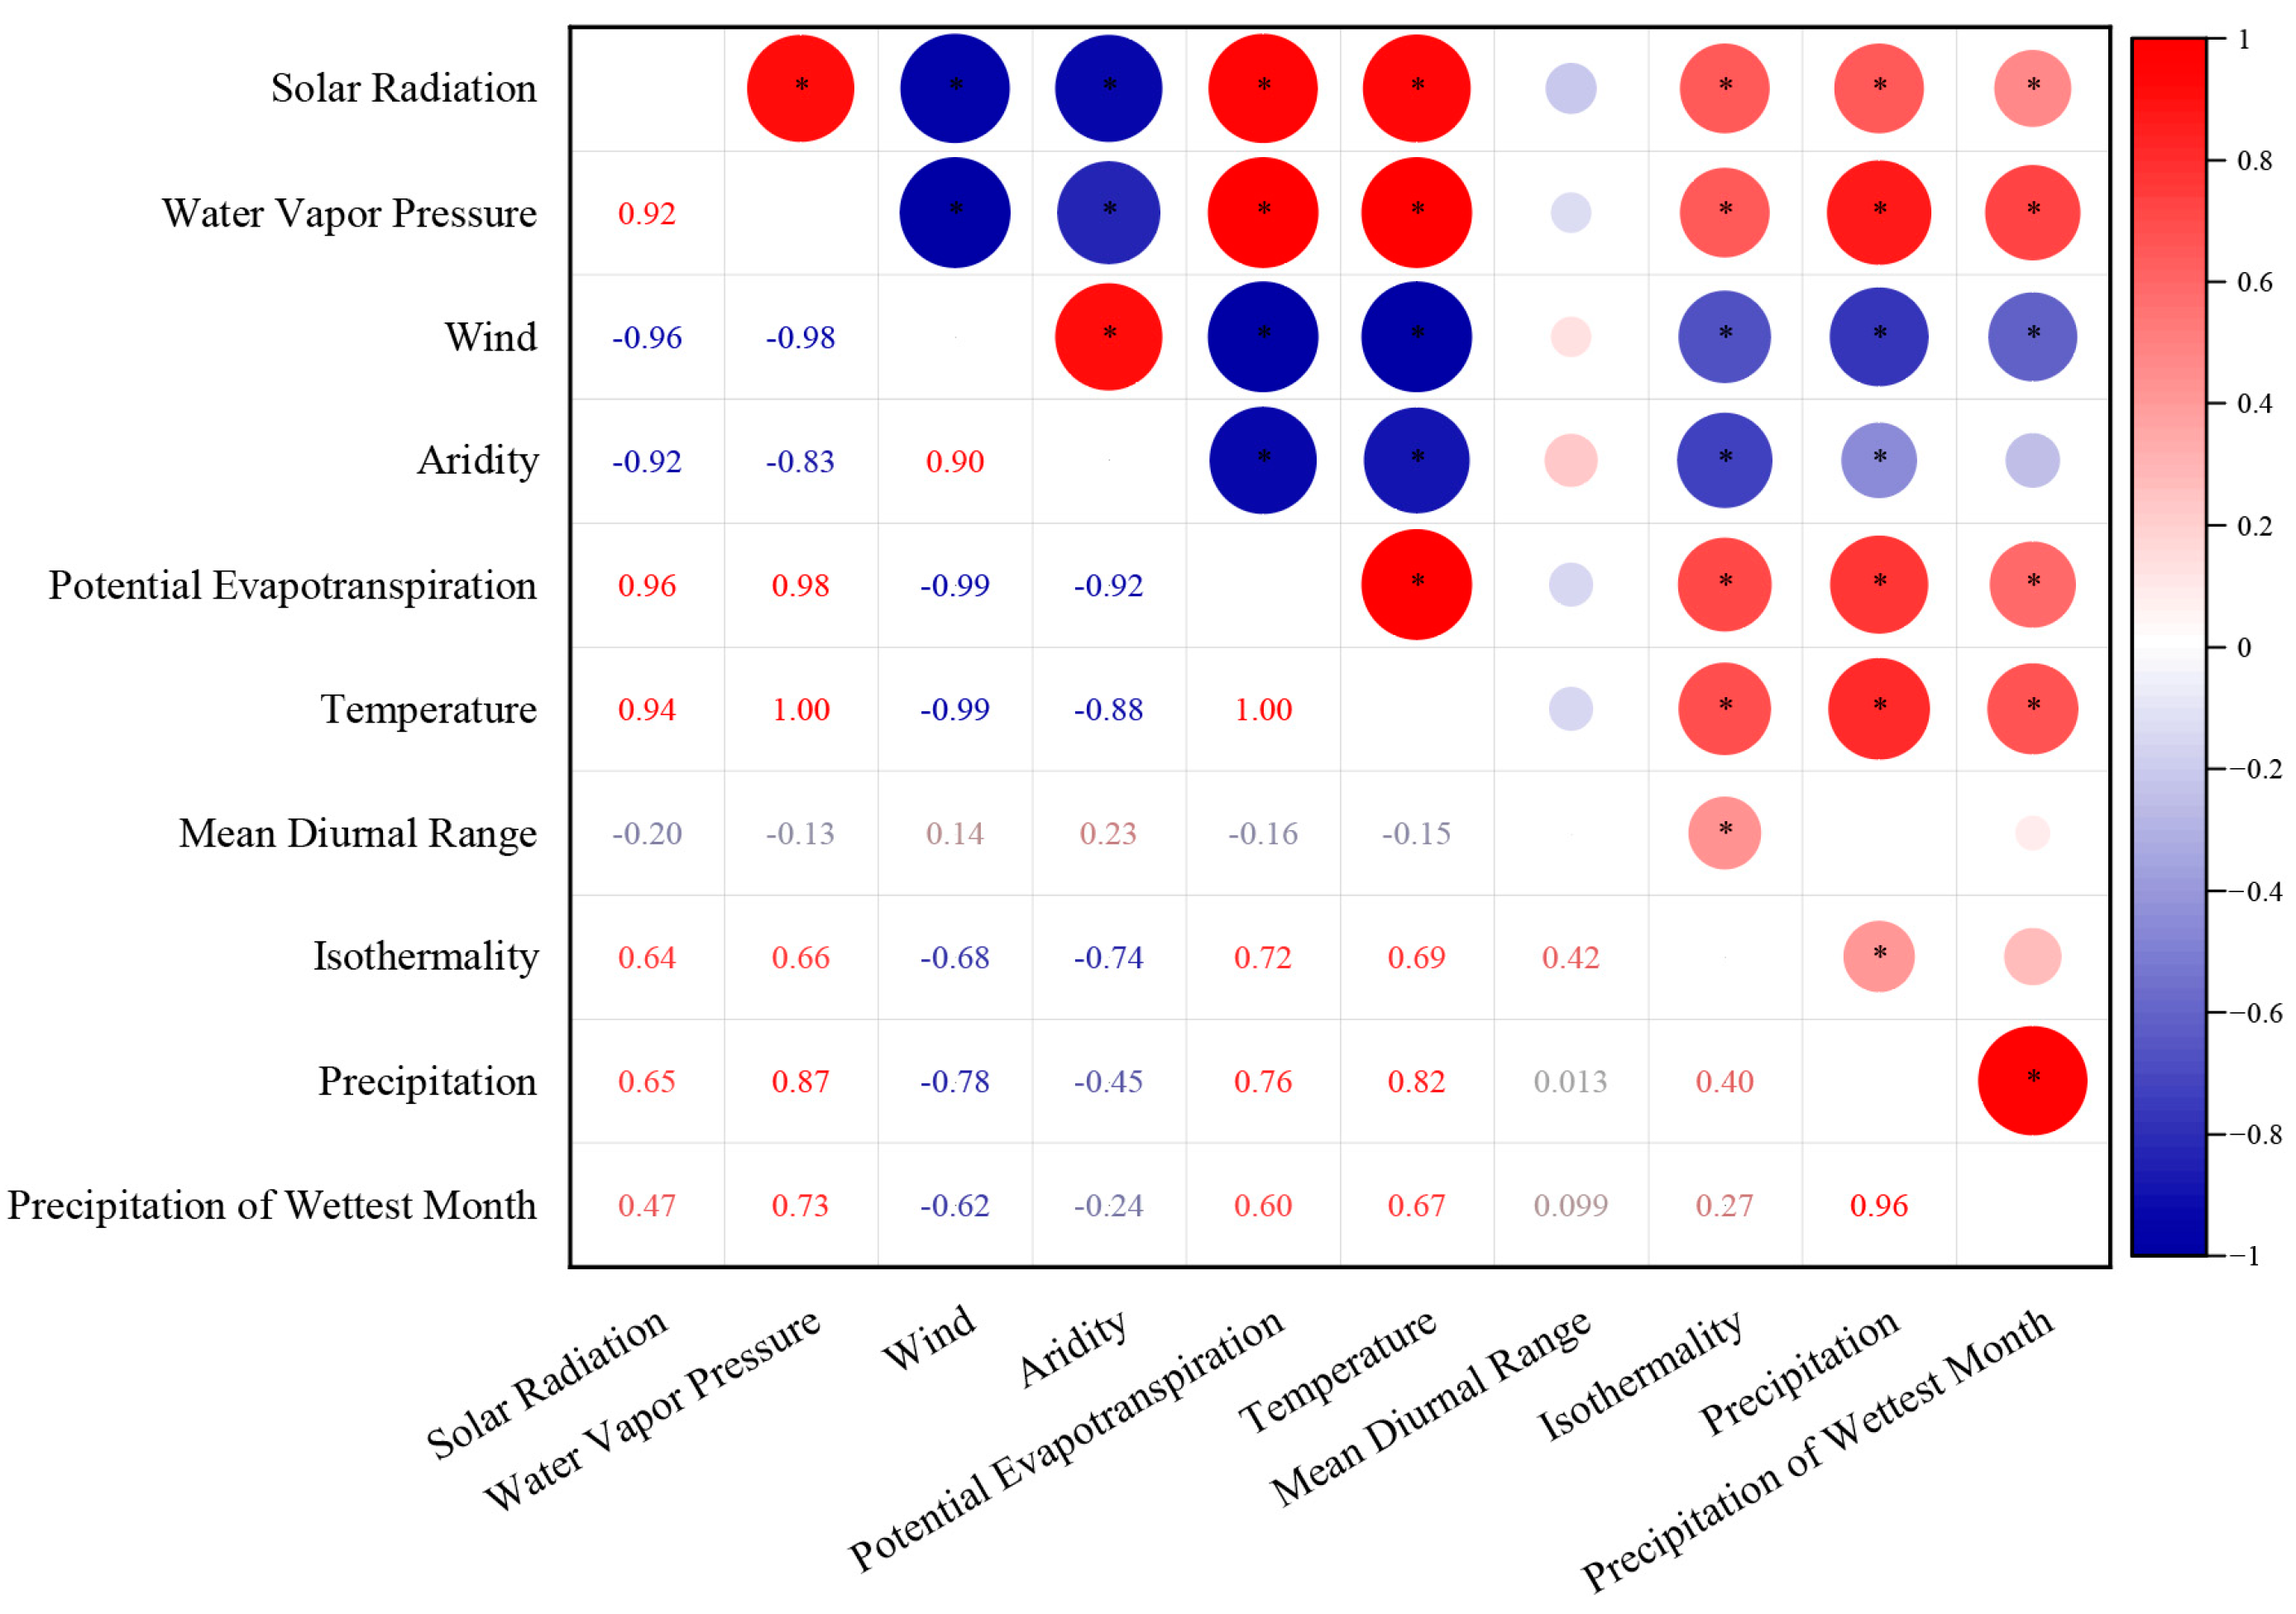
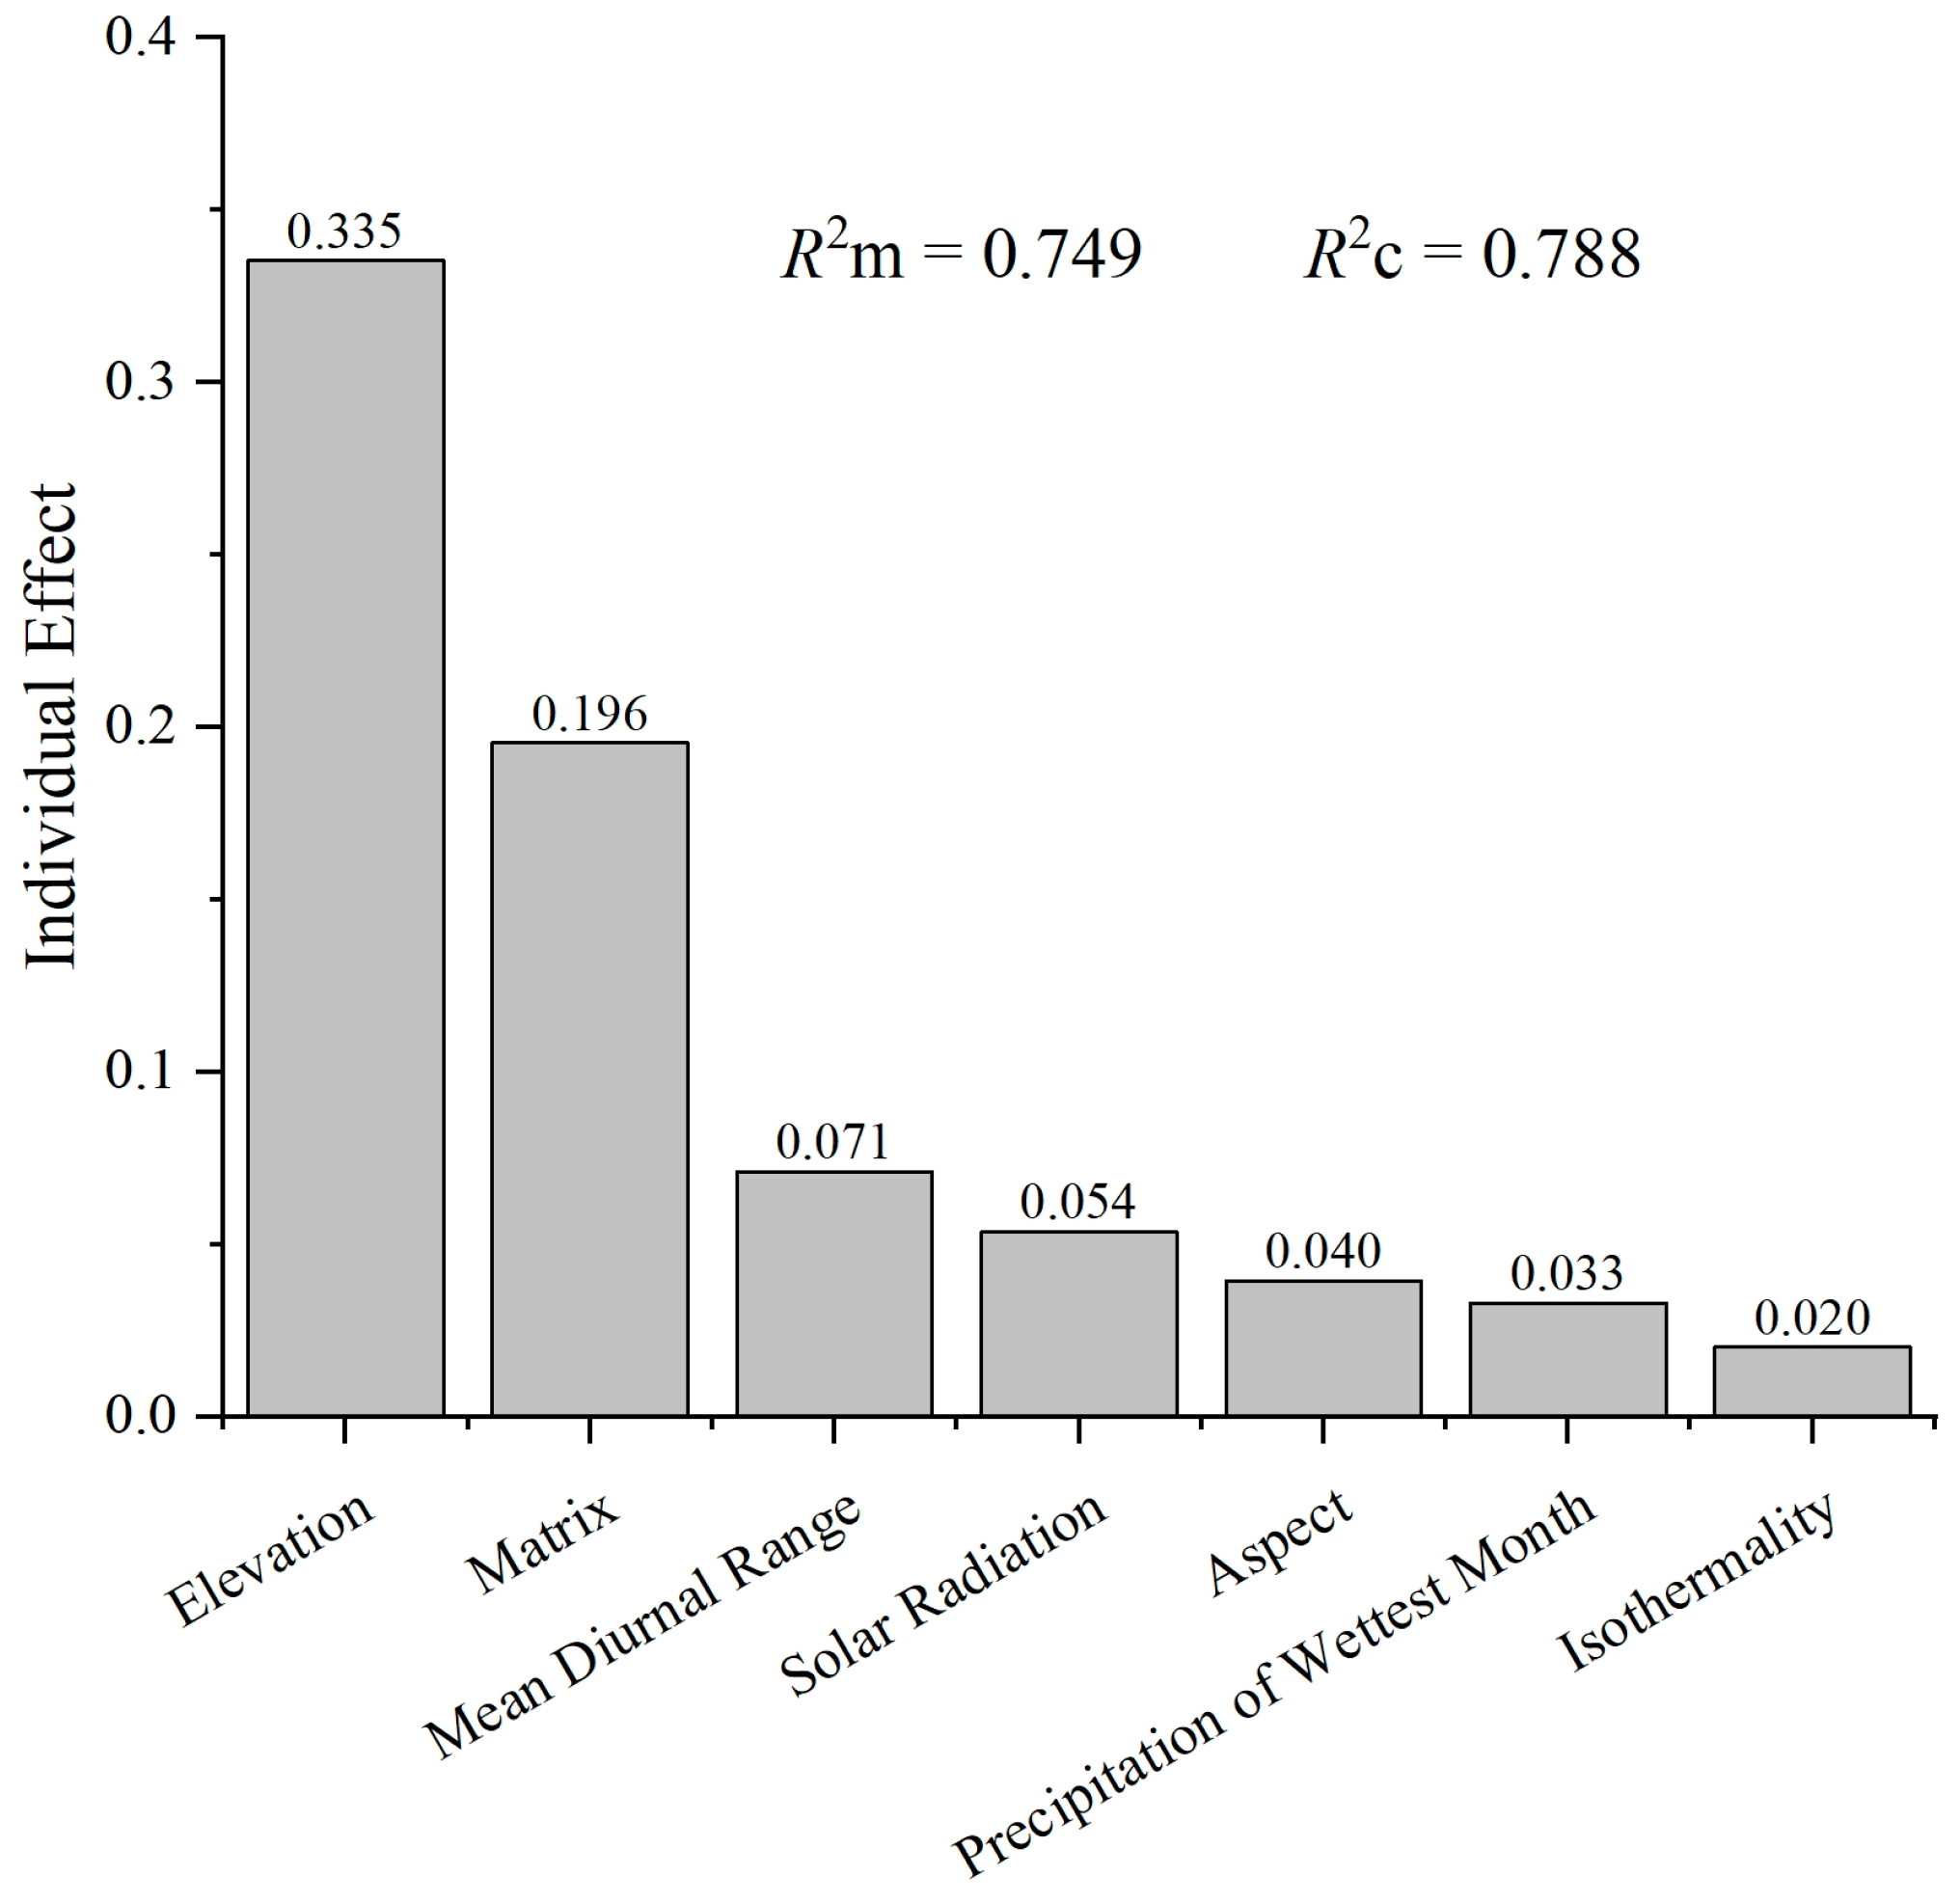
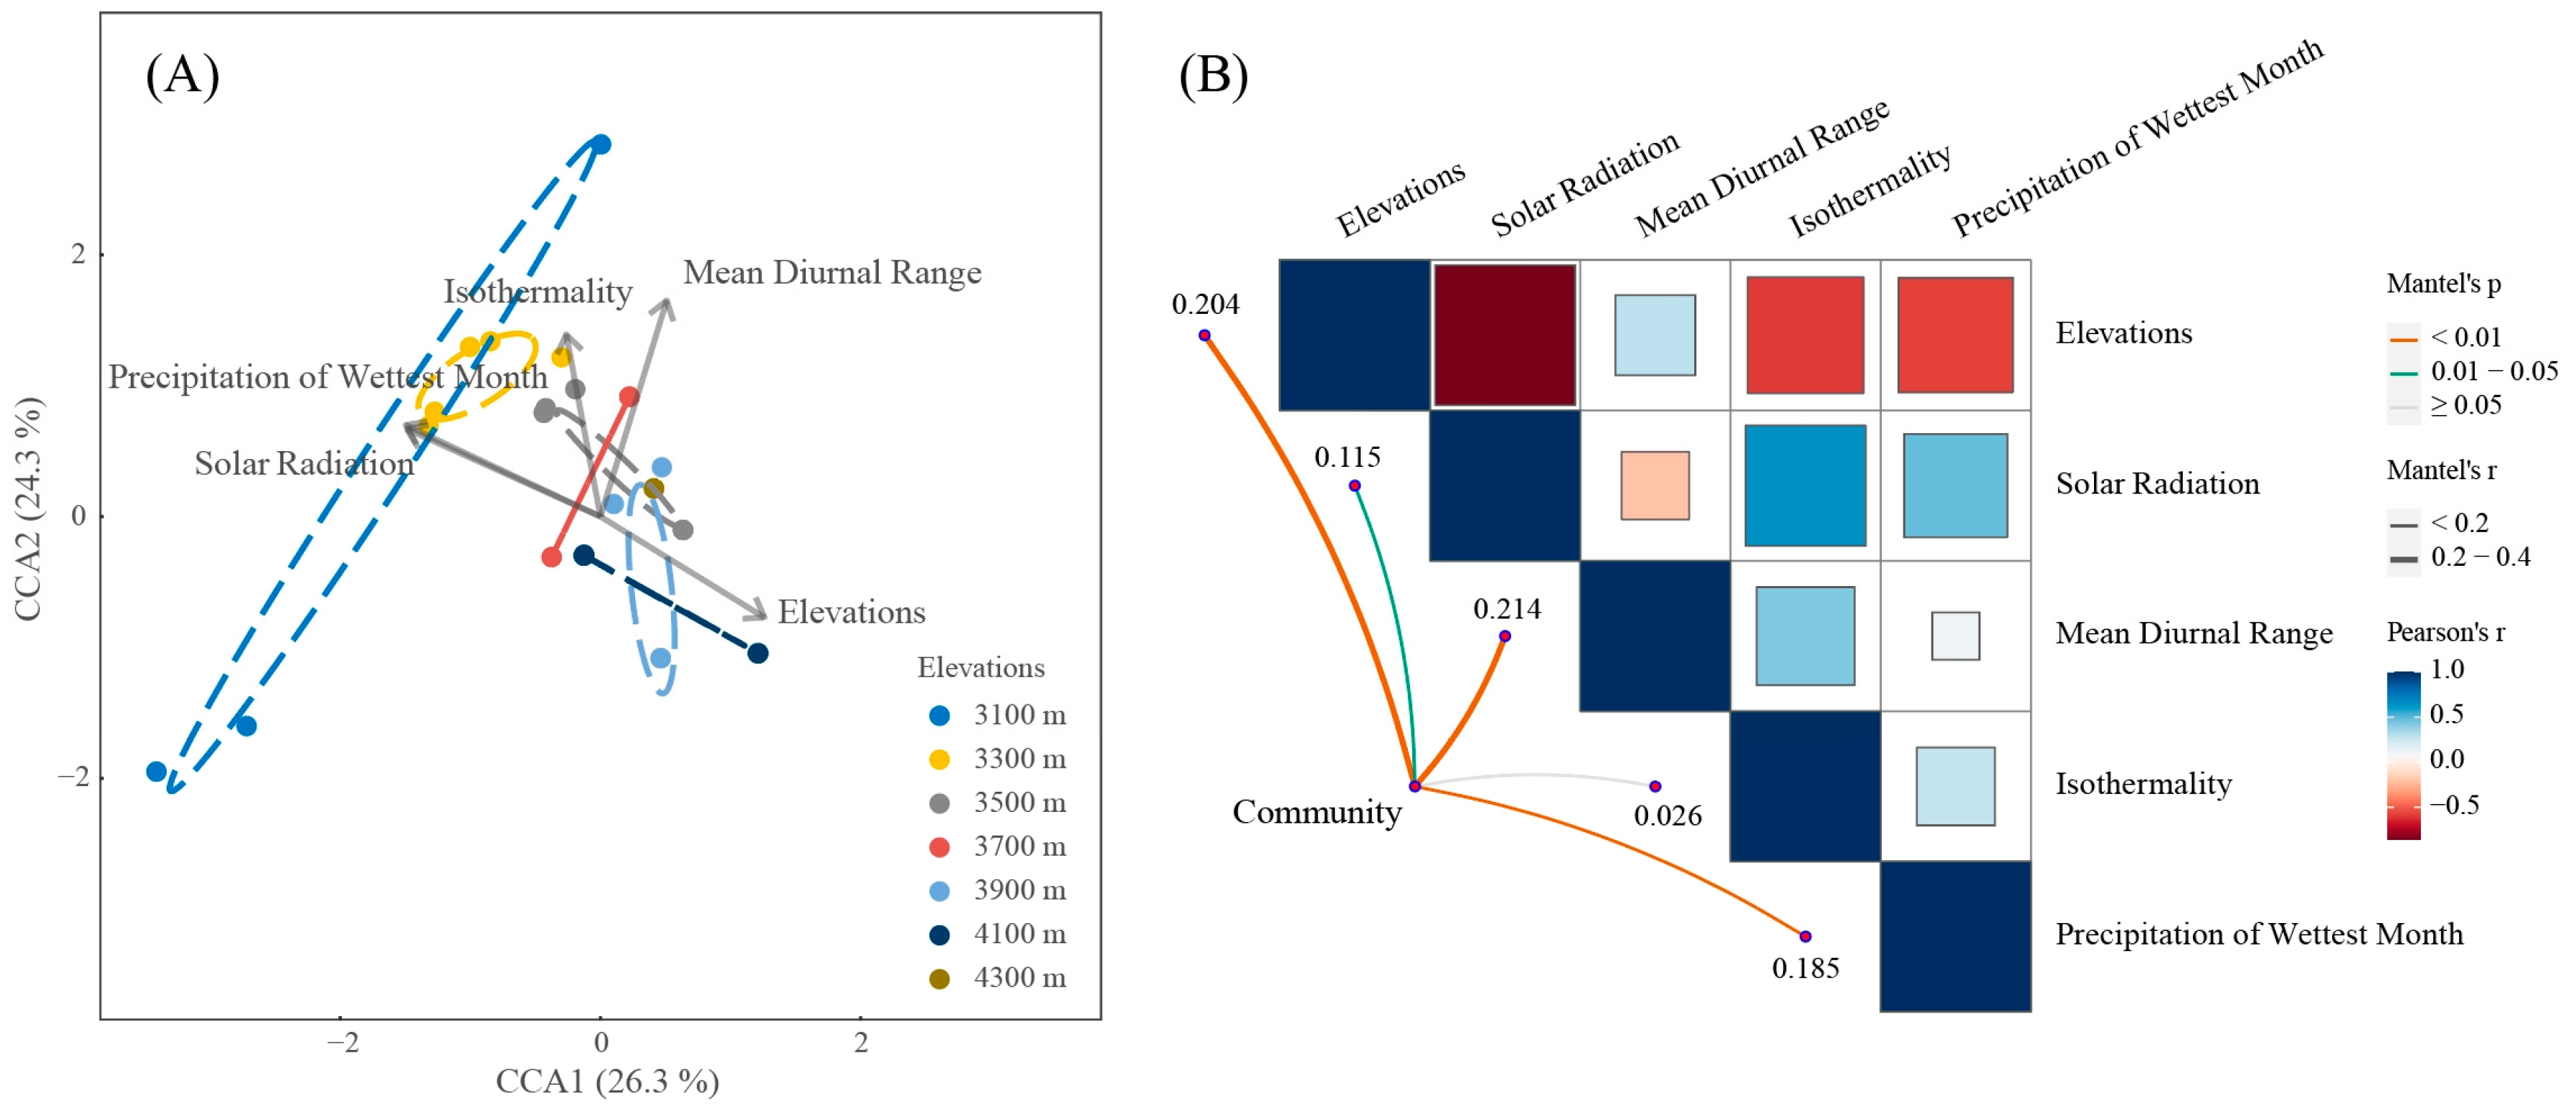
3.2. Relationship between Liverwort Communities and Environmental Factors

Non-metric multidimensional scaling (NMDS) analyses revealed distinct structuring of liverwort communities across different elevational bands (Figure 4A). The stress value of 0.109 indicates a reliable two-dimensional representation of the community dissimilarities. There was a separation between communities at different elevations. The ANOSIM analysis, using the Bray–Curtis similarity metric, substantiated the observed elevational variation in liverwort community composition. It revealed a significant R value of 0.135 (p = 0.019) that denoted compositional differences across elevations despite some overlap (Figure 4B). Notably, the shift in community composition was most pronounced when transitioning from 3100 m to 3300 m. The spread and range of the data increased with elevation, which suggested a higher community variability at higher elevations.
Canonical Correspondence Analysis (CCA) elucidated that the first two axes account for 50.6% of the total variance in the intricate relationships between liverwort communities and environmental gradients across varying elevations (Figure 5A). Communities situated at the highest surveyed elevations (4300 m) exhibited a strong affiliation with regions of the elevated mean diurnal range. In stark contrast, those residing at lower elevations (3100 m and 3300 m) were predominantly associated with locales characterized by enhanced solar radiation and increased precipitation of the wettest month. This distribution pattern suggests a discernible partitioning of liverwort niches along the environmental axes of solar radiation and moisture availability.
Notably, the variance in mean diurnal range emerged as the most influential environmental determinant, which suggested that daily temperature fluctuations may play a pivotal role in shaping the structure of these communities. The CCA plots further substantiate these findings, revealing a conspicuous stratification of community structure along the gradient of the mean diurnal temperature range. This stratification elucidates the nuanced interplay between biotic assemblages and the abiotic factors that define their niches, reinforcing the preeminence of temperature variability as a cardinal driver of ecological zonation within high-elevation liverwort communities. Meanwhile, the elevation, the precipitation of the wettest month, and solar radiation also had significant effects on liverwort communities. In contrast, factors such as isothermality, despite their recognized ecological significance, did not register as significant influences within the context of our liverwort datasets (Figure 5B).

4. Discussion

4.1. The Influence of Elevation on Liverwort Diversity and Community Composition

Liverwort richness thrives on Sygera Mountain, and our study underscores the nuanced relationship between elevation and biodiversity. The bimodal pattern of liverwort richness observed across the sampled elevations unravels the intricate ecological nuances of this mountainous region. Specifically, two prominent peaks in liverwort richness at elevations of 3500 m and 4100 m indicate two distinct zones favoring liverwort diversity.
The peak at 3500 m may coincide with a vegetative transition zone characterized by an amalgamation of coniferous and broad-leaved forests with mild climatic conditions. This creates a unique interplay between low and high elevation conditions and promotes a range of microhabitats, thereby enriching liverwort diversity. Furthermore, the presence of a richness peak at mid-elevations can be attributed to several biologically plausible processes that result in hump-shaped elevational patterns. This pattern is primarily driven by the accumulation of species at mid-elevations that migrate from both lower and higher elevations. This phenomenon, as explained through previous research [39,40], can be attributed to the overlap zone created by either non-self-sustaining sink populations or a more permanent overlap of different floras [48,49]. Considering the significant ecological variations that occur within short geographical distances in mountainous regions, liverwort community composition undergoes substantial changes along the elevation gradient [50,51]. Therefore, the observed peak in liverwort richness at mid-elevation is likely the result of an overlap in species ranges, whereby species from lower elevations mix with those from higher elevations on Sygera Mountain. This finding aligns with previous research on liverworts in Colombia [52].
The 4100 m peak appears to be a bastion of high ecological diversity for liverworts on Sygera Mountain [16]. Our winter field surveys revealed a significant presence of snow that, despite not being perennial, tends to melt later in the season. This delayed melting of snow provides a consistent moisture source for the liverworts, and the insulating properties of the snow could offer some thermal protection [53,54]. However, richness starts to decline above 4100 m, plunging at 4300 m. This suggests the constraining factors of high elevation are as follows: diminished atmospheric pressure, colder temperatures, limited liquid water due to freezing conditions, and potentially hostile soil conditions that can restrict the diversity of liverworts.
Although the area gradually decreases from low to high elevation, which affects the richness of liverworts, transitional zones exist at mid-elevations. In these zones, forests, including community transition areas at moderate elevations, play a significant role in liverwort richness, which lead to a bimodal state [55,56,57]. In our study of liverwort richness on Sygera Mountain, the bimodal distribution pattern strikingly mirrors similar findings in diverse mountainous regions such as La Réunion [58], suggesting that mid-elevation zones often act as crucial ecological refuges. Integrating these dimensions into our ecological analysis promises to deepen our understanding of liverwort distribution patterns, contributing meaningfully to biogeographical and ecological conservation studies. This holistic approach, especially pertinent in island ecosystems, is instrumental in dissecting the intricate ways in which varied environmental factors orchestrate species diversity across different elevational gradients [59], thereby offering invaluable insights for effective biodiversity conservation and ecosystem management strategies in complex mountain ecosystems.

4.2. The Impact of Climatic Factors on the Community Structure of Liverworts

Climate will also have an important impact on the community structure of liverworts. Our study finds that the most significant determinants for liverwort communities are the mean diurnal range, elevation, the precipitation of the wettest month, and solar radiation. Mountainous regions often have complex topographies, which can create a multitude of microclimates within a relatively small area [60].
The diversity and community of liverworts on Sygera Mountain are also intricately linked to the richness and variability of the climate created by these elevation gradients. Some places in Sygera Mountain show obvious daily temperature fluctuations. Such diurnal variability, potentially more impactful on liverwort ecology than previously estimated and influencing processes like evaporation and condensation on liverwort surfaces, is modulated by the region’s vegetation [61,62]. Dense canopies act as buffers, mitigating extreme temperatures and providing a protective umbrella for the liverwort beneath [63]. Conversely, in areas with sparser vegetation at high elevations, liverworts face the full brunt of these temperature fluctuations, possibly amplifying their adaptive strategies to navigate these daily thermal challenges. This suggests that temperature fluctuations are a major ecological filter influencing which liverwort species can survive and thrive at these elevations. The stratification of community structure along the mean diurnal temperature range gradient discerned from our CCA plots (Figure 5B) lends further weight to the argument that daily thermal variation is a critical determinant of species distribution within montane ecosystems.
Furthermore, an essential aspect of this ecological complexity is the gradient of light conditions, particularly solar radiation, which significantly impacts liverwort communities. Solar radiation influences various physiological processes in liverworts, including photosynthesis, desiccation, and temperature regulation [64]. In areas with intense solar radiation, liverworts may experience increased stress, which leads to adaptations like higher desiccation tolerance or the development of protective pigments [65]. The stratification of liverwort community structure along the solar radiation gradient is evident (Figure 5A), which indicates that light conditions play a pivotal role in determining species distribution in these mountainous ecosystems (Figure 5B).
Mountains, due to their imposing topography, play a pivotal role in influencing local precipitation patterns. Influenced by the Indian Ocean monsoon, the windward side (southern aspect) of the mountain range typically receives more precipitation than the leeward side (northern aspect), which results in the rain shadow effect [66]. This leads to variations in annual average precipitation within the same range. However, in such terrains, the rainfall can be intermittent and often unpredictable, which leads to sporadic hydration episodes for liverworts. The increased moisture not only facilitates the hydration necessary for liverwort metabolic activity but also influences the microhabitat structure and resource availability, setting a foundation for the seasonal dynamics of these communities [33,67]. This pattern illustrates the importance of climatic variability and water-centric conservation to liverwort survival and community richness.

5. Conclusions

Our research on Sygera Mountain has detailed the complex interactions between environmental factors and the diversity and community composition of liverworts. The main findings of this study highlight the unique bimodal pattern of liverwort richness along the elevational gradient, with two significant peaks at 3500 m and 4100 m, respectively. We identified the critical role of climatic factors, especially the mean diurnal range, in shaping bryophyte community composition. The diversity and distribution of liverworts on Sygera Mountain is evidence of the complex and layered interactions between organisms and their environment.

Supplementary Materials

The following supporting information can be downloaded at: https://www.mdpi.com/article/10.3390/f15010048/s1, File S1. Liverwort Species List and Richness on Sygera Mountain.

Author Contributions

Conceptualization, X.S. (Xiaoming Shao) and X.S. (Xiaotong Song); methodology, X.S. (Xiaotong Song), J.G. and X.S. (Xiaoming Shao); software, J.G., Y.Y. and Y.L.; validation, H.M., W.L. and X.S. (Xiaoming Shao); formal analysis, X.S. (Xiaotong Song), J.G. and X.S. (Xiaoming Shao); investigation, X.S. (Xiaoming Shao), X.S. (Xiaotong Song), Y.Y., W.L., R.W. and H.M.; resources, X.S. (Xiaoming Shao); data curation, X.S. (Xiaotong Song), J.G. and X.S. (Xiaoming Shao); writing—original draft preparation, X.S. (Xiaotong Song), J.G. and X.S. (Xiaoming Shao); writing—review and editing, X.S. (Xiaotong Song), J.G. and X.S. (Xiaoming Shao); visualization, X.S. (Xiaotong Song), J.G., Y.Y. and X.S. (Xiaoming Shao); supervision, R.W.; project administration, X.S. (Xiaoming Shao); funding acquisition, X.S. (Xiaoming Shao). All authors have read and agreed to the published version of the manuscript.

Funding

This work was funded by the Natural Science Foundation of China (Grant No. 41771054, 31570474), Xizang Science and Technology Major Project of Xizang Autonomous Region, China, (Grant No. XZ202101ZD0003N); and the Chinese Universities Scientific Fund (Grant No. 2022TC126).

Data Availability Statement

The data that support the findings of this study are openly available in Supplementary Materials.

Acknowledgments

Sincerest thanks are given to Youfang Wang (School of Life Science, East China Normal University), Min Li (College of Life Sciences, Hebei Normal University), Xiaorui Wang (College of Resources and Environmental, Shijiazhuang University), Yingjie Fan, Xinyuan Jiang, Mengzhen Wang, Ling Liu from College of Resources and Environmental Sciences, China Agricultural University, for their contributions to the collection of bryophytes specimens in Tibet. We express our deepest gratitude to Xiaohong Shao (School of Foreign Studies, Nanchang University) for the meticulous and thoughtful revisions made to the English portion of our paper. We are immensely thankful for the time and effort you have dedicated to improving our manuscript.

Conflicts of Interest

The authors declare no conflicts of interest.

References

  1. Humboldt, A.V.; Bonpland, A. Essai sur la Géographie des Plantes Accompagné d’un Tableau Physique des Régions Équinoxiales; Levrault, Schoell et Cie: Paris, France, 1805. [Google Scholar]
  2. Borcard, D.; Gillet, F.; Legendre, P. Numerical Ecology with R; Springer: New York, NY, USA, 2011; Volume 2. [Google Scholar]
  3. Ovaskainen, O.; Abrego, N. Joint Species Distribution Modelling: With Applications in R; Cambridge University Press: Cambridge, UK, 2020. [Google Scholar]
  4. Gaston, K.J. Global patterns in biodiversity. Nature 2000, 405, 220–227. [Google Scholar] [CrossRef] [PubMed]
  5. McCain, C.M.; Grytnes, J. Elevational gradients in species richness. eLS 2010, 10, a0022548. [Google Scholar]
  6. Zhang, W.; Huang, D.; Wang, R.; Liu, J.; Du, N. Altitudinal patterns of species diversity and phylogenetic diversity across temperate mountain forests of northern China. PLoS ONE 2016, 11, e159995. [Google Scholar] [CrossRef] [PubMed]
  7. Gotelli, N.J.; Anderson, M.J.; Arita, H.T.; Chao, A.; Colwell, R.K.; Connolly, S.R.; Currie, D.J.; Dunn, R.R.; Graves, G.R.; Green, J.L. Patterns and causes of species richness: A general simulation model for macroecology. Ecol. Lett. 2009, 12, 873–886. [Google Scholar] [CrossRef] [PubMed]
  8. Kluge, J.; Worm, S.; Lange, S.; Long, D.; Böhner, J.; Yangzom, R.; Miehe, G. Elevational seed plants richness patterns in Bhutan, Eastern Himalaya. J. Biogeogr. 2017, 44, 1711–1722. [Google Scholar] [CrossRef]
  9. Liu, L.; Xu, Y.; Tang, Y.; Du, W.; Shao, C.; Wu, J.; Zhao, L.; Zhang, L.; Liu, J.; Xu, X. The importance of including soil properties when disentangling the drivers of species richness: The case of the alpine genus Saxifraga L. in China. Front. Ecol. Evol. 2020, 8, 244. [Google Scholar] [CrossRef]
  10. Descombes, P.; Leprieur, F.; Albouy, C.; Heine, C.; Pellissier, L. Spatial imprints of plate tectonics on extant richness of terrestrial vertebrates. J. Biogeogr. 2017, 44, 1185–1197. [Google Scholar] [CrossRef]
  11. Körner, C. Significance of temperature in plant life. In Plant Growth and Climate Change; Morison, J.I.L., Morecroft, M.D., Eds.; Blackwell Publishing Ltd.: Hoboken, NJ, USA, 2006; pp. 48–69. [Google Scholar]
  12. Moles, A.T.; Warton, D.I.; Warman, L.; Swenson, N.G.; Laffan, S.W.; Zanne, A.E.; Pitman, A.; Hemmings, F.A.; Leishman, M.R. Global patterns in plant height. J. Ecol. 2009, 97, 923–932. [Google Scholar] [CrossRef]
  13. Kewlani, P.; Negi, V.S.; Bhatt, I.D.; Rawal, R.S.; Nandi, S.K. Soil nutrients concentration along altitudinal gradients in Indian Western Himalaya. Scand. J. For. Res. 2021, 36, 98–104. [Google Scholar] [CrossRef]
  14. Antonelli, A.; Kissling, W.D.; Flantua, S.G.; Bermúdez, M.A.; Mulch, A.; Muellner-Riehl, A.N.; Kreft, H.; Linder, H.P.; Badgley, C.; Fjeldså, J. Geological and climatic influences on mountain biodiversity. Nat. Geosci. 2018, 11, 718–725. [Google Scholar] [CrossRef]
  15. Perrigo, A.; Hoorn, C.; Antonelli, A. Why mountains matter for biodiversity. J. Biogeogr. 2020, 47, 315–325. [Google Scholar] [CrossRef]
  16. Gu, J.; Song, X.; Liao, Y.; Ye, Y.; Wang, R.; Ma, H.; Shao, X. Tree Species Drive the Diversity of Epiphytic Bryophytes in the Alpine Forest Ecosystem: A Case Study in Tibet. Forests 2022, 13, 2154. [Google Scholar] [CrossRef]
  17. Chen, Z.; Hsieh, C.; Jiang, F.; Hsieh, T.; Sun, I. Relations of soil properties to topography and vegetation in a subtropical rain forest in southern Taiwan. Plant Ecol. 1997, 132, 229–241. [Google Scholar] [CrossRef]
  18. Shaw, J. Biogeographic patterns and cryptic speciation in bryophytes. J. Biogeogr. 2001, 28, 253–261. [Google Scholar] [CrossRef]
  19. Ah-Peng, C.; Wilding, N.; Kluge, J.; Descamps-Julien, B.; Bardat, J.; Chuah-Petiot, M.; Strasberg, D.; Hedderson, T.A. Bryophyte diversity and range size distribution along two altitudinal gradients: Continent vs. island. Acta Oecol. 2012, 42, 58–65. [Google Scholar] [CrossRef]
  20. Grau, O.; Grytnes, J.A.; Birks, H. A comparison of altitudinal species richness patterns of bryophytes with other plant groups in Nepal, Central Himalaya. J. Biogeogr. 2007, 34, 1907–1915. [Google Scholar] [CrossRef]
  21. Costa, D.P.; Nadal, F.; Da Rocha, T.C. The first botanical explorations of bryophyte diversity in the Brazilian Amazon mountains: High species diversity, low endemism, and low similarity. Biodivers. Conserv. 2020, 29, 2663–2688. [Google Scholar] [CrossRef]
  22. Tuba, Z.; Slack, N.G.; Stark, L.R. Bryophyte Ecology and Climate Change; Cambridge University Press: Cambridge, UK, 2011. [Google Scholar]
  23. Virtanen, R. Diaspore and shoot size as drivers of local, regional and global bryophyte distributions. Glob. Ecol. Biogeogr. 2014, 23, 610–619. [Google Scholar] [CrossRef]
  24. Graham, L.; Lewis, L.A.; Taylor, W.; Wellman, C.; Cook, M. Early terrestrialization: Transition from algal to bryophyte grade. In Photosynthesis in Bryophytes and Early Land Plants; Hanson, D.T., Rice, S.K., Eds.; Springer: Dordrecht, The Netherlands, 2014; pp. 9–28. [Google Scholar]
  25. Laenen, B.; Shaw, B.; Schneider, H.; Goffinet, B.; Paradis, E.; Désamoré, A.; Heinrichs, J.; Villarreal, J.C.; Gradstein, S.R.; McDaniel, S.F. Extant diversity of bryophytes emerged from successive post-Mesozoic diversification bursts. Nat. Commun. 2014, 5, 5134. [Google Scholar] [CrossRef]
  26. Ligrone, R.; Duckett, J.G.; Renzaglia, K.S. Conducting tissues and phyletic relationships of bryophytes. Philos. Trans. R. Soc. Lond. Ser. B Biol. Sci. 2000, 355, 795–813. [Google Scholar] [CrossRef]
  27. Mishler, B.D.; Churchill, S.P. Transition to a land flora: Phylogenetic relationships of the green algae and bryophytes. Cladistics 1985, 1, 305–328. [Google Scholar] [CrossRef] [PubMed]
  28. Huttunen, S.; Bell, N.; Hedenäs, L. The evolutionary diversity of mosses–taxonomic heterogeneity and its ecological drivers. Crit. Rev. Plant Sci. 2018, 37, 128–174. [Google Scholar] [CrossRef]
  29. Valarezo, E.; Meneses, M.A.; Jaramillo-Fierro, X.; Radice, M.; Benítez, Á. Volatile Compounds and Oils from Mosses and Liverworts. In Bioactive Compounds in Bryophytes and Pteridophytes; Springer: Cham, Switzerland, 2022; pp. 1–53. [Google Scholar]
  30. Ligrone, R.; Duckett, J.G.; Renzaglia, K.S. Major transitions in the evolution of early land plants: A bryological perspective. Ann. Bot.-Lond. 2012, 109, 851–871. [Google Scholar] [CrossRef] [PubMed]
  31. Marks, R.A.; Burton, J.F.; McLetchie, D.N. Sex differences and plasticity in dehydration tolerance: Insight from a tropical liverwort. Ann. Bot.-Lond. 2016, 118, 347–356. [Google Scholar] [CrossRef] [PubMed]
  32. Humphreys, C.P.; Franks, P.J.; Rees, M.; Bidartondo, M.I.; Leake, J.R.; Beerling, D.J. Mutualistic mycorrhiza-like symbiosis in the most ancient group of land plants. Nat. Commun. 2010, 1, 103. [Google Scholar] [CrossRef] [PubMed]
  33. Hallingbäck, T.; Hodgetts, N.G. Mosses, Liverworts, and Hornworts: Status Survey and Conservation Action Plan for Bryophytes; IUCN in Collaboration with the Swedish Threatened Species Unit: Gland, Switzerland, 2000. [Google Scholar]
  34. He, X.; He, K.S.; Hyvönen, J. Will bryophytes survive in a warming world? Perspect. Plant Ecol. Evol. Syst. 2016, 19, 49–60. [Google Scholar] [CrossRef]
  35. Dos Santos, N.D.; Da Costa, D.P. Altitudinal zonation of liverworts in the Atlantic Forest, Southeastern Brazil. Bryologist 2010, 113, 631–645. [Google Scholar] [CrossRef]
  36. Corlett, R. The Ecology of Tropical East Asia; Oxford University Press: New York, NY, USA, 2014. [Google Scholar]
  37. Shen, Z.; Lu, J.; Hua, M.; Tang, X.; Qu, X.; Xue, J.; Fang, J. Population structure and spatial pattern analysis of Quercus aquifolioides on Sejila Mountain, Tibet, China. J. For. Res. 2018, 29, 405–414. [Google Scholar] [CrossRef]
  38. Fick, S.E.; Hijmans, R.J. WorldClim 2: New 1-km spatial resolution climate surfaces for global land areas. Int. J. Climatol. 2017, 37, 4302–4315. [Google Scholar] [CrossRef]
  39. Trabucco, A.; Zomer, R.J. Global Aridity Index and Potential Evapo-Transpiration (ET0) Climate Database v2; CGIAR Consortium for Spatial Information (CGIAR-CSI): Washington, DC, USA, 2018. [Google Scholar]
  40. Schielzeth, H.; Nakagawa, S. Nested by design: Model fitting and interpretation in a mixed model era. Methods Ecol. Evol. 2013, 4, 14–24. [Google Scholar] [CrossRef]
  41. Bates, D.; Mächler, M.; Bolker, B.; Walker, S. Fitting linear mixed-effects models using lme4. arXiv 2014, arXiv:1406.5823. [Google Scholar]
  42. Dray, S.; Dufour, A. The ade4 package: Implementing the duality diagram for ecologists. J. Stat. Softw. 2007, 22, 1–20. [Google Scholar] [CrossRef]
  43. Kuznetsova, A.; Brockhoff, P.B.; Christensen, R.H.B. lmerTest package: Tests in linear mixed effects models. J. Stat. Softw. 2015, 82, 1–26. [Google Scholar] [CrossRef]
  44. Lai, J.; Zou, Y.; Zhang, S.; Zhang, X.; Mao, L. glmm.hp: An R package for computing individual effect of predictors in generalized linear mixed models. J. Plant Ecol. 2022, 15, 1302–1307. [Google Scholar] [CrossRef]
  45. Lai, J.; Zhu, W.; Cui, D.; Mao, L. Extension of the glmm.hp package to Zero-Inflated Generalized Linear Mixed Models and multiple regression. J. Plant Ecol. 2023, rtad038. [Google Scholar] [CrossRef]
  46. Kassambara, A. ggpubr: “ggplot2” Based Publication Ready Plots. 2020. Available online: https://rpkgs.datanovia.com/ggpubr/ (accessed on 20 October 2023).
  47. Oksanen, J.; Blanchet, F.G.; Kindt, R.; Legendre, P.; Minchin, P.R.; O’Hara, R.B.; Simpson, G.L.; Solymos, P.; Stevens, M.; Wagner, H. vegan: Community Ecology Package, R package version 2.5-3; R Foundation for Statistical Computing: Vienna, Austria, 2018.
  48. Grytnes, J.A. Ecological interpretations of the mid-domain effect. Ecol. Lett. 2003, 6, 883–888. [Google Scholar] [CrossRef]
  49. Kessler, M.; Hofmann, S.; Krömer, T.; Cicuzza, D.; Kluge, J. The impact of sterile populations on the perception of elevational richness patterns in ferns. Ecography 2011, 34, 123–131. [Google Scholar] [CrossRef]
  50. Frahm, J.; Gradstein, S.R. An altitudinal zonation of tropical rain forests using byrophytes. J. Biogeogr. 1991, 18, 669–678. [Google Scholar] [CrossRef]
  51. Gradstein, S.R.; Churchill, S.P.; Salazar-Allen, N. Guide to the Bryophytes of Tropical America; Memoirs-New York Botanical Garden: Bronx, NY, USA, 2001. [Google Scholar]
  52. Wolf, J. Diversity patterns and biomass of epiphytic bryophytes and lichens along an altitudinal gradient in the Northern Andes. Ann. Mo. Bot. Gard. 1993, 80, 928–960. [Google Scholar] [CrossRef]
  53. Glime, J.M. Temperature: Cold. In Bryophyte Ecology; Michigan Technological University: Houghton, MI, USA, 2013; Volume 1, Chapter 10-2. [Google Scholar]
  54. Górski, P.; Gądek, B.; Gąbka, M. Snow as a parameter of bryophyte niche partitioning in snow-beds of the Tatra Mountains (Western Carpathians). Ecol. Indic. 2020, 113, 106258. [Google Scholar] [CrossRef]
  55. Coelho, M.C.; Gabriel, R.; Hespanhol, H.; Borges, P.A.; Ah-Peng, C. Bryophyte diversity along an elevational gradient on pico island (Azores, portugal). Diversity 2021, 13, 162. [Google Scholar] [CrossRef]
  56. Aranda, S.C.; Gabriel, R.; Borges, P.A.; Santos, A.M.; de Azevedo, E.B.; Patiño, J.; Hortal, J.; Lobo, J.M. Geographical, temporal and environmental determinants of bryophyte species richness in the Macaronesian Islands. PLoS ONE 2014, 9, e101786. [Google Scholar] [CrossRef] [PubMed]
  57. Chen, Y.; Niu, S.; Li, P.; Jia, H.; Wang, H.; Ye, Y.; Yuan, Z. Stand structure and substrate diversity as two major drivers for bryophyte distribution in a temperate montane ecosystem. Front. Plant Sci. 2017, 8, 874. [Google Scholar] [CrossRef] [PubMed]
  58. Ah-Peng, C.; Flores, O.; Wilding, N.; Bardat, J.; Marline, L.; Hedderson, T.A.; Strasberg, D. Functional diversity of subalpine bryophyte communities in an oceanic island (La Réunion). Arct. Antarct. Alp. Res. 2014, 46, 841–851. [Google Scholar] [CrossRef]
  59. Patiño, J.; Bisang, I.; Hedenäs, L.; Dirkse, G.; Bjarnason, Á.H.; Ah Peng, C.; Vanderpoorten, A. Baker’s law and the island syndromes in bryophytes. J. Ecol. 2013, 101, 1245–1255. [Google Scholar] [CrossRef]
  60. Horwath, A.B.; Royles, J.; Tito, R.; Gudiño, J.A.; Salazar Allen, N.; Farfan-Rios, W.; Rapp, J.M.; Silman, M.R.; Malhi, Y.; Swamy, V. Bryophyte stable isotope composition, diversity and biomass define tropical montane cloud forest extent. Proc. R. Soc. B 2019, 286, 20182284. [Google Scholar] [CrossRef]
  61. Peters, K.; Poeschl, Y.; Blatt-Janmaat, K.L.; Uthe, H. Ecometabolomics Studies of Bryophytes. In Bioactive Compounds in Bryophytes and Pteridophytes; Springer: Cham, Switzerland, 2023; pp. 637–679. [Google Scholar]
  62. Yadav, S.; Srivastava, A.; Biswas, S.; Basu, S.; Singh, S.K.; Mishra, Y. Seasonal changes in the antioxidative defence system of a liverwort Dumortiera hirsuta. J. Plant Growth Regul. 2022, 41, 1265–1275. [Google Scholar] [CrossRef]
  63. Fenton, N.J.; Frego, K.A.; Sims, M.R. Changes in forest floor bryophyte (moss and liverwort) communities 4 years after forest harvest. Can. J. Bot.-Rev. Can. Bot. 2003, 81, 714–731. [Google Scholar] [CrossRef]
  64. Robinson, S.A.; Waterman, M.J. Sunsafe bryophytes: Photoprotection from excess and damaging solar radiation. In Photosynthesis in Bryophytes and Early Land Plants; Springer: Dordrecht, The Netherlands, 2013; pp. 113–130. [Google Scholar]
  65. Newsham, K.K.; Geissler, P.A.; Nicolson, M.J.; Peat, H.J.; Lewis-Smith, R.I. Sequential reduction of UV-B radiation in the field alters the pigmentation of an Antarctic leafy liverwort. Environ. Exp. Bot. 2005, 54, 22–32. [Google Scholar] [CrossRef]
  66. Schickhoff, U.; Bobrowski, M.; Böhner, J.; Bürzle, B.; Chaudhary, R.P.; Gerlitz, L.; Heyken, H.; Lange, J.; Müller, M.; Scholten, T. Do Himalayan treelines respond to recent climate change? An evaluation of sensitivity indicators. Earth Syst. Dyn. 2015, 6, 245–265. [Google Scholar] [CrossRef]
  67. Bates, J.W. Effects of intermittent desiccation on nutrient economy and growth of two ecologically contrasted mosses. Ann. Bot.-Lond. 1997, 79, 299–309. [Google Scholar] [CrossRef]
Figure 1. Correlations between environmental variables. The figure depicts pairwise comparisons among environmental factors, employing a color gradient to visualize Pearson’s correlation coefficient. Significance levels are indicated as follows: *, 0.01 < p ≤ 0.05.
Forests 15 00048 g001
Figure 2. The liverwort richness in different elevations and aspects of (A) elevation and (B) aspect. Large square box in the graph represents the interquartile range (IQR) that encompasses the values between the first and third quartiles. Outliers are values that fall outside the range of 1.5 times the IQR, as denoted through the solid diamonds. Within each box, the horizontal black line represents the median, while the mean value is indicated through a hollow square.
Forests 15 00048 g002
Figure 3. Effects of environmental variables on liverwort richness. The model used variables like elevation, aspect, solar radiation, mean diurnal range in temperature, isothermality, precipitation of the wettest month, and matrix as the fixed effects. Site variations were considered random effects. R2m denotes the determination coefficient for fixed effects, whereas R2c reflects the combined determination coefficient for both fixed and random effects.
Forests 15 00048 g003
Figure 4. Variation in liverwort distribution across elevation gradients. (A) Illustration using NMDS (ordination method). Ellipses were formed around the barycenters and were significant at a 0.05 level of confidence. (B) Examination of differences in liverwort groupings utilizing the Bray–Curtis similarity metric through ANOSIM. Large square box in the graph represents the interquartile range (IQR), which encompasses the values between the first and third quartiles. Outliers are values that fall outside the range of 1.5 times the IQR, as denoted through the solid diamonds. Within each box, the horizontal black line represents the median, while the mean value is indicated through a hollow square.
Forests 15 00048 g004
Figure 5. Liverwort community interaction with environmental factors. (A) CCA illustrates the disparities between various elevations. Ellipses were formed around the barycenters and were significant at a 0.05 level of confidence. (B) A visual comparison of environment-related aspects is mapped, with varying hues indicating Pearson’s correlation values. Boundary tint signifies the level of statistical relevance. Edge thickness represents mantel’s r.
Forests 15 00048 g005
Disclaimer/Publisher’s Note: The statements, opinions and data contained in all publications are solely those of the individual author(s) and contributor(s) and not of MDPI and/or the editor(s). MDPI and/or the editor(s) disclaim responsibility for any injury to people or property resulting from any ideas, methods, instructions or products referred to in the content.

