Abstract
The presented paper deals with a mutual comparison of the roughness of the sanded radial surface after an eccentric and a belt sander. The beech wood (Fagus sylvatica L.) was sanded with an eccentric sander ETS 125 REQ-PLUS and a belt sander BS-75 E-set from Festool with the grit sizes P40, P60, P80, P100, P120 and P150. The evaluation of the roughness parameters Ra, Rp, Rv, Rz, and Rt was carried out using a digital microscope with a 2.5 mm L-filter and an 8 μm S-filter under the conditions of the technical standard STN EN ISO 21920. The measured results were supported using microscopic analysis of the surface topography especially for surfaces with very high roughness. The experiment shows a lower surface roughness of beech wood sanded with an eccentric sander. The sander created a surface with smaller grooves, removed more protruding fibers and created a more homogeneous surface suitable for subsequent surface treatment.
1. Introduction
Sanding, as the final woodworking operation, is one of the most important in the process of manufacturing wooden products. The aim of sanding is to achieve a surface of the desired quality, which in most cases is expressed by roughness parameters. Sanding has a significant impact on the process of surface treatment [1,2,3,4] or gluing [5,6,7,8,9,10]. In the field of roughness of the surface, most authors focus on the statistical significance of the effect of grit size [11,12,13]—the effect of coarser, medium, fine, and very fine grits. The purpose of coarser grits in practice is to remove significant surface irregularities, while smaller grits are involved in the resulting smoothing of the surface, the removal of protruding fibers and the overall preparation of the surface for surface treatment. Currently, most authors deal with the sanding of wood and wood materials with a belt sander [14,15,16,17,18]. Because of this reason, there is a lack of information about the quality of the created surface after sanding with other technologies: for example, an eccentric sander. The eccentric sander as a manual electric sanding tool is currently widely used for sanding grown wood or the intermediate sanding of surface treatments. It is often used for the final smoothing of the wood surface as the next step after the wide belt sander, which primarily removes unevenness with a lower grit size and equalizes the thickness of the workpieces. An eccentric sander combines two types of movements—rotational movement of the sanding pad (and therefore also the abrasive) and vibrational movement. At the same time, the vibration values of the sanding pad are proposed differently, depending on the resulting surface quality to be achieved. From a theoretical point of view, the technology of eccentric rotation of the sanding pad causes a significant improvement in surface quality compared to a belt sander [19].
Some of the studies in the field of wood sanding evaluate the effects of the grit size on the surface roughness only through the parameter Ra, which is considered as the basis [1,20]. This is also why there is currently a lack of more detailed analyses that define the surface through several R-parameters [13]. The inclusion of other parameters in the measurement is very essential because each parameter defines inequality in a different way.
1.1. The New ISO 21920 Technical Standard
In recent years, the measurement of surface roughness has mainly been carried out in accordance with previous technical standards [21,22,23]. This led to the use of names for individual parameters of irregularities and procedures for their measurement. However, the original standard was replaced in Europe by a new series of ISO 21920 standards in 2021 [24,25]. The biggest changes in the newly issued document include changing the names of individual parameters, harmonizing terms with the areal surface texture standards series and a change in the process of evaluating surface unevenness.
For the individual parameters of roughness, waviness and primary profile, their names were shortened. The most important parameters can be mentioned: Ra (Arithmetic mean height), Rq (Root mean square height), Rsk (Skewness), Rku (Kurtosis), Rt (Total height), Rk (Core height), Rvk (Reduced pit depth), Rpk (Reduced peak height), Rv (Mean pit depth), Rp (Mean peak height), Rz (Maximum height), Rsm (Mean profile element spacing) and Rc (Mean profile element height) [23]. The same names as for the roughness parameters are also for the waviness parameters (W) and the primary profile parameters (P), which will be marked with the corresponding index. From the parameters evaluated on the section length, the standard defines Rpt, Rp, Rvt, Rv and Rz. All other parameters, including Ra, are defined in the new standard on the evaluation length [24].
A more detailed designation of the protrusions and depressions of the profile can be considered a harmonization of terms with the areal surface texture standard series. Figure 1 indicates the protrusion of the profile that is referred to as a ‘hill’ with the highest point marked as a peak. The depression of the profile, on the other hand, is marked as a ‘dale’ with the deepest point marked as a ‘pit’.
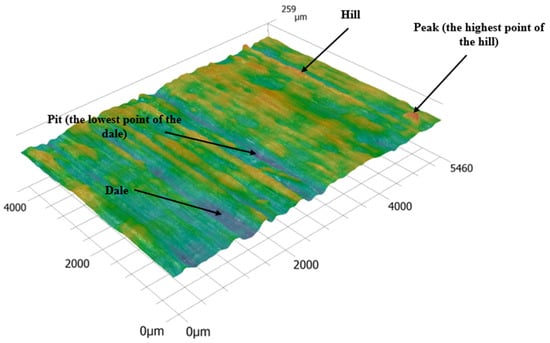
Figure 1.
Parts of the hills and dales of the measured surface.
The most important change in the ISO 21920 series [24,25] of standards is the change in the measurement methodology. Compared to the previous standard, the surface is no longer divided into periodic and non-periodic, but it introduces a uniform measurement methodology for all types of profiles. The technical standard contains a table with the basic parameters Ra, Rz, Rp, Rv, Rq, Rzx and Rt, which represent the estimated parameters. In the first measurement step, the estimated parameter should be identified, which will characterize the measured surface (for example, Ra). Subsequently, an estimate of this parameter should be made by visual inspection, surface roughness comparison of the sample blocks, or analysis of the measured primary profile. The resulting value is compared with the range of values for the given parameter, and if it is inside this interval, the values for the L-filter, S-filter, and evaluation length as well as other important measurement parameters that must be followed [25].
1.2. Aims of the Presented Paper
The paper deals with the complex research of surface roughness created after sanding. Beech wood was chosen because it is often used for the production of chairs, rocking chairs, table legs or railings in the furniture industry or handles for wooden tools. Bent furniture parts are often made from beech wood, which are complicated in shape and therefore difficult to sand. For this reason, in many cases, they require manual sanding. This is exactly what manual eccentric sanders are for. In recent years, developers have focused on eccentric sanding technology, which is very effective—especially when used on curved surfaces. Manual eccentric sanding can also be encountered in the production of luxury furniture, where the emphasis is placed on the high smoothness of the final surface. From all the mentioned uses, it is therefore possible to deduce the ever-increasing use of eccentric sanders in the woodworking industry. Despite this, however, there are still very few papers in the field of wood science that would quantify the surface created by sanding with an eccentric sander and objectively describe the advantages of these sanders.
The aim of the presented paper is therefore to compare the two most commonly used sanding technologies—belt and eccentric sanders—and to quantify their interaction with the surface of beech wood. The priority of the experiment will be to clearly determine which of the two investigated technologies creates a surface with a higher quality (defined by roughness parameters). The measurement of the individual R-parameters of roughness—Ra, Rp, Rv, Rz and Rt—will be supported by a microscopic analysis with the help of which the dominant irregularities on the created surface will be defined. The sanded surface will also be compared with the surface after milling on the thicknessing milling machine. Likewise, a regression model with a regression equation will be created for sanding with a belt sander and an eccentric sander with the aim of mathematically predicting the change in individual R-parameters.
2. Materials and Methods
2.1. Preparation of Samples
Beech boards (Fagus sylvatica L.) were used to produce samples with dimensions of 12 mm × 70 mm × 70 mm (thickness × width × length). All tested samples had a radial texture. For the purposes of the experiment, the dimensions were designed so that the samples could be placed in the designed laboratory sanding stand. The samples with a radial surface reached a moisture content of 8% ± 2% after acclimatization. This value was chosen as the equilibrium moisture content of wood in the interior, i.e., in the conditions of furniture production as well as in the conditions of furniture use (household).
Before sawing, the boards were first milled using a planer and then equalized in thickness using a thicknessing milling machine with a spiral cutter head. Out of 56 sawn samples, 8 samples were used as a reference milled surface. These samples were not sanded with any of the mentioned technologies. The rest were divided into two groups—the first group was sanded using an eccentric sander, and the second group was sanded using a belt sander. For six different grit sizes of abrasives, 4 samples were selected in each group.
2.2. Sanding of Samples
A special laboratory sanding stand (structurally adapted to clamp Festool sanders) was used for sanding the samples (Figure 2). The stand is made of a massive steel construction, which with its weight helps dampen vibrations during sanding. The main part of the stand is a clamping steel frame, into which the samples are clamped by means of screws so that they do not come loose during sanding. The frame is welded with a shaft that moves on bearings. The movement of the frame against the abrasive with a constant 1951 N pressure force (calculated from the mass of the weight) is ensured by a suspended weight that acts on the shaft via a steel wire. The gradual movement of the shaft (together with the clamping frame with the sample) during sanding indicates the size of the sanded layer of material, which is detected by a digital deviation meter. In this case, the sanded layer was 0.5 mm. The sanding time of 0.5 mm depended on the hardness of the sample and the grit size of the sanding belt or disc.
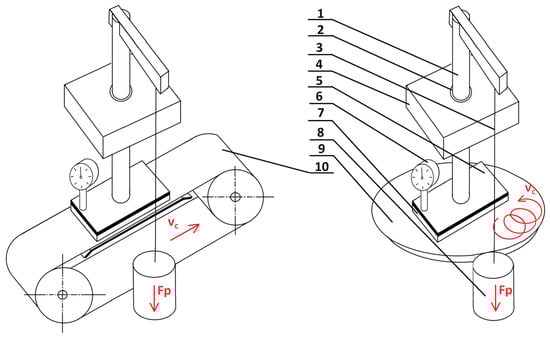
Figure 2.
Simplified scheme of construction of laboratory sanding stand (1—Shaft, 2—Bearing, 3—Steel wire, 4—Steel frame fixed with construction of stand, 5—Clamping steel frame with screws, 6—Digital deviation meter, 7—Wood sample, 8—Weight, 9—Eccentric paper, 10—Belt sander).
Sanding discs and sanding belts P40, P60, P80, P100, P120 and P150 were used for sanding with a Festool ETS 125 REQ-PLUS (Festool Group GmbH & Co. KG, Wendlingen, Germany) eccentric sander with a sanding stroke of 2 mm, a disc revolution number of 9000 rpm and a Festool BS-75 E-Set (Festool Group GmbH & Co. KG, Wendlingen, Germany) belt sander with a belt speed of 290 m·min−1. Selected sanding belts from Festool had dimensions of 533 × 75 mm and sanding discs had a diameter of 125 mm. Both sanders were abrasives of the Rubin 2 (Festool Group GmbH & Co. KG, Wendlingen, Germany) type. The abrasive in this case is ground aluminum oxide (corundum). The backing is paper with velour and the bonds consist of a two-layer heat-resistant synthetic resin that prevents premature damaging of the abrasives. Before starting the measurement, all samples were cleaned using an air blow gun so that residual dust after sanding does not affect the surface scanning process and the subsequent evaluation of individual parameters. The sanding of beech wood with a belt sander was carried out in the direction parallel to the grain. The direction of sanding perpendicular to the grain was not investigated, as it leaves very distinct, visible traces of sanding abrasive on the surface, which is unacceptable in sanding practice.
2.3. Microscopic Analysis
For the purposes of microscopic analysis, a Keyence VHX-7000 digital microscope (Keyence Corporation, Osaka, Japan) was used, the construction and working principle of which is described in more detail in the Section 4. The microscopic analysis was focused on the research of the kinematic path of the abrasive and its effect on the surface of the wood.
2.4. Roughness Measurement
Surface roughness was measured in accordance with the newly published series of technical standards STN EN ISO 21920 (2022) [24,25]. The authors defined the interaction of both types of sanders with the surface of beech samples by changing the quality of the surface after sanding. They expressed the quality itself by measuring the roughness parameters Ra (arithmetic mean height), Rp (mean peak height), Rv (mean pit depth), Rz (maximum height) and Rt (total height). For measuring the roughness, the L-filter (λc) value of 2.5 mm and S-filter (λs) value of 8 μm were chosen. The evaluation length was 12.5 mm, and the total scanned length was 17.5 mm. On each sample, 30 profile traces were measured in the direction perpendicular to the grain and 30 were measured in the direction parallel to the grain. The goal of a higher number of profile traces is to capture critical values of surface irregularities. Individual profile traces were evenly distributed on the sample. This procedure makes it possible to better define the surface in terms of the heterogeneity of wood as a material (the methodology makes it possible to monitor the change in roughness in individual anatomical directions or in individual machining directions). For the purposes of this paper, the R-parameter values from 30 profile traces were averaged using the arithmetic mean.
A Keyence VHX-7000 digital microscope (Keyence Corporation, Osaka, Japan) was used as an optical measurement method to measure the surface roughness. The main part of the digital microscope is the VHX-7020 (Keyence Corporation, Osaka, Japan) camera connected to the VH-Z100R (Keyence Corporation, Osaka, Japan) wide-range zoom lens with magnification from 100× to 1000×. The digital image is created by a CMOS image sensor. Both the camera and the wide-range zoom lens are connected to the free-angle observation stand VHX-S650E (Keyence Corporation, Osaka, Japan) using a motorized stand VHX-S700F (Keyence Corporation, Osaka, Japan) used to move the lens in the Z axis and measure the height of individual surface irregularities. The digital microscope then calculates the three-dimensional depth by defocusing the two-dimensional image using the software tool Depth from Defocus (Keyence Corporation, Osaka, Japan). As the lens moves along the Z-axis closer to the observed object, the focus level of its individual parts changes. From a topographical point of view, the highest points of an object come into focus first, while the lowest points come into focus last. Simultaneously, the microscope records the height position of the individual focal planes and then creates the resulting 3D image from them. The VHX-H5M software (Keyence Corporation, Osaka, Japan) is used in the microscope to measure the primary profile, roughness, and waviness (Figure 3). The software allows observing the topography of the surface in 3D and the shape of the profile trace. An 18 × 18 mm (2880 × 2160 px) image was created for roughness measurement using the 3D image stitching software tool (Keyence Corporation, Osaka, Japan). The two motorized X and Y axes of the eucentric XYθ stage enable accurate image stitching.
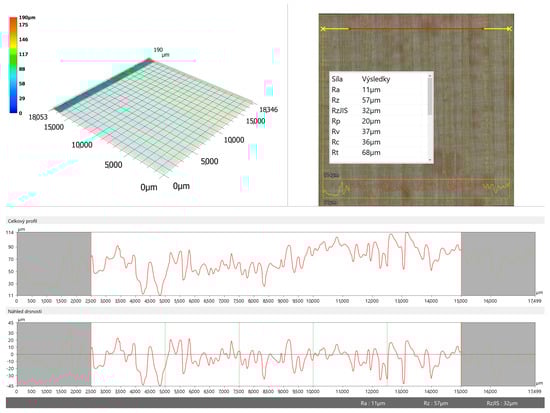
Figure 3.
Measuring of the roughness of the beech surface on a digital microscope Keyence.
2.5. Regression Model
The STATISTICA 12 (StatSoft, Tulsa, Oklahoma) program was used to create the regression model. The regression equation was calculated for all measured R-parameters with the aim of finding the most suitable parameter, i.e., the one with the highest value of the coefficient of determination. Regression models were calculated simultaneously for the direction perpendicular to the grain and the direction parallel to the grain as well as for both sanding technologies.
3. Results and Discussion
3.1. Comparison of Samples
Sanding, as a type of woodworking, is carried out to achieve a certain quality. The second important aim is to achieve the aesthetics of the surface. By sanding, it means the removal of characteristic scratches that are created after other woodworking operations or after the action of abrasives. Before microscopic analysis, the samples sanded with the P40 grit size were compared with the naked eye. With the belt sander, the surface of the beech wood was visibly more scratched (damaged) than the surface after the eccentric sander. This required longer sanding time at subsequent grit sizes where deep grooves needed to be removed.
3.2. Microscopic Analysis
Microscopic analysis has proven to be an essential tool for surface roughness research. The analysis (Figure 4) visualizes the fuzziness of the surface caused by protruding fibers as well as profile dales caused by the kinematic trace of the sanding belt or disc. Microscopic analysis showed a difference in the surfaces produced by eccentric and belt sanders. A different kinematic trace of sanding can be observed on Figure 4. Surfaces sanded with a grit size of P40 were chosen, where the traces were most pronounced (surfaces with high values of irregularities). Traces are created due to the action of abrasives from aluminum oxide, which are harder than the surface of beech wood. With a sanding disc on an eccentric sander, the tracks have a cycloidal shape and are unevenly distributed on the surface of the wood. The shape is caused by the rotation of the abrasives around the central axis of the disc and synchronously by the movement of the sander itself to the sides. With a belt sander, the abrasive leaves deep traces (grooves), significantly increasing the irregularities of the surface. The depth and distribution of the grooves are caused by the uneven removal of material across the width of the sanding belt and are directly related to the difference in density and hardness of earlywood and latewood. Simultaneously, the traces are oriented according to the direction of sanding and therefore most often in the direction of the grain.
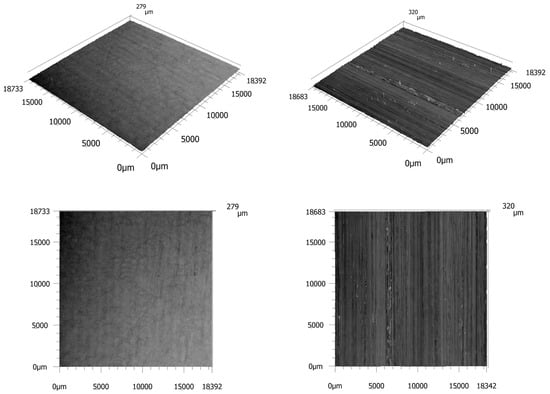
Figure 4.
Microscopic analysis of surface irregularities when sanding with a P40 grit size with an eccentric sander (left) and belt sander (right).
Figure 4 also shows that although the surface is sanded with an abrasive of the same grit size (P40), the surface sanded with an eccentric sander shows smaller irregularities. The reason is eccentric rotation as a combination of vibrational and rotational movement of the abrasive. It significantly reduced the fuzziness of the surface compared to the belt sander and made the surface smoother.
On the other hand, from Figure 5, the interaction of the sanding disc and the sanding belt with the earlywood and latewood is clearly visible. From the results, it is possible to claim that the surface topography analysis of the irregularities is suitable for evaluating the impact of the sanding tool on the anatomical structure of the wood. Microscopic analysis through surface topography also proved that a sanding stroke of 2 mm with an eccentric sander produces a higher quality surface. The use of an eccentric sander with P40 caused lower surface roughness than P40 when using a belt sander. The analysis therefore shows that the function of eccentric rotation more effectively separates the sanded protruding fibers from the surface.
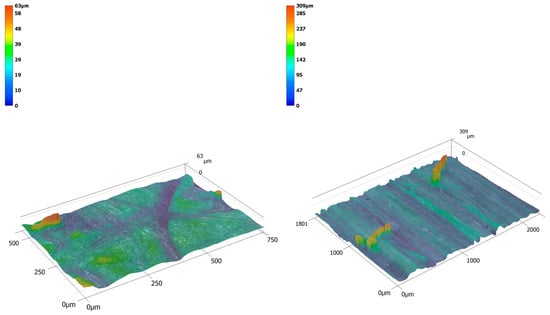
Figure 5.
Topographic depiction of surface hairiness when sanding with P40 grit with eccentric sander (left) and belt sander (right).
3.3. Measurement of Surface Roughness
Before statistical evaluation using STATISTICA 12 (StatSoft, Tulsa, Oklahoma) software, the outliers for individual grit sizes were removed from the data set of Ra, Rp, Rv, Rz and Rt measurements, and the missing data were measured. In the first step, the input data matrix was evaluated by methods of descriptive statistics. From the results of the 3360 values in Table 1, it is possible to observe the standard deviation of the measurement for individual R-parameters and individual measurement directions.

Table 1.
Standard deviations of parameters Ra, Rp, Rv, Rz and Rt in individual measurement directions perpendicular to the grain and parallel to the grain (for n = 120).
The standard deviation of the measurement is a suitable indicator of the heterogeneous nature of the measured sanded surface. Its higher value points to an uneven distribution of roughness in the measured directions. Table 1 shows the following:
- In the direction perpendicular to the grain, the standard deviation is higher and is mainly caused by differences in the heights of earlywood and latewood irregularities within the individual measurement traces. This trend was confirmed for all R-parameters.
- Standard deviations decrease with increasing abrasive grit size. When choosing to measure the roughness profile, the standard deviations complement the data on the roughness distribution on the sanded surface. A decrease in standard deviations means a more homogeneous, smoother surface, which is more suitable for subsequent surface treatment.
- In most cases, the standard deviation was higher for the belt sander (especially in the case of parameters related to the height of irregularities—amplitude parameters). This is proof that the belt sander creates a significantly uneven surface, especially in the direction perpendicular to the grain and with lower grit sizes. Deep, uneven grooves caused an increase in the standard deviation for the Rz and Rt parameters at the P40 grit size. These are also the highest values. They were probably caused by the pulling out of wood fibers of different sizes, which caused different values between the roughness parameters.
- Of the R-parameters that define the height of irregularities, Rz can be considered more accurate. Rz is measured as the sum of the largest peak height and largest pit depth (Rp + Rv) for each of the five section lengths. Subsequently, the five values are averaged. Compared to the Rt parameter, the parameter is less susceptible to outliers caused by surface fuzziness or torn fibers.
- The parameter with the lowest values of the standard deviation is Ra, which is the arithmetic mean of the heights of the roughness profile. Table 1 shows that this parameter has the least extreme measurement values in the measured set. It is therefore less affected by surface areas with significant fuzziness or torn fibers. However, the Ra parameter itself does not define the shape of the profile and therefore does not define the shape of the hills and dales.
The data set was subsequently tested by analysis of variance (ANOVA), in which individual conditions of the test were tested—normality (Shapiro–Wilk test), equality of variances (Levene’s test) and independence of measurements (logical assessment). From the results of the three-factor analysis of variance, it can be claimed that all three investigated factors—type of sander, grit size and measurement direction—have a statistically significant effect on the roughness parameters and their interaction (p = 0.000).
Figure 6 shows a statistically significant decrease in the values of the Ra parameter in both measured directions and both types of sanders. The well-known theory that surface roughness decreases significantly with increasing grit sizes was thus confirmed. The largest decreases in surface roughness were measured in the direction perpendicular to the grain. The reason was the gradual equalization of the difference between more sanded earlywood and less sanded latewood.
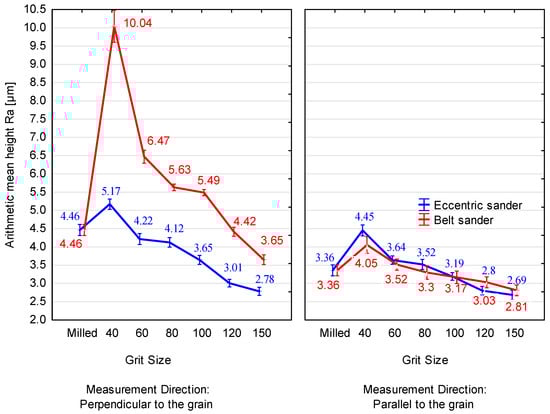
Figure 6.
Average values of the Ra parameter measured in two directions and with two different types of sanders. Vertical bars denote 0.95 confidence intervals.
The highest values were measured with a belt sander in the direction perpendicular to the grain and with the P40 grit size. The value of Ra = 10.04 μm is significantly higher than in the case of other grit sizes. For this reason, the samples were sanded again, and the measurements were repeated. Both sets of measurements were then compared using a dependent paired samples t-test. The average of the Ra parameter after the second sanding was 10.32 μm, which does not represent a statistically significant difference (p = 0.215). The other R-parameters were also evaluated, in which no significant difference was also demonstrated. The high value of Ra for the belt sander and grit size P40 was thus caused by the sanding process. The rapidly higher value of the belt sander confirms the findings of the microscopic analysis about a more uneven surface. It is therefore clear that microscopic analysis is an essential tool in the search for the causes of surface unevenness.
Duncan’s post hoc test as well as Figure 6 further shows that there is a statistically significant difference in the direction perpendicular to the grain between the surface created by eccentric or belt sander. This supports the results of the microscopic analysis, which showed that the belt sander creates large irregularities between the earlywood and latewood. More sanded, softer, and less dense earlywood compared to harder, more dense latewood also caused an increase in the Ra parameter. An eccentric sander with a sanding stroke of 2 mm, on the other hand, created smaller irregularities between earlywood and latewood at individual grain sizes. This is caused by the combination of rotary and vibrational movement of the abrasive, where the vibrational movement smoothed the surface better. The vibrations caused a slower and more gradual sanding of the material so that the surface was not disturbed by pulling out the fibers. Also, the smaller abrasive did not tear the softer earlywood to the same extent as with the belt sander. No statistically significant differences were measured in the direction along the grain between eccentric and belt sanders for most grit sizes (even at the lowest value of Ra = 2.69 μm for an eccentric sander). In this anatomical direction, irregularities are mostly formed by different depths of cellular elements or the presence of depressions after torn fibers.
More important, however, is the comparison of the difference between the two measured directions. The aim of sanding should be to level (and thus reduce roughness) the entire surface in all directions. High roughness increases the amount of surface treatment required per unit area and weakens bonds during bonding [2,26,27]. Sanding with a belt sander, unless supplemented by an oscillating motion of the belt, leaves significant differences on the surface between the two anatomical directions. With an eccentric sander, the difference between the direction perpendicular to the grain and the direction parallel to the grain is smaller. The reason is the rotational movement of the abrasive, where during one revolution, the abrasive acts in both anatomical directions with the same force. From Figure 6, it follows that the surface is more homogeneous in both directions.
Part of the aim of the paper was also to verify the claim that the sanded surface has comparable [18] or higher surface irregularities than the surface after milling [23]. From the graph, it can be observed that the surface roughness first increased with lower grit sizes, and with higher grit sizes, it started to decrease again. In the case of sanding with a belt sander in the direction perpendicular to the grain, the roughness is lower only at the P120 grit size and in the direction along the grain at the P80 grit size. With an eccentric sander, the roughness in the direction perpendicular to the grain is already lower at the P60 grit size and in the direction parallel to the grain at the P100 grit size (comparable Ra values at the P100 grit size also result from Aslan et al. [23]). A higher quality surface after milling on a thicknessing milling machine can therefore be achieved more quickly using an eccentric sander. In the direction perpendicular to the grain, the resulting roughness at P150 was lower by 37.7% for the eccentric sander and 18.2% for the belt sander compared to the milled surface. In the direction parallel to the grain, the roughness was lower by 19.9% with the eccentric sander and 16.4% with the belt sander compared to the milled surface.
The Ra parameter is the most measured R-parameter of roughness. A significant number of authors in the field of woodworking use it as an indicator of surface irregularities changes under the influence of external factors. However, the parameter itself does not express the shape of the profile trace. For this reason, several profile traces with different shapes can have the same Ra value. That is why many authors decided to pay attention to other parameters based on the highest points of profile hills (Rp) and the lowest points of profile dales (Rv) [18,23,28,29].
In Figure 7, it is possible to observe the values of the parameter Rp, which most often represents places with protruding wood fibers (fuzziness). They are created by scraping the surface with abrasives, which, especially with a belt sander, may not always lead to a complete separation of the wood fibers from the surface. These places then occur during measurements as increased values of the parameter Rp. The graph shows that the eccentric sander separated the sanded fibers better, which led to a significant decrease in Rp values. At the same time, it is possible to state that the hills of the surface are statistically significantly smaller than after sanding with a belt sander, especially in the direction perpendicular to the grain. As a result, the quality of the surface treatment will also be improved, which will not cause the protruded fibers after wetting. This will reduce the time required for sanding between coats and increase the final smoothness of the surface.
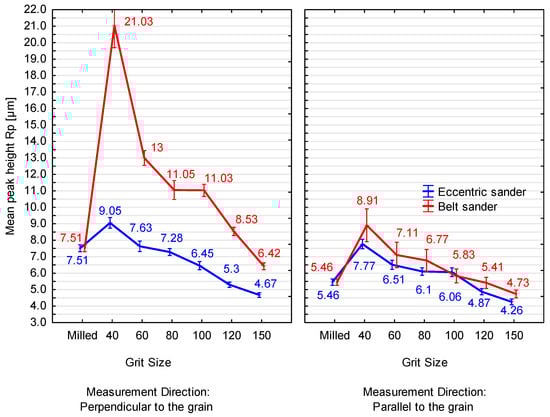
Figure 7.
Average values of the Rp parameter measured in two directions and with two different types of sanders. Vertical bars denote 0.95 confidence intervals.
By comparing Figure 7 and Figure 8, it is possible to notice that the values of Rv are higher than the values of the parameter Rp in all measured cases. Thus, it is possible to claim that the sanded surface is characterized by predominant dales of the profile. Therefore, the grooves created by the abrasive are larger than the protruding fibers and will have a more fundamental effect on the overall quality of the surface. Simultaneously, this phenomenon could also be defined using other R-parameters, such as Rsk (skewness), which will be the subject of future research. Negative skewness values characterize a surface with deep grooves or cracks, which are caused by pulling out wood fibers [30,31,32]. On the contrary, positive Rsk values are defined by a surface with many profile hills—fibers that protrude from the surface [30].
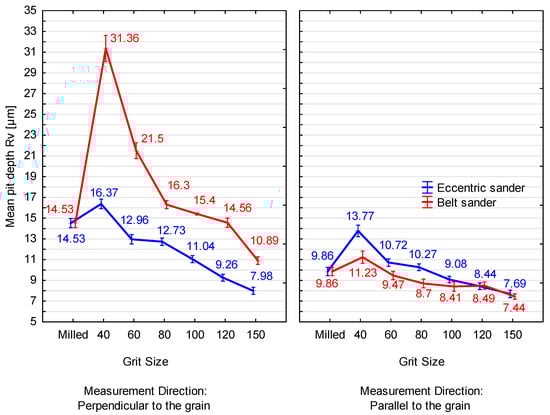
Figure 8.
Average values of the Rv parameter measured in two directions and with two different types of sanders. Vertical bars denote 0.95 confidence intervals.
From Figure 8, it is possible to notice that the Rv parameter has a similar decreasing trend as the Ra parameter. In both directions and with both sanders, the values decrease with increasing abrasive grit size. In the field of woodworking, the cause of Rv is most often explained by surface damage due to fiber tearing. In the case of sanding, these are most often deep grooves where the wood fibers have been scraped with abrasives [13]. These places are very well recognizable in Figure 5. Another cause may be the presence of deeper pores on the surface [13] or excessively sanded soft earlywood. The highest values were measured at the P40 grit size, where they were higher than the Rv values for the milled surface. In this case, the abrasive disturbed the surface to a greater extent than the thicknessing milling machine. A sharp increase in Rv in the direction perpendicular to the grain in the belt sander caused rapid sanding of the earlywood zone. The formed grooves could be observed with the naked eye as well as by microscopic analysis (Figure 4 and Figure 5). At higher grit sizes, abrasives of smaller diameter smooth the surface more, which caused a gradual decrease in Rv values in all measured combinations. The peculiarity in this case remains that lower Rv values were measured for beech wood than those reported by Gurau et al. [13]. However, differences could arise due to the density of the measured samples, the type of sanding technology or the type of the abrasive.
Duncan’s post hoc test shows a statistically significant difference in Rv between the used sanders in the direction perpendicular to the grain. In the direction along the grain, a statistically significant change was measured for the P40, P60, P80 and P100 grit sizes. With both sanders, the sanding abrasive particles are the same size, but with the eccentric sander, the vibration movement smoothed the surface more. This was demonstrated especially in the direction perpendicular to the grain, where there were no large irregularities between earlywood and latewood. From the measurements in Figure 8, it follows that the eccentric sander with its combined movement creates less deep scratched areas and creates a better surface quality.
The parameter Rz (maximum height) is a suitable supplement for the parameter Ra, as it defines the heights of individual irregularities. In Figure 9, it is possible to observe the gradual smoothing of the profile from the P40 grit size to the P150 grit size. Rz defines the gradual removal of protruding fibers from the surface and at the same time the reduction in deep grooves that were created on the surface by the action of the abrasive. In the direction perpendicular to the grain, the parameter is also an indicator of reducing the differences between earlywood and latewood. While in the direction along the grain, no statistical significance was demonstrated between the quality of the surface created by the eccentric and the belt sander, in the direction perpendicular to the grain, the eccentric sander created a better surface. In this case, the height of the irregularity changed more gently with increasing grit size than in the case of the belt sander. The sudden changes in the height of the irregularities with the belt sander could be caused by the gradual sanding away of unseparated protruding fibers. When compared to the milled surface, it can be said that the spiral cutter head of the thicknessing milling machine cut the fibers and did not cause significant tearing. However, with the P40 grit size, the belt sander damaged the surface and left many protruding fibers on the surface. This can also be supported by microscopic analysis (Figure 4 and Figure 5).
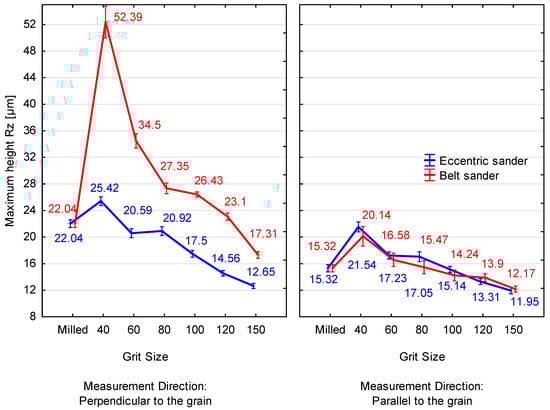
Figure 9.
Average values of the Rz parameter measured in two directions and with two different types of sanders. Vertical bars denote 0.95 confidence intervals.
An alternative parameter to Rz is also Rt. In Figure 10, it is possible to claim that the Rt values are significantly higher than the Rz values, especially at lower grit sizes. This is evidence that on the same profile trace, Rt is more prone to extremely protruding fibers or microscopic gaps (dales) after torn fibers. With a more damaged surface, the values are very distorted, which can also be observed on the vertical bars, denoting the 0.95 confidence intervals. Likewise, the standard deviation in Table 1 is evidence that the values of Rt at lower grit sizes are very different and are not suitable for describing a significantly heterogeneous sanded surface.
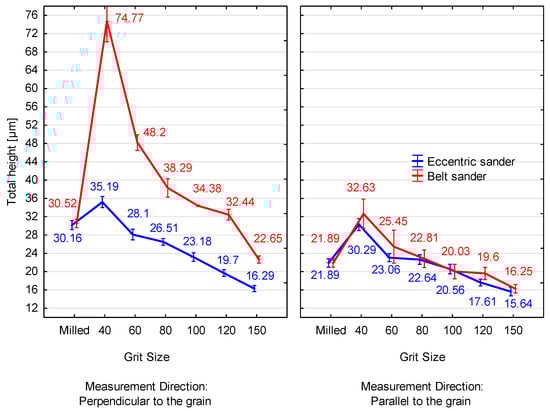
Figure 10.
Average values of the Rt parameter measured in two directions and with two different types of sanders. Vertical bars denote 0.95 confidence intervals.
3.4. Regression Model of the Development of R-Parameters Depending on the Grit Size of the Abrasive
As part of the investigation of the irregularities created by the sanding process, regression models were created for individual R-parameters. Each linear regression model included a regression equation and a coefficient of determination (R2) to verify the measure of model quality. By measuring, it was found that due to the high variability of the measured values in the direction along the grain, it is not possible to predict the values of the dependent variable. Therefore, only the measurement direction perpendicular to the grain was taken for the further creation of regression models.
Of the measured parameters, the highest value of the coefficient of determination was found for the Rv parameter. From the point of view of surface roughness, this parameter mainly describes grooves created by abrasives. As can be seen from the graphs of Rp and Rv measurements, the most significant irregularity during sanding is created by these grooves. To a lesser extent, these are peaks on the surface of the wood formed mainly by unseparated fibers (the so-called fuzziness of the surface), which is represented by the Rp parameter. When predicting the state of the surface after sanding with different grit sizes, it is therefore most logical to describe the surface with the parameter Rv. That is also why the next creation of regression models was focused on Rv.
The linear regression model for the belt sander can be described by equation y = 32.86 − 0.16…x (x represents the grit size of the abrasive sanding belt). The linear regression model for the eccentric sander can be described by equation y = 18.08 − 0.07…x (x represents the grit size of the abrasive sanding disc). However, the regression models for sanding beech wood with an eccentric and a belt sander show a relatively low-quality rate (for the eccentric sander, R2 = 62.88% and for the belt sander, R2 = 65.94%). It follows from the models that this phenomenon is mainly caused by the high variability of the measured values for all grit sizes. The authors of the paper found that the creation of both models is strongly influenced by outliers, which are caused mainly by local dales after torn fibers. Even if a regression equation was determined from the models, this brings only a partial knowledge of the development of surface irregularities during the sanding process and is not sufficient for a clear prediction of the values of the dependent variable. Therefore, it is necessary to deal with the outliers of measurement for future research. A suitable way could be to use the parameter Rk. The latter is considered a parameter describing the roughness created only by the machining process (without the influence of the anatomical structure of the wood), and which isolates significant dales of deep pores or places after torn fibers (Rvk) as well as hills of the profile caused by protruding fibers (Rpk) [33,34,35]. The parameter itself shows less variability of the measured values and thus a smaller standard deviation and may be suitable for the creation of future regression models.
4. Conclusions
The three-factor analysis of variances showed a statistically significant influence of the abrasive grit size, the type of sander and the measurement direction on individual roughness parameters. Roughness parameters of surfaces created by eccentric and belt sanders were compared to each other, and the following conclusions can be drawn from the results:
- –
- In all measured cases, there was a gradual decrease in the values of R-parameters with the increasing grit size of the abrasive for both types of sanders.
- –
- The eccentric sander created a smoother (higher quality) sanded surface in the direction perpendicular to the grain. The difference in individual grit sizes in this direction was statistically significant. In the direction parallel to the grain, a statistically significant difference was not measured.
- –
- Eccentric rotation as a combination of rotational and vibrational movement of the abrasive had a significant effect on the sanded surface. Lower Rp values were measured due to the separation of protruding fibers by the vibratory motion of the sander. The sanding stroke of 2 mm did not create such deep grooves on the surface at lower grit sizes than the belt sander. This significantly reduced the values of the Rv parameter. The lower Rz values with the eccentric sander in the direction perpendicular to the grain proved that the eccentric rotation better smoothed out the differences between more sanded earlywood and less sanded latewood. The impact was again the vibrational component of the eccentric rotation.
- –
- An eccentric sander is more suitable for creating a high-quality final surface before surface treatment. Compared to the belt sander, it smoothed the surface in both directions to approximately the same R-parameter values. This is evidence of the creation of a more homogeneous, smoother surface over the entire area, which is desirable in surface treatment.
From the performed microscopic analysis of problematic surfaces sanded with the P40 grit size, the following can be stated:
- –
- The sanded surface is characterized by unevenness in the form of created deeper grooves, protruding non-separated fibers, height differences between more sanded earlywood and less sanded latewood.
- –
- Sanding as a type of woodworking leaves kinematic traces (scratches) on the surface after the action of sharp abrasive particles on the softer wood surface. The rate of occurrence and size of kinematic traces is determined by the sanding technology.
- –
- The eccentric sander created a kinematic trace on the surface. However, it was significantly smaller than in the case of the belt sander. In the case of the belt sander, the mark was even visible to the naked eye.
A comparison of the roughness of the milled and sanded beech wood surface shows the following:
- –
- The roughness of the sanded surface was higher than the roughness of the milled surface especially with lower grit sizes. This surface showed higher values of Rv (grooves along the grain), Rp (protruding fibers) and thus also Rz in the direction parallel to the grain.
- –
- The roughness of the sanded surface was lower than the roughness of the milled surface at higher grit sizes. In the case of sanding with a belt sander in the direction perpendicular to the grain, the roughness is lower only at the P120 grit size and in the direction parallel to the grain at the P80 grit size. With an eccentric sander, the roughness in the direction perpendicular to the grain is already lower at the P60 grit size and in the direction parallel to the grain at the P100 grit size.
- –
- With an eccentric sander, it was possible to achieve better surface quality faster after milling. In the direction perpendicular to the grain, the resulting roughness at the P150 was lower by 37.7% for the eccentric sander and 18.2% for the belt sander compared to the milled surface. In the direction parallel to the grain, the roughness was lower by 19.9% with the eccentric sander and 16.4% with the belt sander compared to the milled surface.
For the overall evaluation of the roughness of the sanded surface using the optical method, the following follows from the paper:
- –
- Ra alone is not a sufficient parameter to characterize the roughness profile. Adding other parameters that characterize the height of irregularity is beneficial for research. Suitable parameters are Rp, Rv and Rz.
- –
- The Rt parameter did not prove itself especially for lower grit sizes, where the values between individual measurements were significantly different (higher standard deviation). The difference was caused by deep grooves and protruding fibers.
- –
- For future research, it may be beneficial to include other roughness parameters: for example, Rsk, Rku or Rsm.
- –
- Regression models describing the parameters Ra, Rp, Rv, Rz and Rt show a low value of the coefficient of determination, while the models for the Rv parameter reached the highest values. A suitable parameter used to predict the development of surface roughness could be the parameter Rk.
Author Contributions
L.A. performed conceptualization, preparation, and measurement of the roughness of the samples as well as microscopic analysis and the original draft preparation. L.D. ensured the project administration and funding acquisition. A.B. ensured the translation and editing of the original draft into the template. R.K. performed the supervision and tested the data set in the statistical program. All authors have read and agreed to the published version of the manuscript.
Funding
This experimental research was prepared within the grant project supported by the Slovak Research and Development Agency under the Contract No. APVV-21-0051 “Research of false heartwood and sapwood of Fagus sylvatica L. wood in order to eliminate color differences by the process of thermal treatment with saturated water steam” (60%) as the result of the work of the author and the considerable assistance of the APVV agency and within the projects by the VEGA Agency of Ministry of Education, Science, Research, and Sport of the Slovak Republic and the Slovak Academy of Sciences Grant No. VEGA 1/0324/21 “Analysis of the risks of changes in the material composition and technological background on the quality of the working environment in small and medium-sized wood processing companies” (20%). The contribution was also prepared within the project agency IPA TUZVO, which contributed significantly to the creation of this contribution through the project: IPA TUZVO 9/2023 (20%).
Institutional Review Board Statement
Not applicable.
Informed Consent Statement
Not applicable.
Data Availability Statement
The data presented in this study are available upon request from the corresponding author.
Conflicts of Interest
The authors declare no conflicts of interest.
References
- Luo, B.; Zhang, J.; Bao, X.; Liu, H.; Li, L. The Effect of Granularity on Surface Roughness and Contact Angle in Wood Sanding Process. Measurement 2020, 165, 108133. [Google Scholar] [CrossRef]
- Richter, K.; Feist, W.C.; Knaebe, M.T. The Effect of Surface Roughness on the Performance of Finishes. For. Prod. J. 1995, 45, 91–97. [Google Scholar]
- Williams, R.; Jourdain, C.; Daisey, G.; Springate, R. Wood Properties Affecting Finish Service Life. J. Coat. Technol. 2012, 72, 35–42. [Google Scholar] [CrossRef]
- Zhong, Z.W.; Hiziroglu, S.; Chan, C.T.M. Measurement of the Surface Roughness of Wood Based Materials Used in Furniture Manufacture. Measurement 2013, 46, 1482–1487. [Google Scholar] [CrossRef]
- Kuljich, S.; Cool, J.; Hernández, R.E. Evaluation of Two Surfacing Methods on Black Spruce Wood in Relation to Gluing Performance. J. Wood Sci. 2013, 59, 185–194. [Google Scholar] [CrossRef]
- Malkoçoğlu, A. Machining Properties and Surface Roughness of Various Wood Species Planed in Different Conditions. Build. Environ. Bldg. Environ. 2007, 42, 2562–2567. [Google Scholar] [CrossRef]
- Keturakis, G.; Juodeikienė, I. Investigation of Milled Wood Surface Roughness. Mater. Sci. 2007, 13, 47–51. [Google Scholar]
- Hiziroglu, S.; Zhong, Z.; Tan, H. Measurement of Bonding Strength of Pine, Kapur and Meranti Wood Species as Function of Their Surface Quality. Measurement 2013, 46, 3198–3201. [Google Scholar] [CrossRef]
- Söğütlü, C. Determination of the Effect of Surface Roughness on the Bonding Strength of Wooden Materials. BioResources 2017, 12, 1417–1429. [Google Scholar] [CrossRef]
- Gumowska, A.; Kowaluk, G. Bonding of Birch Solid Wood of Sawmill Surface Roughness with Use of Selected Thermoplastic Biopolymers. Ann. WULS For. Wood Technol. 2019, 106, 9–15. [Google Scholar] [CrossRef]
- Gurau, L. Testing the Processing-Induced Roughness of Sanded Wood Surfaces Separated from Wood Anatomical Structure. Forests 2022, 13, 331. [Google Scholar] [CrossRef]
- Selcuk, D. Determination of the Effect of Cutting Direction and Grit Sizes of the Abrasive on Surface Roughness of Scotch Pine (Pinus sylvestris L.) and Oriental Beech (Fagus orientalis L.) Woods. J. For. Fac. 2019, 19, 164–172. [Google Scholar] [CrossRef]
- Gurau, L.; Irle, M.; Buchner, J. Surface Roughness of Heat Treated and Untreated Beech (Fagus sylvatica L.) Wood after Sanding. BioResources 2019, 14, 4512–4531. [Google Scholar] [CrossRef]
- İlçe, A.C. Determination of Surface Roughness Based on the Sanding Parameters of Oriental Beech Wood. BioResources 2018, 13, 5942–5952. [Google Scholar] [CrossRef]
- Alves, M.C.D.S.; Santiago, L.F.F.; Gonçalves, M.T.T.; Valarelli, I.D.D.; Varasquim, F.M.F.D.A. Effect of Belt Speed, Pressure and Grit Size on the Sanding of Pinus Elliottii Wood. Cerne 2015, 21, 45–50. [Google Scholar] [CrossRef]
- Tan, P.L.; Sharif, S.; Sudin, I. Roughness Models for Sanded Wood Surfaces. Wood Sci. Technol. 2012, 46, 129–142. [Google Scholar] [CrossRef]
- Bao, X.; Ying, J.; Cheng, F.; Zhang, J.; Luo, B.; Li, L.; Liu, H. Research on Neural Network Model of Surface Roughness in Belt Sanding Process for Pinus Koraiensis. Measurement 2018, 115, 11–18. [Google Scholar] [CrossRef]
- Vitosytė, J.; Ukvalbergienė, K.; Keturakis, G. Roughness of Sanded Wood Surface: An Impact of Wood Species, Grain Direction and Grit Size of Abrasive Material. Mater. Sci. 2015, 21, 255–259. [Google Scholar] [CrossRef]
- Adamčík, L.; Kminiak, R.; Schmidtová, J. Measurement of the Roughness of the Sanded Surface of Beech Wood with the Profile Measurement Software of the Keyence VHX-7000 Microscope. Acta Fac. Xylologiae Zvolen 2023, 65, 73–85. [Google Scholar] [CrossRef]
- Miao, T.; Li, L. Study on Influencing Factors of Sanding Efficiency of Abrasive Belts in Wood Materials Sanding. Wood Res. 2014, 59, 835–842. [Google Scholar]
- Sogutlu, C. The Effect of the Feeding Direction and Feeding Speed of Planing on the Surface Roughness of Oriental Beech and Scotch Pine Woods. Wood Res. 2010, 55, 67–78. [Google Scholar]
- Piernik, M.; Pinkowski, G.; Krauss, A. Effect of Chip Thickness, Wood Cross-Sections, and Cutting Speed on Surface Roughness and Cutting Power during up-Milling of Beech Wood. BioRes 2023, 18, 6784–6801. [Google Scholar] [CrossRef]
- Aslan, S.; Coşkun, H.; Kılıç, M. The Effect of the Cutting Direction, Number of Blades and Grain Size of the Abrasives on Surface Roughness of Taurus Cedar (Cedrus libani A. Rich.) Woods. Build. Environ. 2008, 43, 696–701. [Google Scholar] [CrossRef]
- STN EN ISO 21920-2:2021; Geometrical Product Specifications (GPS)—Surface Texture: Profile—Part 2: Terms, Definitions and Surface Texture Parameters. International Organization for Standardization: Geneva, Switzerland, 2022.
- STN EN ISO 21920-3:2021; Geometrical Product Specifications (GPS)—Surface Texture: Profile—Part 3: Specification Operators. International Organization for Standardization: Geneva, Switzerland, 2022.
- Singh, A.P.; Anderson, C.R.; Warnes, J.M.; Matsumura, J. The Effect of Planing on the Microscopic Structure of Pinus Radiata Wood Cells in Relation to Penetration of PVA Glue. Holz als Roh- und Werkstoff 2002, 60, 333–341. [Google Scholar] [CrossRef]
- Kamke, F.A.; Lee, J.N. Adhesive Penetration in Wood—A Review. Wood Fiber Sci. 2007, 39, 205–220. [Google Scholar]
- Cota, H.; Dritan, A.; Habipi, B. The Influence of Machining Process on Wood Surface Roughness. Agric. Sci. 2017, 16, 7. [Google Scholar]
- Gurau, L. An Objective Method to Measure and Evaluate the Quality of Sanded Wood Surfaces. In Proceedings of the The Future of Quality Control for Wood & Wood Products, Edinburgh, UK, 4 July 2010. [Google Scholar]
- Duboust, N.; Ghadbeigi, H.; Pinna, C.; Ayvar-Soberanis, S.; Collis, A.; Scaife, R.; Kerrigan, K. An Optical Method for Measuring Surface Roughness of Machined Carbon Fibre Reinforced Plastic Composites. J. Compos. Mater. 2017, 51, 289–302. [Google Scholar] [CrossRef]
- Henke, M.; Lis, B.; Krystofiak, T. Evaluation of Surface Roughness Parameters of HDF for Finishing under Industrial Conditions. Materials 2022, 15, 6359. [Google Scholar] [CrossRef]
- Alshibli, K.; Alsaleh, M. Characterizing Surface Roughness and Shape of Sands Using Digital Microscopy. J. Comput. Civ. Eng. 2004, 18, 36–45. [Google Scholar] [CrossRef]
- Gurau, L.; Mansfield-Williams, H.; Irle, M. Separation of Processing Roughness from Anatomical Irregularities and Fuzziness to Evaluate the Effect of Grit Size on Sanded European Oak. For. Prod. J. 2007, 57, 110–116. [Google Scholar]
- Gurau, L.; Csiha, C.; Mansfield-Williams, H. Processing Roughness of Sanded Beech Surfaces. Eur. J. Wood Prod. 2015, 73, 395–398. [Google Scholar] [CrossRef]
- Gurau, L.; Mansfield-Williams, H.; Irle, M. The Influence of Wood Anatomy on Evaluating the Roughness of Sanded Solid Wood. J. Inst. Wood Sci. 2005, 17, 65–74. [Google Scholar] [CrossRef]
Disclaimer/Publisher’s Note: The statements, opinions and data contained in all publications are solely those of the individual author(s) and contributor(s) and not of MDPI and/or the editor(s). MDPI and/or the editor(s) disclaim responsibility for any injury to people or property resulting from any ideas, methods, instructions or products referred to in the content. |
© 2023 by the authors. Licensee MDPI, Basel, Switzerland. This article is an open access article distributed under the terms and conditions of the Creative Commons Attribution (CC BY) license (https://creativecommons.org/licenses/by/4.0/).