Article

Characterization of Chinese Tallow Invasion in the Southern United States

by
Mohammad M. Bataineh
1,*,
Jacob S. Fraser
2 and
Lauren S. Pile Knapp
2
1
USDA Forest Service, Southern Research Station 2500 Shreveport Hwy, Pineville, LA 71360, USA
2
USDA Forest Service, Northern Research Station, 202 Anheuser Busch Natural Resources Building, Columbia, MO 65211, USA
*
Author to whom correspondence should be addressed.
Forests 2024, 15(1), 202; https://doi.org/10.3390/f15010202
Submission received: 19 December 2023 / Revised: 15 January 2024 / Accepted: 16 January 2024 / Published: 19 January 2024
(This article belongs to the Topic Plant Invasion)

Abstract

:
Chinese tallow is a non-native invasive tree expanding in range and abundance throughout the southern United States. Several biogeographical studies mapping tallow distribution and examining key underlying environmental factors relied on the U.S. Forest Service Forest Inventory and Analysis (FIA) data, representing forestlands at scales of ~2400 ha. However, given that most invasive trees, like tallow, are cosmopolitan and dynamic in nature, FIA data fails to capture the extent and severity of the invasion especially outside areas classified as forestlands. To develop tallow maps that more adequately depict its distribution at finer spatial scales and to capture observations in non-forestlands, we combined verified citizen science observations with FIA data. Further, we described spatiotemporal patterns and compared citizen science to FIA and other previously published distribution maps. From our work, although tallow is prevalent in the south, Louisiana, Texas, and Mississippi were the most invaded states. Tallow was associated with flatwoods and prairie grasslands of the Gulf Coast. Annual extreme minimum temperatures of less than −12.2 °C (10 °F) represented the northern limit of naturalized tallow populations. Tallow’s northward and inland expansion was captured in citizen science and FIA data, indicating a tallow spread rate ranging from 5 to 20 km annually over the last decade. Systematic sampling, such as FIA, and citizen science data both have their own unique pitfalls. However, the use of citizen science data can complement invasive plant distribution mapping, especially when combined with data from established systematic monitoring networks. This approach provides for a more complete understanding of invasive tree extent and spatiotemporal dynamics across large landscapes.

1. Introduction

Chinese tallow [Triadica sebifera (L.) Small; Euphorbiaceae] is a non-native invasive tree rapidly expanding in range and abundance throughout the southeastern United States [1]. Tallow is native to China, Taiwan, and northern Vietnam with naturalized populations in Japan, India, Pakistan, Bangladesh, Sudan, Europe, Australia, Panama, and Peru [2,3,4]. In its native range, tallow is cultivated for a variety of uses including food, medicine, and industrial applications [5]. It was introduced in the Gulf Coastal Plain to establish local soap and oil industries and is currently favored by beekeepers as forage for honey production [5,6]. Earlier accounts of tallow spatial distribution and abundance indicate occurrence throughout the Gulf Coastal Plain and along the Atlantic Coast as far as North Carolina [7,8]. Three-, five-, and six-fold increments in tallow tree density were reported for Texas, Mississippi, and Louisiana, respectively, over an average period of 14 years [8]. An eight-fold increase in occupied area in southeast Texas was reported from the 1970s to the 1990s [7]. Tallow occurrence is associated with low-lying areas, especially along waterways and riparian zones, in prairies and forests of the Gulf Coastal Plain [7,9]. Tallow encroachment into uplands of the Upper Coastal Prairie of Texas occurred circa the 1970s [7]. In forested areas, tallow occurred more frequently within private ownerships and in recently disturbed or younger stands [9,10] and was less likely to occur in mature forest stands and plantations [11]. Northward expansion of tallow invasion range was predicted in relation to a warming climate [3,9,11], and the observed spread appears to at least partially support the general predicted expansion pattern [12]. The expansion of tallow’s current invasion range appears to be constrained by propagule supply and dispersal, and birds in particular are important dispersers [13,14], but perennial water sources may provide unbroken pathways for spread, especially when outlying populations are established [3].
Several factors aid in the current extensive distribution of tallow. The high fecundity of large seeds, coupled with relatively persistent soil seed banks, and the short time to maturity provide tallow with the propagule pressure needed to enhance establishment likelihood in recipient communities [1]. Sheer propagule pressure was suggested as one of the mechanisms allowing tallow to outcompete native trees [15]. Substantial recruitment potential into small-diameter tree sizes [7,8], however, indicates a lack of effective site filters on tallow establishment and early-regeneration processes. Rapid early-growth rates and the ability to establish itself across a wide variety of sites and soil conditions allow tallow to outcompete native vegetation [1,16,17]. Phenotypic plasticity, especially to shade, appears to provide tallow with an advantage over native trees in terms of survival and growth [17,18]. Tallow’s shorter lifespan and smaller sizes at maturity compared to fast-growing native tree species [16], however, may limit its persistence and dominance when recruitment of native trees is not limited or natives’ recruitment is facilitated through release treatments [7,15,16].
Although several biogeographical studies have mapped the distribution and examined key factors and mechanisms underlying the current tallow invasion [8,9,19,20,21], data for those studies were sourced from the U.S. Forest Service Forest Inventory and Analysis (FIA) program. FIA sampling plots represent forestlands at scales of ~2400 ha, not capturing observations in non-forestland such as urban settings and open lands, which can be important sources of propagule supply and dispersal for invasive trees. In some cases, FIA data were aggregated at county [9] or state levels [8] masking tallow’s presence and dynamics at management-relevant spatial scales. Citizen science data from a variety of platforms (e.g., iNaturalist and EDDMapS) can contribute to species distribution mapping and complement existing occurrence records even at lower identification quality [22,23]. In this study, we use citizen science data from two platforms, iNaturalist and EDDMapS, to: (1) provide a contemporary Chinese tallow distribution map, (2) describe ecological associations of tallow occurrence with ecological regions and climatic hardiness zones, (3) describe associated spatiotemporal occurrence patterns based on observational and systematic data, (4) compare measured compositional and structural conditions between invaded and non-invaded forestland plots, and (5) compare citizen science distribution maps to FIA-based maps and other maps and projections reported elsewhere.

2. Materials and Methods

2.1. Study Area

The study area encompassed all 13 southern states, from Virginia to Florida along the Atlantic Coast and from Florida to Texas along the Gulf of Mexico, including the northern tier of the southern states of Oklahoma, Arkansas, Tennessee, and Kentucky (Figure 1). The 13 southern states encompass a wide variety of habitats and ecosystems, including nine ecological provinces stretching from the Everglades through the Outer Coastal Plain and Southeastern Mixed Forest provinces to the Central Appalachian and Central Interior Forests, including the Lower Mississippi, Ouachita, Ozark, and Prairie Parkland provinces [24]. This 13-state area represents the current maximum invasive extent of tallow. The population of people within the study area exceeded 112 million by 1 April 2020 [25]. Climate varies with latitude and topography but is mainly humid temperate to humid subtropical, with tropical influence at the southern extent. The annual mean temperature range is from 13 °C to 21 °C [26]. The annual mean minimum temperature range is from 0 °C at the northern extent to 21 °C along the southern coast lines [27]. The annual mean maximum temperatures range from 16 °C to 32 °C [27]. The region receives from 102 to over 178 cm of precipitation annually [27]. The annual frost-free period is 180–315 days, spanning 6 of the 13 USDA plant hardiness zones [28]. Low-lying, flat areas stretch from the Coastal Plains poleward, gradating into gently rolling topography ranging in elevation from 300 to 400 m above sea level.

2.2. Data Sources

Data from two online citizen science platforms were downloaded. Data reflected observations collected and compiled through these platforms as of 1 May 2023. The two citizen science data platforms were iNaturalist and the Early Detection and Distribution Mapping System (EDDMapS). iNaturalist began in 2008 as a final master’s project developed by graduate students at UC Berkeley. EDDMapS was established in 2005 by the Center for Invasive Species and Ecosystem Health at the University of Georgia. iNaturalist is an online social network connecting people to nature with the aim of advancing and informing biodiversity and conservation science. iNaturalist provides a consensus-based organism identification and recording tool with the aid of image recognition technology. EDDMapS is an online mapping and tracking system designed to simplify invasive and certain native pest species recordings without the aid of a Geographic Information System. EDDMapS is more focused on invasive species, and the platform aggregates invasive species data from other sources, such as herbaria records, in addition to iNaturalist.
Only verified observations from both platforms were used. The iNaturalist consensus-based verification characterizes observations as “Research Grade” when two or more observers agree on a species-level or lower taxon. The iNaturalist verifiable observations must have a date, a photo, and a location to qualify as research grade status; otherwise, observations are labeled “Casual”. EDDMapS observations are reviewed and verified by local and state verifiers rather than social network members or consensus-based verification. iNaturalist had 13,008 verified tallow observations, whereas EDDMapS had 18,917 verified observations. EDDMapS included polygon-delineated observations, mainly associated with the U.S. Forest Service National Forest System. To merge and maintain consistency among datasets, polygon records were converted to points at the centroid of each polygon. For EDDMapS data, observations without a date, expert verification, or positive detection status were excluded from the verified records. EDDMapS observations with high uncertainty in recorded date (e.g., within 183 days) were also excluded. EDDMapS duplicate records (i.e., observations imported from iNaturalist) were also excluded. The subset of verified observations encompassed within the 13 southern states was used as the verified and compiled dataset, with a total of 27,540 records.
FIA data for the most recent inventories for each of the 13 southern states were downloaded using the EVALIDator 2.1.0 application [29]. State-level retrievals for forestland, at least 10% tree canopy cover and a minimum area of 0.4 ha (one acre), were selected. Number of live trees (at least 2.54 cm in diameter) and seedlings (less than 2.54 cm in diameter) was used as the tallow presence metric. The FIA records were queried for living tallow trees and seedlings by county for each of the 13 states to create county-level maps, a total of 243 counties. For the FIA plot-level observations, state-level raw FIA data in comma-delimited tables were downloaded from FIA DataMart 2.0 [30]. After downloading, tallow cover was queried from the raw FIA data via the package rFIA (v1.0.0) in R v4.3.1 (R Foundation for Statistical Computing, Vienna, Austria) [31]. The tallow cover proportion, regardless of height, on each of the four FIA subplots was averaged to obtain the FIA plot-level cover estimates used in mapping. The rFIA package was used to calculate plot-level forest structural (basal area, stem density), species composition (Shannon’s diversity index, Shannon’s equitability index, and species richness), annual removals, and annual mortality metrics. The plots were filtered to only include the most recent inventory cycle across all states, and plots with new detections of tallow were assigned to the “invaded” category. Non-invaded plots were the remaining forested plots from the same time-period, and the FIA plot data spanned the period from 2001 to 2022 across the 13 states.

2.3. Analytical Approach

Spatially explicit ecosystem classification data from two sources were used to provide the ecological context for tallow invasion patterns. The Ecoregions of the Conterminous United States and the National Hierarchical Framework of Ecological Units were used as the two ecosystem classification sources [24,32]. Both classifications delineate ecological units based on similarities in physiography, climate, edaphic factors, and potential natural vegetation and provide a spatial framework of nested hierarchies from continental to subregional scales. Level III and IV hierarchies of the Ecoregions classification [32] and Sections and Subsections of Ecological Units classification [24] were used. These hierarchical levels provide mapping of ecological units at regional to subregional scales and use similar factors in the recognition of variability among ecological units.
As minimum temperature is cited as a key climatic constraint for tallow spread and distribution [3], our contemporary tallow distribution was overlaid on the 2012 USDA plant hardiness zone map [33]. Plant hardiness zones represent geographical regions with relatively homogeneous mean annual minimum winter temperature in 2.8 °C (5 °F) half zones [33]. Hardiness zones were mapped by interpolating the mean minimum daily temperature of the coldest month for the period 1976–2005, considering the effect of elevation and air mass movement on extreme daily minimum temperatures [33].
To assess spatiotemporal patterns of tallow invasion, observation dates were used to map tallow spatial trends over time. Although observation dates do not necessarily reflect effective tallow establishment dates nor do they faithfully reflect tallow’s range expansion, observation dates provide an overview of the timing during which tallow was observed and recorded by citizen scientists. The earliest EDDMapS tallow record was reported on 6 May 1991, with the following observations being recorded on 6 September 1995. These early records were compiled by EDDMapS from the Florida Exotic Pest Plant Council Database. The earliest records were reported for Florida, followed by Louisiana, in 1999 and Texas in 2002. iNaturalist’s earliest tallow record was reported on 22 May 2004 in Texas, with observations made in the same year in Florida. Similarly, the tallow FIA plot observation spatial trends were mapped using the inventory year, regardless of the FIA inventory cycle.
To compare forest conditions between plots invaded by tallow and non-invaded plots, we used the Wilcoxon rank sum test in the base stats package using R v4.3.1 (R Foundation for Statistical Computing, Vienna, Austria) to test for statistically significant differences in the medians of forest condition metrics between groups [34].
Overlay analysis, point pattern analysis, and spatial joins were all conducted in ArcGIS Pro 3.1.2 (Esri Inc., Redlands, CA, USA). The mean center tool from the spatial statistics toolbar was used to identify the geographic centers of tallow observations. Tallow observations were compiled cumulatively by year, and the mean center was calculated at each time step to identify spatial shifts in the mean center over time. To compare the citizen science distribution maps to the FIA-based maps, heat map symbology was used in overlays of tallow citizen science observations with FIA-based maps. Merged FIA plot-level data and citizen science observations were aggregated into polygon bins to provide an overall, pooled data sources, tallow distribution map.

3. Results

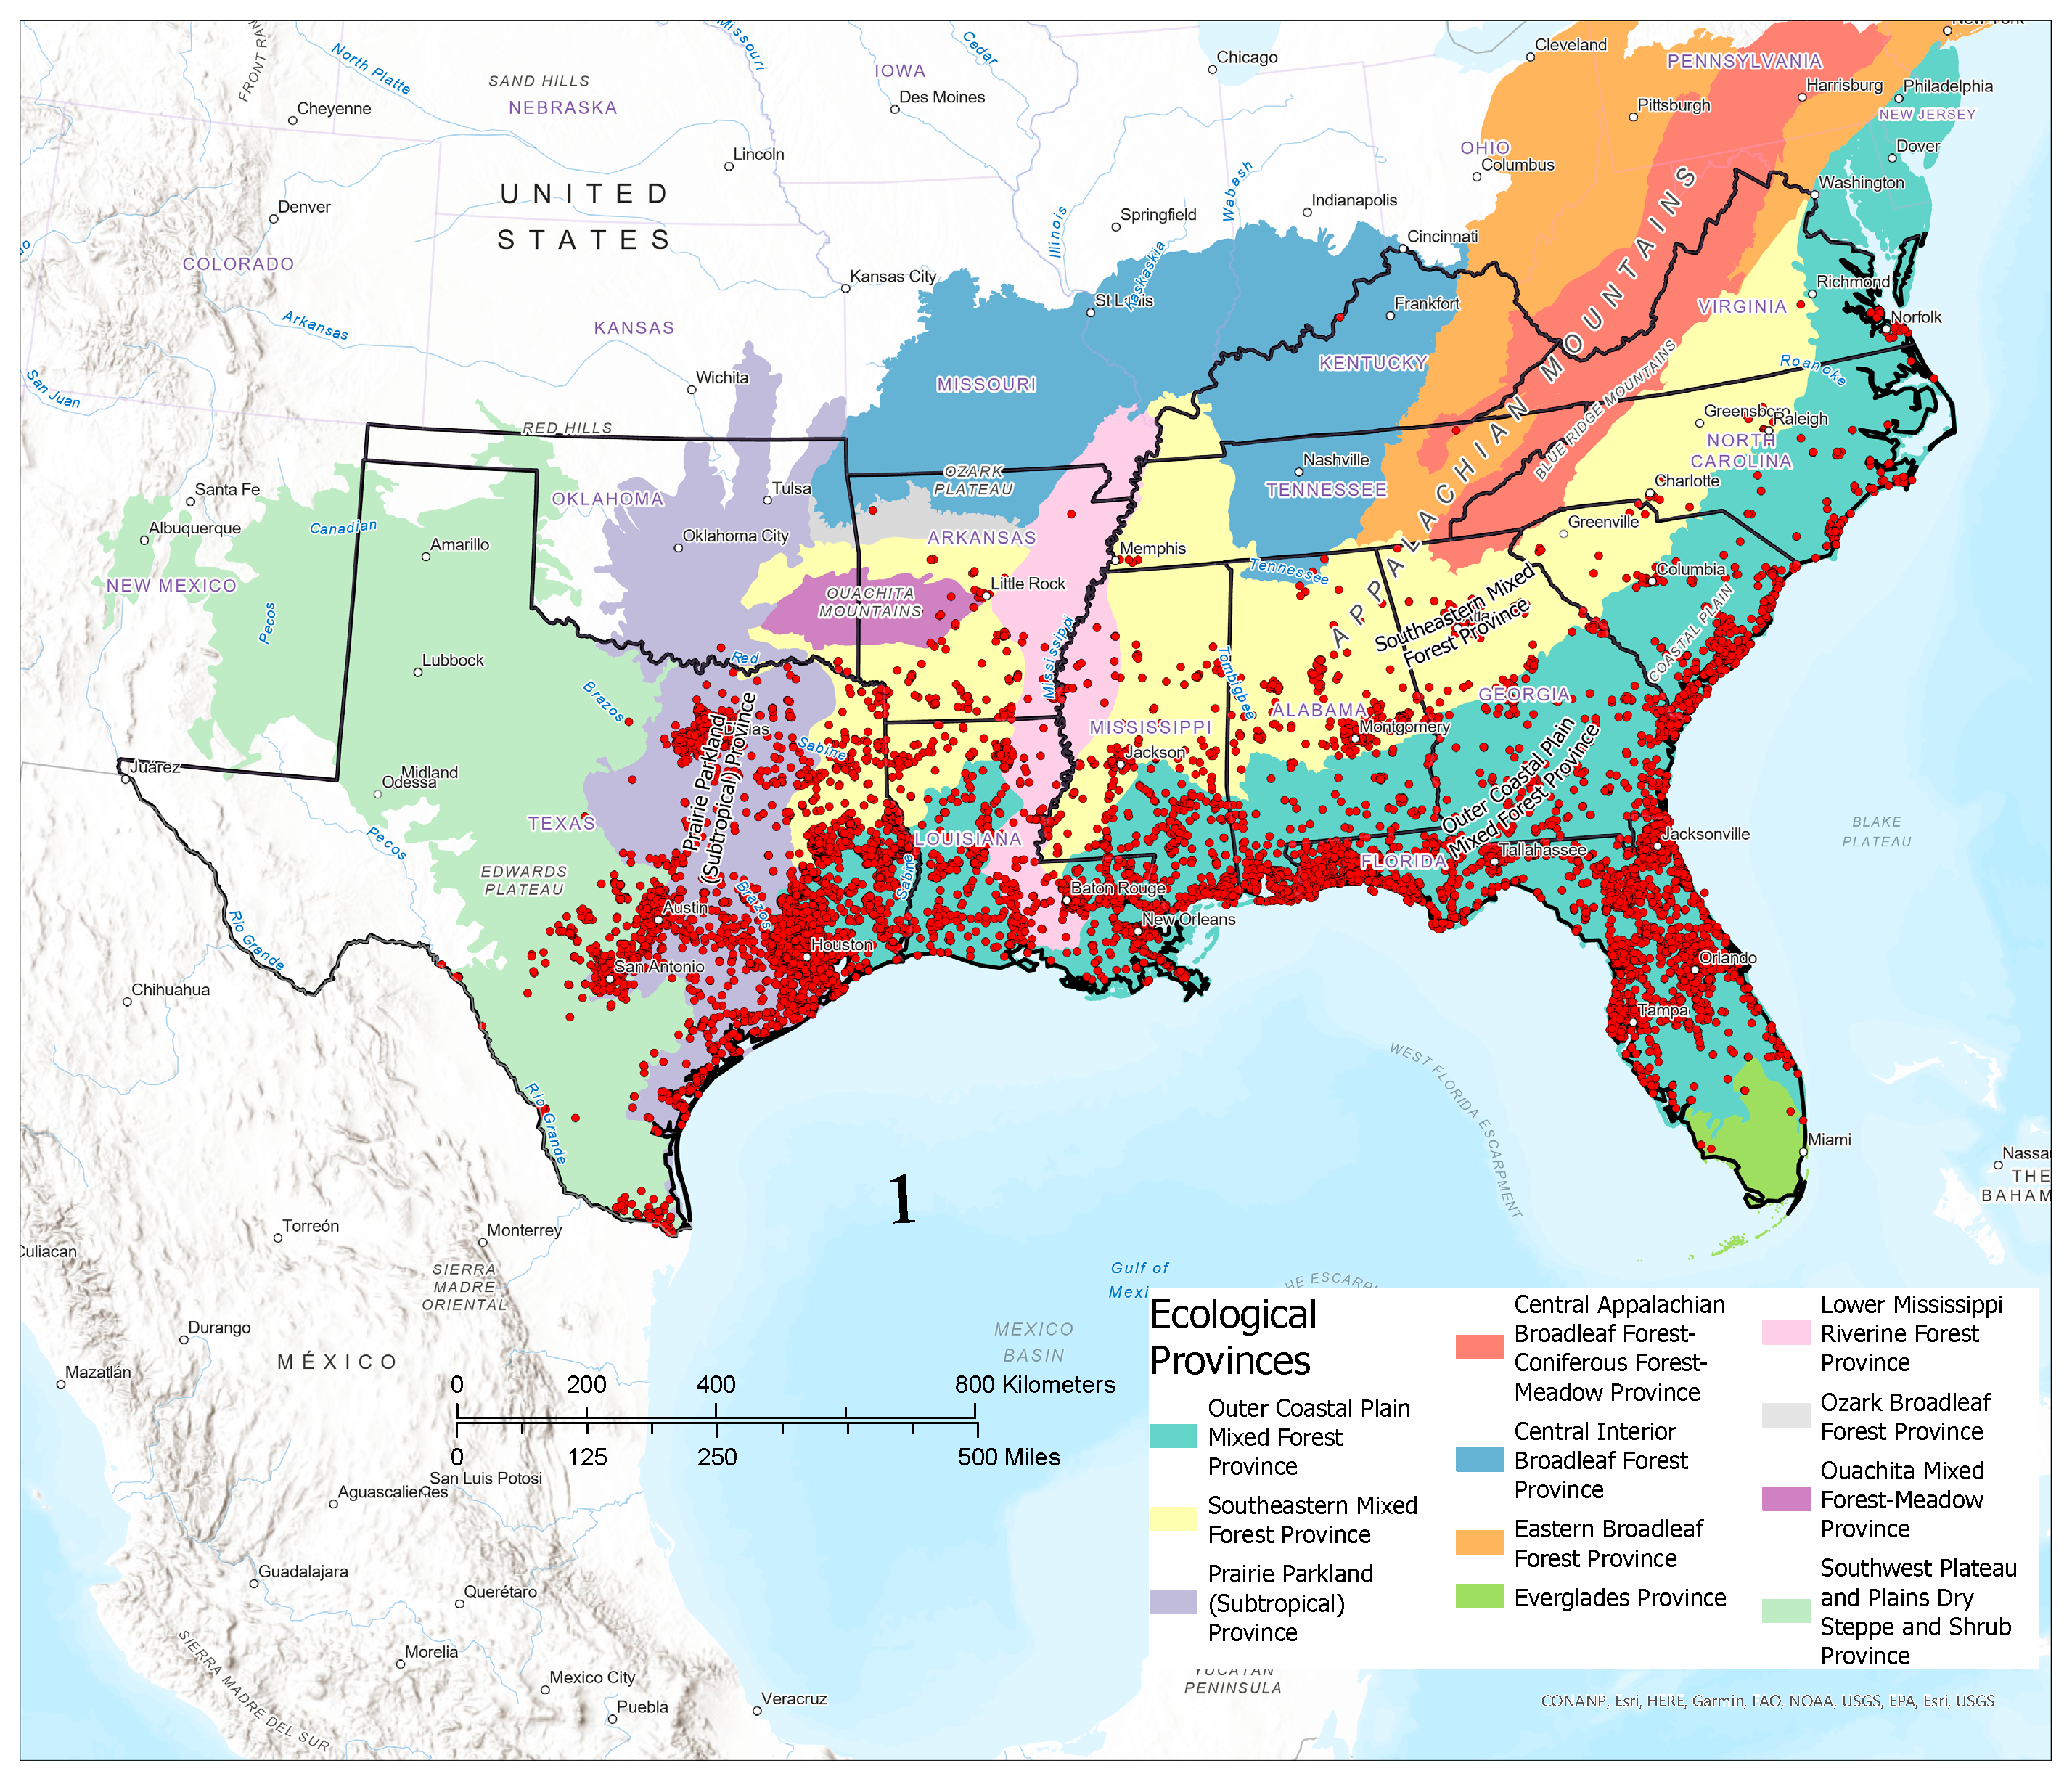
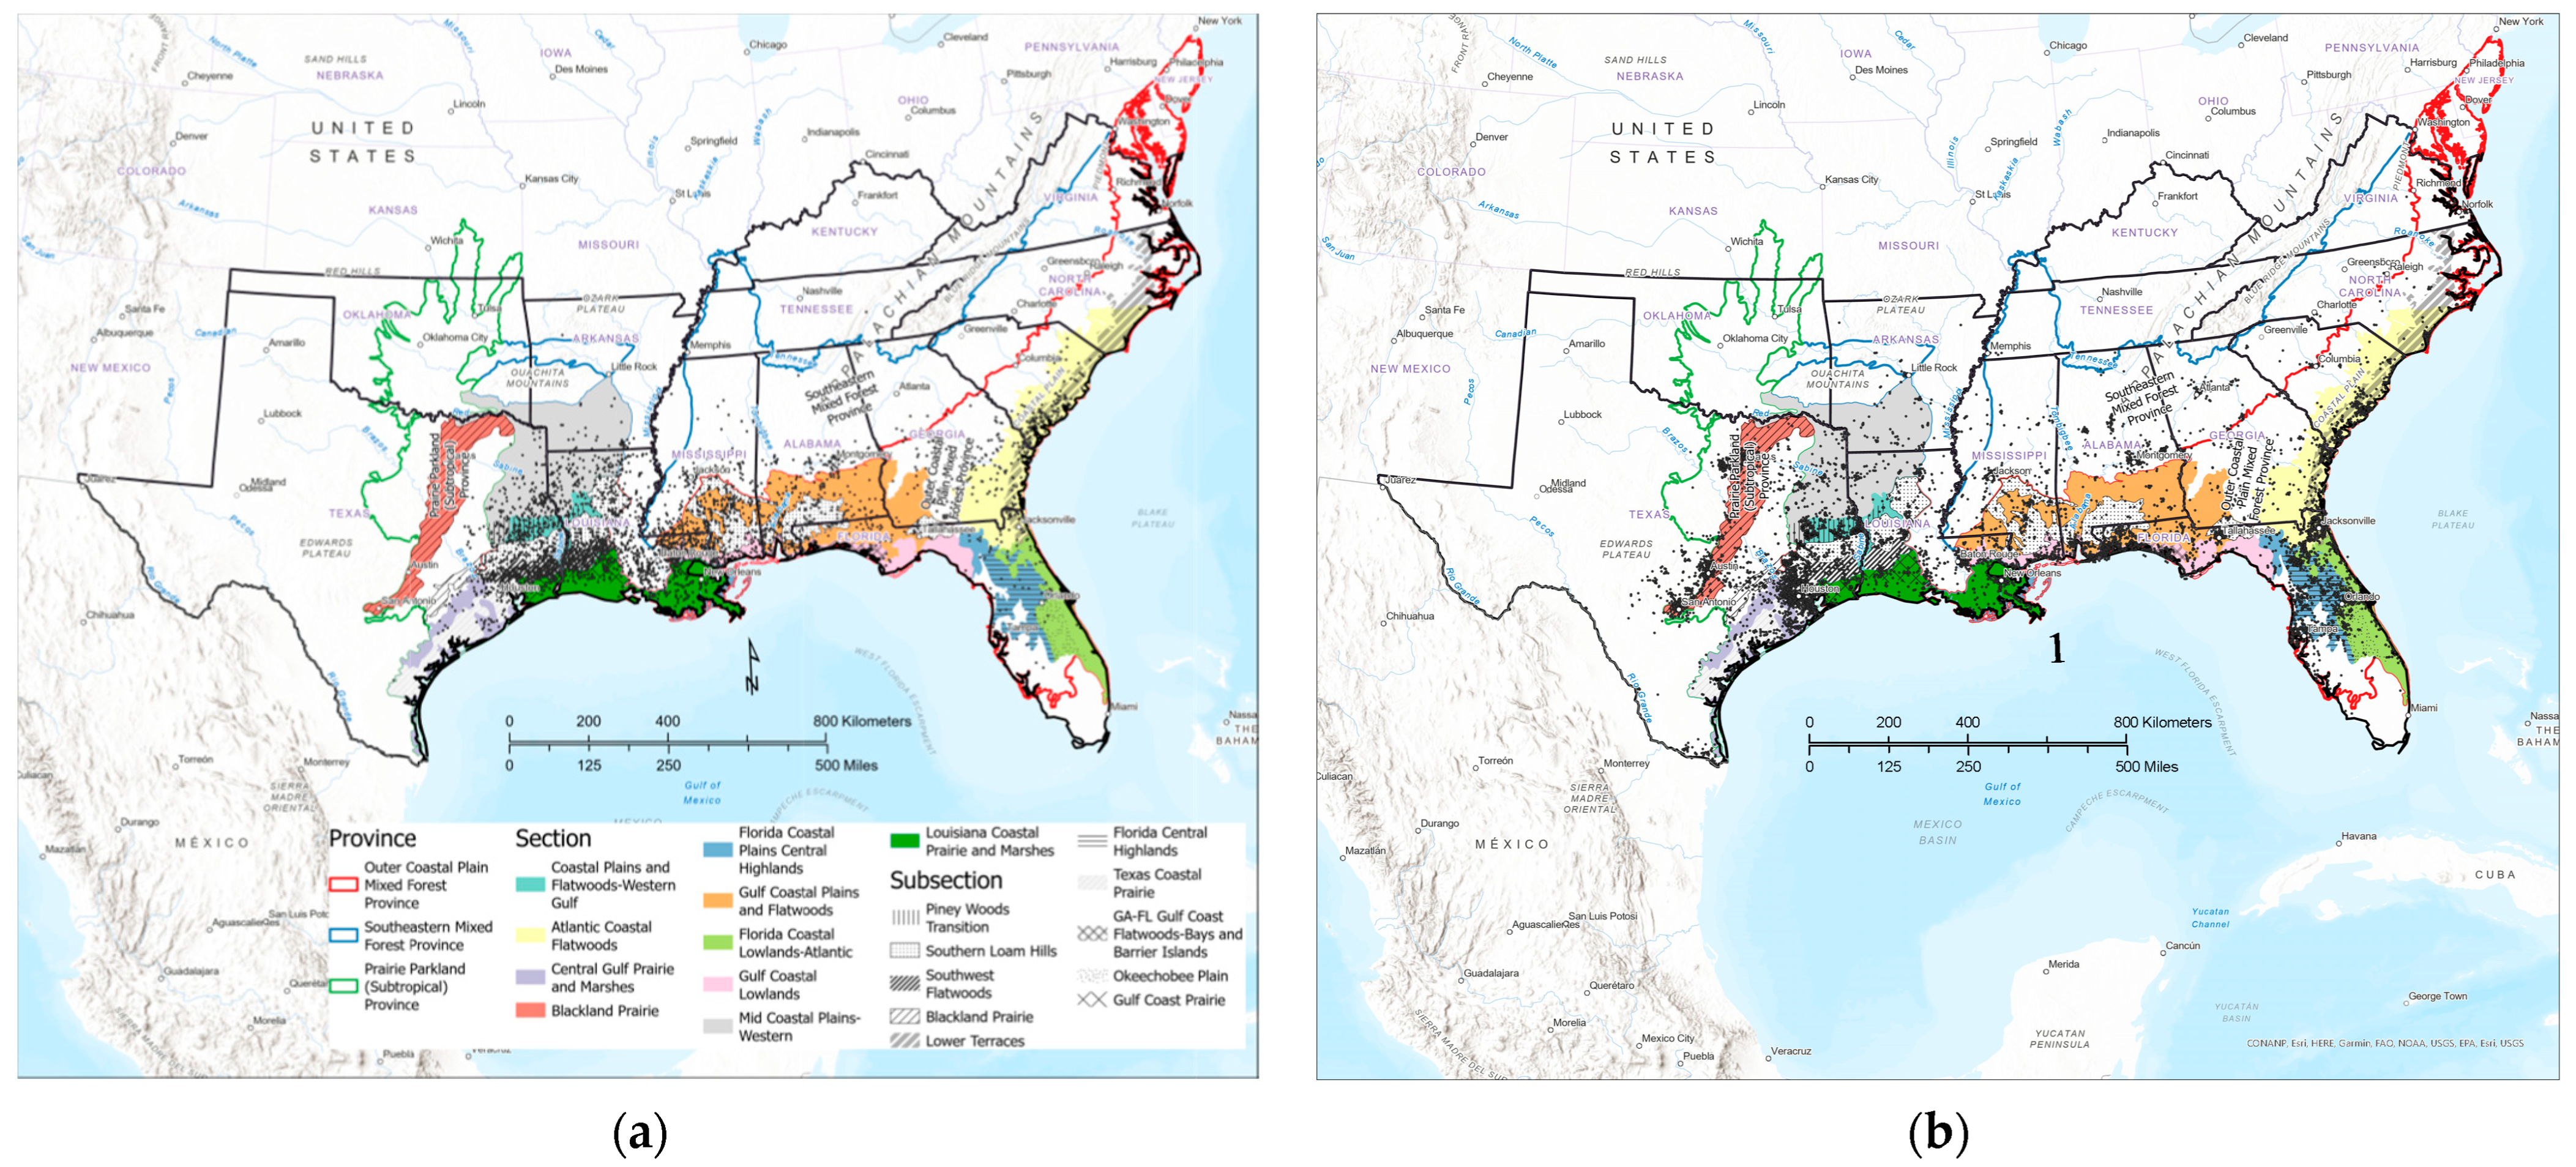
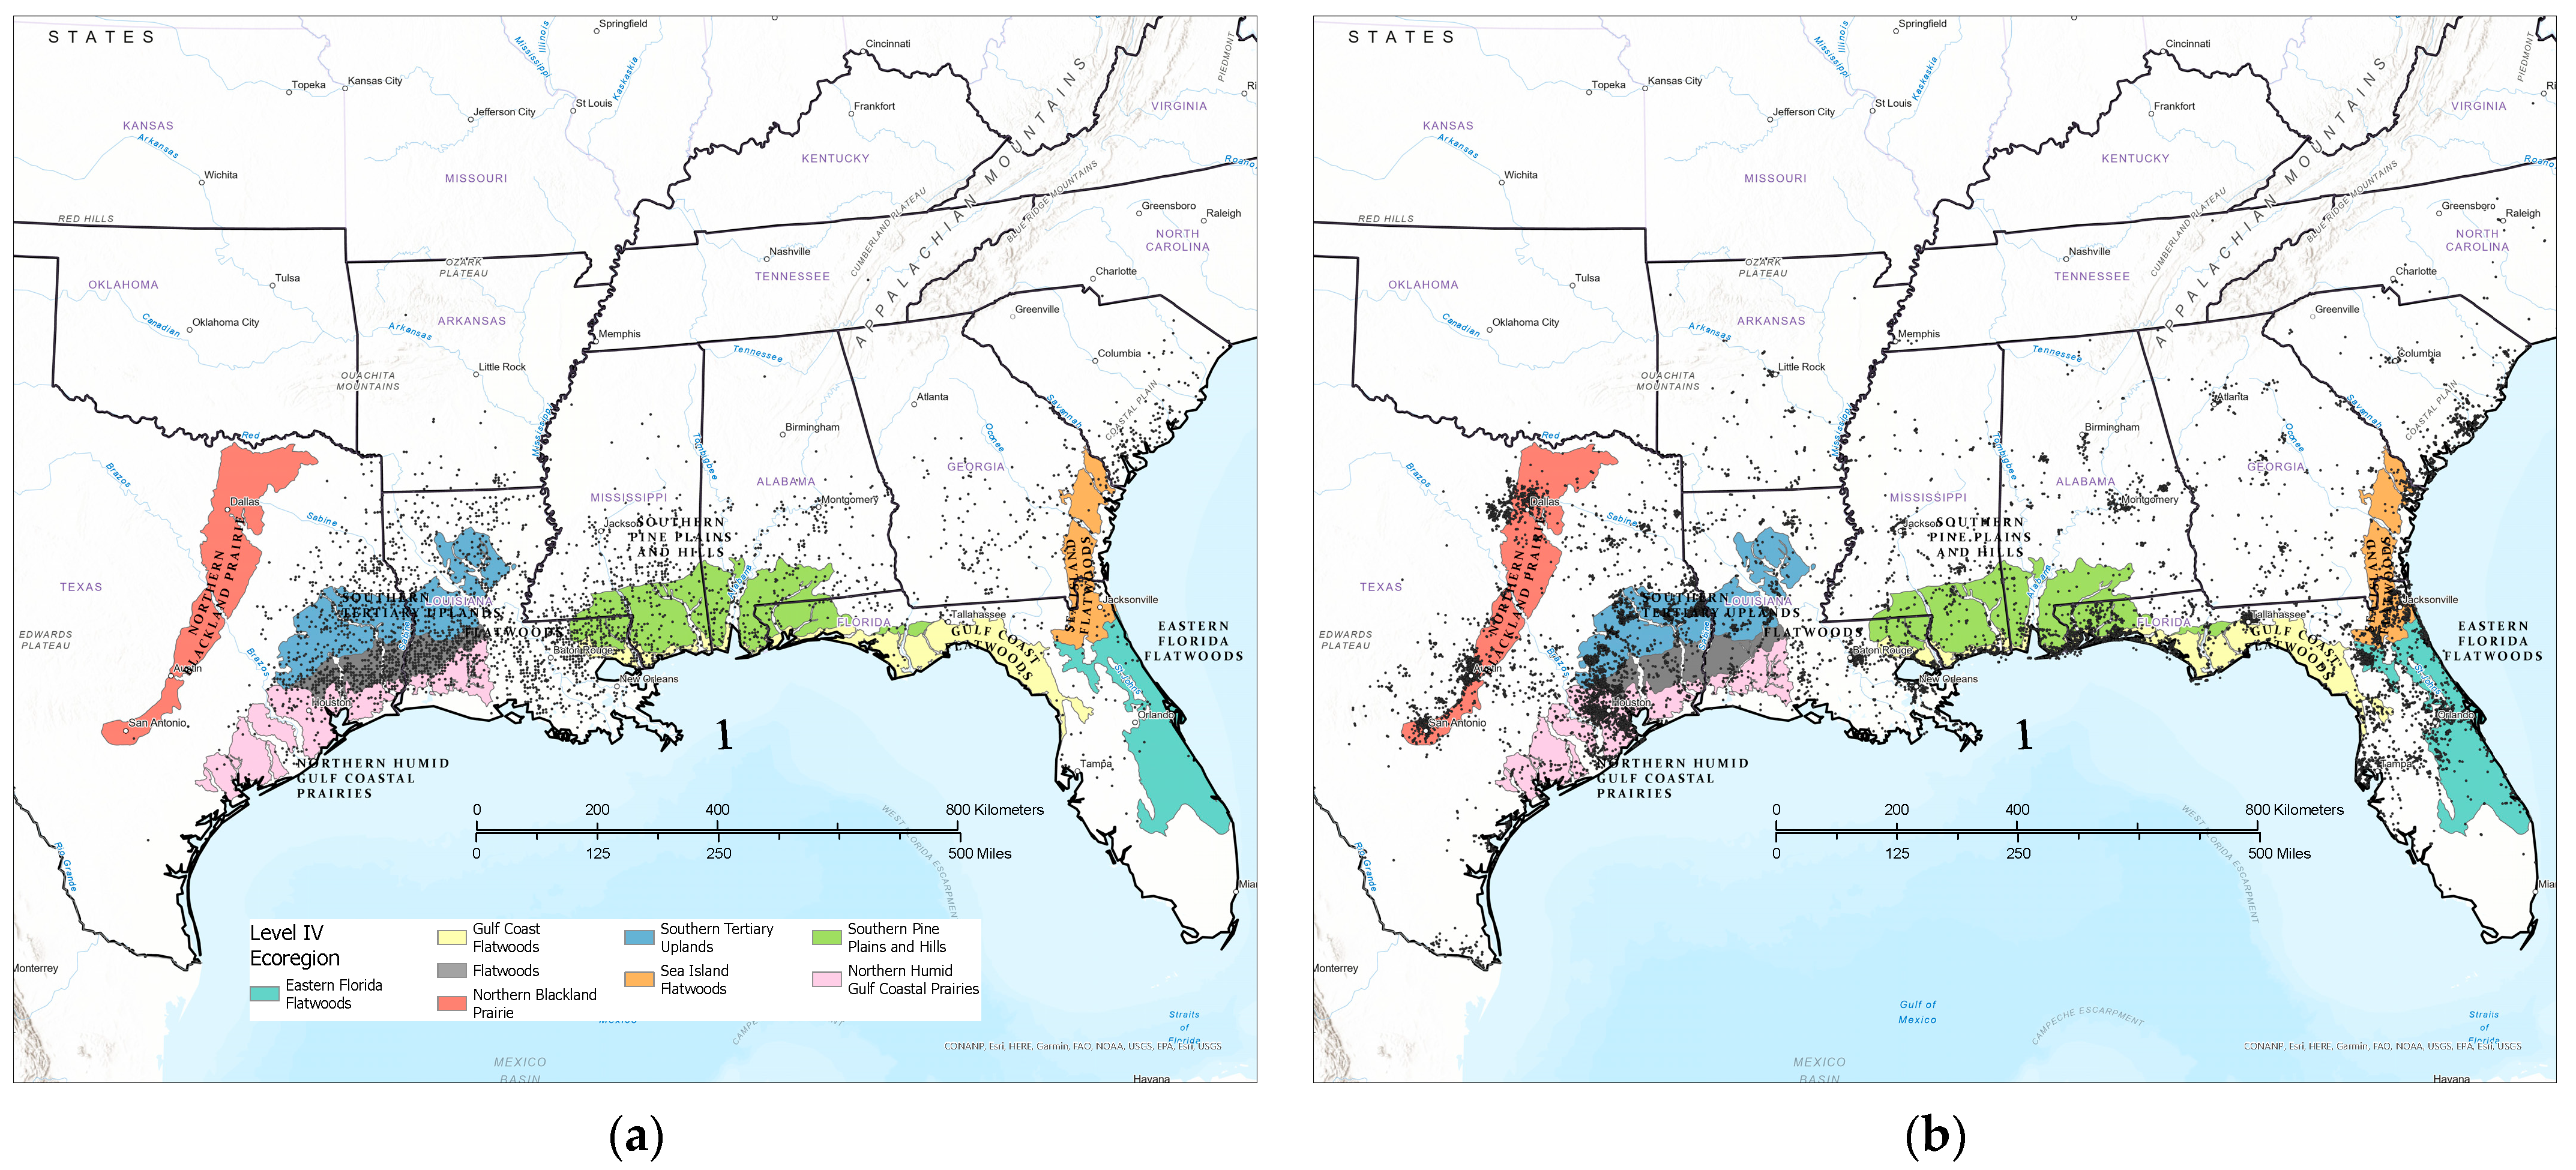
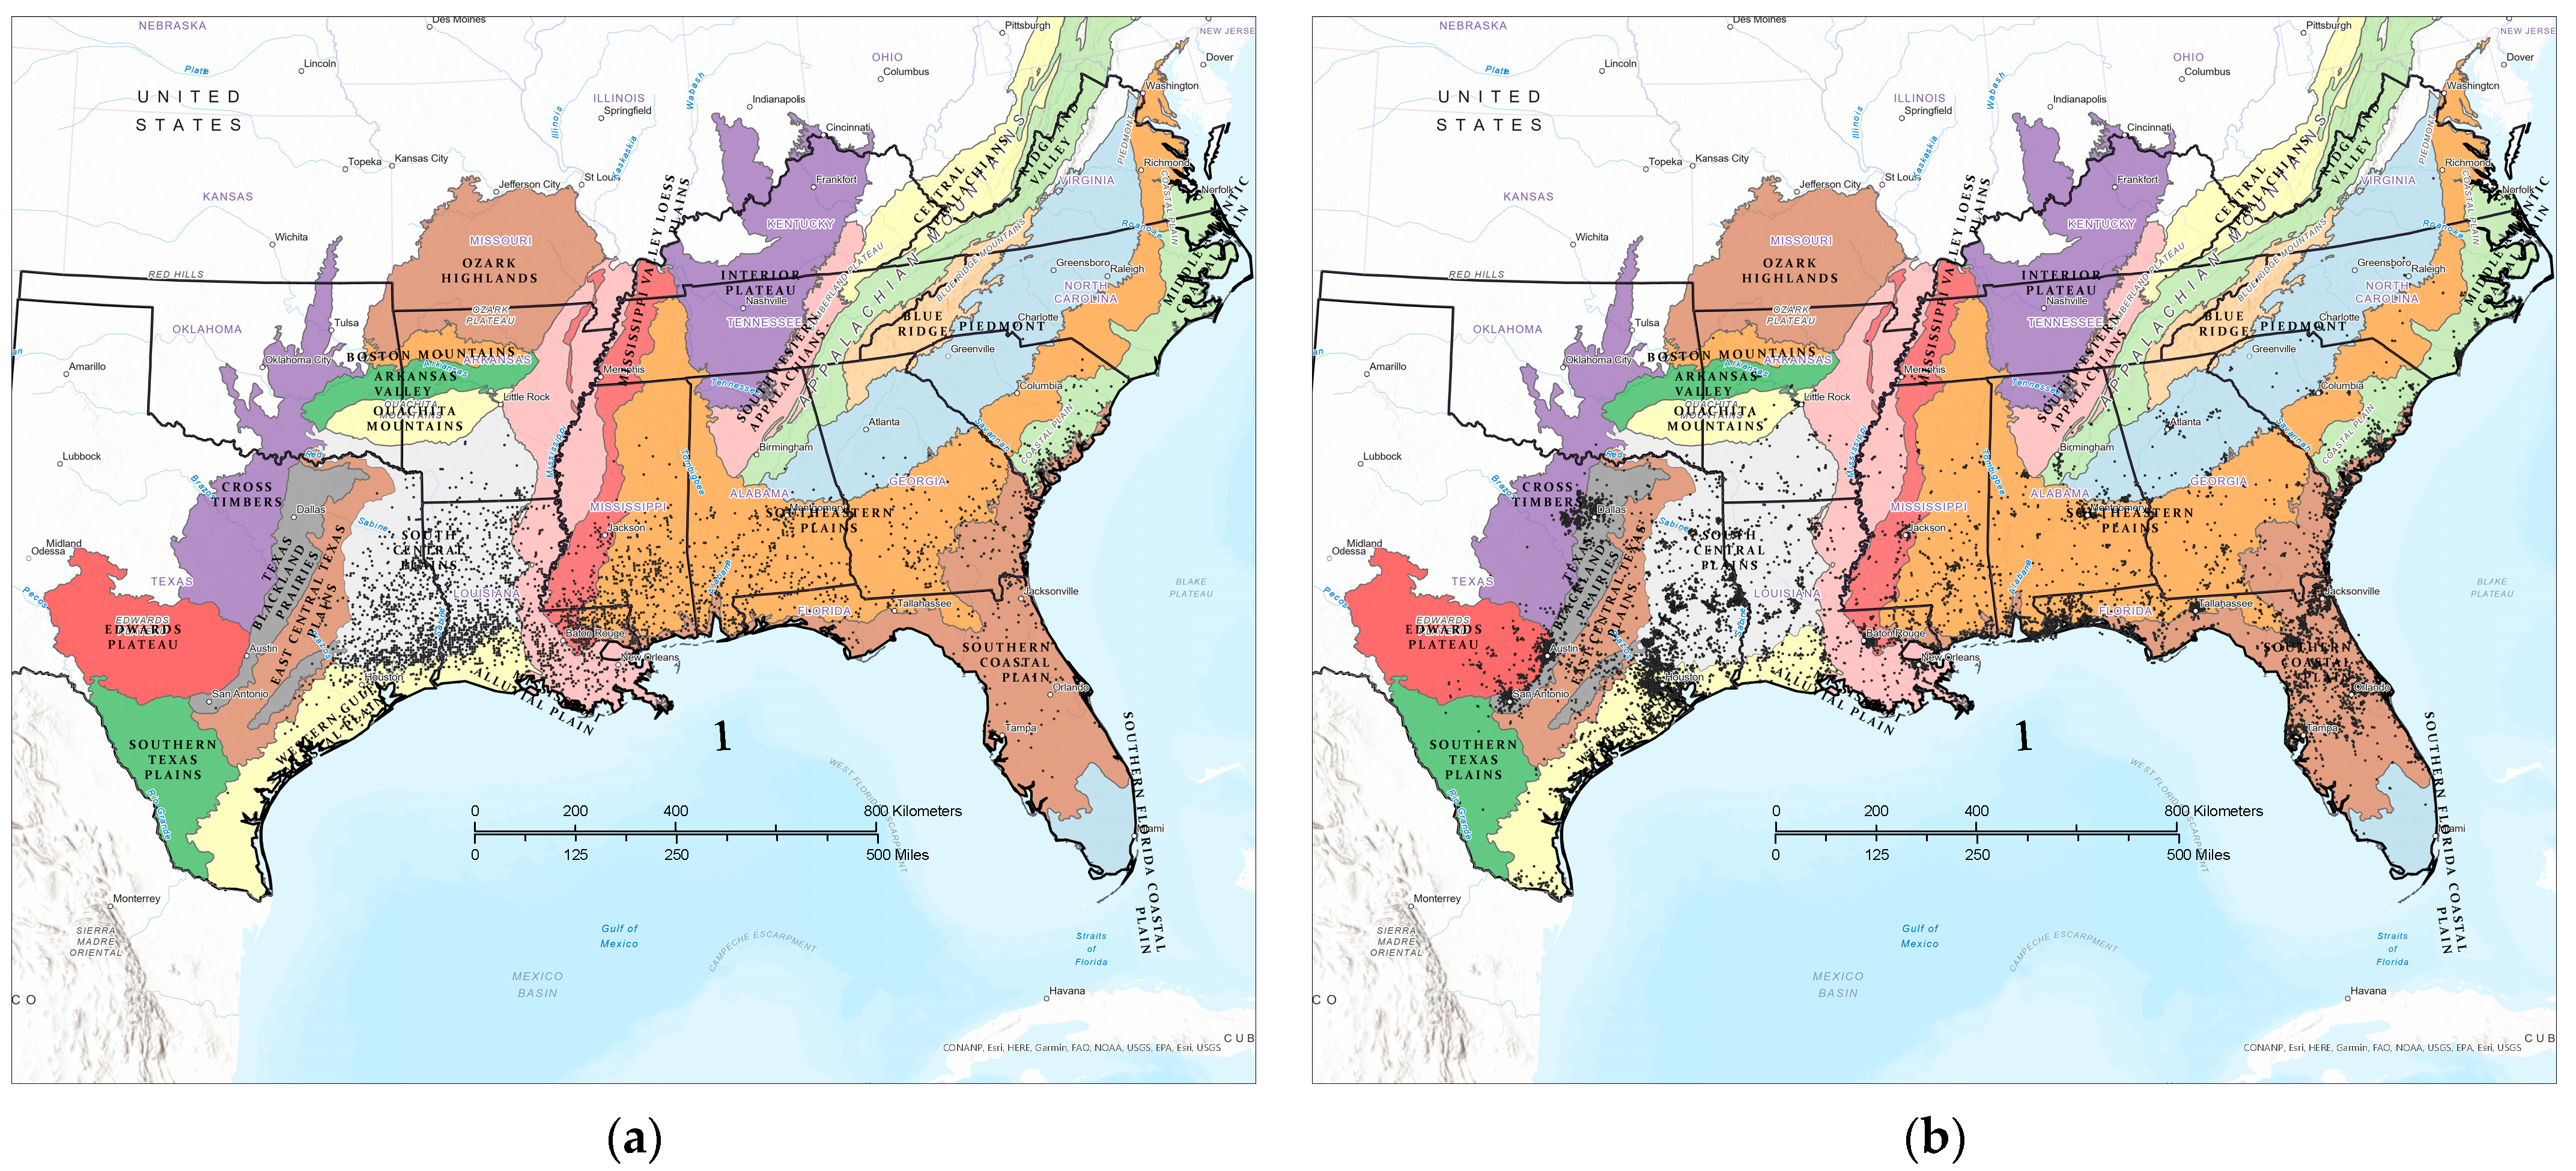
3.1. Contemporary Tallow Distribution by Political Boundary and Ecological Province

Verified citizen science data from two platforms, iNaturalist and EDDMapS, were used to provide a contemporary Chinese tallow distribution map (Figure 1). Based on this map, tallow was most frequent in Texas, followed by Florida and Louisiana, with these three states accounting for 87% of the total verified observations. Harris County, TX, had the highest number of verified citizen science observations, followed by Okaloosa County, FL, Santa Rosa County, FL, Trinity County, TX, Angelina County, TX, and Sabine County, TX. These counties represented 30% of the total verified citizen science observations from 1991 to 2023.
The Outer Coastal Plain Mixed Forest Province of the National Hierarchical Framework of Ecological Units [24] contained the majority of tallow observations (Table 1 and Figure 2). Most FIA plot observations (96%) were within forested provinces, whereas 22% of the citizen science observations were within prairie and steppe provinces, highlighting the forestland inventory focus of FIA.
Within the Outer Coastal Plain Mixed Forest Province, the Coastal Plains and Flatwoods-Western Gulf Section had the highest number of tallow observations, regardless of data source (29% and 21% for FIA and citizen science, respectively). The Gulf Coastal Plains and Flatwoods Section and the Louisiana Coastal Prairie and Marshes Section combined contained 27% of the FIA observations but only 8% of the citizen science observations (Figure 2). The Atlantic Coastal Flatwoods had 7% and 10% of the FIA plot and citizen science observations, respectively. The Florida Coastal Lowlands-Atlantic Section had 1% of the FIA and 8% of the citizen science observations. The Central Gulf Prairie and Marshes Section had 3% of the FIA and 7% of the citizen science observations.
Within the Coastal Plains and Flatwoods-Western Gulf Section, the Piney Woods Transition Subsection had 4% and 10% of the FIA plot and citizen science observations, respectively (Figure 2). The Southwest Flatwoods Subsection had 16% of the FIA and 6% of the citizen science total observations. The Southern Loam Hills Subsection of the Coastal Plains and Flatwoods-Western Gulf and the Gulf Coastal Plains and Flatwoods Sections had 15% of the FIA but 8% of the citizen science observations. While 6% of the total verified citizen science observations were within the Blackland Prairie Subsection, only ten FIA plots had tallow within this subsection. The Gulf Coast Prairie Subsection of the Louisiana Coastal Prairie and Marshes Section contained 6% of the FIA plot and 1% of the citizen science observations.
Using the Ecoregions of the Conterminous United States classification [32], 91% of the total verified citizen science observations were within seven Level III Ecoregions (Figure 3). On the other hand, 90% of the FIA plot observations were within five of the seven Level III Ecoregions containing the majority of citizen science observations. The Texas Blackland Prairies and Edwards Plateau had few to no FIA plot observations, respectively (Figure 3a). The Southern Coastal Plain and South Central Plains ecoregions had the most frequent citizen science tallow observations with 35% and 25% of the total, respectively (Figure 3b). For FIA plots, the Southern Coastal Plain and South Central Plains ecoregions had 24% and 40% of the total observations, respectively. At Level IV of the Ecoregions hierarchy, 55% and 54% of the total observations for FIA and citizen science sources, respectively, were within six ecoregions (Figure 4). Flatwoods, Southern Tertiary Uplands, and Southern Pine Plains and Hills had the highest number of FIA plot observations (Figure 4a). The Southern Tertiary Uplands, Eastern Florida Flatwoods, and Northern Humid Gulf Coastal Prairies had the highest number of citizen science observations (Figure 4b).

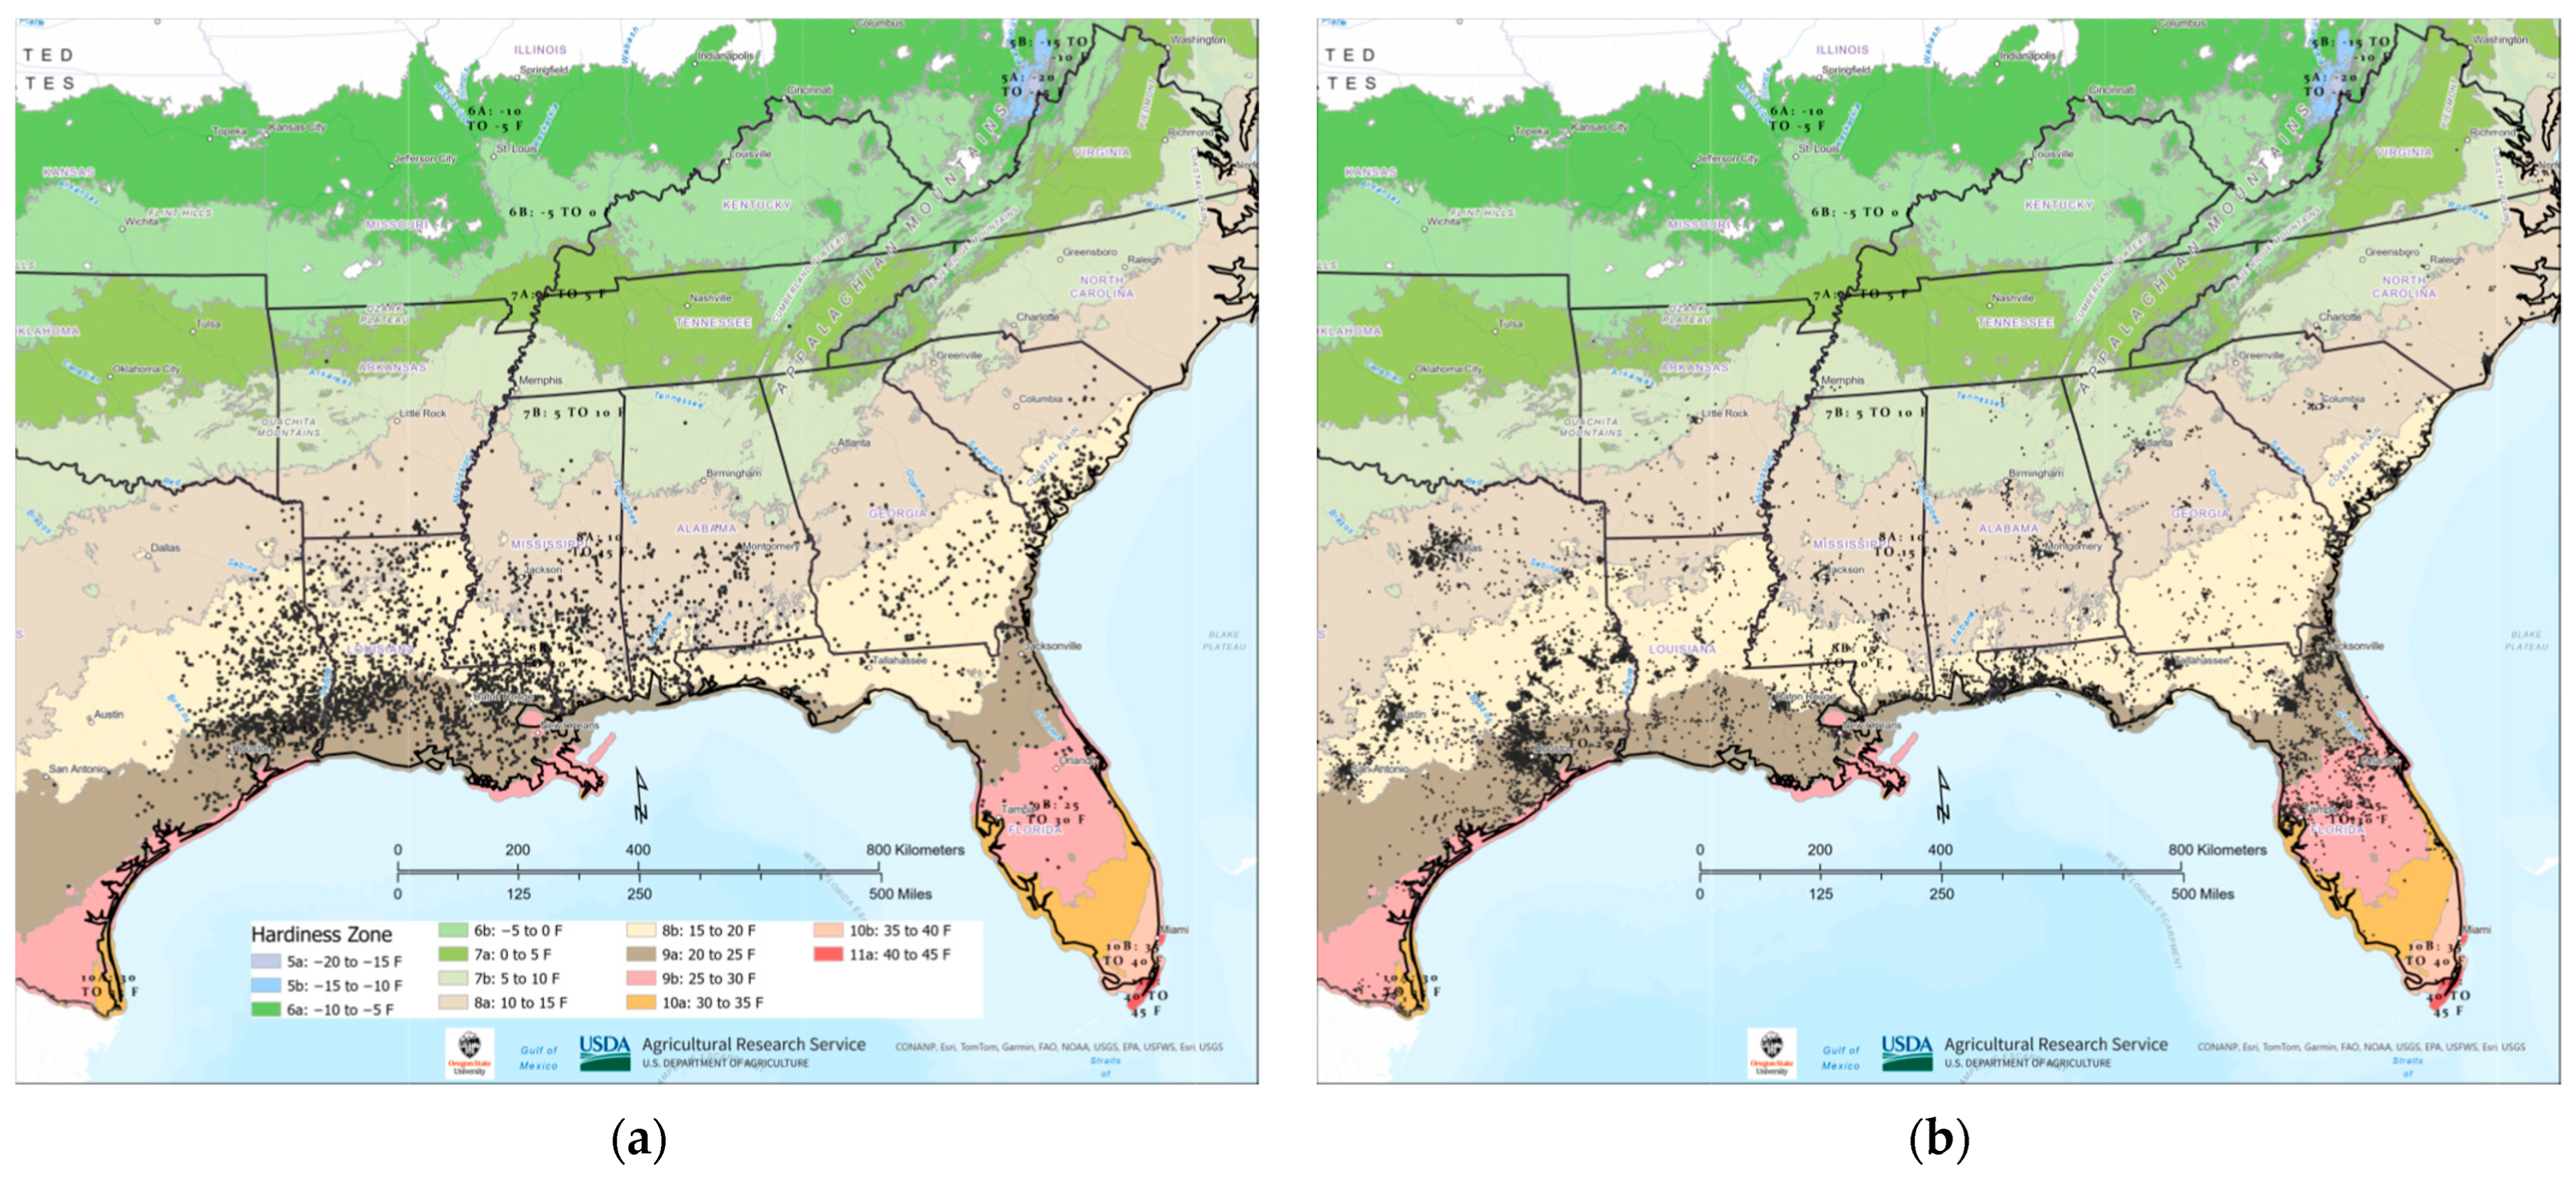
3.2. Tallow Distribution within Plant Hardiness Zones

The USDA plant hardiness zones 8a, 8b, and 9a encompassed 99% and 92% of the total tallow observations for the FIA plot and citizen science observations, respectively (Figure 5). These three hardiness zones represent annual extreme minimum temperatures ranging from −12.2 °C (10 °F) to −3.9 °C (25 °F) over a 30-year period from 1976 to 2005 [33]. Hardiness zone 7b represented the northern limit of naturalized populations of tallow, with few observations reported in zones 7a, 6a, and 6b.

3.3. Structural and Compositional Characteristics of Tallow-Invaded Forestlands

Based on the FIA data, in the 13-state region, there were 1225 newly invaded plots and 12,018 non-invaded plots included in the analysis. Comparisons between invaded and non-invaded plots showed that there was significantly lower basal area and Shannon’s diversity index and significantly higher mean annual mortality and mean annual removals in the invaded plots (Table 2).

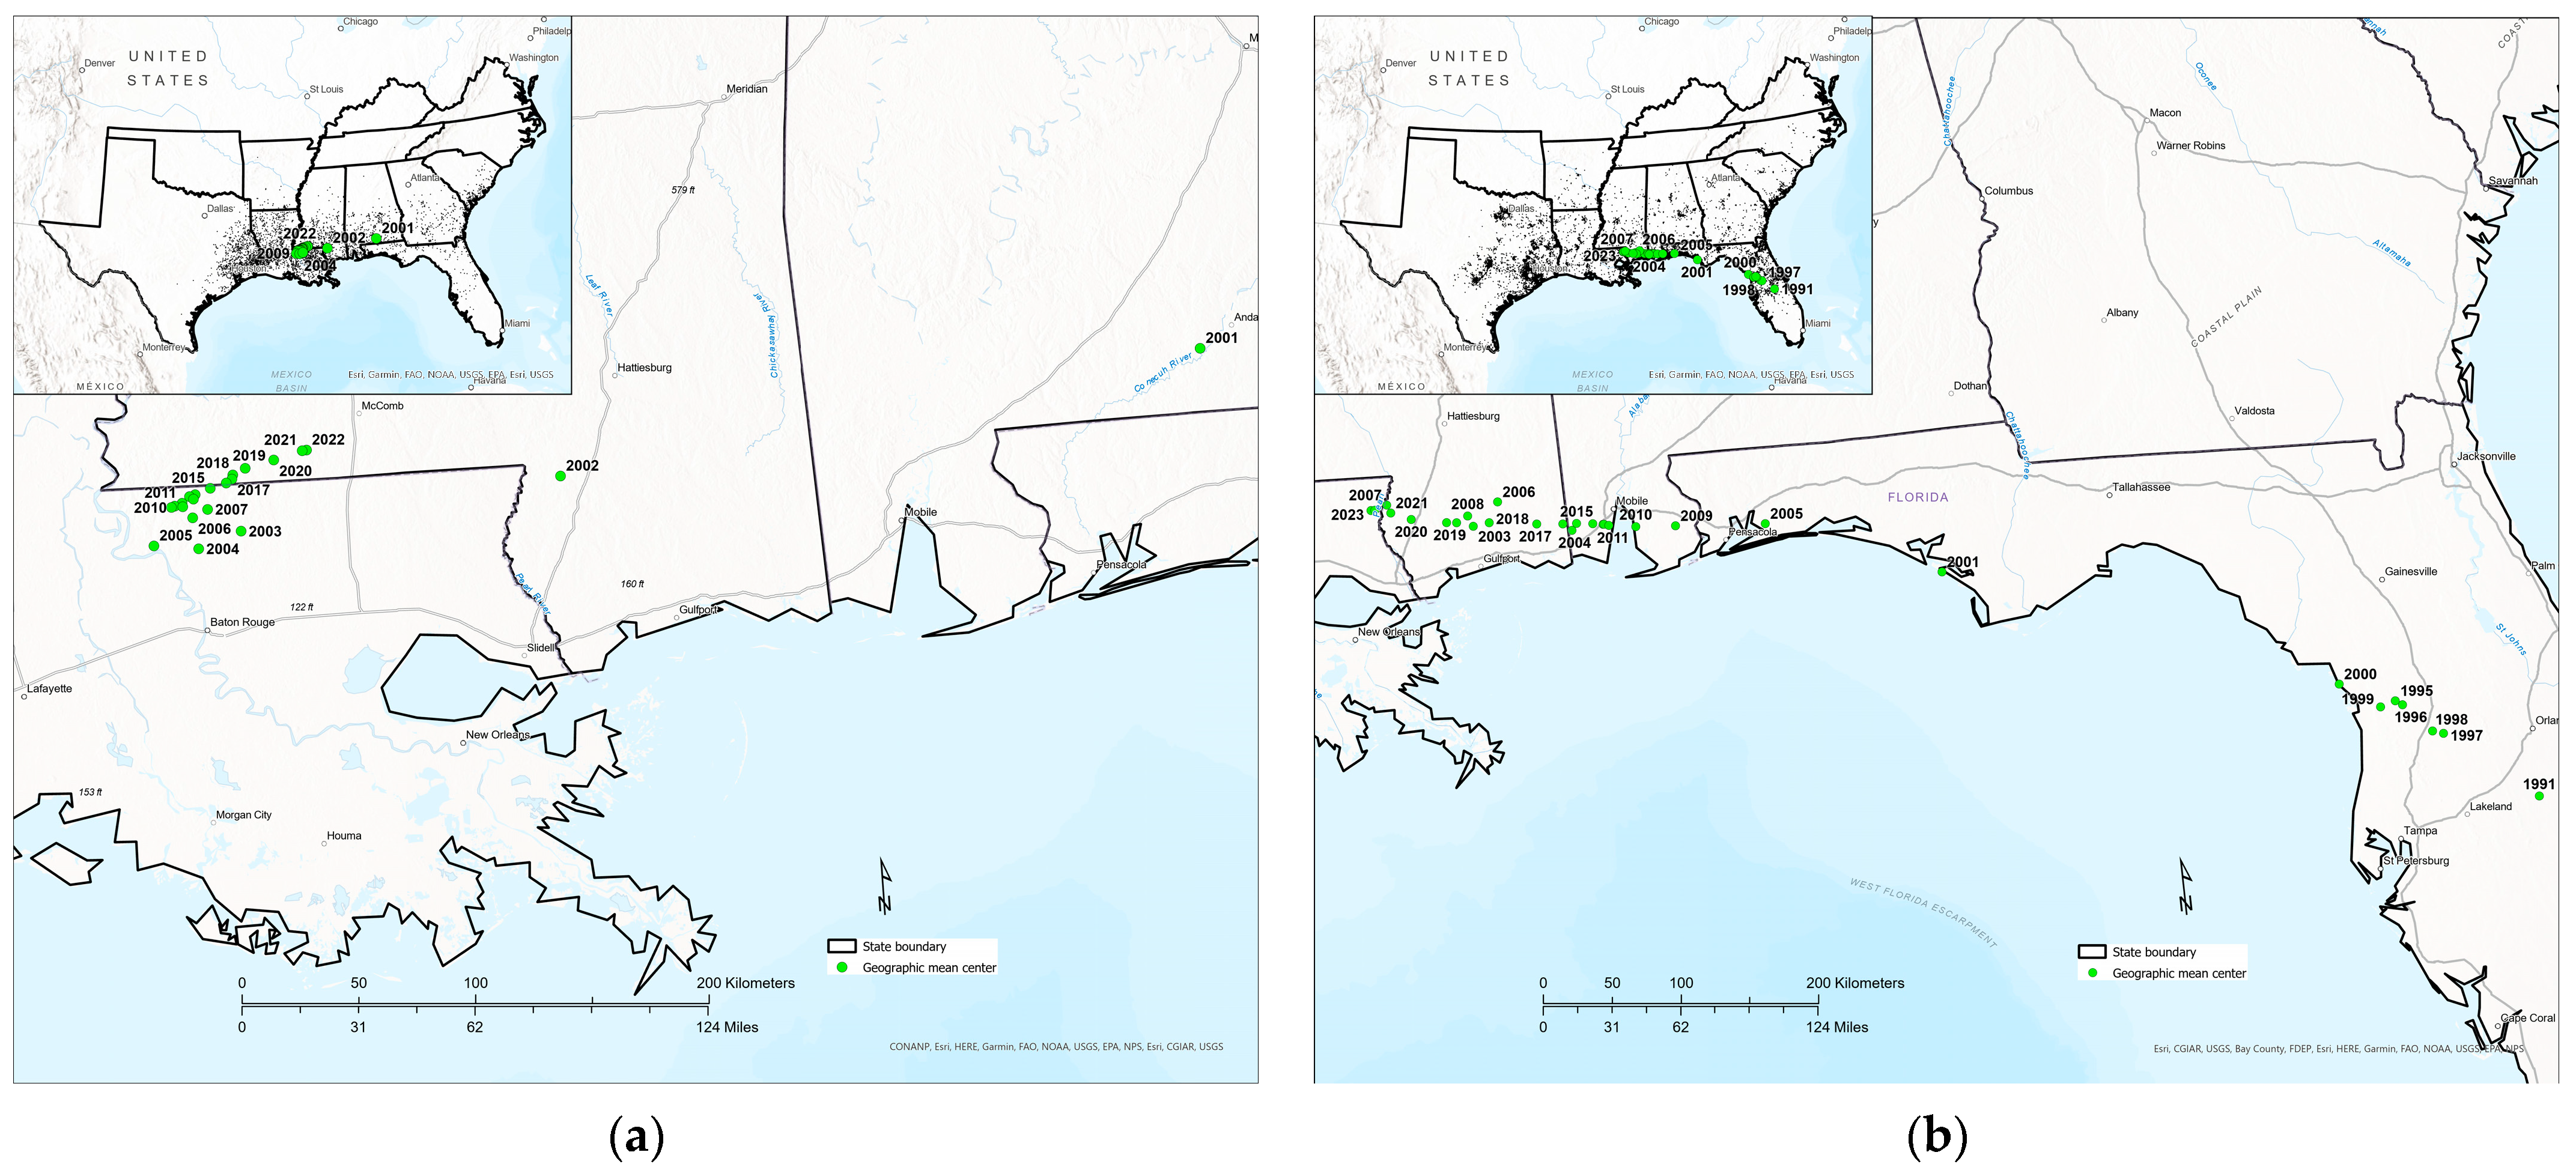
3.4. Temporal Shifts in Tallow Detection

Shifts in the geographic mean centers indicated a westward and outward tallow spread along the Gulf Coast (Figure 6). For the FIA plots, the mean centers shifted more than 130 km westward early in the observation period, from 2001 to 2003 (Figure 6a). From 2003 to 2005, the FIA mean centers shifted westward farther into Louisiana by 19 km annually. From 2005 to 2007, the FIA mean center shifts were in a northeasterly direction at 20 km and 7 km, respectively. The FIA mean center shifted west by 10 km in 2008 and farther west by 5 km in 2009. From 2009 to 2022, the FIA mean centers continued shifting in a northeast direction at an average annual rate of 5 km. From 1991 to 2023, the mean centers of citizen science observations shifted consistently westward and outward along the Gulf Coast as new observations were added across the study area (Figure 6b). The earliest citizen science observations were recorded for Florida in 1991 in EDDMapS. As more observations were added from 1995 to 1998, the mean center shifted from Central Florida westward along the Gulf Coast (Figure 6b). By 1999, tallow observations in the Florida Panhandle and around Alexandria, Louisiana, resulted in further mean center shifts, 17 to 19 km annually, westward along the Gulf Coast. By 2002, observations around Lufkin, Texas, shifted the mean center even farther west, 363 km, to the southwestern corner of Stone County, Mississippi. In 2005, observations near Greenville, Mississippi, Montgomery, Alabama, and Lake Village, Arkansas, shifted the mean center east. However, observations in East Texas in 2006 and 2007 shifted the mean center farther west by 196 km and 81 km, respectively. In 2010 and 2011, observations along the Atlantic Coast of Georgia and South Carolina, northern Mississippi, and Central Arkansas stationed the mean center around Mobile, Alabama. By 2017, more observations were recorded for Texas pulling the mean center westward, 20 km annually, into Louisiana through 2023.

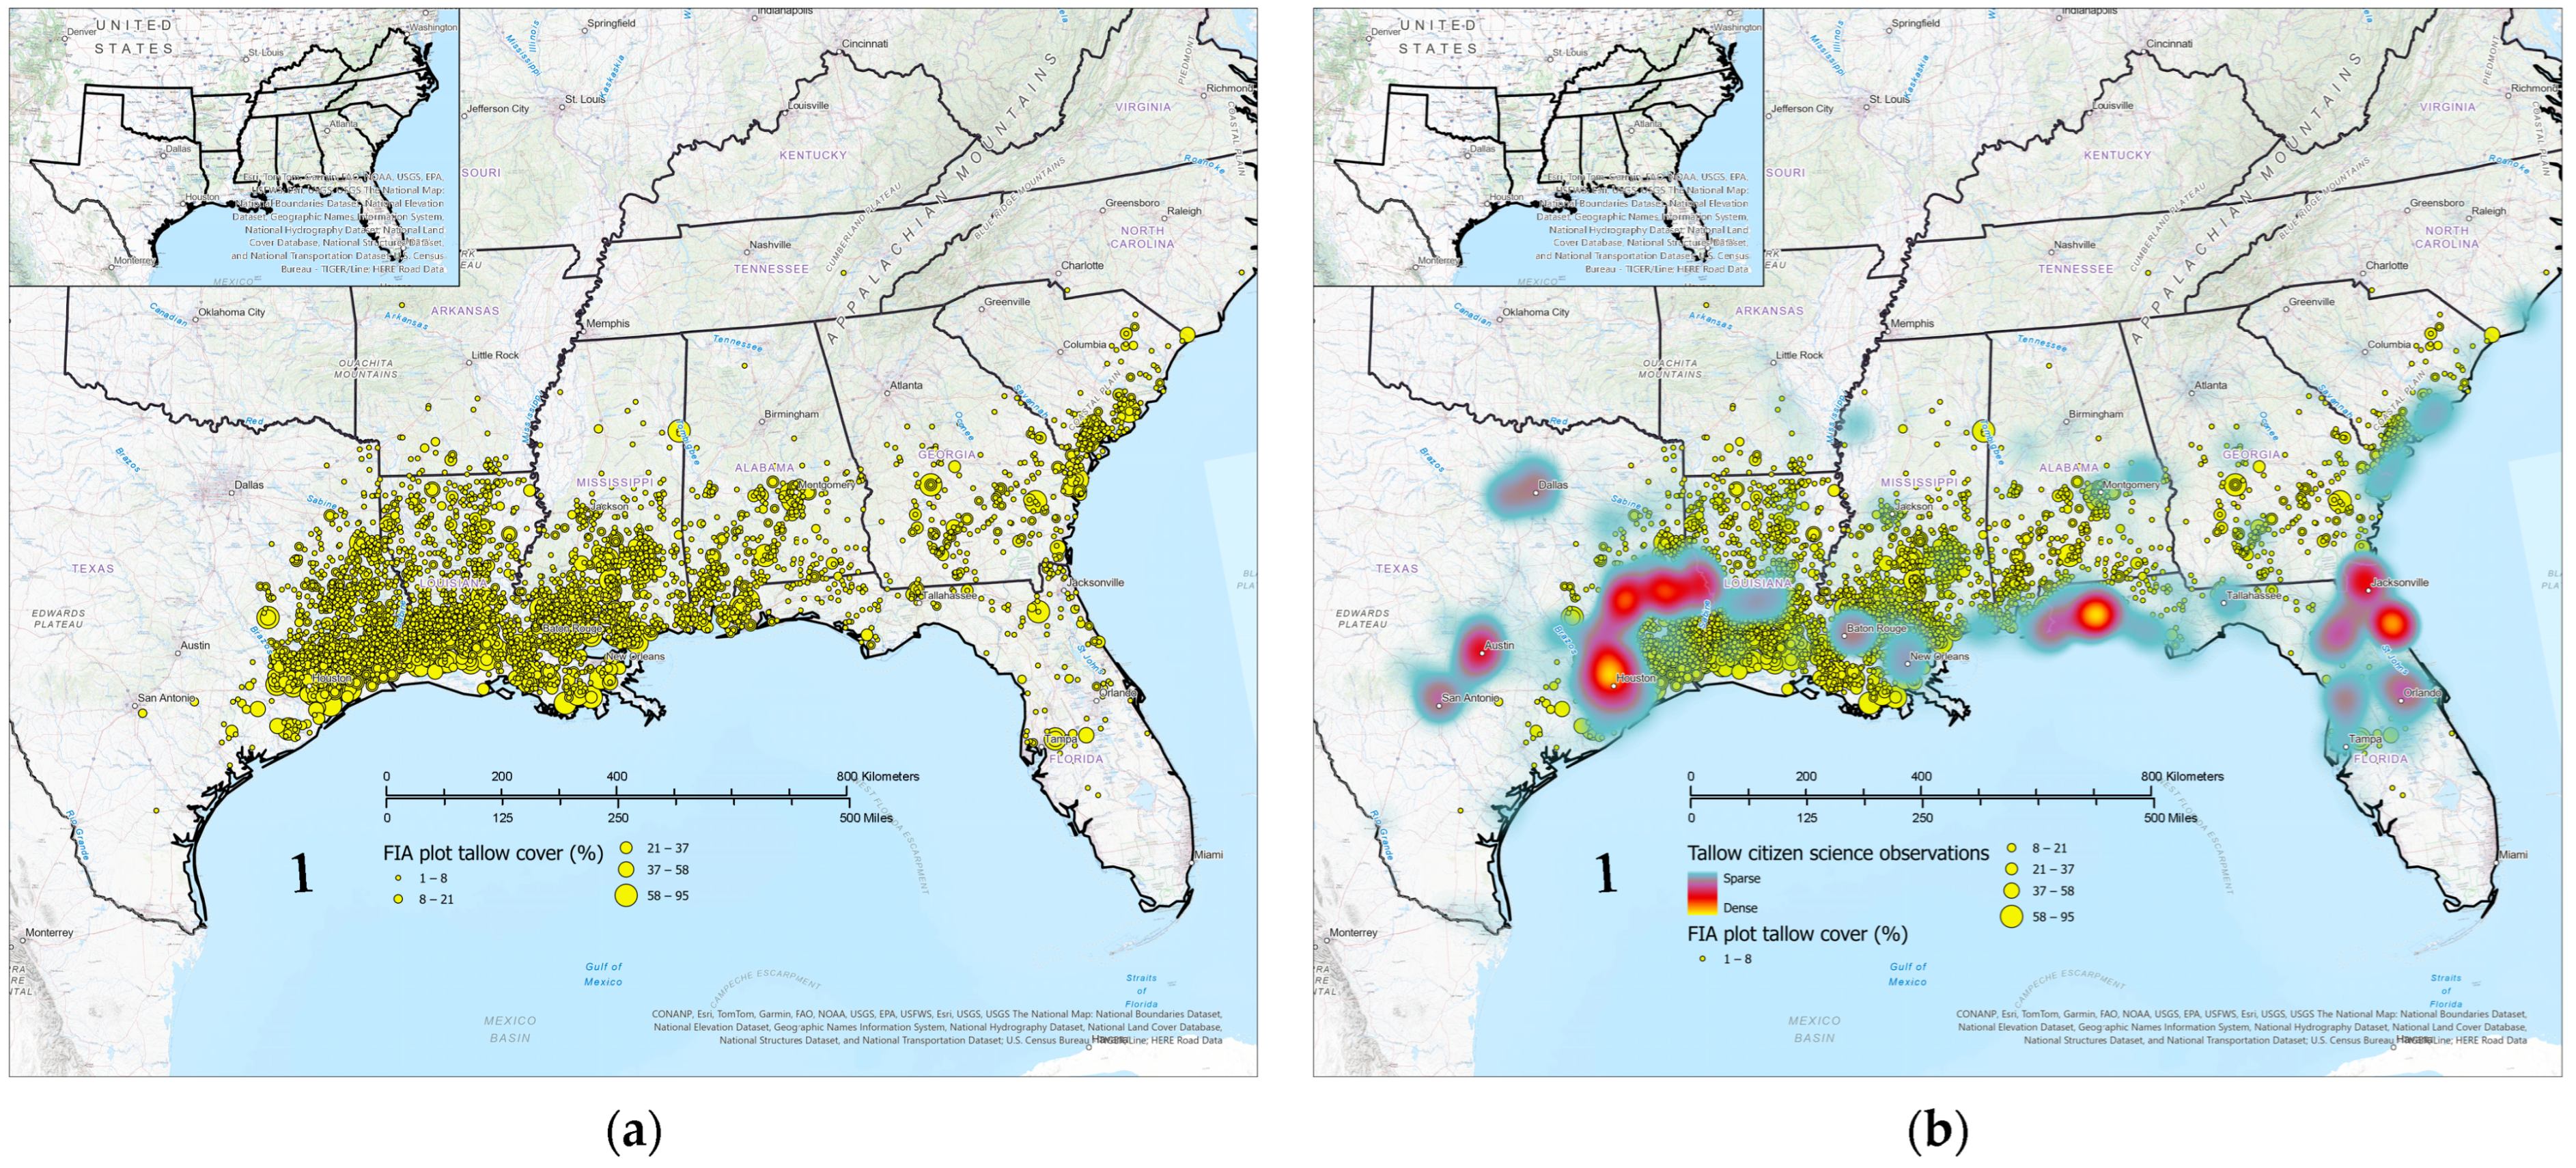
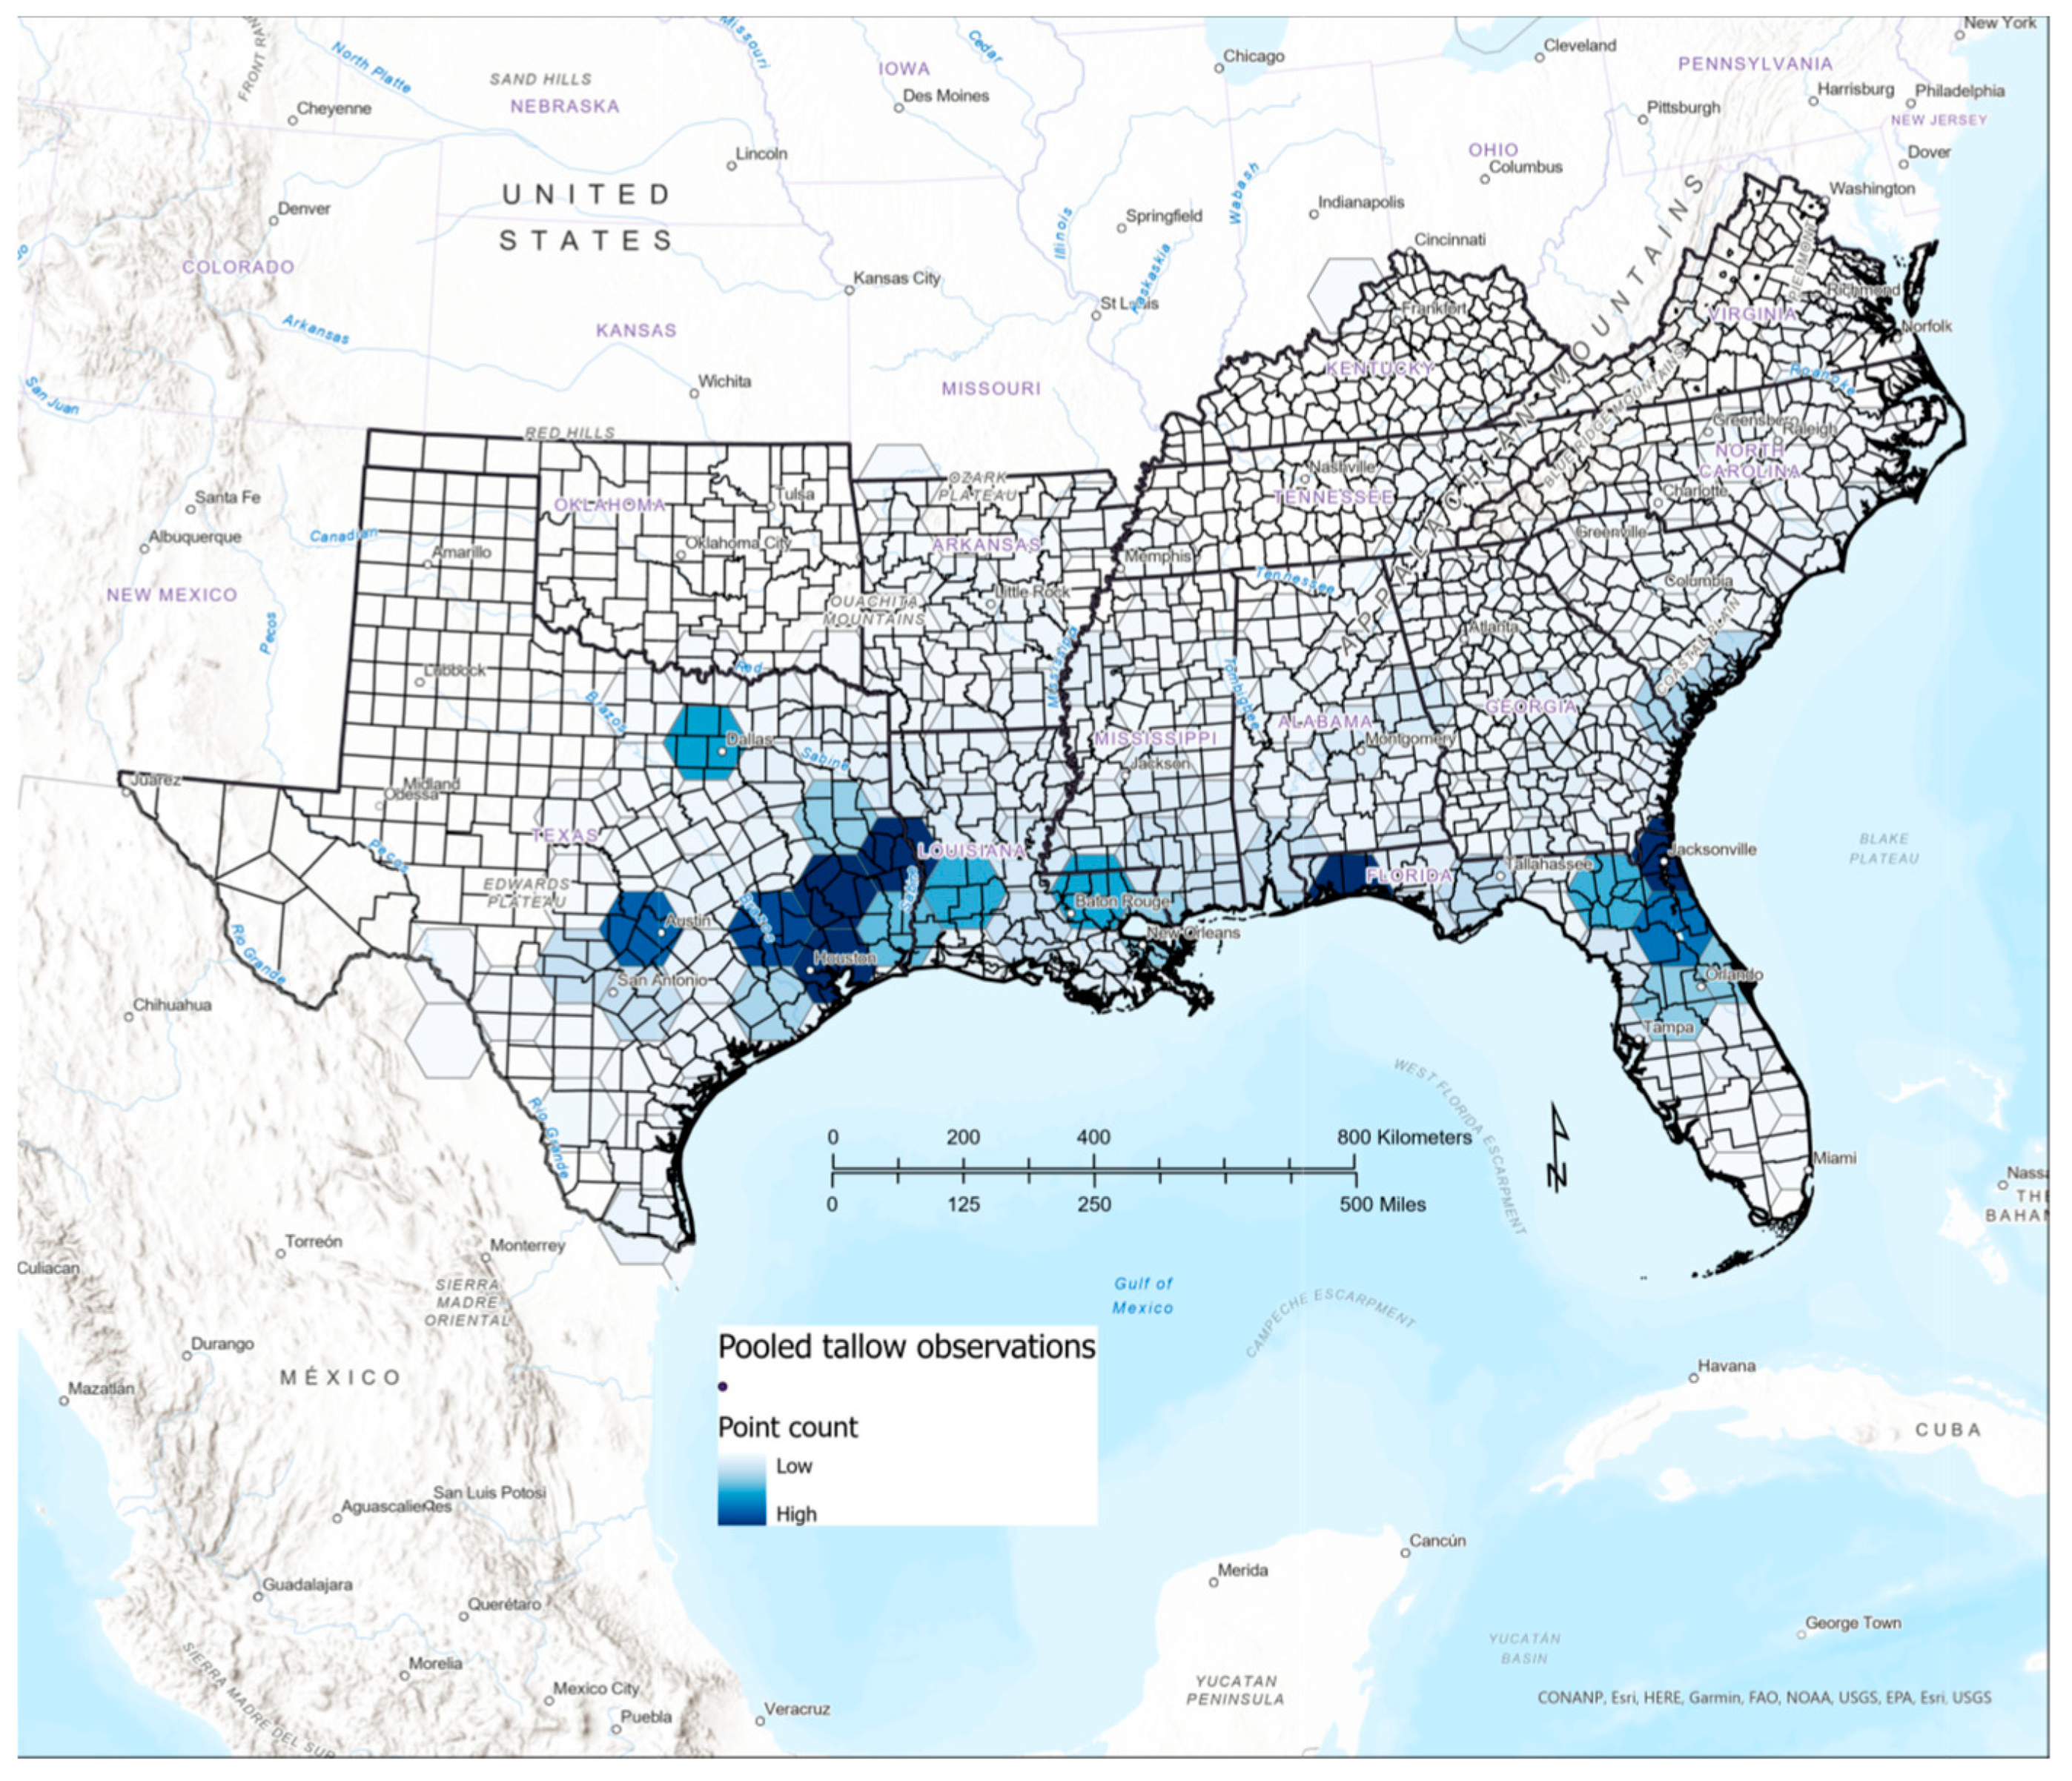
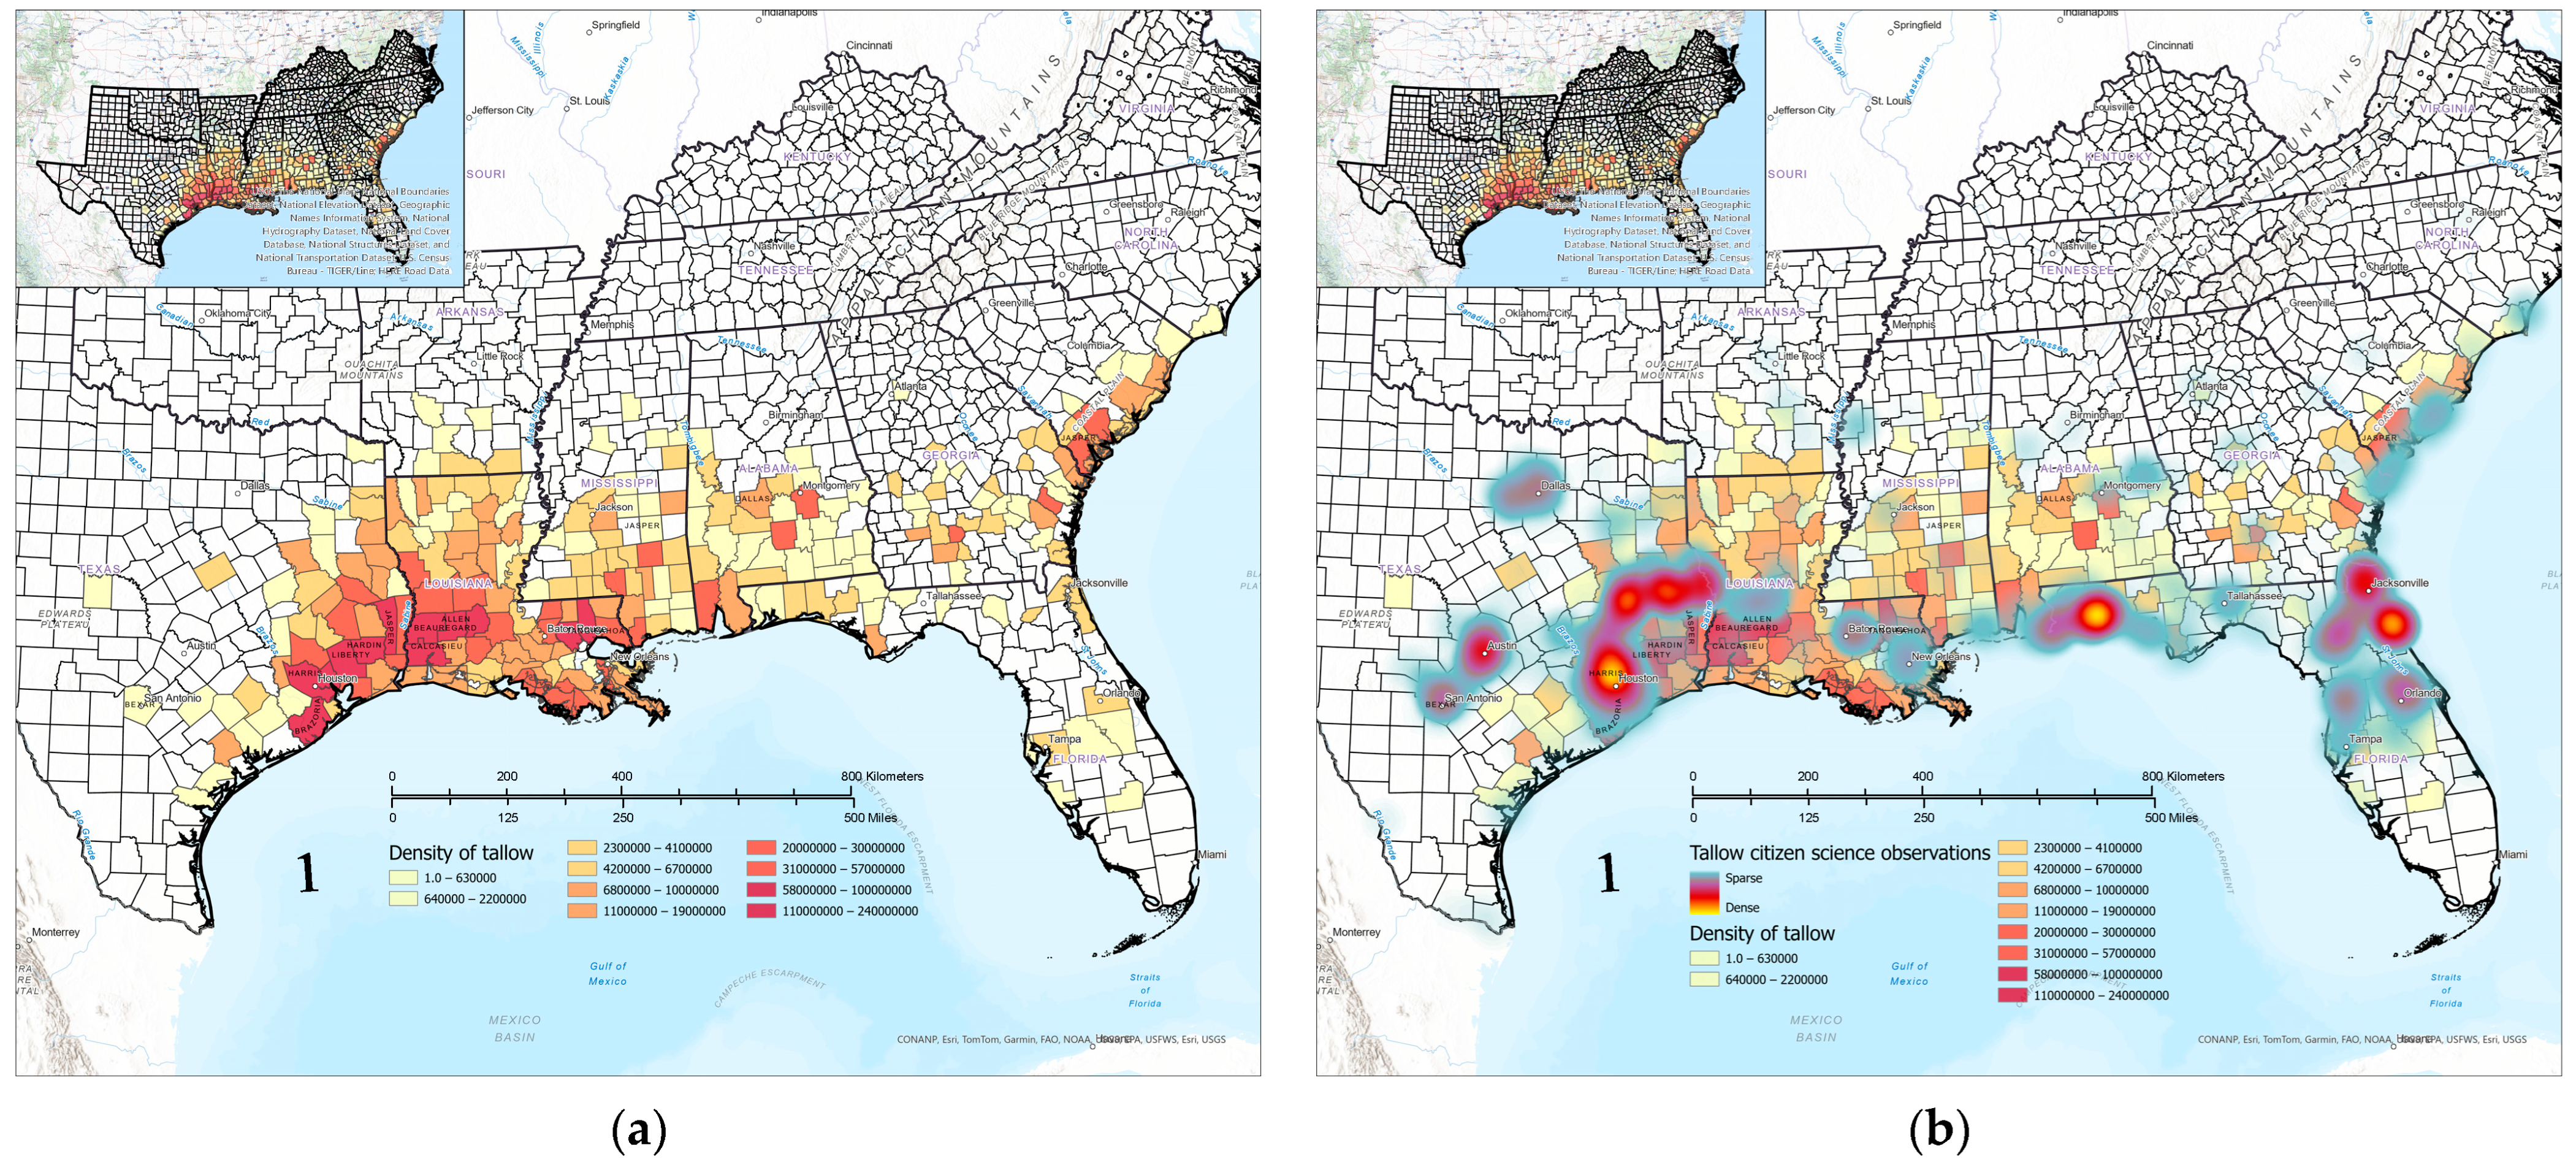
3.5. Comparison of Citizen Science and FIA Occurrence and Abundance

The FIA-based county-level map showed a preponderance of tallow on forestlands in Louisiana and Texas (Figure 7a). Liberty County, TX, had the highest density of live tallow trees and seedlings, followed by Calcasieu Parish, LA, Hardin County, TX, Allen Parish, LA, and Beauregard Parish, LA. Harris County, TX, which had the highest number of verified citizen science observations, ranked the 11th highest county using the FIA-based density of live tallow trees and seedlings. Superimposing verified tallow citizen science observations as a heat map on the FIA-based county map showed an agreement but also indicated concentrations of observations that are not currently depicted in the FIA-based county map (Figure 7b). Comparing the FIA-based county-level map (Figure 7a) to that reported in [9] for 2007, southeastern Texas as well as southwestern Louisiana and Mississippi continue to be areas of high tallow abundance. Similar to that reported in [10], Harris, Liberty, Hardin, and Jasper counties of Texas were some of the most heavily infested.
Tallow cover, regardless of plant height, on FIA plots was the highest in Texas, Louisiana, and Mississippi across the inventory years from 2001 to 2022 (Figure 8a). Virginia, Kentucky, and Oklahoma had no tallow observations on the FIA plots across those years. Heat map overlays of verified citizen science observations for the period from 1991 to 2023 showed a general agreement for hot spots of tallow occurrence but also highlighted tallow presence on non-forestland, especially around urban areas such as Dallas, TX, and Jacksonville, FL (Figure 8b). Using FIA plot cover data, tallow was first recorded in Alabama in 2001, with records in 2002 for Texas, Louisiana, Florida, Georgia, and South Carolina. Tallow cover spread northward and outward along the Gulf Coast and was recorded as far north as the Ozark St. Francis National Forest in 2019 (Figure 8a). The majority of FIA plots, 84%, across inventory years had less than 20% tallow cover, which is in agreement with that previously reported [12].
Recently published tallow abundance maps using only FIA [21] reported that only a few East Texas counties and Louisiana parishes had low-to-minimal tallow abundance. However, compared to our citizen science (Figure 1) and pooled FIA plot-level/citizen science maps (Figure 9), tallow observations were concentrated east of the San Bernard/Navasota rivers and south of U.S. Highway 84 in Texas, with additional hotspots around Dallas, Austin, and San Antonio. Our maps also indicated that tallow in Louisiana is concentrated in three hotspots centered around Allen Parrish, Tangipahoa Parrish, and Jefferson Davis Parish. All counties south of Jackson, MS, were reported to have moderate-to-high tallow abundance [21]. Our maps also indicate that tallow is most frequent along the Mississippi Gulf Coast, with hotspots around Jackson and Laurel, MS.

4. Discussion

Chinese tallow is highly prevalent in the southern United States, ranking as one of the most abundant tree species in several states [8]. Observations from two online citizen science platforms and FIA data underscored the widespread distribution of tallow throughout the South and highlighted invasion hotspots. In agreement with previous reports [8,20], Louisiana, Texas, and Mississippi were the most impacted states, with tallow extending over most of Louisiana, the eastern half of Texas, and the southern portion of Mississippi. Invasion hotspots were centered around the southeastern corner of Texas, extending into Louisiana along the Interstate 10 Corridor into Mississippi, and covering the majority of the De Soto National Forest (Figure 9).
Tallow occurrences were associated with prairies and forests of the Gulf Coastal Plain. In agreement with previous reports [7,9], tallow observations compiled in this study were mainly associated with mixtures of pine and hardwood forests as well as prairie grasslands of the Coastal Plains. Flat, alluvial plains and terraces of poor to well-drained soils, generally known as flatwoods, were associated with most tallow observations, thus indicating a higher likelihood of invasion potential for these ecosystems. Prairies and marshes along the Gulf coasts of Texas and Louisiana were also vulnerable. In invaded forestlands, tallow was associated with lower basal areas, lower diversity, and higher mortality and removals. This is similar to previously published work associating tallow occurrence and abundance with areas of overstory disturbance and lower species richness [35,36,37].
The minimum daily temperature appears to be a key climatic constraint for tallow invasion. In our maps, USDA plant hardiness zone 7b represented the northern limit of naturalized tallow populations, which is in line with observations reported in [2]. Thus, indicating that annual extreme minimum temperatures of less than −12.2 °C (10 °F) may be limiting to tallow growth and development [9]. Minimum temperature, or cold stress, was also reported to be a critical factor in predicting tallow distribution under current climate and tallow expansion under future climate scenarios [3,9]. For example, acute extreme temperatures as low as −4.6 to −7.8 °C can impact the physiological performance and morphological traits of tallow, but subsequent growth may not be impacted [38]. Under current climate conditions, tallow was predicted to have a suitable climate in southern Missouri, Oklahoma, Tennessee, and Virginia [3]. Our maps indicated a limited number of tallow observations for these states, with no records in Missouri. Although climatic conditions may be favorable for tallow’s invasion, the invasion range may also be constrained by propagule supply and dispersal [3]. It is worth mentioning, however, that states outside the advancing front of tallow’s range may not have citizen science campaigns in place to allow for early detection, relying on a small number of plant experts for detection.
Tallow’s invasion range is advancing northward and inland along the Gulf Coast. Tallow’s general advancement was captured in citizen science and FIA data (Figure 6). The earliest tallow observations were recorded in the eastern portions of the southern United States, Florida, for citizen science, and Alabama and Georgia for FIA. As observation records became more robust, a consistent inland shift in geographic mean centers in a westerly and northeasterly directions was observed (Figure 6). Although distance associated with shifts in geographic mean centers may be viewed as a surrogate for tallow spread rate, we caution against this use for early observation records. Reliable estimates of the spread rate require effective detection and monitoring, which may not have been possible at the beginning of the data record for all sources. Effective delineation of tallow extent at the initiation of records for those data sources would also not have been possible. For instance, tallow introductions occurred in the late 1700s for Savannah, GA [39], and Charleston, NC [40], and plantings occurred in the early 1900s in Texas, Louisiana, and near Jacksonville, FL [6,40,41]. In the Texas prairies, tallow was well established by the 1940s, and remarkable population expansion into upland habitats occurred by the 1970s [7]. These temporal patterns of tallow establishment and spread were not captured in contemporary citizen science or FIA data. However, as tallow extent was captured more effectively by FIA and citizen science data over time, shifts in mean centers were more indicative of tallow spread rate, especially when records from remeasured FIA monitoring plots were incorporated, ranging from 5 to 20 km annually over the last decade. Lower tallow rates of spread, ranging from 1 to 3.3 km per year, were previously reported [11,12,13]. Our results indicate that tallow has yet to reach the range extent (Figure 9) predicted based on climatic factors [3]. Nonetheless, our results support previously reported trends of tallow spread northward and inland [3,9,10,11,12].

5. Conclusions

Citizen science data generally mirrored FIA observations. Tallow observations within prairies were more frequently reported by citizen scientists. FIA, however, included tallow observations along the Louisiana Coastal Prairies and Marshes. This may reflect the FIA forestland inventory focus as well as the association of urban development with coastal and prairie systems, where citizen science observations were more concentrated. As expected, the FIA-based tallow distribution did not capture observations in non-forestland such as urban settings, with concentrations around Dallas, Travis, and Bexar counties of Texas not being depicted in the FIA-based maps (Figure 7a and Figure 8a). Despite the general agreement between FIA and citizen science data in depicting tallow distribution in the southern United States, each data source has limitations for depicting the spatiotemporal dynamics of tallow invasion at this scale. The systematic grid and remeasurements of FIA plots provide better estimates of change detection, spread rates, and invasibility level determination while also allowing for the characterization of demographic, structural, and compositional attributes associated with invasion. Citizen science observations, however, better reflect the extent of tallow distribution, especially in non-forestland settings, and provide more efficient early detection by delineating important sources of propagule supply and dispersal at finer spatial scales. The use of citizen science data can enhance species distribution mapping, especially when combined with data from established monitoring networks such as FIA. Integrating the use of citizen science data complements existing occurrence records and provides more comprehensive mapping and monitoring of invasive species extent and spatiotemporal dynamics.

Author Contributions

Conceptualization, M.M.B.; methodology, M.M.B., J.S.F. and L.S.P.K.; validation, M.M.B. and J.S.F.; formal analysis, M.M.B. and J.S.F.; investigation, M.M.B., J.S.F. and L.S.P.K.; resources, M.M.B., J.S.F. and L.S.P.K.; data curation, M.M.B. and J.S.F.; writing—original draft preparation, M.M.B.; writing—review and editing, M.M.B., J.S.F. and L.S.P.K.; visualization, M.M.B.; supervision, M.M.B.; project administration, M.M.B. All authors have read and agreed to the published version of the manuscript.

Funding

Support for the Article Processing Charge was provided by the U.S. Forest Service Southern Research Station Center for Forest Health and Disturbance—Research Work Unit 4552 Insects, Diseases, and Invasive Plants.

Data Availability Statement

Publicly available datasets from iNaturalist (www.inaturalist.org) and the Early Detection and Distribution Mapping System (www.eddmaps.org) were used in this study. All analyses and data generated during this study are included in this article.

Acknowledgments

This work would not have been possible without the contributions of citizen scientists and the two online citizen science platforms, iNaturalist (www.inaturalist.org) and the Early Detection and Distribution Mapping System (www.eddmaps.org). We thank all data contributors to these platforms. Forest Inventory and Analysis Program data contributions from field personnel, data analysts, and quality assurance personnel are acknowledged and greatly appreciated. We thank the administrative staff at the Center for Forest Health and Disturbance at the Southern Research Station for their support.

Conflicts of Interest

The authors declare no conflicts of interest.

References

  1. Pile, L.S.; Wang, G.G.; Stovall, J.P.; Siemann, E.; Wheeler, G.S.; Gabler, C.A. Mechanisms of Chinese tallow (Triadica sebifera) invasion and their management implications—A review. For. Ecol. Manag. 2017, 404, 1–13. [Google Scholar] [CrossRef]
  2. Bruce, K.A.; Cameron, G.N.; Harcombe, P.A.; Jubinsky, G. Introduction, Impact on Native Habitats, and Management of a Woody Invader, the Chinese Tallow Tree, Sapium sebiferum (L.) Roxb. Nat. Areas J. 1997, 17, 255–260. [Google Scholar]
  3. Pattison, R.R.; Mack, R.N. Potential distribution of the invasive tree Triadica sebifera (Euphorbiaceae) in the United States: Evaluating climex predictions with field trials. Glob. Chang. Biol. 2008, 14, 813–826. [Google Scholar] [CrossRef]
  4. DeWalt, S.J.; Siemann, E.; Rogers, W.E. Geographic distribution of genetic variation among native and introduced populations of Chinese tallow tree, Triadica sebifera (Euphorbiaceae). Am. J. Bot. 2011, 98, 1128–1138. [Google Scholar] [CrossRef] [PubMed]
  5. Vogt, J.T.; Olatinwo, R.; Ulyshen, M.D.; Lucardi, R.D.; Saenz, D.; McKenney, J.L. An overview of Triadica sebifera (Chinese Tallowtree) in the Southern United States, emphasizing pollinator impacts and classical biological control. Southeast Nat. 2021, 20, 536–559. [Google Scholar] [CrossRef]
  6. Jamieson, G.; McKinney, R. Stillingia oil. Oil Soap 1938, 15, 295–296. [Google Scholar] [CrossRef]
  7. Bruce, K.A.; Cameron, G.N.; Harcombe, P.A. Initiation of a new woodland type on the Texas Coastal Prairie by the Chinese tallow tree (Sapium sebiferum (L.) Roxb.). Torrey Bot. Soc. 1995, 122, 215–225. [Google Scholar] [CrossRef]
  8. Oswalt, S.N. Chinese Tallow (Triadica sebifera (L.) Small) Population Expansion in Louisiana, East Texas, and Mississippi; U.S. Department of Agriculture, Forest Service, Southern Research Station: Asheville, NC, USA, 2010.
  9. Gan, J.; Miller, J.H.; Wang, H.; Taylor, J.W. Invasion of tallow tree into southern US forests: Influencing factors and implications for mitigation. Can. J. For. Res. 2009, 39, 1346–1356. [Google Scholar] [CrossRef]
  10. Wang, H.-H.; Buchhorn, J.L.; Grant, W.E. Effects of Management on Range Expansion by Chinese Tallow in the Forestlands of Eastern Texas. J. For. 2014, 112, 346–353. [Google Scholar] [CrossRef]
  11. Wang, H.-H.; Grant, W.E.; Swannack, T.M.; Gan, J.; Rogers, W.E.; Koralewski, T.E.; Miller, J.H.; Taylor, J.W. Predicted range expansion of Chinese tallow tree (Triadica sebifera) in forestlands of the southern United States. Divers. Distrib. 2011, 17, 552–565. [Google Scholar] [CrossRef]
  12. Suriyamongkol, T.; McGrew, E.; Culpepper, L.; Beck, K.; Wang, H.-H.; Grant, W.E. Recent Range Expansions by Chinese Tallow (Triadica sebifera (L.) Small), the Most Prevalent Invasive Tree in the Forestlands of Eastern Texas. Southeast Nat. 2016, 15, 68–75. [Google Scholar] [CrossRef]
  13. Renne, I.J.; Gauthreaux, S.A., Jr.; Gresham, C.A. Seed dispersal of the Chinese tallow tree (Sapium sebiferum (L.) Roxb.) by birds in coastal South Carolina. Am. Midl. Nat. 2000, 144, 202–215. [Google Scholar] [CrossRef]
  14. Renne, I.J.; Spira, T.P.; Bridges, W.C. Effects of habitat, burial, age and passage through birds on germination and establishment of Chinese tallow tree in Coastal South Carolina. J. Torrey Bot. Soc. 2001, 128, 109–119. [Google Scholar] [CrossRef]
  15. Siemann, E.; Rogers, W.E. Recruitment limitation, seedling performance and persistence of exotic tree monocultures. Biol. Invasions 2006, 8, 979–991. [Google Scholar] [CrossRef]
  16. Pile, L.S.; Vickers, L.; Stambaugh, M.; Norman, C.; Wang, G.G. The tortoise and the hare: A race between native tree species and the invasive Chinese tallow. For. Ecol. Manag. 2019, 445, 110–121. [Google Scholar] [CrossRef]
  17. Jones, R.H.; McLeod, K.W. Shade tolerance in seedlings of Chinese tallow tree, American sycamore, and cherrybark oak. Bull. Torrey Bot. Club 1989, 116, 371–377. [Google Scholar] [CrossRef]
  18. Lin, J.; Harcombe, P.A.; Fulton, M.R.; Hall, R.W. Sapling growth and survivorship as affected by light and flooding in a river floodplain forest of southeast Texas. Oecologia 2004, 139, 399–407. [Google Scholar] [CrossRef]
  19. Fan, Z.; Tan, Y.; Crosby, M.K. Factors associated with the spread of Chinese Tallow in East Texas forestlands. Open J. Ecol. 2012, 2, 121–130. [Google Scholar] [CrossRef]
  20. Yang, S.; Fan, Z.; Liu, X.; Ezell, A.W. Predicting the spread of Chinese tallow (Triadica sebifera) in the southeastern United States forestland: Mechanism and risk factors at the regional scale. For. Ecol. Manag. 2021, 482, 118892. [Google Scholar] [CrossRef]
  21. Nepal, S.; Moser, W.K.; Fan, Z. Spatiotemporal Invasion Severity of Chinese Tallow (Triadica sebifera) and Invasibility of Forest Types in Southern US Forestlands. For. Sci. 2021, 67, 491–500. [Google Scholar] [CrossRef]
  22. Hochmair, H.H.; Scheffrahn, R.H.; Basille, M.; Boone, M. Evaluating the data quality of iNaturalist termite records. PLoS ONE 2020, 15, e0226534. [Google Scholar] [CrossRef]
  23. Reinhardt, J.R.; Russell, M.B.; Senay, S.; Lazarus, W. Assessing the current and potential future distribution of four invasive forest plants in Minnesota, U.S.A., using mixed sources of data. Sci. Rep. 2020, 10, 12738. [Google Scholar] [CrossRef]
  24. Cleland, D.T.; Avers, P.E.; McNab, W.H.; Jensen, M.E.; Bailey, R.G.; King, T.; Russell, W.E. National Hierarchical Framework of Ecological Units; Yale University Press: New Haven, CT, USA, 1997. [Google Scholar]
  25. United States Census Bureau. 2020 Population Census Quick Facts. Available online: https://www.census.gov/quickfacts/geo/chart/US/POP010220 (accessed on 7 December 2023).
  26. National Oceanic and Atmospheric Adminstration, SCIPP. Historical Climate Trends Tool. Available online: https://www.charts.climate.lsu.edu/trends (accessed on 7 December 2023).
  27. National Oceanic and Atmospheric Adminstration, NCfEI. U.S. Climate Atlas. Available online: https://www.ncei.noaa.gov/access/climateatlas (accessed on 7 December 2023).
  28. U.S. Department of Agriculture, Agricultural Research Service. USDA Plant Hardiness Zone Map. Available online: https://www.planthardiness.ars.usda.gov (accessed on 7 December 2023).
  29. USDA Forest Service. Forest Inventory and Analysis National Program. Forest Inventory EVALIDator Web-Application Version 2.1.0. Available online: https://apps.fs.usda.gov/fiadb-api/evalidator (accessed on 18 October 2023).
  30. USDA Forest Service. Forest Inventory and Analysis National Program. Forest Inventory DataMart Web-Application Version 2.0. Available online: https://apps.fs.usda.gov/fia/datamart/datamart.html (accessed on 18 October 2023).
  31. Stanke, H.; Finley, A.O.; Weed, A.S.; Walters, B.F.; Domke, G.M. rFIA: An R package for estimation of forest attributes with the US Forest Inventory and Analysis database. Environ. Model. Softw. 2020, 127, 104664. [Google Scholar] [CrossRef]
  32. Omernik, J.M.; Griffith, G.E. Ecoregions of the Conterminous United States: Evolution of a Hierarchical Spatial Framework. Environ. Manag. 2014, 54, 1249–1266. [Google Scholar] [CrossRef]
  33. Daly, C.; Widrlechner, M.P.; Halbleib, M.D.; Smith, J.I.; Gibson, W.P. Development of a new USDA plant hardiness zone map for the United States. J. Appl. Meteorol. Climatol. 2012, 51, 242–264. [Google Scholar] [CrossRef]
  34. R Core Team. R: A Language and Environment for Statistical Computing; R Foundation for Statistical Computing: Vienna, Austria, 2023. [Google Scholar]
  35. Henkel, T.K.; Chambers, J.Q.; Baker, D.A. Delayed tree mortality and Chinese tallow (Triadica sebifera) population explosion in a Louisiana bottomland hardwood forest following Hurricane Katrina. For. Ecol. Manag. 2016, 378, 222–232. [Google Scholar] [CrossRef]
  36. Johns, D.T.; Williams, B.; Williams, H.M.; Stroupe, M. Seedling survival and natural regeneration for a bottomland hardwood planting on sites differing in site preparation. In Proceedings of the 10th Biennial Southern Silvicultural Research Conference, USDA For. Serv., Gen. Tech. Rep. SRS-30, Southern Research Station, Asheville, NC, USA, 16–18 February 1999; pp. 145–150. [Google Scholar]
  37. Pile, L.S.; Wang, G.G.; Knapp, B.O.; Walker, J.L.; Stambaugh, M.C. Chinese tallow (Triadica sebifera) invasion in maritime forests: The role of anthropogenic disturbance and its management implication. For. Ecol. Manag. 2017, 398, 10–24. [Google Scholar] [CrossRef]
  38. Xie, H.; Pile Knapp, L.S.; Yu, M.; Wang, G.G. Morphological and physiological response of Chinese tallow (Triadica sebifera) to an extreme cold spell in subtropical, coastal forests of China. Front. Ecol. Evol. 2022, 10, 945886. [Google Scholar] [CrossRef]
  39. Bell, M.I. Some Notes and Refl Ections upon a Letter from Benjamin Franklin to Noble Wimberly Jones, 7 October 1772; Ashantilly Press: Darien, GA, USA, 1966. [Google Scholar]
  40. Elliott, S. A Sketch of the Botany of South-Carolina and Georgia; JR Schenck: Charleston, SC, USA, 1821; Volume 1. [Google Scholar]
  41. Howes, F. The Chinese tallow tree (Sapium sebiferum Roxb.): A source of drying oil. Kew Bull. 1949, 4, 573–580. [Google Scholar] [CrossRef]
Figure 1. Study area extent with overlapping ecological provinces and tallow observations from1991 to 2023 from the citizen science databases iNaturalist and EDDMapS.
Forests 15 00202 g001
Figure 2. Sections and Subsections of the National Hierarchical Framework of Ecological Units with tallow: (a) Forest Inventory and Analysis (FIA) plot observations for the period from 2001 to 2022, and (b) citizen science observations for the period from 1991 to 2023, as reported in the iNaturalist and EDDMapS databases.
Forests 15 00202 g002
Figure 3. Level III Ecoregions of the Conterminous United States classification with tallow: (a) Forest Inventory and Analysis (FIA) plot observations for the period from 2001 to 2022, and (b) citizen science observations for the period from 1991 to 2023, as reported in the iNaturalist and EDDMapS databases.
Forests 15 00202 g003
Figure 4. Level IV Ecoregions of the Conterminous United States classification with tallow: (a) Forest Inventory and Analysis (FIA) plot observations for the period from 2001 to 2022, and (b) citizen science observations for the period from 1991 to 2023, as reported in the iNaturalist and EDDMapS databases.
Forests 15 00202 g004
Figure 5. USDA 2012 plant hardiness zones with tallow: (a) Forest Inventory and Analysis (FIA) plot observations for the period from 2001 to 2022, and (b) citizen science observations for the period from 1991 to 2023, as reported in the iNaturalist and EDDMapS databases.
Forests 15 00202 g005
Figure 6. Tallow observations geographic mean centers by year showing spread as reported for (a) Forest Inventory and Analysis (FIA) plots for the period from 2001 to 2022 and (b) citizen science data for the period from 1991 to 2023, as recorded in the iNaturalist and EDDMapS databases.
Forests 15 00202 g006
Figure 7. Tallow distribution across the 13 southern states based on (a) density of live trees and seedlings on forestlands by county using Forest Inventory and Analysis (FIA) most recent inventories and (b) heat map of citizen science tallow observations for the period from 1991 to 2023 superimposed on FIA county-level map.
Forests 15 00202 g007
Figure 8. Tallow distribution across the 13 southern states based on (a) cover (%) on Forest Inventory and Analysis (FIA) plots for the period from 2001 to 2022; (b) heat map of citizen science tallow observations for the period from 1991 to 2023 superimposed on FIA plot-level map.
Forests 15 00202 g008
Figure 9. Polygon bins of tallow observations using pooled Forest Inventory and Analysis (FIA) plot data for the period from 2001 to 2022 and citizen science data, as reported in the iNaturalist and EDDMapS, for the period from 1991 to 2023.
Forests 15 00202 g009
Table 1. Proportion (%) of total Forest Inventory and Analysis plots and citizen science observations within provinces of the National Hierarchical Framework of Ecological Units.
ProvinceFIA 1Citizen Science
Outer Coastal Plain Mixed Forest7462
Southeastern Mixed Forest139
Lower Mississippi Riverine Forest93
Prairie Parkland (Subtropical)417
Southwest Plateau and Plains Dry Steppe and Shrub0.025
1 Forest Inventory and Analysis plots.
Table 2. Mean and standard error summary statistics and statistical test results of eight response variables based on forest structural metrics, species composition, and disturbance rates for USDA Forest Service Forest Inventory and Analysis (FIA) plots grouped by tallow invasion status.
VariableNon-InvadedInvadedp Value
Sample size12,0181225
Basal area (m2 ha−1)20.88 (0.10)19.81 (0.31)0.0004
Density (trees ha−1)1381.60 (10.61)1401.96 (34.13)0.5262
Shannon’s diversity index1.15 (0.01)1.12 (0.01)0.0204
Shannon’s equitability index0.19 (0.00)0.19 (0.00)0.9279
Species richness5.98 (0.03)5.82 (0.08)0.4566
Mean annual mortality (% BA)1.24 (0.02)1.61 (0.07)0.0037
Mean annual removals (% BA)2.00 (0.04)2.37 (0.14)0.0018
Disclaimer/Publisher’s Note: The statements, opinions and data contained in all publications are solely those of the individual author(s) and contributor(s) and not of MDPI and/or the editor(s). MDPI and/or the editor(s) disclaim responsibility for any injury to people or property resulting from any ideas, methods, instructions or products referred to in the content.

