Article

Assessing the Ecological Effects of Fiscal Investments in Sloping Land Conversion Program for Revegetation: A Case Study of Shaanxi Province, China

1
School of Economics and Management, Nanjing Forestry University, Nanjing 210037, China
2
School of Economics and Management, Northwest A & F University, Yangling, Xianyang 712100, China
3
College of Humanities and Social Development, Northwest A & F University, Yangling, Xianyang 712100, China
*
Author to whom correspondence should be addressed.
Forests 2024, 15(1), 2; https://doi.org/10.3390/f15010002
Submission received: 4 October 2023 / Revised: 14 December 2023 / Accepted: 15 December 2023 / Published: 19 December 2023
(This article belongs to the Section Forest Economics, Policy, and Social Science)

Abstract

:
The study of the ecological effects of the Sloping land conversion program (SLCP) has great significance for afforestation optimization policies based on cost-effectiveness. This paper uses the panel fixed effect model and the panel threshold model to study the ecological effects of fiscal investments in the SLCP at the county level in Shaanxi Province of China. The regional ecological performance indicated by the normalized difference vegetation index (NDVI) has improved after the implementation of the SLCP, but the vegetation suffers degradation risks due to the cessation of subsidies. The results demonstrate strong support for a time lag effect, an effect of diminishing marginal returns, and a threshold effect whereas a significant but negative direct effect of SLCP’s fiscal investments on the vegetation. Specifically, it takes approximately four years after fiscal investments for the NDVI to realize the greatest investment performance. The marginal contribution of fiscal investments to ecological performance reveals an increasing trend initially, followed by a decreasing trend. In addition, the ecological effects of fiscal investments in the SLCP are moderated negatively by ecological endowments. The results indicate that fiscal investments in the SLCP should consider its cost-effectiveness in policy design and improvements.

1. Introduction

With the rapid development of the social economy and the continuous advancement of urbanization, a series of ecological or environmental problems have been caused in the global scope, such as soil and water loss, desertification, and ecosystem degradation [1,2]. It has been proved that the Payments for Ecosystem Services (PES) is a preferred policy for balancing ecological conservation and livelihood amelioration [3]. Many PES projects have been carried out in the world, for instance, Costa Rica’s payments for ecosystem services and China’s Sloping Land Conversion Program (SLCP) [4,5,6].
The SLCP is an important ecological restoration program in China and the largest afforestation project in the world [6,7,8]. It had invested more than CNY (CNY 100 ≈ USD 622.84 in 2015) 500 billion and about 41 million farmers had participated in this project by the end of 2019 [9]. It has contributed to vegetation restoration, soil and water loss amelioration, and carbon sequestrations [1,8,10]. Many researchers used econometric models and remote sensing technology to improve the assessment accuracy of ecological effects [1,10,11,12,13]. Although remote sensing technology can be used to observe the real changes in ecological or environmental quality, it is impossible to accurately assess whether these changes are caused by the implementation of SLCP and estimate the contributions of the SLCP to ecological or environmental quality [10]. Subsequently, models such as geographical weighted regression, simultaneous equations, and the panel regression model were used to evaluate the ecological effectiveness or contributions of the SLCP at different scales accompanied by remote sensing technology [1,7,10,11,12,13]. These models make up for the shortcomings of comparative analysis methods in natural geography or landscape ecology to assess the ecological effects of ecological restoration projects [8]. They also provide some valuable references for our research.
However, the aforementioned studies above mainly focus on the impact of SLCP on ecological or environmental indicators, namely its environment-effectiveness, and little attention is paid to the cost-effectiveness and afforestation optimization [10]. Additionally, in these studies, area measures were adopted to indicate the SLCP, such as afforestation areas (or its ratio to total land area) reported by the government [1,11,13] and transition areas of farmland and/grassland to forestland interpreted from remote sensing images [12]. The afforestation areas (or its ratio) of the SLCP reported by the government are not always available via statistical yearbooks because the information statistics of SLCP have been interrupted and can hardly reflect the dynamic effect of the SLCP. In addition, it is hard to separate the ecological effects of the SLCP by using the land transition areas from remote sensing images since land use/land cover changes are affected in a complex manner both by natural and socio-economic factors [14]. Moreover, area indicators exclude regional differences in land prices. These indicators are difficult to use to express the SLCP comprehensively, and previous results or conclusions provide little inference in optimizing the management of the SLCP, which might lead to inefficient policy design [10].
The main purpose of the SLCP is to encourage farmers to change land uses and agricultural planting structures by means of fiscal transfer payments for increasing vegetation and achieving the goal of soil erosion control and ecological degradation reduction [1,10,11,12,13]. The cost-effectiveness analysis is a good measure to compare the fiscal investment cost with ecological outcomes [7,10]. Compared with market-oriented trading mechanisms in developed countries, government investments, such as the SLCP, suffer from the common problem of “higher input and lower output” [15]. Recipients of PES usually have more information about land opportunity costs [16], and the government tends to overpay landowners with asymmetric information [17,18,19]. The over-compensation implies that program beneficiaries can acquire more information and receive higher payments than the participation threshold [15]. One option to reduce the efficiency loss caused by asymmetry information is to shift from fixed payment schemes to an auction mechanism [17]. In addition, multiple administrations compete for fiscal funds with conflicting objectives and focus on outcomes rather than addressing the root causes of land degradation [20]. Undoubtedly, once the subsidy is suspended, there would be severe risks of large-scale forest degradation due to a lack of economic incentives for forest management [13]. Due to all these problems, we need to accurately evaluate the ecological effect of fiscal investments from the perspective of cost-effectiveness.
Although the scale of SLCP is impressive, a successful PES program depends on its ability to achieve ecological or economic goals in a more cost-effective and sustainable way [18]. The ecological effect or cost-effectiveness of PES reveals a dynamic process after project implementation because of the vegetation’s natural growth, and the SLCP may delay the impact on ecological indicators [7,10,13]. However, there is no consistent conclusion or method to determine the reasonable lag period of PES. Thus, it is necessary to identify the reasonable lag period in assessing the cost-effectiveness of fiscal investments in the SLCP. Although higher ecological compensations or fiscal investments would encourage more farmers to participate in PES projects, it would aggravate the loss of cost-effectiveness, while less compensation or fiscal investment may not achieve given ecological goals. Nevertheless, there are few studies focusing on the optimal investment scale for achieving the maximum ecological goal. The PES’ target is to search for lower cost and higher return units [21,22] and involves understanding how to allocate compensation funds or fiscal investments within a limited budget [23,24], for directly maximizing the ecological effectiveness and fund efficiency [25]. Although China’s SLCP has set two payment levels [6], it rarely considers individual or spatial differences and thus results in ineffective practices [26]. Hence, it is necessary to search the investment priority areas under the payment system for improving the efficiency of fiscal investments.
In this paper, our objectives are to assess the ecological effects of the fiscal investments of SLCP from the perspective of cost-effectiveness and optimize afforestation decisions. First, we employ fiscal investments of Shaanxi Province, the key zone of the SLCP, and they are calculated based on afforestation areas identified by the government as an alternative indicator for the SLCP to fulfill the requirements of cost-effectiveness analysis. Then, we establish and test the hypotheses about the ecological effects of afforestation investments, including the direct effect, time lag effect, effect of diminishing marginal returns, and threshold effect. Finally, the panel fixed effect model and panel threshold model are adopted to calculate the reasonable lag phases, scales, and priority areas of fiscal investments in the SLCP based on different effect forms. We would provide some policy references for the new round of SLCP on the basis of this study.

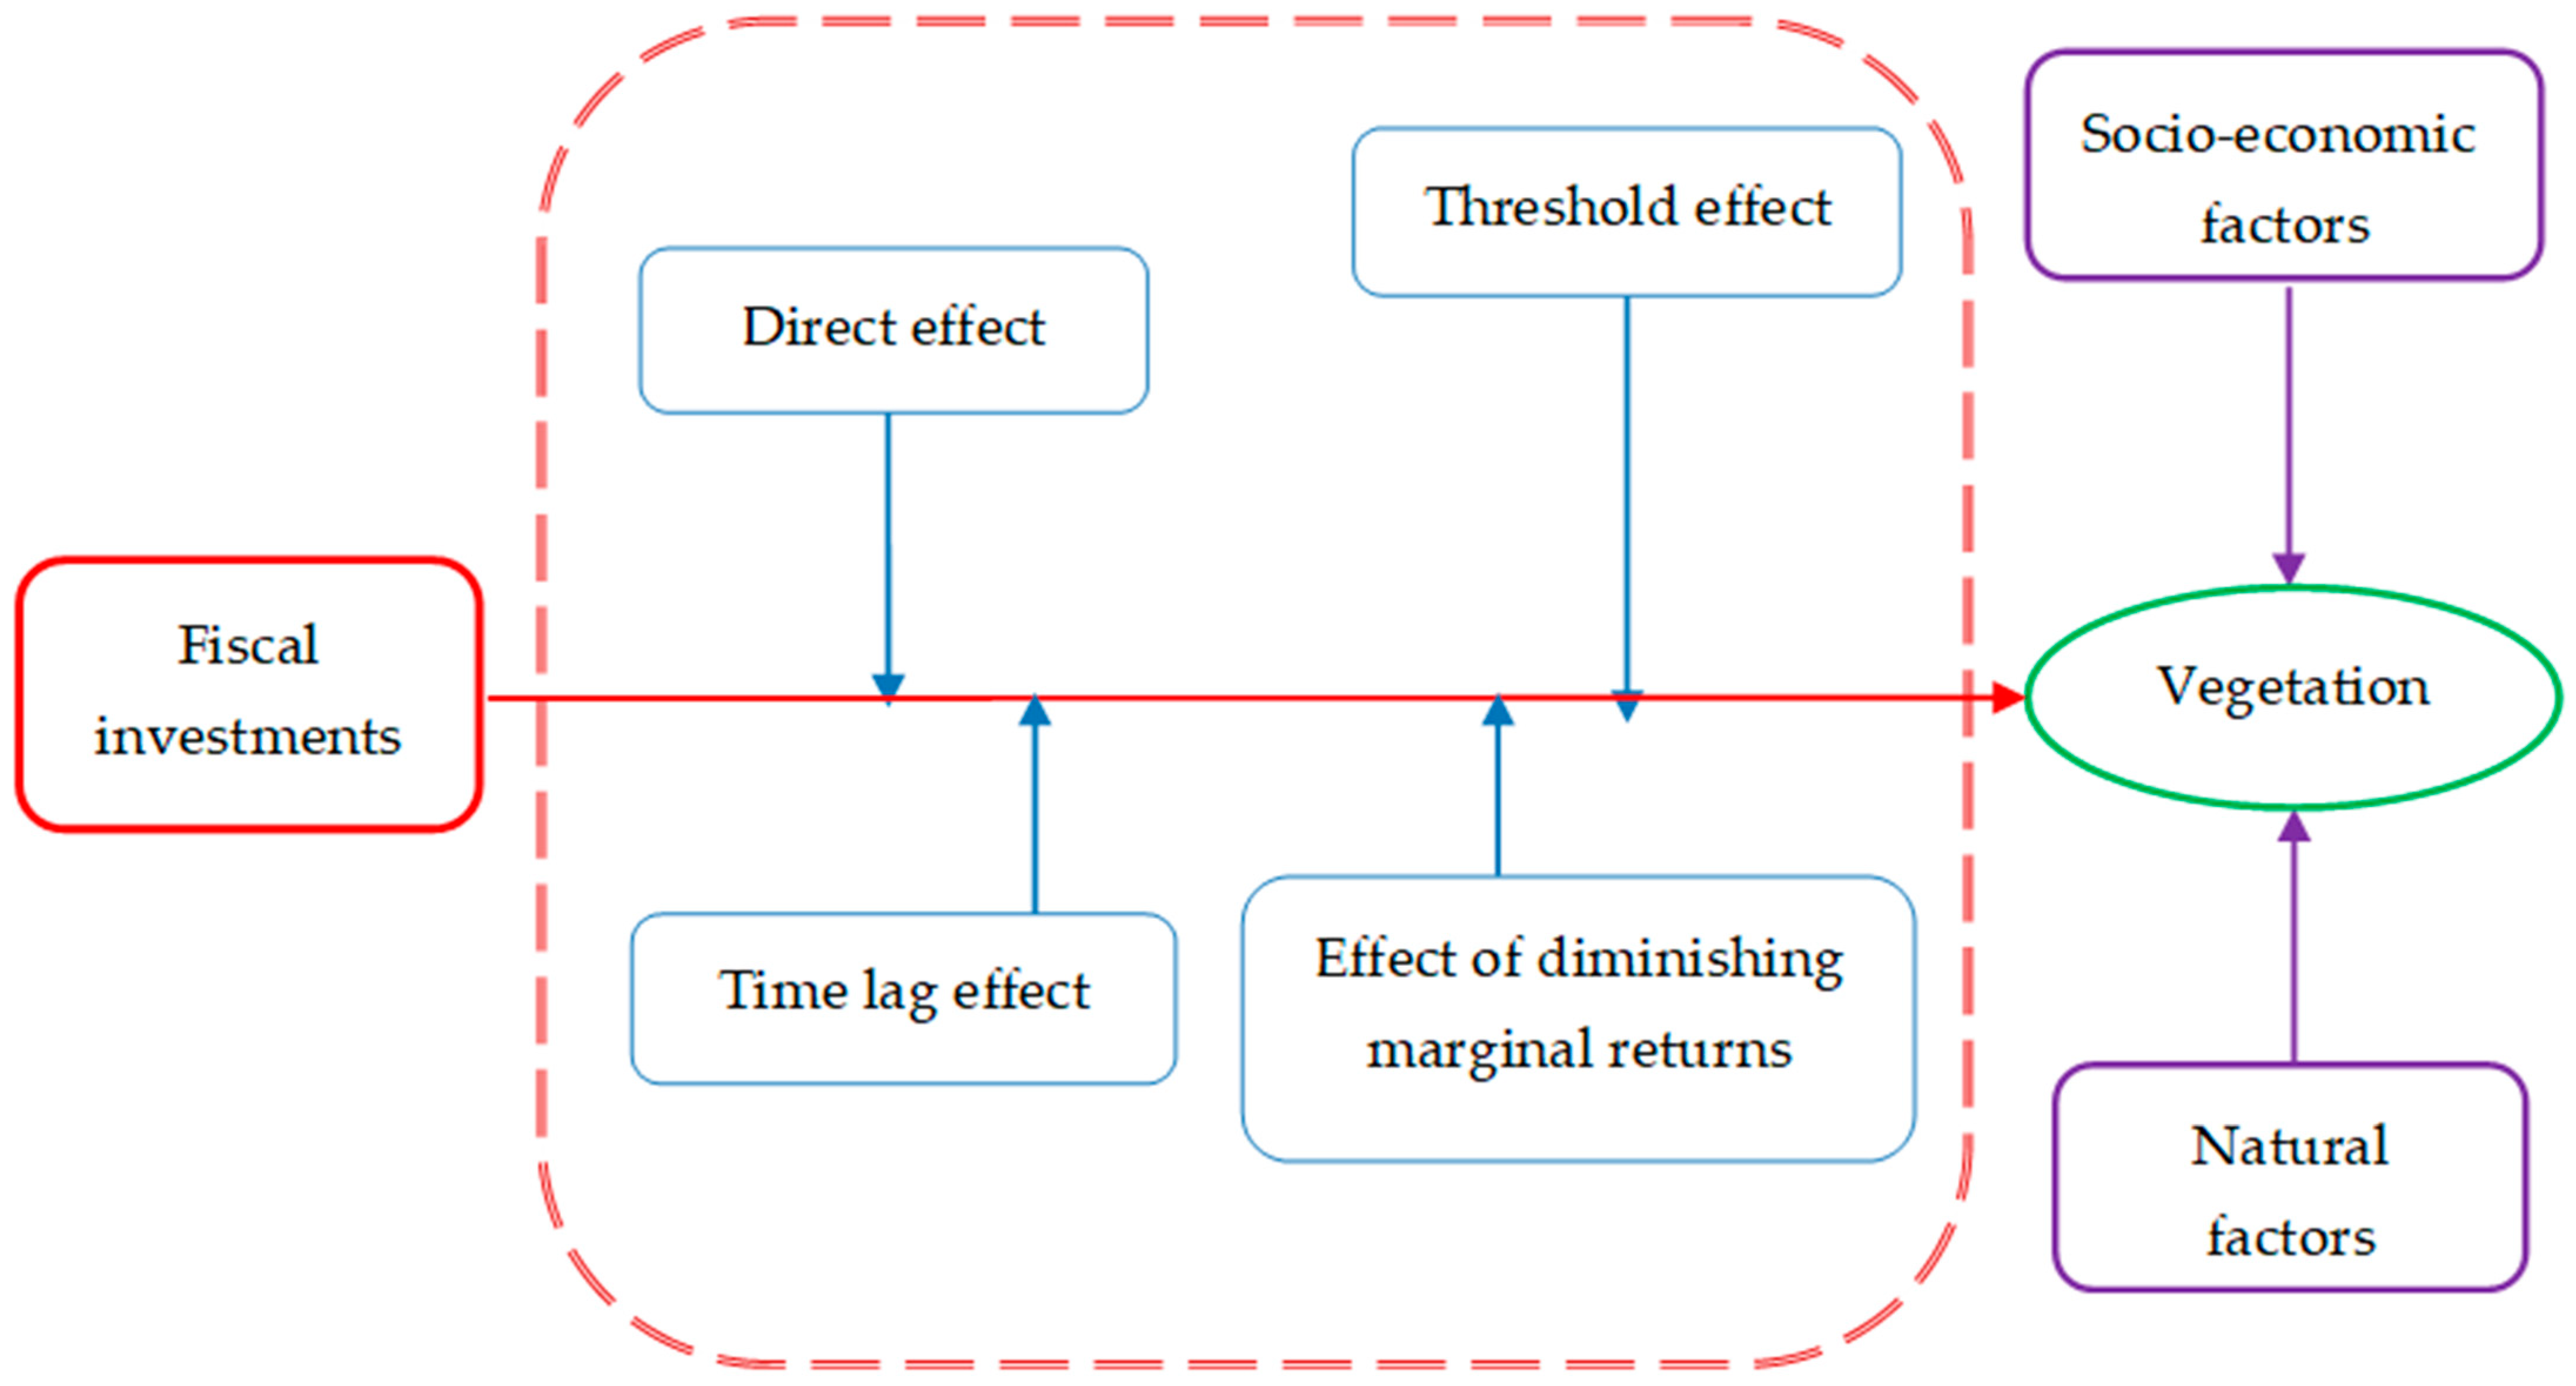
2. Theoretical Analysis

It is vital to build a reasonable theoretical model for ensuring the accuracy of the results of econometric models. Therefore, we explain the theoretical model in three parts: the selection of the dependent variable, the impact mechanism of the core variable on the dependent one (research hypotheses), and the selection of control variables (Figure 1).
(1) The selection of the dependent variable. The main purpose of SLCP is to control soil erosions by converting the sloping farmland to forest land to increase surface vegetation cover [13]. Vegetation restoration has been widely accepted to regulate runoff, conserve soil and water, and prevent land degradation in the world [27,28,29,30]. The vegetation cover negatively correlates with sediment (such as mud, sand, or silt) generation among various vegetation types [27] owing to its ability to intercept raindrops and absorb kinetic energies significantly [28,31] through its stratified structure, especially in the near ground layers [29]. In addition, the vegetation cover can also effectively reduce soil erosions by reducing the transport capacity of water flows [27,30]. It is difficult to obtain the multi-period and continuous observation data of soil erosions, and alternatively, the ecological effects of SLCP can be observed by the changes in vegetation cover in a specific period at the landscape level [11,12,13]. The vegetation is an important indicator of regional ecological or environmental changes, influenced mutually by ecological restoration policies, socio-economic factors, and natural factors [11,12,13]. The normalized differential vegetation index (NDVI) can indicate the vegetation changes on a large spatial and temporal scale and is applied for the detection of vegetation changes in quantities [10,11,12,13]. We thus selected the annual average NDVI of a county as the dependent variable in our econometric models.
(2) The impact mechanism of the core variable on the dependent one. As for an ecological restoration policy, the SLCP might be the most notable driving force of vegetation changes due to the large amounts of fiscal investments by the Chinese government since 1999 in the Loess Plateau [10,12]. As scarce input elements, the capital or investment would affect the output in certain ways. Some previous studies found that forestry fiscal investments in the national forest parks of China have little or even negative impacts on tourism efficiency [32,33]. Hence, the direct effect of fiscal investments of SLCP on vegetation restoration may be negative (Hypothesis 1). On the contrary, the capital or investment exhibits a time lag effect, that is, contemporary investment or capital can promote outputs significantly and positively in the future [7,33]. The growth in canopy biomass of newly afforested stands shows generic features of non-linear dynamics [34,35], and the SLCP’s ecological effects would peak at 5–8 years after planting in the Loess Plateau [13,36]. Therefore, we speculate that the fiscal investments would have a time lag effect markedly on the revegetation (Hypothesis 2). In addition, the capital or investment effects will also be constrained by the law of diminishing marginal returns in the production process, and once other input factors are fixed, the marginal return of the capital will decline with capital increases [37]. Although the scale return of public investment and private investment are constant, the marginal return of public investment is decreasing, when the private investment does not increase and the public investment increases. In addition, it would waste public investment when the marginal return of public investment is less than its marginal cost [38]. As an important public good, Chinese forestry is mainly led by the government and undertakes the joint mission of ecological construction and economic production. Excessive fiscal investments in China’s forestry have resulted in a decline in its efficiency and there is a reasonable investment scale to improve the fiscal efficiency [39]. Hence, we propose an inverted U relationship between the fiscal investments of SLCP and the vegetation cover (Hypothesis 3). Furthermore, the SLCP is generally implemented in regions with poor ecological endowment or environmental quality in the Loess Plateau, such as areas with serious land degradation and soil erosion [6]. The vegetation cover is strongly correlated with the cumulative afforestation areas in the Northern Shaanxi Plateau [40]. In addition, significant increases in NDVI are seen in loess hilly and gully regions where the vegetation is scarce and land degradation is serious [41]. Nevertheless, most of the vegetation degradation is observed in the Huanglong County and Huangling County. There are many mountains and hills where large areas of natural secondary forests have been preserved [40,42]. Therefore, the ecological effects of SLCP might be adjusted by the initial ecological endowment in different zones and the ecological effects of SLCP might decrease with a better initial ecological endowment (Hypothesis 4). That is, the ecological effects of fiscal investments in SLCP would exhibit a threshold on initial ecological endowment. Indeed, the vegetation cover can not only indicate land degradation degree but also ecological or environmental quality [40,43]. To observe the differences in ecological effects of fiscal investments, we use annual average NDVI with one lag period to represent the initial ecological endowment as a threshold variable in our panel threshold model.
(3) The selection of control variables. As for the control variables, we use the gross domestic product (GDP) and population density of a county as the socio-economic factors [11,13] and average annual precipitation, surface temperature, wind speed, and sunshine as the natural factors [11,12,13,43,44] in our econometric models based on the previous studies. The GDP might impact the environment quality nonlinearly, which is similar to the environmental Kuznets curve [45]. Generally speaking, the government or residents are more willing to sacrifice the ecological environment in exchange for GDP growth when GDP is scarce. However, when GDP reaches a certain scale, the government or residents use ecological environment governance to obtain better ecological products or services. Therefore, with the growth of GDP, vegetation shows a characteristic decreasing trend initially, followed by an increasing trend. Thus, we introduce a quadratic term of logarithmic county GDP into econometric models. On the one hand, the increase in population density would lead to the expansion of construction land and result in a decrease in surface vegetation. On the other hand, the increase in population density would require more cropland for urban and rural construction at the expense of forest or grassland to a large extent [10]. The SLCP is mainly implemented in arid and semi-arid areas of northwest China, and the precipitation becomes a key factor for vegetation growth [43]. Abundant precipitation can improve the local soil environment, increase soil nutrients, and ensure the necessary water for vegetation growth [12]. Thus, precipitation would positively affect the vegetation. Vegetation growth is a process of carbon accumulation relying on photosynthesis. A higher temperature would increase the photosynthetic efficiency of vegetation and is probably beneficial to vegetation growth [44]. The increased wind speed would result in the weathering and sandification of soil and rock and accelerate the desertification process in the northwest of China [12]. It might impact the vegetation adversely. Moreover, higher sunshine durations could aggravate water evaporation and probably contribute negatively to the vegetation [43]. It should be noted that some time-invariant variables, such as slope, aspect, and elevation, are also important driving forces of vegetation. We also consider these variables although they are not individually displayed in the panel fixed effects model.

3. Materials and Methods

3.1. Study Area

Shaanxi Province is located in the northwest of China (105°29′−111°15′ E, 31°42′−39°35′ N) and spans the Yangtze River and Yellow River basins. The terrain in the north and south is relatively higher than that in the middle, with an average elevation of 1127 m and a total area of 206 thousand km2 (Figure 2). Shaanxi Province is divided into three major regions including the Northern Shaanxi Plateau, the Guan Zhong Plain, and the Qinba Mountain Areas by Bai Mountains and the Qinling Mountains. The average annual temperature of Shaanxi Province is 11.6 °C, and the average annual precipitation is 653 mm [46]. Although most of Shaanxi Province experiences continental monsoon climate, the climate differences are obvious due to its terrain and latitude.
To control soil erosions by improving the vegetation, China implemented the SLCP in Shaanxi Province in 1999. Shaanxi Province has implemented two rounds of SLCP. During the first round of SLCP from 1999 to 2006, Shaanxi Province arranged afforestation in sloping farmlands, barren mountains, and wastelands. To consolidate the first round of afforestation achievements, Shaanxi Province continued to arrange afforestation from 2007 to 2015 according to the notice on improving the SLCP delivered by the central government of China [47]. By the end of 2018, Shaanxi Province had completed afforestation tasks of 2.689 million hm2, including 1.241 million hm2 afforestation converted from farmland, 1.288 million hm2 afforestation on barren mountains, and 0.16 million hm2 afforestation on closing hillsides [48]. In 2019, the forest coverage rate of Shaanxi Province had increased to 43.06% while it was only 32.6% in 1999, and the stock of stumpage had exceeded 510 million m3. The number of sandstorm days decreased from 66 days to 24 days in the Northern Shaanxi Plateau [48].

3.2. Method

3.2.1. Panel Fixed Effect Model

The panel fixed effect model can control time-invariant and region-specific variables. Since it reduces endogenous biases raised from unobserved covariates, estimators are considered to be relatively consistent [10,13].
n d v i i t = α 1 i n v e s t i t + α 2 ln g d p i t + α 3 ln g d p 2 i t + α 4 d e n p e o i t + α 5 p e r i t + α 6 t e m p i t + α 7 w i n d i t + α 8 s u n i t + α 9 l ag n d v i i t - 1 + μ i + ε i t
where ndvi is the vegetation, invest indicates fiscal investments of SLCP, gdp represents the gross domestic product in a county and gdp2 is the square of gdp, denpeo is the population density, per, temp, wind, and sun represent the average annual precipitation, temperature, wind speed, and sunshine duration, respectively, lagndvi is the NDVI with one year lag, α 1 α 9 are coefficients to be estimated, i is the county (or district), t is the year, μ controls county fixed effect, and ε is the random error.

3.2.2. Panel Threshold Model

The panel threshold model does not need to set a nonlinear form of the model, and the sample can determine the threshold value and the number of thresholds [49]. To express it concisely, only a single threshold model is introduced here, as follows:
n d v i i t = β 1 i n v e s t i t I ( l ag n d v i i t 1 < γ ) + β 2 I ( l ag n d v i i t 1 γ ) + β 3 ln g d p i t + β 4 ln g d p 2 i t + β 5 d e n p e o i t + β 6 p e r i t + β 7 t e m p i t + β 8 w i n d i t + β 9 s u n i t + β 10 l ag n d v i i t - 1 + μ i + ε i t
where I (*) represents an indicative function, when the conditions in brackets are achieved, I (*) equals to 1 and otherwise 0, γ is a specific threshold value and can be estimated by the bootstrap method embedded into this model [49], β 1 β 10 are estimators, and the other defined symbols are same as in Equation (1).
Before using the panel threshold model, we need to test the existence of the threshold effect, and further determine the threshold numbers, as well as the specific threshold forms. The threshold existence should be tested according to Hansen’s study [49].

3.3. Data Collection, Processing, and Sources

(1) The periods and samples. Our samples contain a total of 107 counties (or districts) in Shaanxi Province, and the study period spans from 2000 to 2015. Periods before implementation of the SLCP are excluded for the following considerations. First, Shaanxi Province began to implement the SLCP in 1999. A large number of studies have shown that its ecological effects would not emerge until 3–8 years after afforestation [11,13,36]. In addition, the fiscal investment data of SLCP after 2015 are difficult to obtain. Shaanxi Province implemented two rounds of large-scale SLCP at the end of 2015. Hence, we only analyze the data from 2000 to 2015 to match the period of SLCP as we mentioned above.
(2) The dependent variable. The maximum value composite method (MVC) is used to synthesize the annual NDVI data based on the monthly data with the 500 m × 500 m spatial resolution [10,11,12,13]. Moreover, the monthly NDVI raster data were captured from the Geospatial Data Cloud in China [50].
(3) The core independent variable. Fiscal investments of the SLCP in every county are calculated based on the standard of afforestation subsidy, subsidy periods, and afforestation areas. The grain subsidy standard is CNY 2100/hm2 per year in the Yellow River Basin and CNY 3150/hm2 per year in the Yangtze River Basin due to the differences in cultivated land productivity. In addition, farmers participating in the SLCP receive a living subsidy of CNY 300/hm2 per year. There is a one-time seedling fee of CNY 750/hm2 in the year of afforestation. The subsidy periods are 8 years for ecological forests (they are mainly used to reduce soil erosions, purify air, and maintain biodiversity) and 5 years for economic forests (they are mainly used to produce fruits, edible oils, drinks, seasonings, industrial raw materials, and medicinal materials to obtain direct economic benefits). However, many participating farmers still had little opportunity for off-farming employment and livelihood improvements [51], and the Chinese government extended another round of subsidies after the expiration of the first round. In the second subsidy period, the grain subsidy in the Yangtze River Basin and the Yellow River Basin was reduced by half while the annual living allowance remained unchanged. The yearly afforestation area of the SLCP in Shaanxi Province is obtained from the Central and South Forestry Investigation and Planning Design Institute of National Forestry and Grassland Administration of China. The afforestation area of the SLCP has been reported since 1999, including the ecological forest area and economic forest area.
(4) Control variables. The county GDP and population data are obtained from the Shaanxi Regional Statistical Yearbooks (2001–2016), and county area data are calculated using an administrative boundary map of counties in Shaanxi Province using ArcGIS. The nominal variables of afforestation investments and GDP were changed into one based on the relevant price index. The annual precipitation and temperature data are from the resource and environment data cloud platform of the Chinese Academy of Sciences withan1 km × 1 km spatial resolution [52]. The station data on wind speed and sunshine are retrieved from the National Meteorological Science Data Center of China [53]. The raster data of wind speed and sunshine are calculated based on the station data using Kriging interpolation with a resolution of 500 m × 500 m. For matching with the county statistical data, we apply the regional analysis tool of ArcGIS to extract the average values of each natural variable based on the county administrative boundary map. Variable designs and descriptive statistics are reported in Table 1.

4. Results

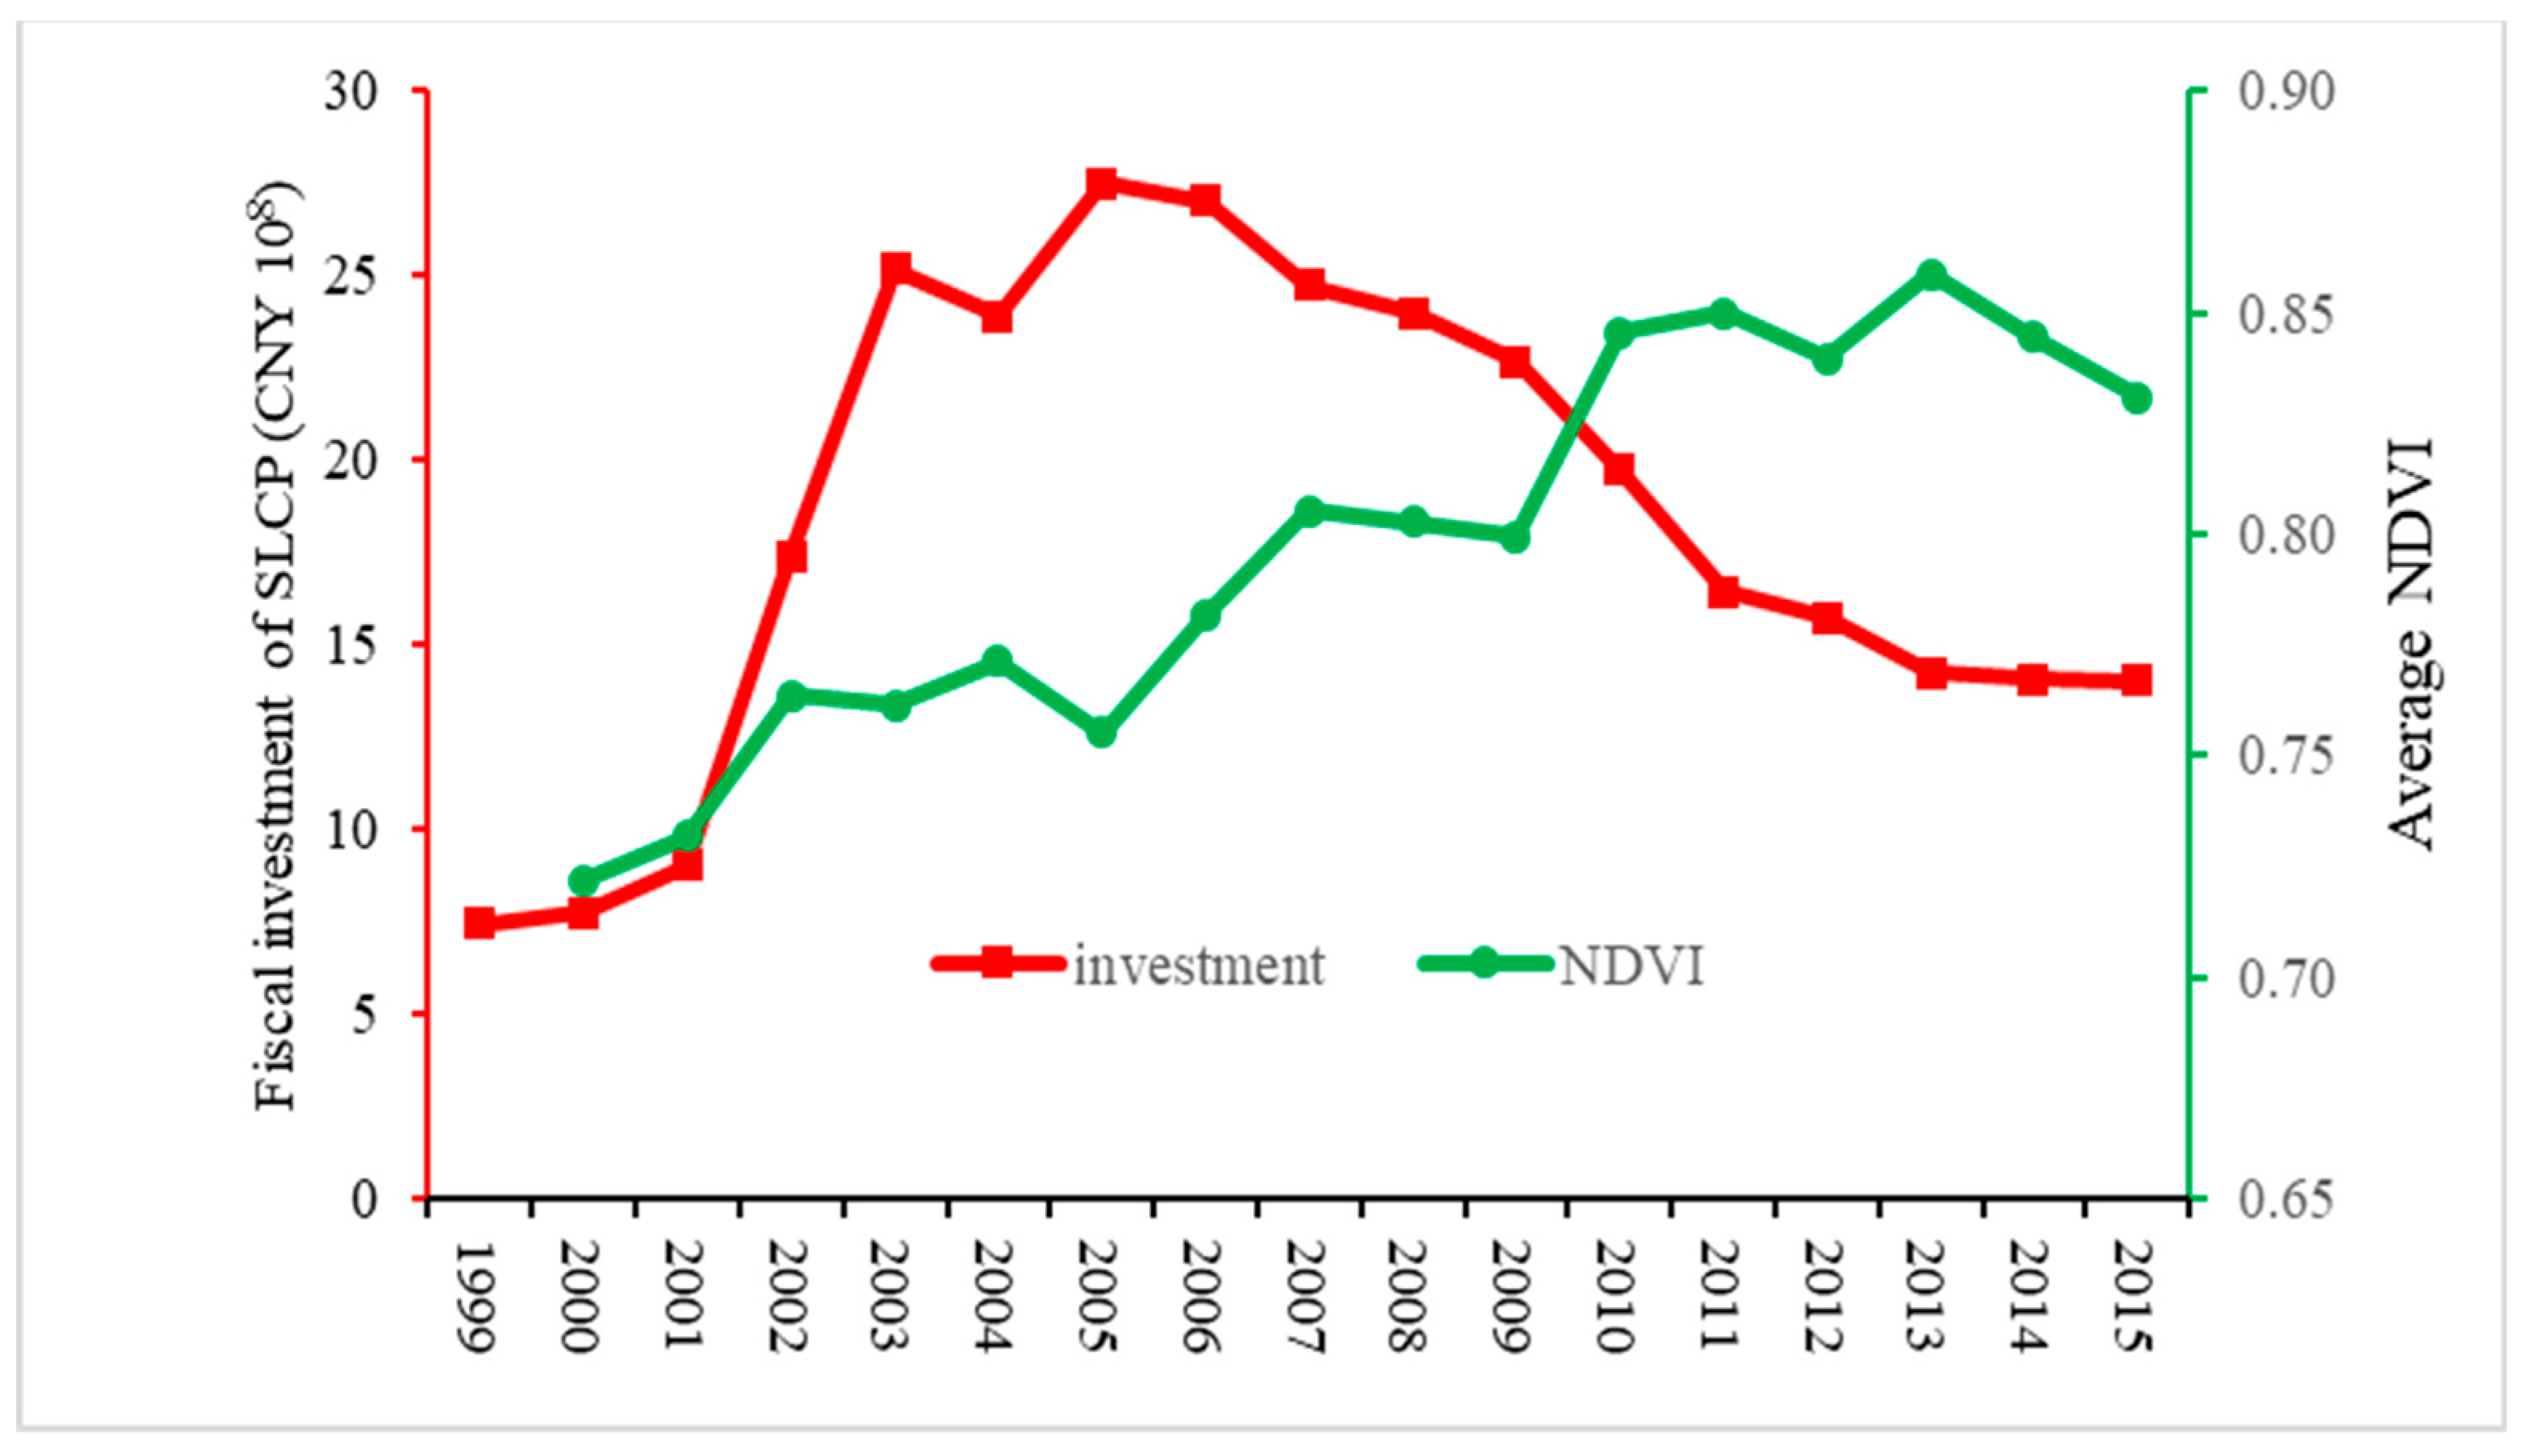
4.1. Changes of Fiscal Investments in the SLCP and Vegetation

CNY 31.070 billion was invested in the SLCP in Shaanxi Province by the government of China from 1999 to 2015, and annual fiscal investments showed an increasing trend initially, followed by a decreasing trend (Figure 3). The changing point of SLCP’s fiscal investments appeared in 2006. From 1999 to 2006, fiscal investments increased from CNY 0.744 billion to CNY 2.7 billion, with an annual increase of 37.59%, while it decreased by 5.43% annually from 2007 to 2015. The SLCP’s afforestation in Shaanxi Province mainly occurred from 1999 to 2006, and there was no large-scale afforestation in the later stage and most of the afforestation subsidies were reduced by half after 2006. In 2015, the average NDVI value of Shaanxi Province was 0.831, an increase of 15.09% since 2000. In 2013, the average NDVI value of Shaanxi Province began to decline after peaking, with an average annual decrease of 1.61%. The correlation between NDVI and fiscal investments was relatively low (−0.0298). It was 0.712 at the 5% significance level when the fiscal investment lag was four years.
Afforestation mainly occurred from 1999 to 2006, and fiscal investments were highly positively correlated with the NDVI four years later. Therefore, we considered 2010 as the demarcation point to detect vegetation change in different stages (Figure 4). After the implementation of the SLCP, the vegetation had been restored and showed an overall greening trend in Shaanxi Province, and the increased areas of NDVI accounted for 93.66% of the total area from 2000 to 2015, especially in the northeast of the Northern Shaanxi Plateau. The vegetation degraded in the center of Guanzhong Plain, northwest of the Northern Shaanxi Plateau and valleys in Hanzhong Basin, and areas with a decreasing trend of NDVI were 13,052.053 km2 (Figure 4a). Greening trends from 2000 to 2010 were better than those from 2000 to 2015 (Figure 4a,b), which indicates that there might have been a decreasing trend of vegetation from 2010 to 2015 (Figure 4c). Furthermore, the area with an NDVI decrease from 2010 to 2015 reached 114,544.586 km2 and accounted for 55.66% of Shaanxi Province. One of the reasons may be that the two-round subsidies of SLCP came to an end after 2010 and farmers might reclaim vegetation for farming [13]. The areas with obvious vegetation degradation were located in the northeast of the Northern Shaanxi Plateau and along the Yellow River, which had experienced the most increases in NDVI from 2000 to 2010 (Figure 4b).

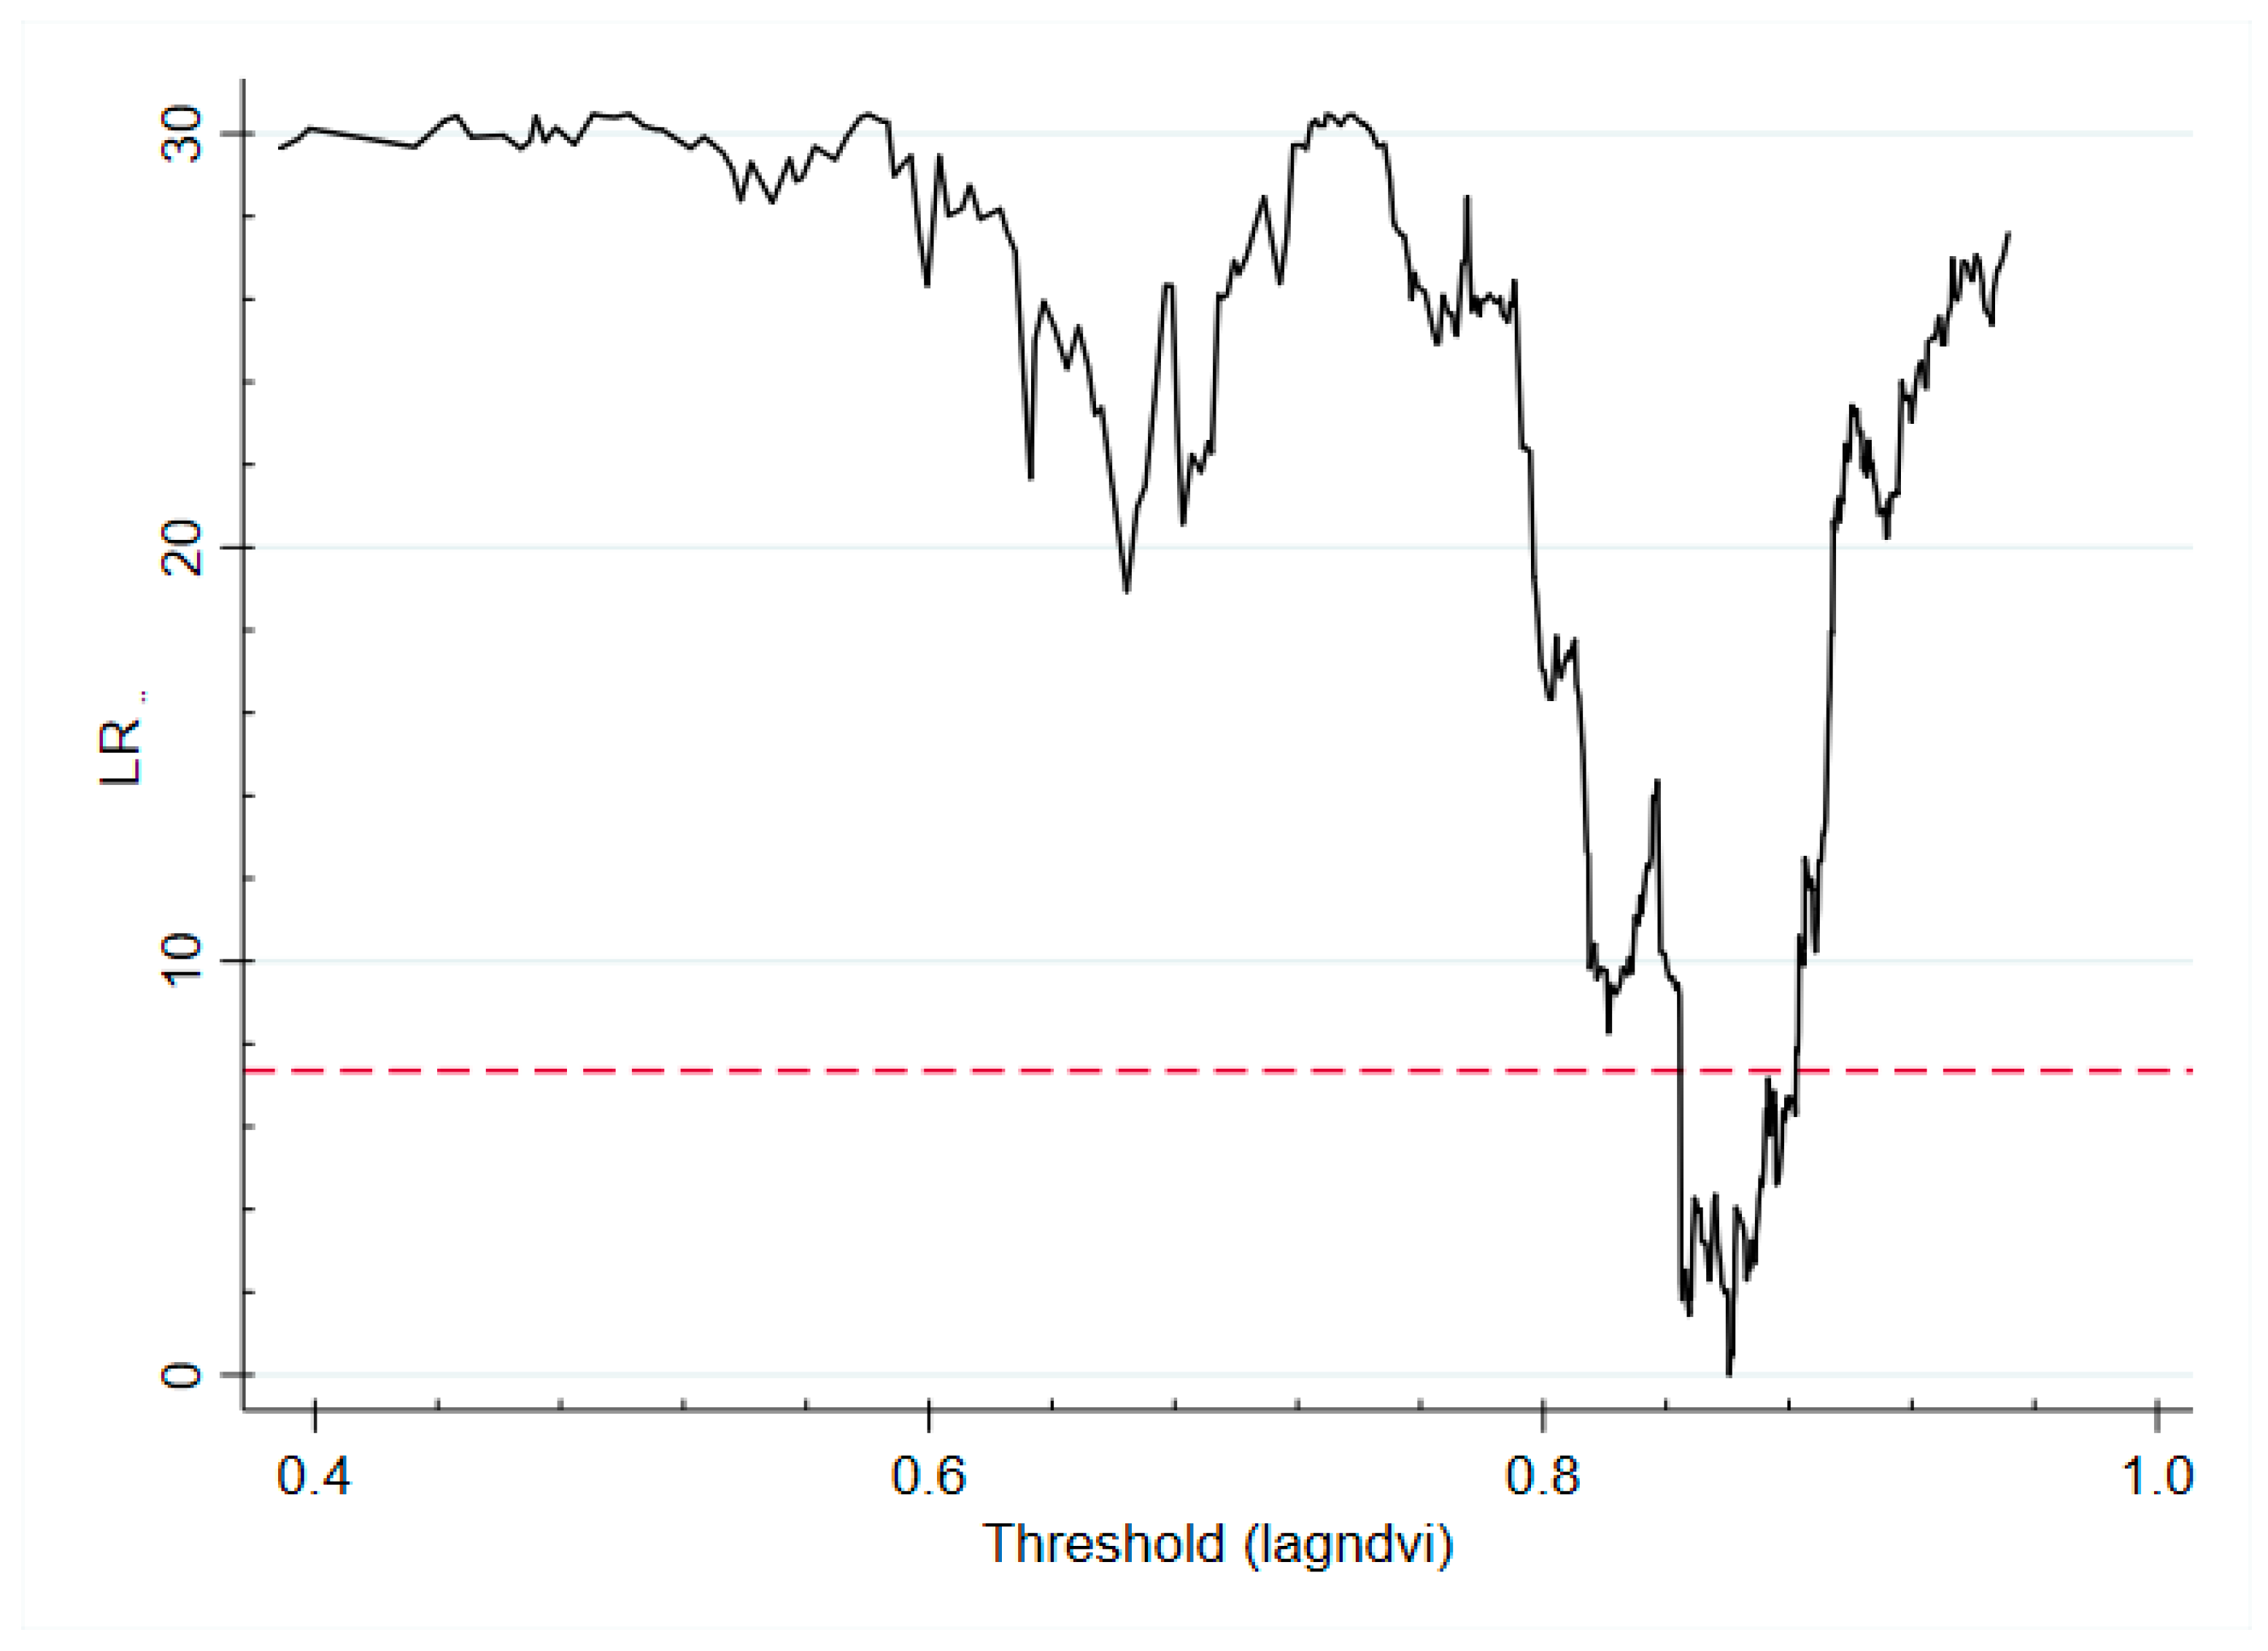
4.2. Threshold Effect Test of Fiscal Investments in SLCP

The single and double threshold models passed the reliability test in a 95% confidence interval (Table 2), and the single threshold and double threshold need to be further identified.
Table 3 shows that the 95% confidence interval width of the estimated value of the single threshold is relatively smaller, only 0.037. Although the double threshold model is significant at the significance level of 1%, the confidence interval width of the two thresholds reaches 0.194 and 0.564, respectively, and it indicates that the thresholds we found might not converge to the real threshold value. Hence the single threshold model is used in the following analysis.
Finally, we identified the existence of a single threshold by the likelihood ratio (LR) test (Figure 5). The LR intersects the red dotted line, indicating that a single threshold is significant at the significance level of 95%. We could infer that a single threshold estimator is close to the real one.

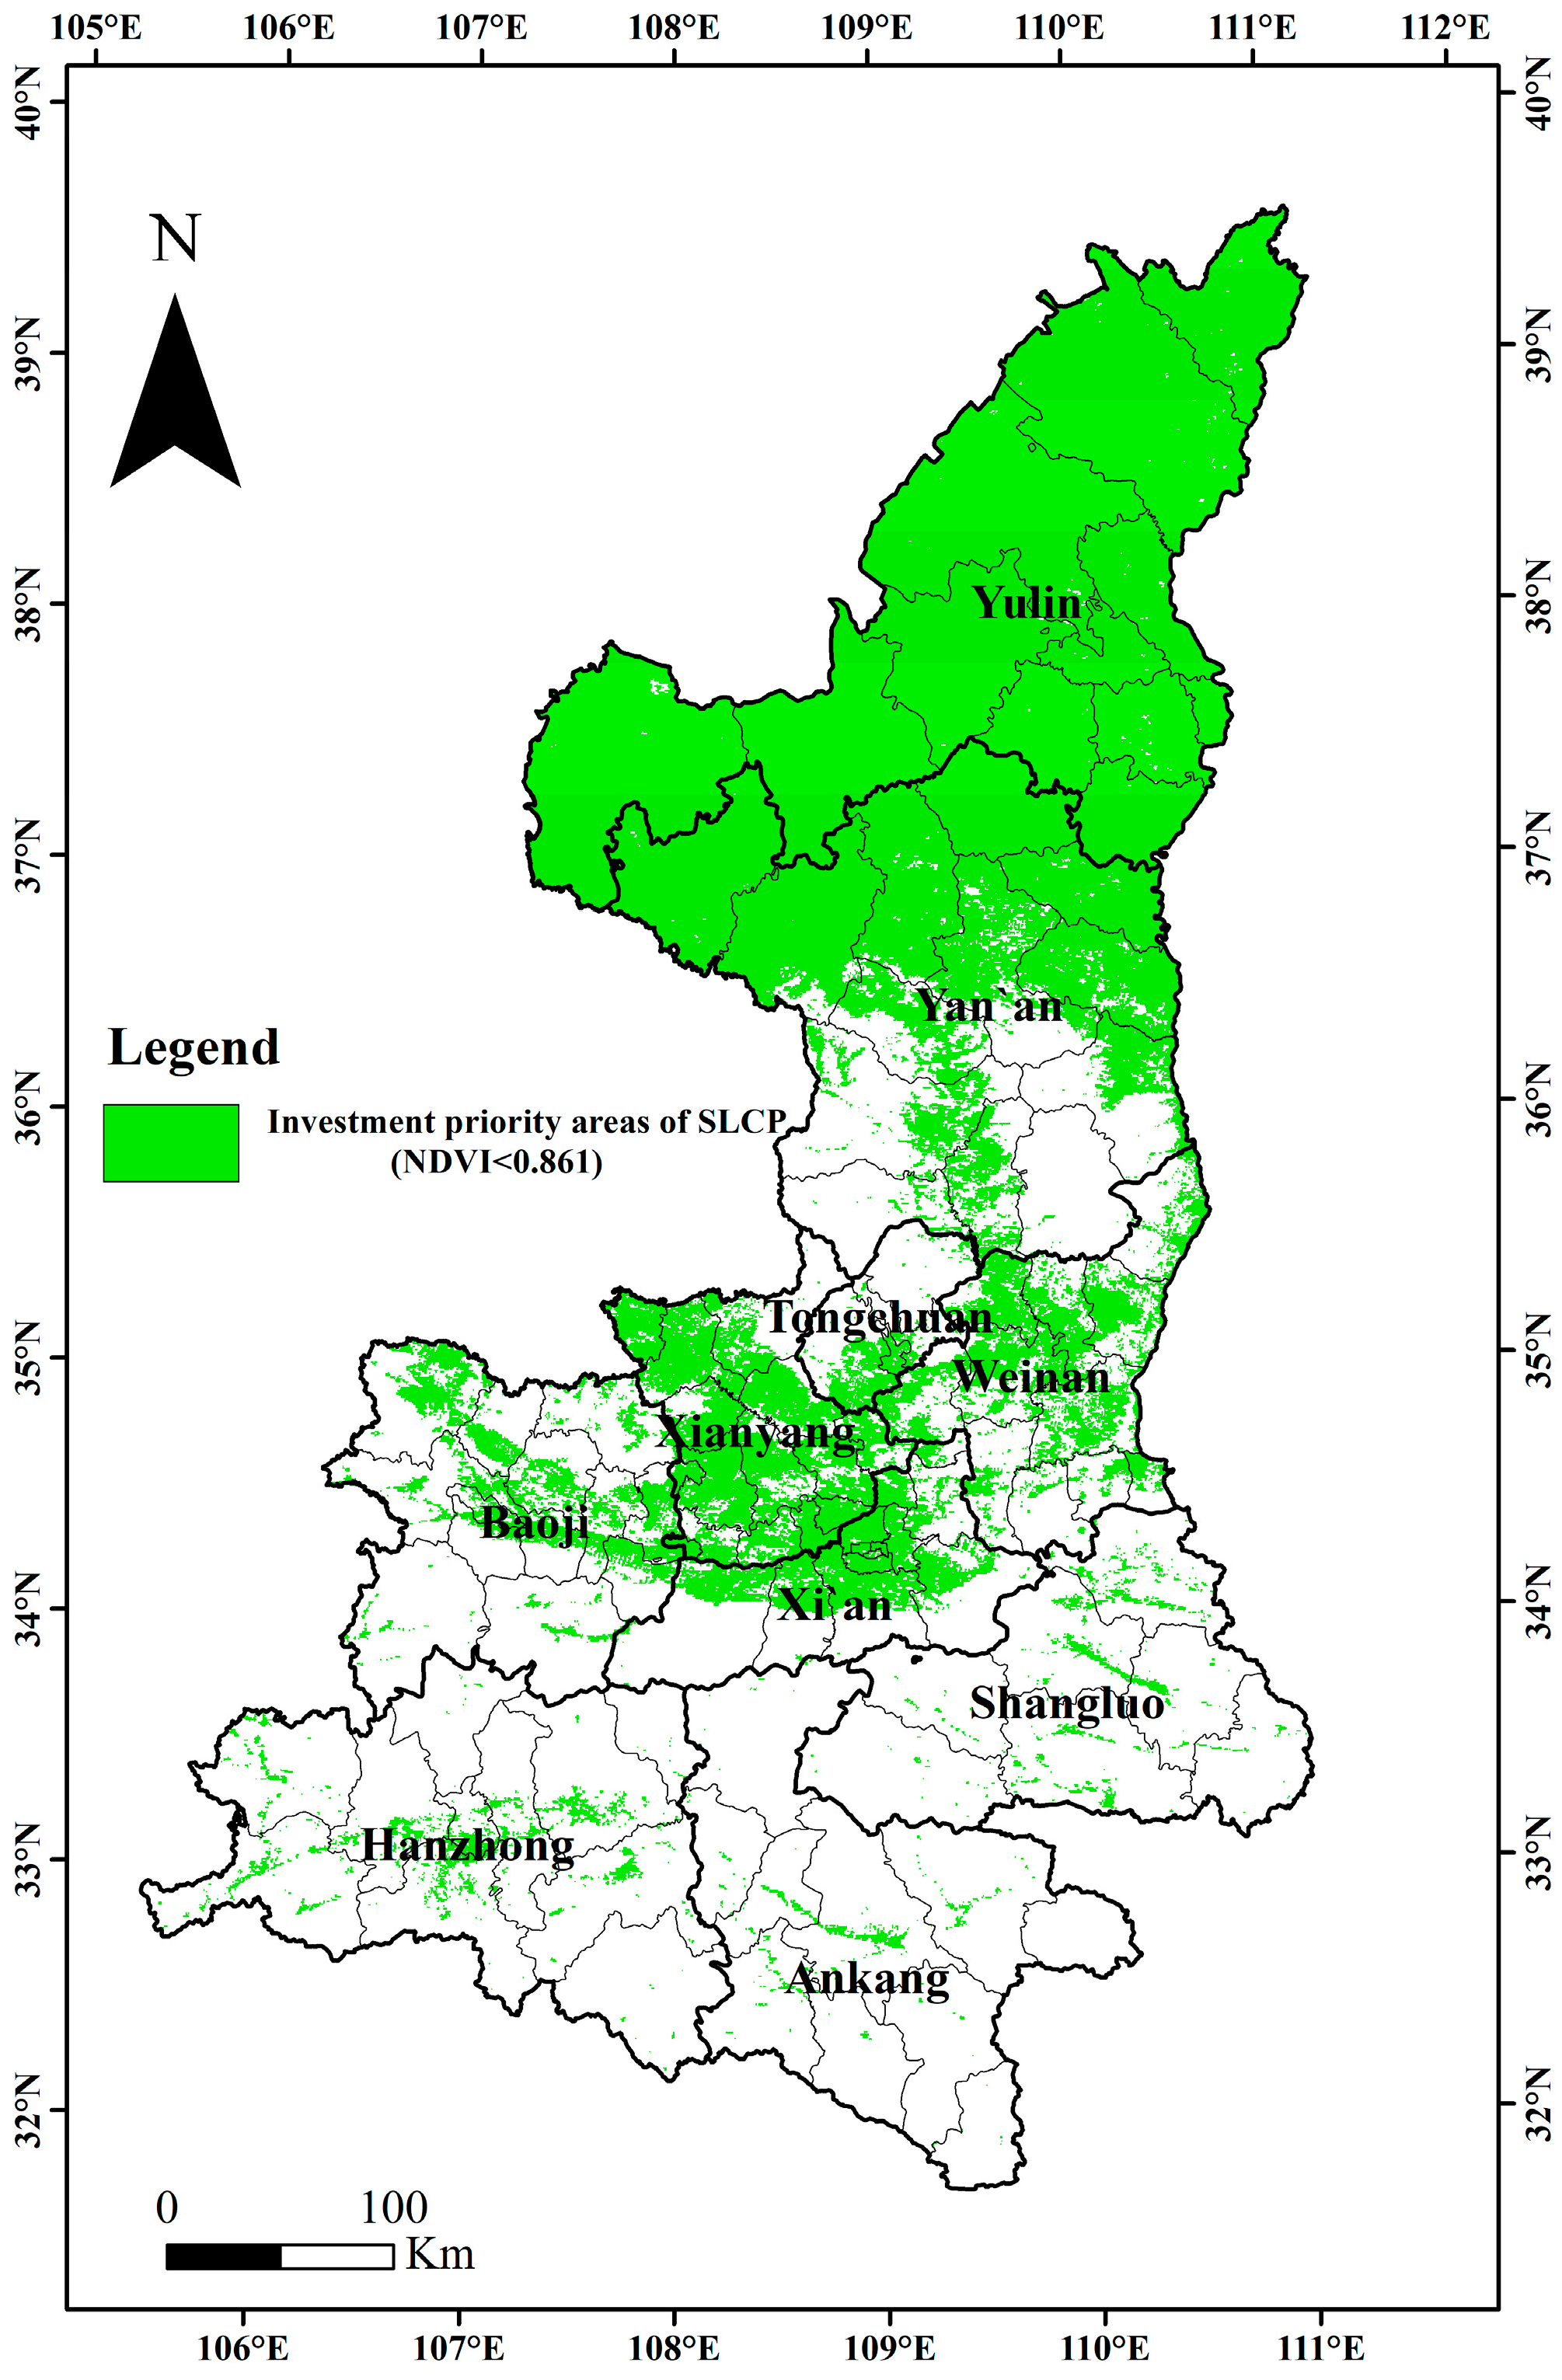
4.3. Assessing Ecological Effects of Fiscal Investments in the SLCP

In this paper, we applied a panel fixed model and a panel threshold model to detect the ecological effects of fiscal investments in SLCP on vegetation (Table 4). The panel fixed effect model was used to study the direct effect, time lag effect, and diminishing marginal returns effect of fiscal investments, as shown in model (1), model (2), and model (3), respectively. The panel threshold model was applied to study the threshold effect of fiscal investments in SLCP and determine the investment priority areas of SLCP in model (4).
Model (1) tests the direct effect of the fiscal investments of SLCP. The current fiscal investments of SLCP have a significant and negative direct impact on NDVI (hypothesis 1). On the one hand, afforestation in the seedling stage can hardly produce an immediate positive impact on NDVI. On the other hand, NDVI experiences a sudden decrease due to weeding out of crops. Overall, afforestation measures reduced the original vegetation coverage and the converted sloping land needed a gradual greening period [13].
Model (2) shows the time lag effect of the fiscal investments in SLCP (hypothesis 2). To measure the time lag effect of fiscal investments, we introduced the lag term of fiscal investments in our model. In general, the ecological effects first increased and then decreased with the natural process of vegetation growth [36]. Therefore, the maximum marginal contribution method was used to detect the reasonable lag period. When the fiscal investments of the SLCP lags to the fourth period, its marginal contribution to NDVI reached the maximum, as shown in model (2). The average marginal contribution of the fiscal investments of the SLCP to vegetation was 0.1022/CNY 100 million yearly. That is to say, the NDVI value increased by 0.1022 with an additional CNY 100 million of fiscal investments in the project.
The effect of the diminishing marginal returns of the fiscal investments in SLCP is shown in model (3) (hypothesis 3). According to production theory, capital as an input factor followed the law of diminishing marginal returns [37]. Hence, we introduced the square term of the fourth lagged fiscal investments in SLCP and found that the impact of the fiscal investments on the NDVI had an inverted U-shape and conformed to the law of diminishing marginal returns. With the increase of fiscal investments, its marginal contribution to vegetation showed a downward trend. The optimum investment scale was CNY 139.92 million/county yearly according to the inverted U-shaped relationship.
Finally, we showed the threshold effect of the fiscal investments in the SLCP in model (4) (hypothesis 4). The SLCP was implemented in areas with relatively poor ecological or environmental quality. Thus, the one-period lagged NDVI was added to the panel threshold model as the threshold variable of fiscal investments. It showed that the marginal return of fiscal investment was 0.1238/CNY 100 million when the initial NDVI was less than 0.861, while it was only 45.64% of the former with an initial NDVI more than 0.861. Therefore, the fiscal investments of SLCP in areas with poor environmental or ecological quality were more effective than those in areas with a better ecological endowment.
We further used an NDVI value of 0.861 to recognize the investment priority areas of Shaanxi Province (Figure 6). The priority area of fiscal investments was mainly distributed in most of the Yellow River Basin and the narrow and long valley of the Yangtze River Basin with a total area of 90,239 km2, accounting for 43.89% of the total area of Shaanxi Province. The sub-optimal investment areas of SLCP were mainly distributed in most areas of the Yangtze River Basin and the central and southern regions of Yan’an City, with a total area of 115,363 km2 accounting for 56.11% of the total area of the whole province.
As for the control variables, the influencing directions of county GDP, population density, NDVI with a one-year lag, annual average precipitation, and annual average temperature were consistent with our expectations. The county GDP impacts on the vegetation with an inverted U-shape whereas population density had a significant and negative effect. In addition, the effect of NDVI with a one-year lag on the vegetation was positive, a 100 mm increase in the annual average precipitation increased the NDVI value by 0.00483, and a 1 °C increase in the annual average temperature increased the NDVI value by 0.0087 (model (4)). However, the NDVI was insensitive to annual average wind speed and annual average sunshine hours as revealed by our models.

5. Discussion

Our study assessed the ecological effects of fiscal investments in the SLCP based on cost-effectiveness. Compared with previous studies, fiscal investments can better reflect the integrity and sustainability of SLCP and cost-effective [5,7,15,18] than afforestation areas or land transition areas [1,11,12,13]. In addition, the panel fixed effect model can effectively control variables that do not change over time, reduce estimation errors, and observe dynamic ecological effects of SLCP compared to the statistical analysis, geographically weighted regression, and ordinary least squares [8,11,12,13,40,42,43]. We also use the panel threshold model to identify the investment priority zones based on cost-effectiveness instead of environment-effectiveness [13,40,41] and improve the spatial target of PES [26,54].
Most studies indicate that the ecological effects of the SLCP can hardly be observed immediately but show a dynamic trend. More often than that, the SLCP has a negative indirect effect on vegetation, but positive ecological effects begin to appear with vegetation growth, namely, it has a time lag effect of SLCP’s investments. In the planting seedling stage, the vegetation was damaged artificially, and then gradually recovered [10,13]. Li et al. found that the ecological effects are prominent 5–8 years after afforestation [36]. Our study further shows that it indeed requires a shorter period of 4 years after planting to achieve the maximum marginal contribution of the fiscal investments to NDVI from the perspective of cost-effectiveness. However, vegetation degradation occurred in the later stage of the project once subsidies were suspended [13]. Meanwhile, the SLCP’s investments followed the law of diminishing marginal returns in the process of ecological restoration. Identifying the average investment scale of SLCP based on the law of diminishing marginal return improved its cost-effectiveness with a constant technical level. Furthermore, the optimum investment scale was CNY 139.92 million/county yearly, calculated according to the law. Finally, it is necessary to implement differentiated ecological restoration strategies based on natural conditions and payment standards based on the threshold effect of afforestation investment. The payment standard of China’s SLCP was based on the opportunity cost of the converted arable land irrespective of the cost-effectiveness of fiscal expenditure [6]. Qian et al. found that newly planted trees in the Yangtze River Basin may have grown faster and improved vegetation coverage conditions more quickly than in the Northern Shaanxi Plateau because of its relatively humid and warmer climate [13,42]. They thus inferred that the afforestation priority should be in the Yangtze River Basin instead of the Northern Shaanxi Plateau, although they emphasized the significance of afforestation in the Northern Shaanxi Plateau. Our results indicated that this misleading assertion may result from their inattention to cost-effectiveness. We emphasized the importance of a cost-effectiveness perspective in policy design and evaluation.
Compared with the Yangtze River Basin, the implementation of SLCP might be more cost-effective in the Yellow River Basin [10]. Two reasons may explain the relatively higher efficiency of fiscal investments in the Yellow River Basin. On the one hand, the afforestation subsidy per hectare is relatively lower in the Yellow River Basin, accounting for 69.56% of the Yangtze River Basin’s. On the other hand, the ecological quality of the Yellow River basin is relatively poor, and its average NDVI was 0.66 in 2000, only 75.98% of that in the Yangtze River Basin. Under the current undifferentiated payment system, the Yellow River Basin should be identified as the priority investment area for ecological restorations. Ecological constructions in the Yangtze River Basin should be led by natural vegetation restoration with necessary artificial intervention, otherwise its subsidy standard should be reduced to improve fiscal efficiency. It is worth noting that although Huangling County and Huanglong County are located in the Yellow River Basin, they have abundant natural secondary forests in mountains and hills, and their vegetation is more likely disturbed by excessive human intervention [42]. In addition, the vegetation is not only affected by afforestation and reforestation but also by climate conditions and their interactions [55]. Increasing temperature will increase the photosynthetic efficiency of vegetation, but it will also aggravate the drought in arid and semi-arid areas [43,44]. Therefore, optimized afforestation payment plans may be revised again due to the effects of climate change in the future.
Indeed, identifying the investment target of PES calls for cost-benefit and vegetation degeneration risk analysis besides cost-effectiveness [26,54,56]. Cost-benefit analysis should be based on the precise measurement of environmental benefits and investment costs. However, as a representative measure of environmental benefits, the theories and methods of ecosystem service value accounting need to be improved [57]. Undoubtedly, vegetation degeneration risks would decrease the sustainability of PES projects. We found that areas that exhibited better performances from 2000 to 2010 were also the regions where they suffered serious degradations of vegetation from 2010 to 2015 once the subsidy was reduced or suspended [13]. Hence, these zones should be provided with sustained incentives for preventing vegetation degradation. Unlike commodity production with clear and definable input and output factors, the production process of ecosystem services is affected by both natural and social economic factors. The more complex production process would lead to difficulties in calculating the fiscal investment efficiency of SLCP. At present, due to the lack of knowledge about the functions and input-output factors of the ecosystem’s production, conventional efficiency assessment methods, such as data envelopment analysis and stochastic frontier analysis, are likely to fail in the calculation of ecological efficiency [58]. Although our study examines the impact mechanism of SLCP’s fiscal investment on vegetation restoration, it is difficult to evaluate the cost-benefit of smaller units more comprehensively. Further studies can take this study as a foundation and dedicate it to building an integrated framework comprising conventional production theory and ecosystem service value.

6. Conclusions

This paper assessed the ecological effects of fiscal investments in the SLCP and optimized afforestation investment based on cost-effectiveness in Shaanxi province of China. The SLCP’s fiscal investments have a time lag effect. Its ecological effect gradually became obvious, and the marginal contribution peaked in the fourth year after the implementation of the SLCP and then began to decline. In addition, the fiscal investments of SLCP also followed the law of diminishing marginal returns. After introducing the quadratic term of fiscal investments, its marginal contribution to vegetation decreased when the investment increased, and the optimal investment scale was CNY 139.92 million/county yearly. Moreover, the ecological effects of fiscal investments of SLCP were also adjusted by initial ecological endowment and showed a threshold as well. When the NDVI value was less than 0.861, the marginal ecological contribution of CNY 100 million investment was 0.1238. Otherwise, it was only 0.0565/CNY 100 million, about 45.64% of the former.
Although it significantly improved the whole vegetation restoration, the fiscal investments of SLCP have an obvious path dependence. First, we should take into account the investment lag phases, the investment scale, and the investment priority zone to improve the ecological efficiency of SLCP. Moreover, it should consider the long-term investment return instead of short-term benefits in order to achieve SLCP’s sustainability. Second, policy makers should consider the appropriate investment scale to avoid excessive or insufficient investments. Finally, the investment priority zones should be selected depending on the ecological quality, and it is economically beneficial to invest in the areas with poor initial ecological quality while restoring vegetation naturally in the areas with a better initial ecological quality.

Author Contributions

Conceptualization, Z.D., W.H. and S.Y.; methodology, software, validation, formal analysis, visualization, data curation, writing—original draft preparation, Z.D., X.Z. and Y.H.; writing—review and editing, Y.H. and S.L.; supervision, S.Y. and X.Z.; funding acquisition, Z.D., W.H. and S.Y. All authors have read and agreed to the published version of the manuscript.

Funding

This research was funded by the National Natural Science Foundation of China (No. 72303099), the Major Project of the National Social Science Foundation of China (No. 23ZDA105), the Key Project of the Open Competition in Jiangsu Forestry (No. LYKJ[2022]01), the Performance Evaluation and Impact Mechanism of Ecological Space Integrated Management in the Yellow River basin of Shaanxi Province (No. 2022JQ-729), and the Scientific Research Fee for Metasequoia Teachers of Nanjing Forestry University (No. 163060201).

Data Availability Statement

Data are contained within the article.

Conflicts of Interest

The authors declare no conflict of interest.

References

  1. Wang, Y.F.; Yao, S.B. Effects of restoration practices on controlling soil and water losses in the Wei River Catchment, China: An estimation based on longitudinal field observations. For. Policy Econ. 2019, 100, 120–128. [Google Scholar] [CrossRef]
  2. Uzuner, Ç.; Dengiz, O. Desertification risk assessment in Turkey based on environmentally sensitive areas. Ecol. Indic. 2020, 114, 106295. [Google Scholar] [CrossRef]
  3. Pagiola, S.; Arcenas, A.; Platais, G. Can payments for environmental services help reduce poverty? An exploration of the issues and the evidence to date from Latin America. World Dev. 2005, 33, 237–253. [Google Scholar] [CrossRef]
  4. Sánchez-Azofeifa, G.A.; Pfaff, A.; Robalino, J.A.; Boomhower, J.P. Costa Rica’s payment for environmental services program: Intention, implementation, and impact. Conserv. Biol. 2007, 21, 1165–1173. [Google Scholar] [CrossRef] [PubMed]
  5. Sierra, R.; Russman, E. On the efficiency of environmental service payments: A forest conservation assessment in the Osa Peninsula, Costa Rica. Ecol. Econ. 2006, 59, 131–141. [Google Scholar] [CrossRef]
  6. Bennett, M.T. China’s sloping land conversion program: Institutional innovation or business as usual? Ecol. Econ. 2008, 65, 699–711. [Google Scholar] [CrossRef]
  7. Lu, Y.; Yao, S.; Ding, Z.; Deng, Y.; Hou, M. Did Government expenditure on the Grain for Green Project help the forest carbon sequestration increase in Yunnan, China? Land 2020, 9, 54. [Google Scholar] [CrossRef]
  8. Deng, L.; Liu, S.; Kim, D.G.; Peng, C.; Sweeney, S.; Shangguan, Z. Past and future carbon sequestration benefits of China’s grain for green program. Glob. Environ. Chang. 2017, 47, 13–20. [Google Scholar] [CrossRef]
  9. National Forestry and Grassland Administration. In the Past 20 Years, 3.43 Million km2 of Farmland Has Been Returned to Forest and Grassland in China; National Forestry and Grassland Administration: Beijing, China, 2019; Available online: http://env.people.com.cn/n1/2020/0630/c1010-31764490.html (accessed on 11 June 2020).
  10. Ding, Z.; Yao, S. Ecological effectiveness of payment for ecosystem services to identify incentive priority areas: Sloping land conversion program in China. Land Use Policy 2021, 104, 105350. [Google Scholar] [CrossRef]
  11. Cheng, P.; Hu, S.; Sun, T.; Chen, H. Effect of Grain for Green Project on vegetation regeneration in Shaanxi Province: Based on PCSE panel data model. Arid. Zone Res. 2018, 35, 1477–1486, (In Chinese with English Abstract). [Google Scholar]
  12. Zhang, D.; Jia, Q.; Xu, X.; Yao, S.; Chen, H.; Hou, X. Contribution of ecological policies to vegetation restoration: A case study from Wuqi County in Shaanxi Province, China. Land Use Policy 2018, 73, 400–411. [Google Scholar] [CrossRef]
  13. Qian, C.; Shao, L.; Hou, X.; Zhang, B.; Chen, W.; Xia, X. Detection and attribution of vegetation greening trend across distinct local landscapes under China’s Grain to Green Program: A case study in Shaanxi Province. Catena 2019, 183, 104182. [Google Scholar] [CrossRef]
  14. Bullock, A.; King, B. Evaluating China’s Slope Land Conversion Program as sustainable management in Tianquan and Wuqi Counties. J. Environ. Manag. 2011, 92, 1916–1922. [Google Scholar] [CrossRef] [PubMed]
  15. Ferraro, P.J.; Kiss, A. Ecology: Direct payments to conserve biodiversity. Science 2002, 298, 1718–1719. [Google Scholar] [CrossRef] [PubMed]
  16. Chen, X.D.; Lupi, F.; Vina, A.; He, G.; Liu, J. Using Cost-effective targeting to enhance the efficiency of conservation investments in payments for ecosystem services. Cons. Bio. 2010, 24, 1469–1478. [Google Scholar] [CrossRef]
  17. Lundberg, L.; Persson, U.M.; Alpizar, F.; Lindgren, K. Context matters: Exploring the cost-effectiveness of fixed payments and procurement auctions for PES. Ecol. Econ. 2018, 146, 347–358. [Google Scholar] [CrossRef]
  18. Uchida, E.; Xu, J.T.; Rozelle, S. Grain for Green: Cost-effectiveness and sustainability of China’s Conservation Set-aside Program. Land Econ. 2005, 81, 247–264. [Google Scholar] [CrossRef]
  19. Ferraro, P.J. Asymmetric information and contract design for payments for environmental services. Ecol. Econ. 2008, 65, 810–821. [Google Scholar] [CrossRef]
  20. Bryan, B.A.; Gao, L.; Ye, Y.; Sun, X.; Connor, J.D.; Crossman, N.D.; Liu, Z. China’s response to a national land-system sustainability emergency. Nature 2018, 559, 193–204. [Google Scholar] [CrossRef]
  21. Ekroos, J.; Olsson, O.; Rundlöf, M.; Wätzold, F.; Smith, H.G. Optimizing agri-environment schemes for biodiversity, ecosystem services or both? Biol. Conserv. 2014, 172, 65–71. [Google Scholar] [CrossRef]
  22. Boyd, J.; Epanchin-Niell, R.; Siikamaki, J. Conservation planning: A review of return on investment analysis. Rev. Environ. Econ. Policy 2015, 9, 23–42. [Google Scholar] [CrossRef]
  23. Wunder, S. The efficiency of payments for environmental services in tropical conservation. Conserv. Biol. 2007, 21, 48–58. [Google Scholar] [CrossRef] [PubMed]
  24. Wünscher, T.; Engel, S.; Wunder, S. Spatial targeting of payments for environmental services: A tool for boosting conservation benefits. Ecol. Econ. 2008, 65, 822–833. [Google Scholar] [CrossRef]
  25. O’Sullivan, O.S.; Holt, A.R.; Warren, P.H.; Evans, K.L. Optimising UK urban road verge contributions to biodiversity and ecosystem services with cost-effective management. J. Environ. Manag. 2017, 191, 162–171. [Google Scholar] [CrossRef] [PubMed]
  26. Wang, F.C.; Zheng, H.; Wang, X.K.; Peng, W.J. Approaches to spatial targeting identification of payments for ecosystem services. Ecol. Environ. Sci. 2017, 26, 176–182. (In Chinese) [Google Scholar]
  27. Wang, Z.J.; Jiao, J.Y.; Rayburg, S.; Wang, Q.L.; Su, Y. Soil erosion resistance of “Grain for Green” vegetation types under extreme rainfall conditions on the Loess Plateau. China. Catena 2016, 141, 109–116. [Google Scholar] [CrossRef]
  28. Geißler, C.; Kühn, P.; Böhnke, M.; Bruelheide, H.; Shi, X.; Scholten, T. Splash erosion potential under tree canopies in subtropical SE China. Catena 2012, 91, 85–93. [Google Scholar] [CrossRef]
  29. Mohammad, A.G.; Adam, M.A. The impact of vegetative cover type on runoff and soil erosion under different land uses. Catena 2010, 81, 97–103. [Google Scholar] [CrossRef]
  30. Chen, H.; Zhang, X.P.; Abla, M.; Lü, D.; Yan, R.; Ren, Q.F.; Ren, Z.Y.; Yang, Y.H.; Zhao, W.H.; Lin, P.F.; et al. Effects of vegetation and rainfall types on surface runoff and soil erosion on steep slopes on the Loess Plateau, China. Catena 2018, 170, 141–149. [Google Scholar] [CrossRef]
  31. Ghimire, C.P.; Bruijnzeel, L.A.; Lubczynski, M.W.; Bonell, M. Rainfall interception by natural and planted forests in the Middle Mountains of Central Nepal. J. Hydrol. 2012, 475, 270–280. [Google Scholar] [CrossRef]
  32. Huang, X.J.; Lin, X.Z. Tourism efficiency and influence factors of Chinese forest parks. Sci. Silvae Sin. 2015, 51, 137–146, (In Chinese with English Abstract). [Google Scholar]
  33. Ding, Z.M.; Huang, X.J. Capital input effects on the tourism efficiency of forest parks in China. Resour. Sci. 2016, 38, 1363–1372, (In Chinese with English Abstract). [Google Scholar]
  34. Ryan, M.G.; Binkley, D.; Fownes, J.H. Age-related decline in forest productivity: Pattern and process. Adv. Ecol. Res. 1997, 27, 213–262. [Google Scholar] [CrossRef]
  35. Tang, J.W.; Luyssaert, S.; Richardson, A.D.; Kutsch, W.; Janssens, I.A. Steeper declines in forest photosynthesis than respiration explain age-driven decreases in forest growth. Proc. Natl. Acad. Sci. USA 2014, 111, 8856–8860. [Google Scholar] [CrossRef] [PubMed]
  36. Li, J.; Wang, X.C.; Shao, M.A.; Zhao, Y.G.; Li, X.F. Simulation of biomass and soil desiccation of Robinia pseudoacacia forestlands on semi-arid and semi-humid regions of China’s Loess Plateau. Chin. J. Plant Ecol. 2010, 34, 330–339, (In Chinese with English Abstract). [Google Scholar]
  37. Paul, K.; Robins, W. Microeconomics, 2nd ed.; Worth Publishers: New York, NY, USA, 2015. [Google Scholar]
  38. Barro, R.J.; Sala-i-Martin, X. Public finance in models of economic growth. Rev. Econ. Stud. 1992, 59, 645–661. [Google Scholar] [CrossRef]
  39. Qi, L.; Zhou, X.L. The analysis of forestry investment efficiency in China: Perspective of climate change. China Soft Sci. 2018, 6, 35–46, (In Chinese with English Abstract). [Google Scholar]
  40. Zhao, A.; Zhang, A.; Liu, J.; Feng, L.; Zhao, Y. Assessing the effects of drought and “Grain for Green” Program on vegetation dynamics in China’s Loess Plateau from 2000 to 2014. Catena 2019, 175, 446–455. [Google Scholar] [CrossRef]
  41. Cao, Z.; Li, Y.; Liu, Y.; Chen, Y.; Wang, Y. When and where did the Loess Plateau turn “green”? Analysis of the tendency and breakpoints of the normalized difference vegetation index. Land Degrad. Dev. 2018, 29, 162–175. [Google Scholar] [CrossRef]
  42. Song, F.; Xing, K.; Liu, Y.; Liu, Z.; Kang, M. Monitoring and assessment of vegetation variation in Northern Shaanxi based on MODIS/NDVI. Acta Ecol. Sin. 2011, 31, 354–363, (In Chinese with English Abstract). [Google Scholar]
  43. Liu, J.; Wen, Z.M.; Gang, C.C. Normalized difference vegetation index of different vegetation cover types and its responses to climate change in the Loess Plateau. Acta Ecol. Sin. 2020, 40, 678–691, (In Chinese with English Abstract). [Google Scholar]
  44. Michaletz, S.T.; Cheng, D.; Kerkhoff, A.J.; Enquist, B.J. Convergence of terrestrial plant production across global climate gradients. Nature 2014, 512, 39–43. [Google Scholar] [CrossRef] [PubMed]
  45. Caravaggio, N. Economic growth and the forest development path: A theoretical re-assessment of the environmental Kuznets curve for deforestation. For. Policy Econ. 2020, 118, 102259. [Google Scholar] [CrossRef]
  46. Wang, Q.; Yao, Y.; Zhao, L.; Yang, C.; Zhao, Y.; Zhang, Q. Enhancing resilience against geological hazards and soil erosion through sustainable vegetation management: A case study in Shaanxi Province. J. Clean. Prod. 2023, 423, 138687. [Google Scholar] [CrossRef]
  47. National Forestry and Grassland Administration. Reply to the Proposal on Continuously Improving the Construction Quality of the Sloping Land Conversion Project; National Forestry and Grassland Administration: Beijing, China, 2023. Available online: https://www.forestry.gov.cn/c/www/gktafw/32488.jhtml (accessed on 5 December 2023).
  48. National Forestry and Grassland Administration. In the Past 20 Years, 1.241 Million hm2 of Conversation Farmland to Forestland in Shaanxi Province Ranks at First in China; National Forestry and Grassland Administration: Beijing, China, 2019. Available online: http://www.forestry.gov.cn/main/435/20190821/101544575744491.html (accessed on 11 June 2020).
  49. Hansen, B.E. Threshold effects in non-dynamic panel estimation, testing and inference. J. Econ. 1999, 93, 345–368. [Google Scholar] [CrossRef]
  50. Geospatial Data Cloud. The NDVI Monthly Synthetic Product of China with a Resolution of 500M NDVI; Geospatial Data Cloud: Beijing, China, 2018; Available online: https://www.gscloud.cn/ (accessed on 11 June 2020).
  51. Yin, R.S.; Xiang, Q.; Xu, J.T.; Deng, X.Z. Modeling the driving forces of the land use and land cover changes along the upper Yangtze River of China. Environ. Manage. 2010, 45, 454–465. [Google Scholar] [CrossRef] [PubMed]
  52. Xu, X. The spatial interpolation dataset of mean state of meteorological elements of China. Res. Env. Sci. Data Reg. Pub. Sys. 2017. Available online: http://www.resdc.cn/ (accessed on 11 June 2020). [CrossRef]
  53. National Meteorological Science Data Center of China. Ground Meteorological Data of China; National Meteorological Data Center: Beijing, China, 2020; Available online: http://data.cma.cn/ (accessed on 11 June 2020).
  54. Duke, J.M.; Dundas, S.J.; Johnston, R.J.; Messer, K.D. Prioritizing payment for environmental services: Using nonmarket benefits and costs for optimal selection. Ecol. Econ. 2014, 105, 319–329. [Google Scholar] [CrossRef]
  55. Liu, S.; Yao, S. The effect of precipitation on the cost-effectiveness of Sloping land conversion program: A case study of Shaanxi Province, China. Ecol. Indic. 2021, 132, 108251. [Google Scholar] [CrossRef]
  56. Wünscher, T.; Engel, S. International payments for biodiversity services: Review and evaluation of conservation targeting approaches. Biol. Conserv. 2012, 152, 222–230. [Google Scholar] [CrossRef]
  57. Van Ree, C.C.D.F.; Van Beukering, P.J.H.; Boekestijn, J. Geosystem services: A hidden link in ecosystem management. Ecosyst. Serv. 2017, 26, 58–69. [Google Scholar] [CrossRef]
  58. Deng, Y.; Luo, J.; Wang, Y.; Jiao, C.; Yi, X.; Su, X.; Li, H.; Yao, S. Eco-efficiency evaluation of Sloping Land Conversion Program and its spatial and temporal evolution: Evidence from 314 counties in the Loess Plateau of China. Forests 2023, 14, 681. [Google Scholar] [CrossRef]
Figure 1. Possible effects of SLCP’s fiscal investments on the vegetation.
Forests 15 00002 g001
Figure 2. Study area.
Forests 15 00002 g002
Figure 3. The relationship between fiscal investments of SLCP and average NDVI in Shaanxi Province from 1999 to 2015.
Forests 15 00002 g003
Figure 4. The changes in NDVI of Shaanxi Province. (a) The changes in NDVI of Shaanxi Province from 2000 to 2015, (b) The changes in NDVI of Shaanxi Province from 2000 to 2010, and (c) The changes in NDVI of Shaanxi Province from 2010 to 2015.
Forests 15 00002 g004
Figure 5. Confidence interval construction of the single threshold model.
Forests 15 00002 g005
Figure 6. The investment priority areas of SLCP in Shaanxi Province.
Forests 15 00002 g006
Table 1. Variable designs and descriptive statistics.
NameVariable Design and Data DescriptionUnitMeanStdSource
ndvi500 m × 500 m resolution 0.79770.1334The Geospatial Data Cloud
investCounty-level fiscal investments calculated based on afforestation subsidy, subsidy periods, and afforestation areas108 CNY0.17710.2098The Central and South Forestry Investigation and Planning Design Institute of National Forestry and Grassland Administration of China
gdpThe county’s GDP1010 CNY0.74911.1675The Shaanxi Regional Statistical Yearbooks
denpeoThe ratio of population to county area104 people/km20.10270.3930The number of people is from the Shaanxi Regional Statistical Yearbooks; the area of the county is calculated in ArcGIS.
perAverage annual precipitation, 1 km × 1 km resolutionmm690.7548223.7742Chinese Academy of Sciences
tempAverage annual temperature, 1 km × 1 km resolution°C12.00471.9956Chinese Academy of Sciences
windAverage annual wind speed, 500 m × 500 m resolutionm/s2.04380.5460National Meteorological Science Data Center of China
sunAverage annual sunshine duration, 500 m × 500 m resolution103 h2.08260.3717National Meteorological Science Data Center of China
Table 2. The test of numbers about threshold.
F Valuep ValueBS TimesCritical Value
1%5%10%
Single threshold30.741 ***0.0003008.1184.8753.631
Double threshold15.919 ***0.000300−7.861−12.415−16.271
Triple threshold0.0000.0873000.0000.0000.000
Note: *** the significance level of 1%.
Table 3. Estimation of the threshold value.
Threshold Estimates95% of Confidence Interval
Single threshold model (g1)0.861[0.845, 0.882]
Double threshold model:
Ito1 (g1)0.757[0.578, 0.772]
Ito2 (g2)0.580[0.388, 0.952]
Triple threshold:0.744[0.589, 0.753]
Table 4. The ecological effects of fiscal investments in SLCP for revegetation.
Dependent VariableModel (1)
Direct Effect
Model (2)
Time Lag Effect
Model (3)
Effect of Diminishing Marginal Returns
Model (4)
Threshold Effect
Coef.Std. Err.Coef.Std. Err.Coef.Std. Err.Coef.Std. Err.
invest−0.0318 *** 0.0079
lag4_invest 0.1022 *** 0.0138 0.1537 *** 0.0252
lag4_invest 2 −0.0552 *** 0.0190
lag4_invest
(lagndvi ≤ 0.861)
0.1238 *** 0.0102
lag4_invest
(lagndvi > 0.861)
0.0565 *** 0.0131
lngdp20.0017 *** 0.0004 0.0020 *** 0.0004 0.0019 *** 0.0004 0.0021 *** 0.0003
lngdp0.0198 *** 0.0033 0.0206 *** 0.0037 0.0194 *** 0.0037 0.0217 *** 0.0021
denpeo−0.0368 *** 0.0131−0.0599 *** 0.0098 −0.0605 *** 0.0104 −0.0594 *** 0.0174
lagndvi0.5163 *** 0.0317 0.4536 *** 0.0378 0.4473 *** 0.0373 0.4521 *** 0.0241
per5.07 × 10−5 ***5.41 × 10−65.00 × 10−5 ***5.88 × 10−64.93 × 10−5 ***5.62 × 10−64.83 × 10−5 ***8.06 × 10⁻⁶
temp0.0109 *** 0.0023 0.0088 *** 0.0022 0.0086 *** 0.0022 0.0087 *** 0.0021
wind0.0031 0.0071 0.0110 0.0085 0.0124 0.0086 0.0064 0.0072
sun−0.0018 0.0049 0.0042 0.0058 0.0043 0.0058 0.0033 0.0066
_cons0.2483 *** 0.0438 0.2732 *** 0.0525 0.2726 *** 0.0520 0.2908 *** 0.0394
Note: (1) *** significance level of 1%, (2) lag4_invest, fiscal investments of the SLCP with 4 lags; lag4_invest 2, its square item, (3) _cons, the constant item.
Disclaimer/Publisher’s Note: The statements, opinions and data contained in all publications are solely those of the individual author(s) and contributor(s) and not of MDPI and/or the editor(s). MDPI and/or the editor(s) disclaim responsibility for any injury to people or property resulting from any ideas, methods, instructions or products referred to in the content.

