Article

Comparison and Optimization of Water Conservation Function in Natural Forests and Tea Plantations in a Headwater Catchment, Taihu Lake Basin

1
Key Laboratory of Watershed Geographic Sciences, Nanjing Institute of Geography and Limnology, Chinese Academy of Sciences, Nanjing 210008, China
2
University of the Chinese Academy of Sciences, Beijing 100049, China
*
Author to whom correspondence should be addressed.
Forests 2024, 15(1), 189; https://doi.org/10.3390/f15010189
Submission received: 21 December 2023 / Revised: 15 January 2024 / Accepted: 16 January 2024 / Published: 17 January 2024
(This article belongs to the Section Forest Hydrology)

Abstract

:
The rapid expansion of tea plantations (Camellia sinensis), which replace local natural forests, decreases the water conservation function in the headwater region and threatens regional water security. However, studies focusing on the comprehensive evaluation and improvement of the water conservation function of natural forests and tea plantations are lacking. In this study, we developed a comprehensive evaluation method for the water conservation function by investigating, monitoring, and conducting process model simulations of 221 tea plantation and natural forest (bamboo forest) samples obtained in the field. We also quantified the trade-off between water conservation and carbon sequestration. The results showed that the tea plantations had lower annual water conservation than the bamboo forests. Slope was the most critical influential variable affecting water conservation in tea plantations. Strict control should be exercised in the development of steep slopes above 20° for tea plantations, to enhance the regional water conservation capacity. Water conservation in bamboo forests increased to the maximum level at a planting density (SD) of approximately 2500–2700 tree/ha and then decreased quickly. The optimal SD values of bamboo forests were 2500, 2600, and 2650 trees/ha at slopes of 10°, 15°, and 20°, respectively, which can maintain higher water conservation and adequate carbon sequestration. Overall, water conservation and carbon sequestration increased by approximately 22.6% and 13.7%, respectively, compared with the average values for bamboo forests. However, at slopes >20°, a strong trade-off was observed between water conservation and carbon sequestration, and competing ecosystem services accompanied those, which were hard to balance and which resulted here in disproportionate water conservation at the cost of carbon sequestration loss.

1. Introduction

The replacement of local natural forests for the sake of agricultural land expansion has increased considerably worldwide due to its important economic benefits [1,2,3]. A typical representative is the expansion of tea plantations in tropical and subtropical regions [4,5]. In China alone, the area of tea plantations expanded by a factor of 3 during 2001–2016 to cover 3.02 million ha of land, accounting for 14.3% of the global planting area [6]. Tea plantations tolerate shade and humidity and are suitable for planting in high-drainage hilly and mountainous areas [7]. However, these areas also serve as headwater regions and important supply regions of ecosystem services, especially water conservation functions, which regulate runoff, retain floodwaters, and are important guarantees for downstream water safety [8]. The expansion of tea plantations is accompanied by changes in the stand structure, litter fall layer, and soil hydraulic properties compared with local natural forest ecosystems and alters regional water conservation processes. Moreover, negative effects of tea plantation expansion on water conservation in headwater regions have been reported due to the weak soil water storage of tea plantations [9]. Meanwhile, human disturbance for timber production has significantly altered the stand structure of local forests, decreasing the water conservation capacity and exacerbating the trade-offs between water conservation and other ecological benefits, especially carbon sequestration [10,11]. Hence, an accurate evaluation and proper improvement of the water conservation function of forest ecosystems in headwater regions must be achieved to ensure regional water resource security.
Water conservation refers to the process of retaining floodwaters and regulating runoff within the canopy, litter, and soil functional layers of forests [12,13,14]; it has two time-scale features (rainwater events: rainfall interception in the rainy season; and seasonal: regulation of runoff in the dry season) and involves multiple functional layers, including canopy interception, litter-layer water retention, soil-layer water storage, ecosystem evapotranspiration, and runoff production, which increase the difficulty involved in quantifying the water conservation function. Different quantitative methods and models, including the water balance method [15,16], soil water storage method [17], and canopy interception residual method [18], have been developed to quantify the water conservation function of forests. For example, Refs. [19,20] estimated the water conservation function of a typical watershed of the Yellow River Basin based on the water balance method. Furthermore, Ref. [21] evaluated the water conservation function of typical planted forests and natural secondary forests on the Loess Plateau using the comprehensive water storage capacity method. However, the above methods might lead to unreasonable results for forest water conservation, due to their one-sided nature [14]. Moreover, the estimation results of different methods vary greatly and are not comparable [19,21,22]. Meanwhile, the optimization and improvement of water conservation functions based on the above evaluation results are inevitably limited [20,23]. Hence, developing comprehensive evaluation and quantification methods for forest water conservation is an urgent requirement. Furthermore, in the enhancement of the water conservation function, other ecological benefits are given less importance during optimization, especially carbon sequestration, which is one of the vital ecosystem services in headwater regions [24]. For maximum timber production, natural forests are demolished, causing substantial declines in canopy and soil-layer water conservation. Intensifying competition between water conservation and carbon sequestration has also been reported [25,26]. In this context, a comprehensive method that considers the multiscale and functional layer coupling of water conservation must be developed, and scientific quantification and optimization must be carried out to balance the competing services of water conservation and other ecological benefits.
The Taihu Lake Basin is a key ecological functional area in China and has a typical subtropical monsoon climate (Figure 1b). In the past 20 years, tea plantations have especially intensified in the headwater catchment of the basin. Most local water conservation forests (e.g., bamboo forests) are cleared and converted to tea plantations due to their high economic benefits [27]. The Shahe Reservoir catchment (153.5 km2, Figure 1c) is a typical headwater catchment of the Taihu Lake Basin. The planting area in the tea plantation in the Shahe Reservoir catchment has expanded by approximately seven times from 3120 ha to 21,105 ha in the past 20 years. Meanwhile, this rapid expansion of tea plantations has significantly affected the regional water cycle in the headwater region [28,29]. The water conservation function in the headwater region is suffering from a continuous decline. Hence, the water conservation capacity of the headwater region in the Taihu Lake Basin urgently needs to be improved.
In this study, we investigated the water conservation functions of tea plantations and local natural forests (bamboo forests) and developed a comprehensive evaluation method for water conservation based on a field survey, monitoring, and process model (LWFBrook90 and Biome-BGC model) simulations of 221 tea plantation and bamboo forest samples. This study aimed to (1) analyze the differences in water conservation functions between tea plantations and local natural forests (bamboo forests), (2) develop a comprehensive evaluation method for water conservation to determine the influencing factors, and (3) identify the optimal configuration of the stand structure of bamboo forests based on the results of the trade-off between water conservation and other vital ecosystem services.

2. Materials and Methods
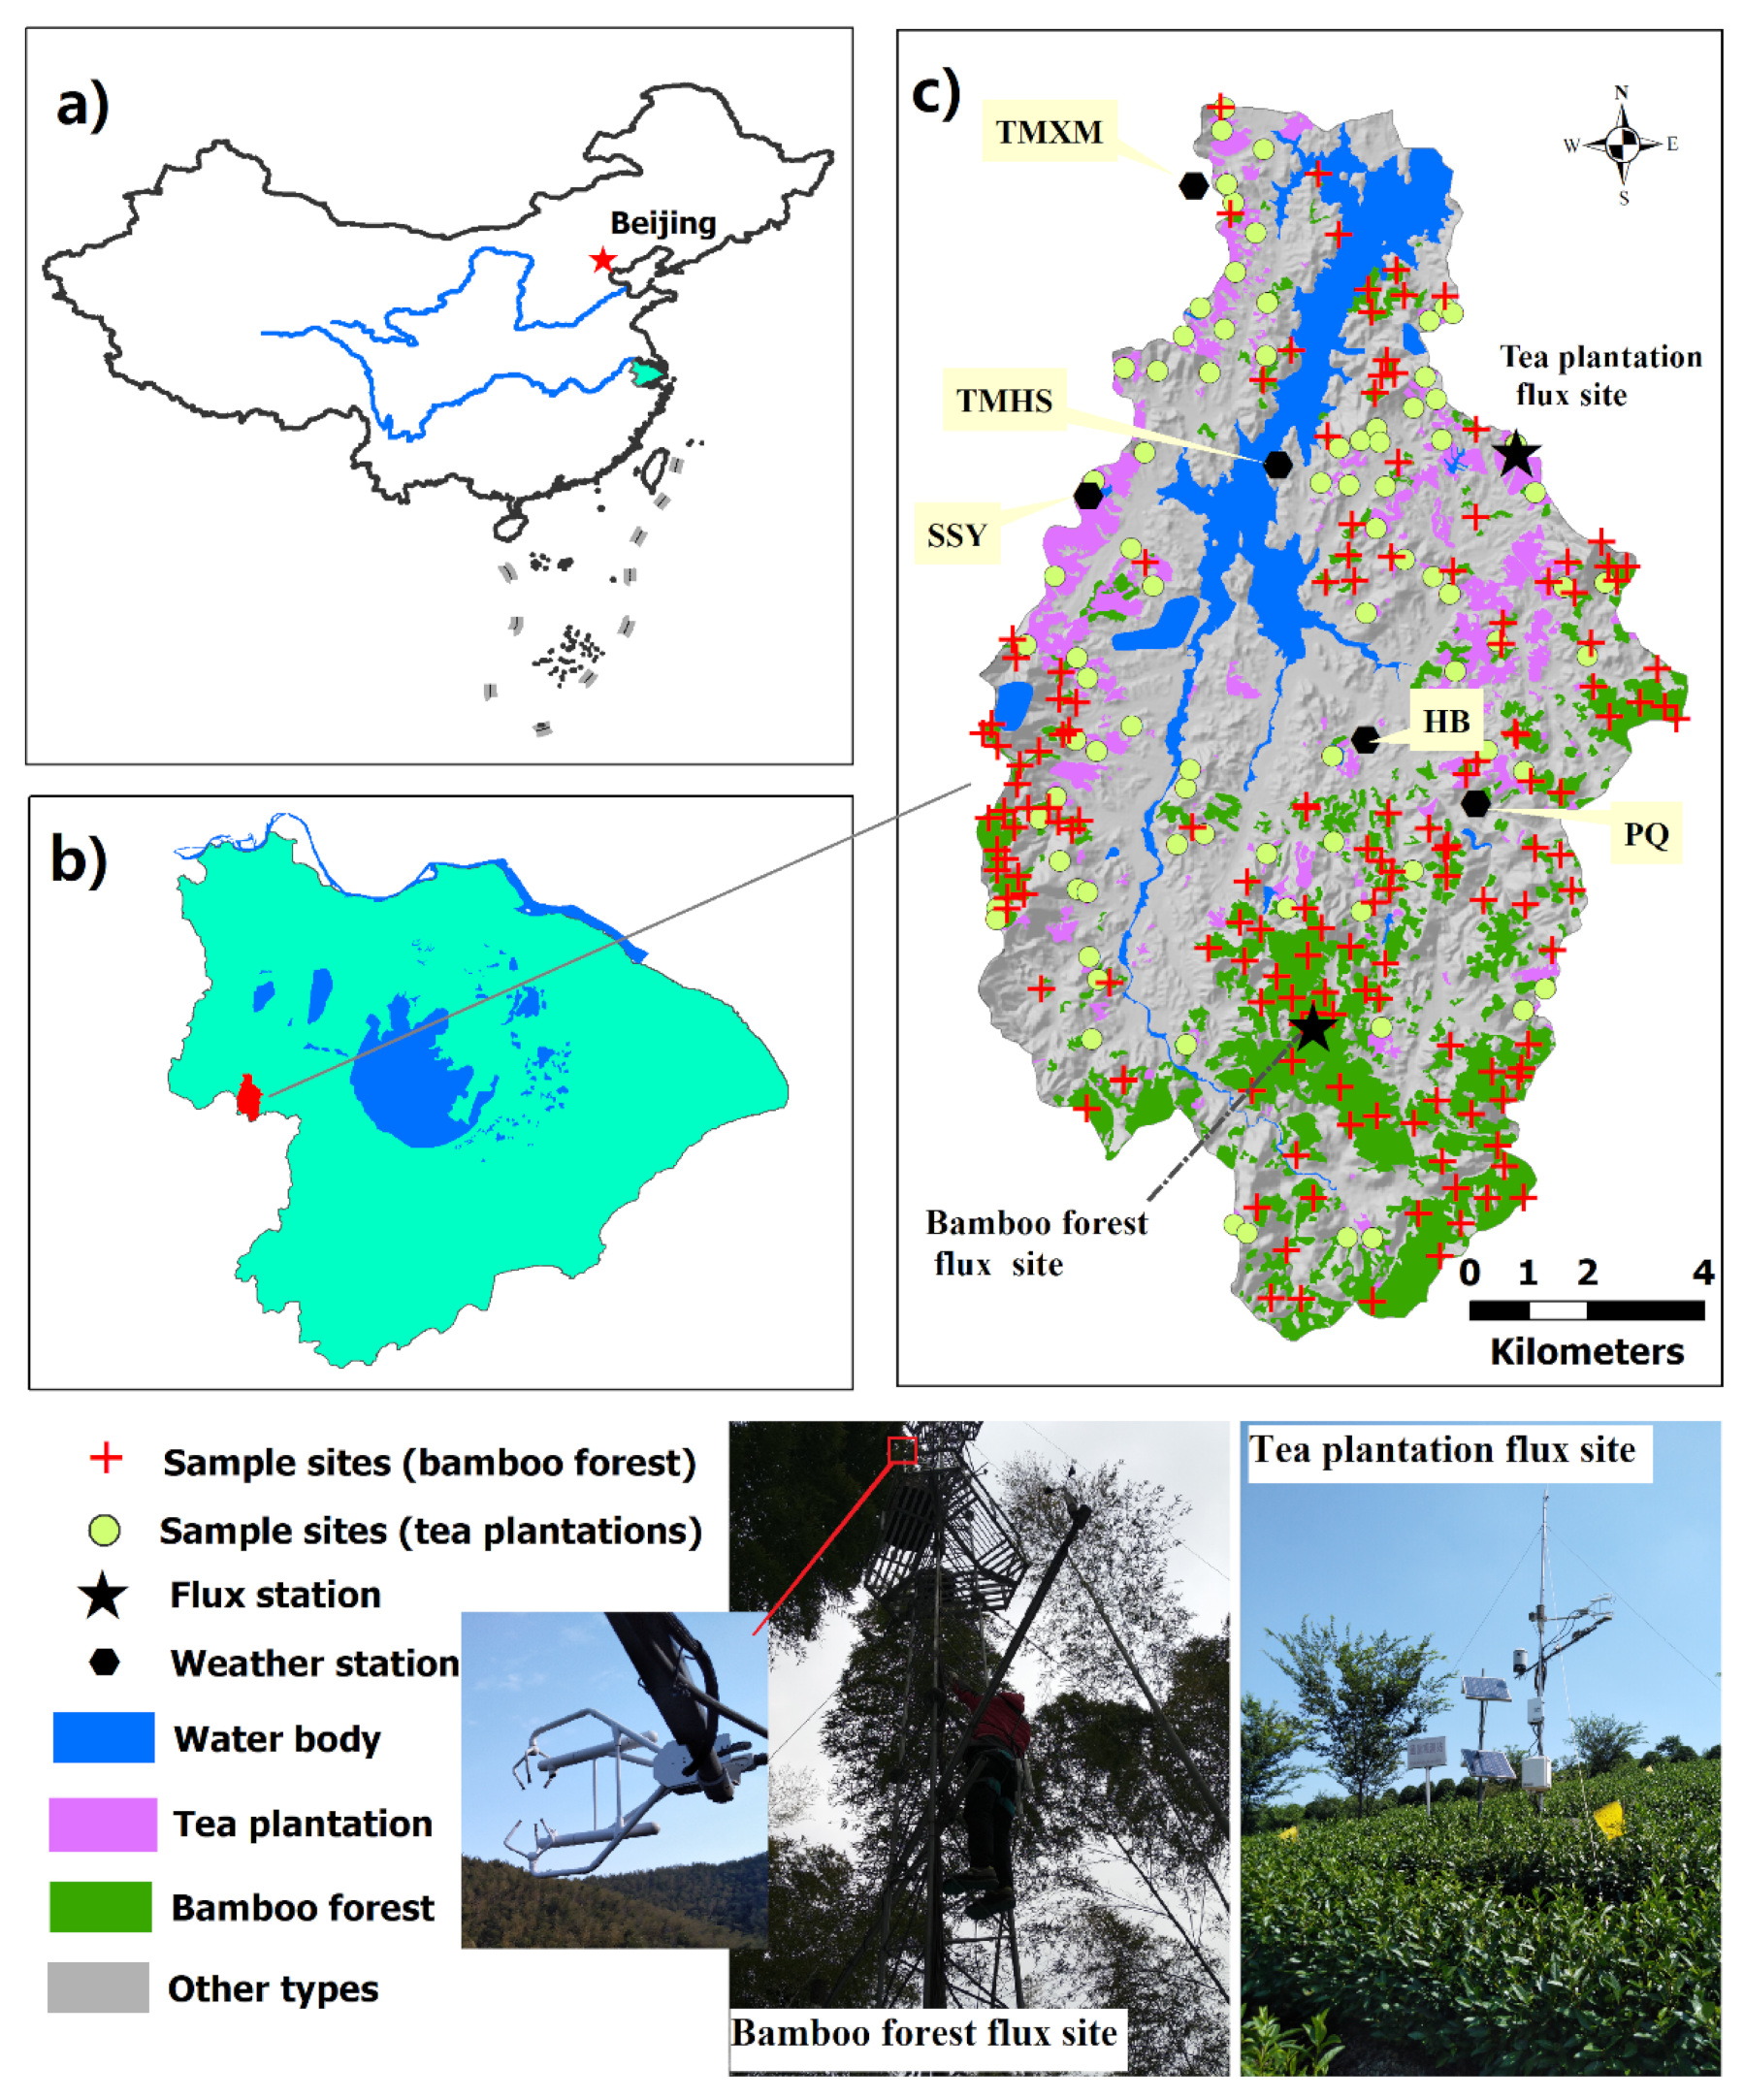
2.1. Study Area

The Shahe Reservoir catchment (153.5 km2, Figure 1c) is located in the western headwater region of the Taihu Lake Basin (Figure 1b). This area is a typical hilly and mountainous area with an elevation of 12–50 m. Its climate is subtropical monsoon characterized by two major seasons, namely, the rainy (April to September) and dry (October to March) seasons. The average annual temperature and average annual precipitation reach 15.8 °C and 1146.7 mm, respectively. January is the coldest month, and July is the hottest, with daily average temperatures of 3.1 °C and 28.4 °C, respectively. A total of 75% of the annual precipitation can be observed during the rainy season. The main wind direction in the study area is southeast–northwest, with an average wind speed of 1.3 m/s over the years. According to the Food and Agriculture Organization (FAO) soil classification system, this area features shallow rock soil, a soil thickness of 60–100 cm, a high gravel content, sandstone as bedrock, and high water permeability [30]. The soil texture is loamy soil, with clay and silt contents of approximately 22.0%–24.8% and 54.0%–54.9%, respectively.

2.2. Sample Plot Setting

Field investigations were conducted on tea plantation and bamboo forest ecosystems in 2018–2021. Preliminary screening of tea plantations and bamboo forests with different slopes and canopy densities (CDs) was conducted using land use, normalized difference vegetation index (NDVI), and digital elevation model (DEM) data. Then, the field points of tea plantations and bamboo forests were finally determined through field investigations. From 2018 to 2021, a total of 221 survey sites, including 85 tea plantation sites and 136 bamboo forest sites, were selected in the Shahe Reservoir catchment (Figure 1c).

2.3. Water Conservation Capacity Index (WCCI)

This study considered two forms of water conservation functions with two time scales for bamboo forests and tea plantations (rainwater events: rainfall interception in the rainy season; seasonal: regulation of runoff in the dry season). Based on key ecological hydrological processes and ecosystem functional layers of the water conservation function in tea plantations and bamboo forests, we selected 16 key indicators that affected the water conservation function and constructed a comprehensive evaluation index for that function. These indicators consisted of vegetation canopy interception, litter decomposition layer and semi-decomposition layer interception, soil water content, maximum soil water storage, and soil infiltration rate, which indicate the ability to reduce flood peaks during rainwater events. The surface runoff during the dry season, deep leakage, vegetation transpiration, and soil evaporation in the rainy season indicate the capacity of tea plantations and bamboo forests to regulate runoff. Ecosystem biodiversity, species richness, and evenness were also considered for ecosystem health [23].
Through the comprehensive evaluation indices of the water conservation functions, different functional layers of water conservation and biodiversity of ecosystems were used to evaluate the ecological benefits of water conservation in tea plantations and bamboo forests (Figure 2). Taking tea plantations as an example, first, all raw data were considered dimensionless (Formula (1)):
D i j = X i j X j
where D i j   refers to the data obtained after dimensionless processing, i indicates the number of survey sample points of tea plantations, and j corresponds to the selected indicator number. X i j is the original data, and X j   is the maximum value observed among all samples of tea plantations.
The distance between each sample point and the maximum value for tea plantation sites was calculated based on the processed dimensionless data (the same weight was used for each indicator in this study):
P i = j 1 D i j 2
W C C I = 10 P i
where P i   represents the sum of distances from the maximum value of all evaluation indicators at sample point i (a small P i indicates a high comprehensive water source conservation efficiency at the sample site). WCCI is the comprehensive index of the water conservation function at the surveyed sample point. For the bamboo forests, there is the same data processing flow.
Based on the calculated P i values, the water conservation benefits of tea plantation or bamboo forest survey samples were ranked. The smallest and largest P i   values were 2.0 and 5.89, respectively, for tea plantations. The minimum and maximum P i values for the bamboo forests survey sample points were 0.24 and 7.38, respectively. Overall, the P i   values of tea plantations and bamboo forests ranged between 0 and 10. The range of the WCCI was between 0 and 10, with large WCCI values indicating high efficiency of the water conservation function.

2.4. Eddy Flux and Meteorological Data

We established two eddy covariance flux systems at tea plantation and bamboo forest sites and obtained the high-frequency energy, water, and carbon fluxes of tea plantations and bamboo forests from 2014 to 2020 (Figure 1c). An open-path CO2/H2O analyzer (EC150, Campbell Scientific) and sonic anemometer–thermometer (CSAT3, Campbell Scientific) were used to measure the CO2 (0–1000 μmol/mol) and water vapor (0–60 mmol/mol) concentrations, and the three components of wind velocity vectors and sonic temperature, respectively. Meanwhile, the meteorological data (precipitation, temperature, relative humidity, and solar radiation) and soil data (soil moisture and temperature in 10 cm, 20 cm, and 40 cm depths) were also obtained with a 30 min time resolution at five weather stations (2010–2020) and the two flux sites (2014–2020). Throughfall monitoring experiments were conducted in 2019 and 2020 at tea plantation and bamboo forest flux sites with 85 precipitation events. Soil water, evapotranspiration, and carbon flux data were used in the calibration and validation of the LWF-Brook90 and Biome-BGC models at the two flux sites. Then, the calibrated LWF-Brook90 and Biome-BGC models were used to simulate the hydrological and carbon sequestration processes of the 221 tea plantation and bamboo forest survey sites, respectively.

2.5. Investigation of Stand Structure and Data Collection

We collected the stand structural parameters of tea plantations and bamboo forests from the selected field survey sites. The ecological forest structural parameters, such as planting density (SD), diameter at breast height (DHB), maximum leaf area index (LAImax), and crown area (CA), of each sample plot were investigated according to the work of [31] for detailed theoretical methods. The characteristics of the litter layer, soil depth, biodiversity, species evenness, and richness of the sample plots were also investigated based on previous research methods [23]. Meanwhile, the hydrological characteristics of the 318 litter samples were collected in the field and measured using an indoor immersion method. The soil data (e.g., percentages of sand, silt, and clay) were obtained from the Harmonized World Soil Database. Simultaneously, vegetation and terrain parameters were also collected for the operation of the LWF-Brook90 and Biome-BGC models.

2.6. Description of the LWFBrook90 and Biome-BGC Models

The LWFBrook90 model was used to simulate hydrological processes, including canopy interception, soil moisture dynamics, and surface runoff fluxes of natural forests and management orchards [32]. For soil moisture movement, the model uses the Van Genuchten equation and Brooks Corey equation to calculate soil hydraulic parameters, and uses the Darcy Richards equation to simulate soil moisture movement [33]. The LWFBrook90 model exhibits superiority in simulating hydrological processes in different ecosystems because of its improved performance, providing submodels for model parameterization and facilitating parallel computations [33,34,35]. The LWFBrook90 model was also previously applied to successfully simulate the water-balance components of tea plantations and bamboo forests in our study area [9]. The biogeochemical Biome-BGC model estimates carbon sequestration within terrestrial ecosystems using the photosynthetic enzyme-catalyzed reaction mechanism [36,37]. Version 4.2 of Biome-BGC, which is stable and actively used, has been frequently adopted in carbon cycle simulation in previous studies [38,39]. The operations of Biome-BGC and LWFBrook90 have similar forcing data requiring three categories, including climatic data (daily precipitation, daily max/min/mean temperature, day length, vapor pressure deficit, and daylight average shortwave radiant), geomorphic data (elevation, slope, slope direction, and soil texture), and eco-physiological parameters. For the eco-physiological parameters, the Biome-BGC defines complete parameter settings for seven default vegetation types, including deciduous needle leaf forest, deciduous broadleaf forest, shrubs, and C3 and C4 grasses. However, human activities (e.g., pruning and fertilization) profoundly affect carbon sequestration in tea plantations. Hence, the improved version (Biome-BGCMUSO), which was added to the management module, was used to assess carbon sequestration in tea plantations and bamboo forests. The details of Biome-BGCMUSO are provided in the work of [40,41]. The parameter sensitivities and other characteristics for Biome-BGCMUSO have been discussed in [42,43]. We validated LWFBrook90 and Biome-BGCMUSO 6.2 using eddy flux data from tea plantation and bamboo forest sites (Figures S1–S3). The coefficient of determination (R2) and Nash–Sutcliffe efficiency coefficient (NSE) were used to evaluate the performance of the Biome-BGCMUSO. In tea plantation and bamboo forest flux sites, Biome-BGCMUSO perform well (R2 > 0.69, NSE > 0.78 for net ecosystem productivity (NEP)). Likewise, in our previous study [9], the LWFBrook90 model also performed well in simulating hydrological processes for tea plantations and bamboo forests in our study area (R2 > 0.81, NSE > 0.83 for soil water content) (Table S4).

2.7. Optimization of the Water Conservation Capacity of Bamboo Forests and Tea Plantations

In this study, response surface analysis (RSM) was used to optimize the site conditions of bamboo forest ecosystems to enhance the water conservation function of bamboo forests. The RSM is based on a MATLAB software (ver. 2019b, MathWorks Inc., Natick, MA, USA) operation [44]. The corresponding formula is as follows:
y x = o + i = 1 i X i + i = 1 i < j i j X i j + i = 1 i j X i j 2 + ε
where X i is an independent variable, y x indicates the response value, o represents a constant term, i corresponds to a linear response term, i j stands for the interactive response term, and ε refers to the error term.

2.8. Statistical Analysis

We processed the data and ran the LWFBrook90 model using R software. Under R v3.6.3, we used the polynomial fitting model to conduct regression analysis on the stand structural parameters and WCCI or carbon sequestration of tea plantations and bamboo forests. The structural equation model (SEM) and RSM method are based on MATLAB software (Math Works Inc., Natick, MA, USA).

3. Results and Discussion

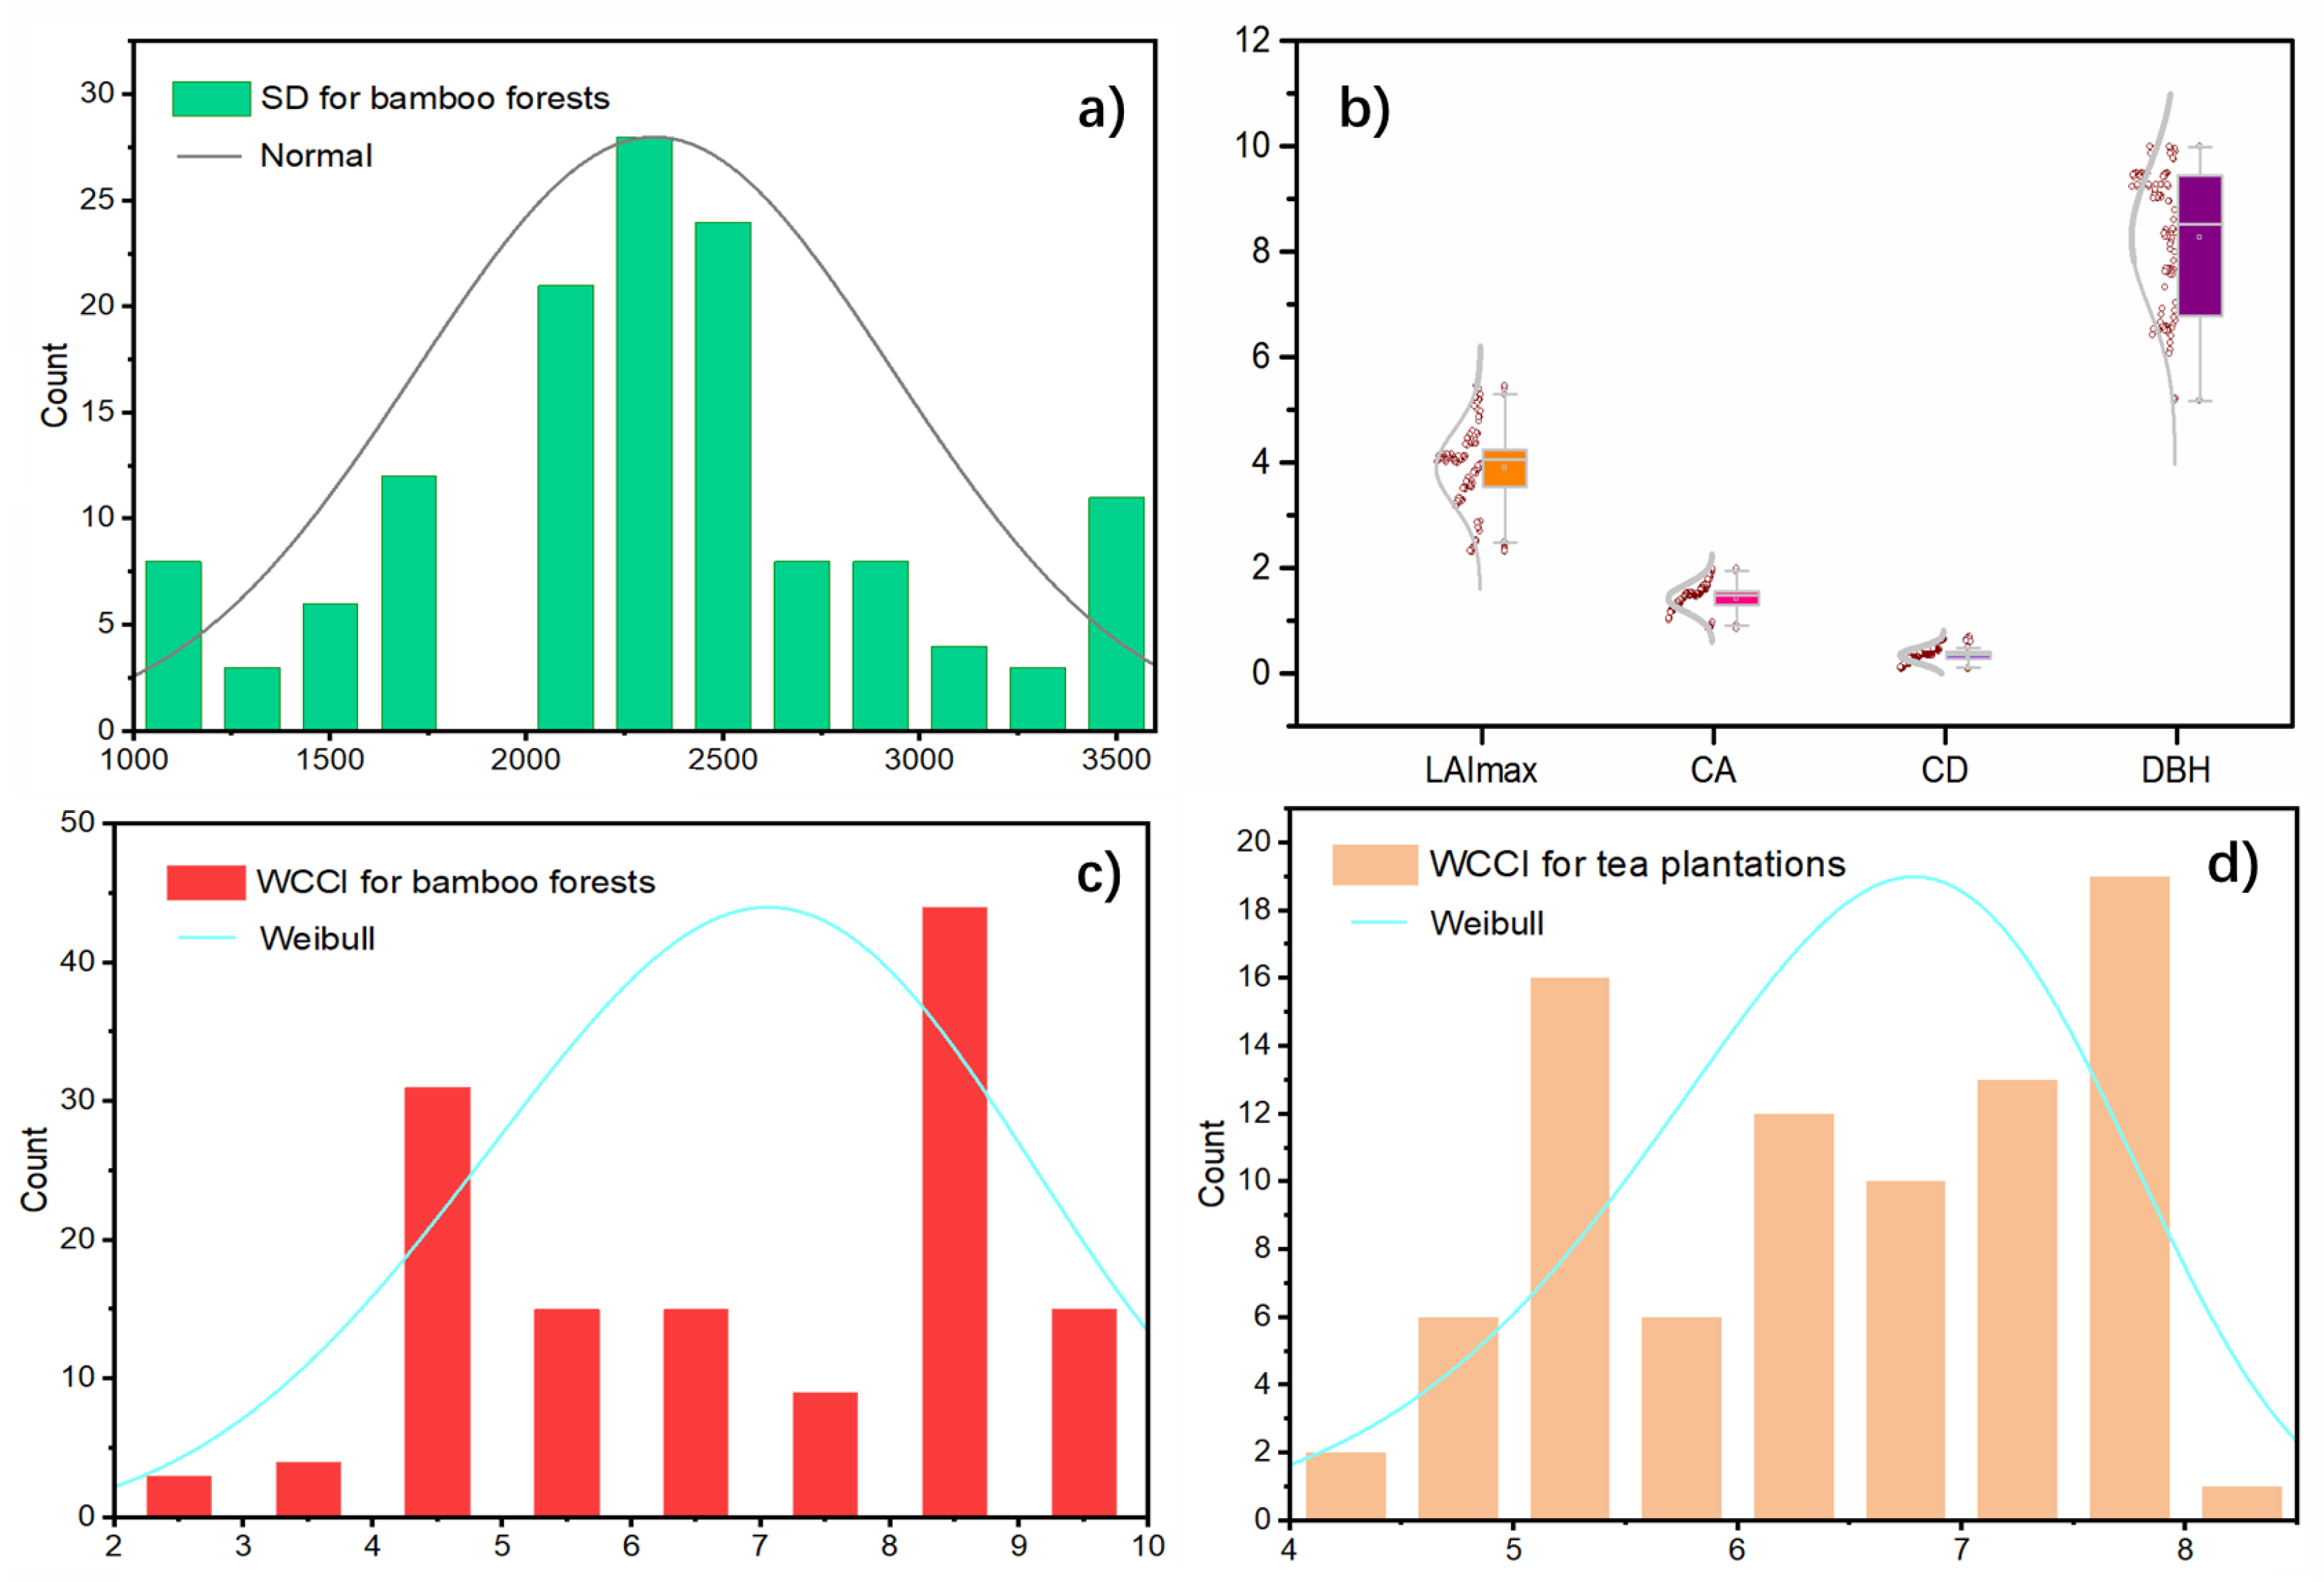
3.1. Vegetation Characteristics of Bamboo Forests and Tea Plantations

In our study area, the local tree species of water conservation forests is bamboo. The stand age of the bamboo forests is over 10 years old, with a height of 8–10 m and a DHB of approximately 9 cm. As natural evergreen forests, these have stable vegetation characteristics throughout the year with a high annual LAI (2.63–3.26 m2 m−2), vegetation coverage (83%), and litter layer (2 cm thick). Meanwhile, the tea plantations are planted with a density of 45,000 plants ha−1 and an inter-row spacing of 1.5 m. Tea plantations have evident seasonal vegetation characteristics due to agricultural management activities (e.g., pruning of tea trees). The general schedule of phenology parameters of the tea plantations is shown in Figure S4 and Table S1. At the end of April each year, the tea trees are pruned from a height of approximately 100 cm to 55 cm and then gradually recover from the intense pruning interference. Meanwhile, the LAI of tea plantations reaches a low level (0.8 m2 m−2). At the end of September, the heights of the tea trees reach 90–105 cm, and the pruned branches and leaves lay flat between rows. The thickness of the withered branches and leaves reaches approximately 4 cm, which allows them to decay naturally and decompose completely by the end of September. Evidently, significant differences in vegetation characteristics can be observed between bamboo forests and tea plantations, which may be the main reasons for the differences in water conservation capacity.

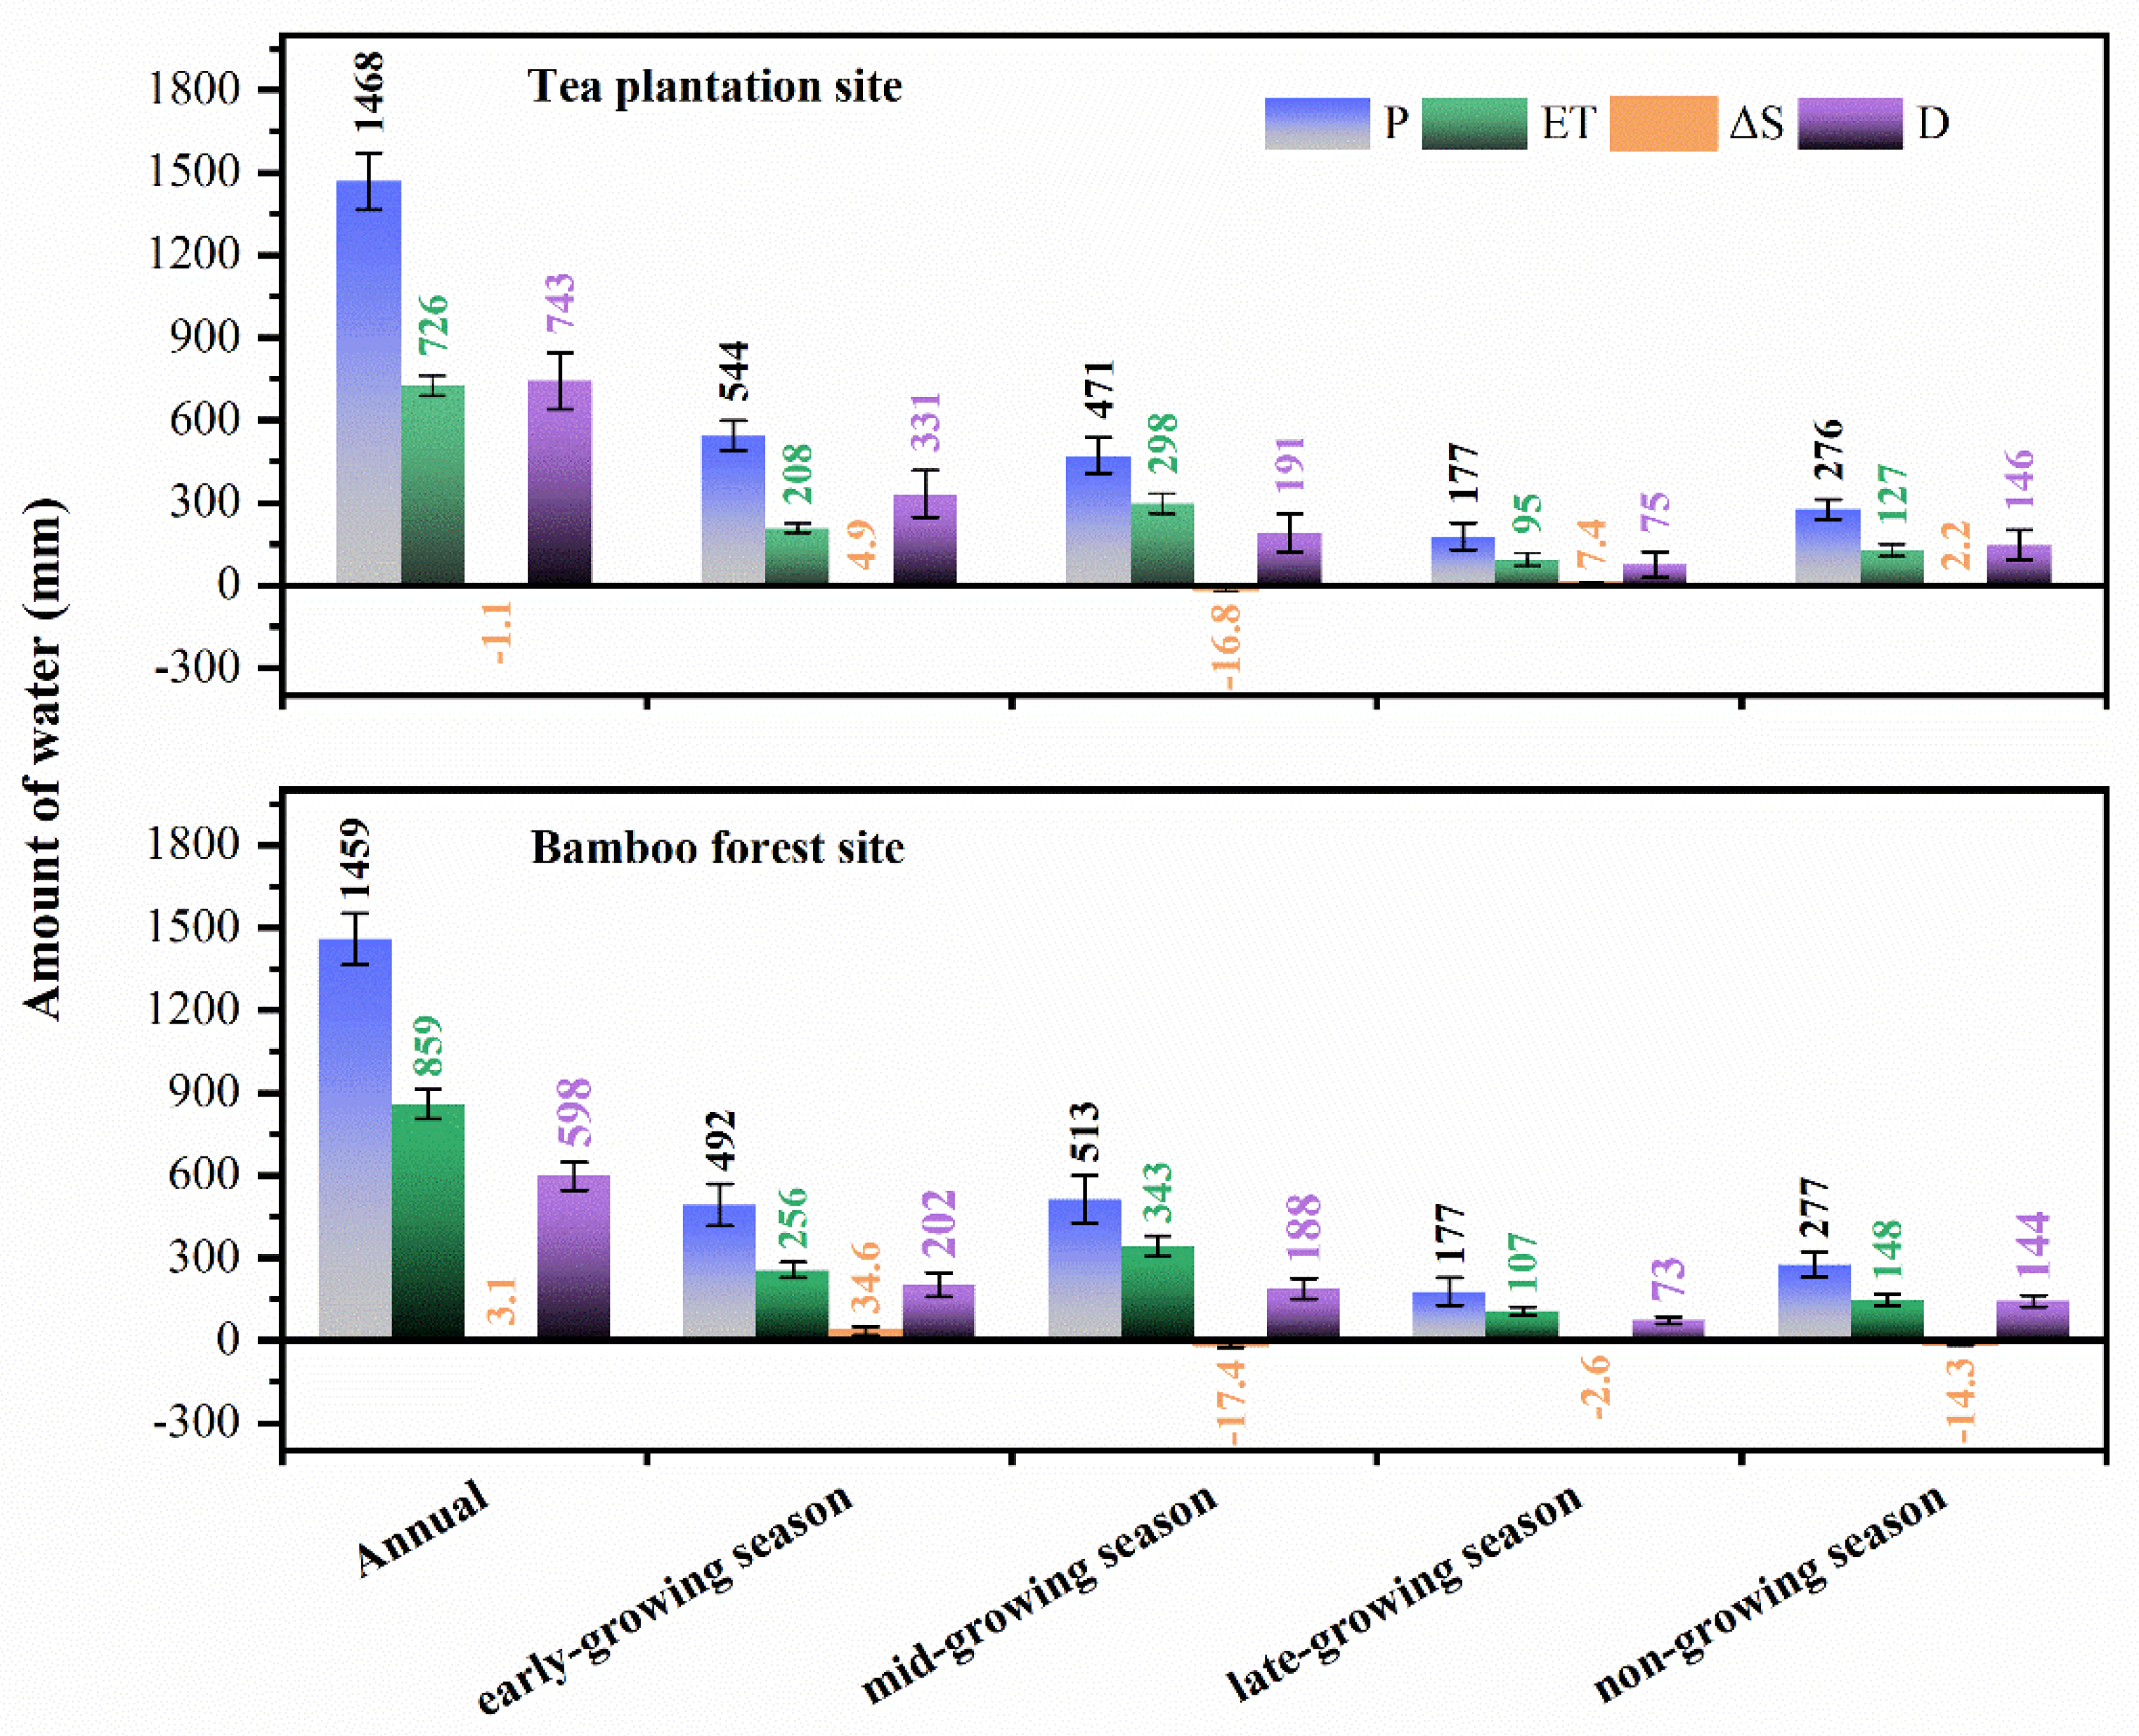
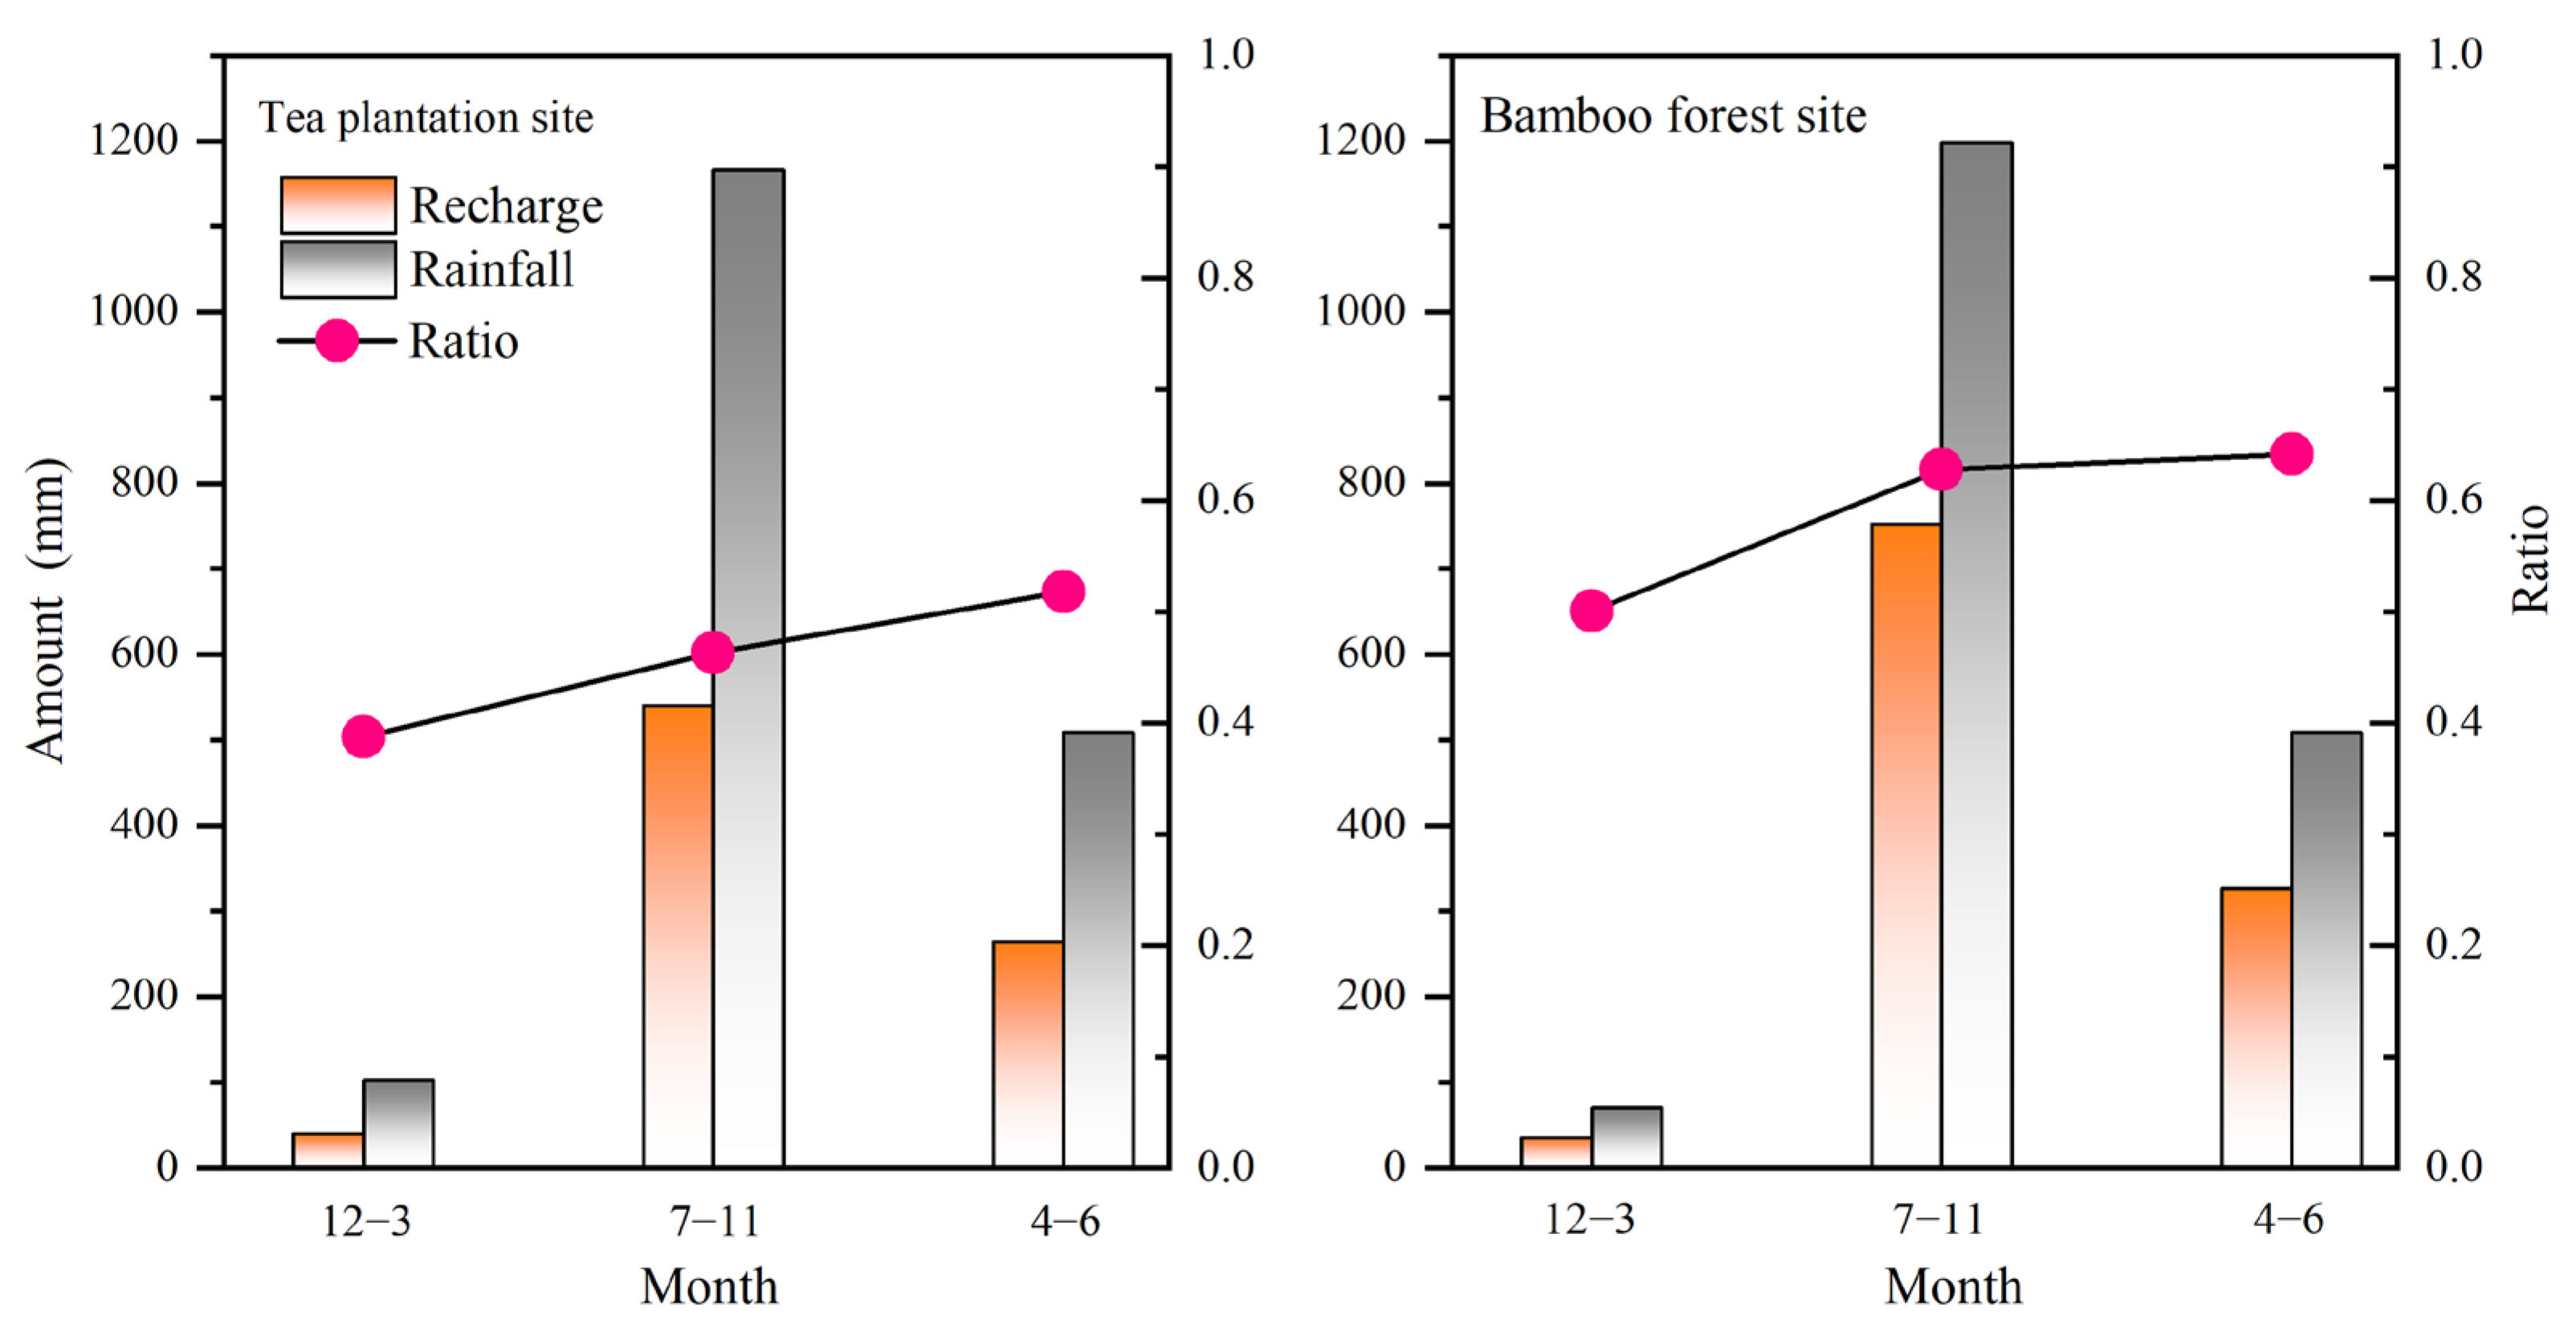
3.2. Comparison of Water Conservation Capacity between Bamboo Forests and Tea Plantations

The mean annual amounts of water conservation (including retaining floodwaters and regulating runoff) in the bamboo forests and tea plantations were 578 ± 63 and 483 ± 27 mm, respectively, based on the simulation of the LWFBrook90 model. The results were higher than those of previous research for forests on the Loess Plateau, Qinghai Plateau, and middle reaches of the Yellow River [19,45]. The amounts of water conservation for bamboo forests and tea plantations were also higher than the previous estimations of water conservation for bamboo forests and tea plantations in our study area [9]. These differences were mainly because the estimation of water conservation in our study considered rainfall interception in the rainy season and the regulation of runoff in the dry season. Accordingly, the water balance and canopy interception residual methods that we applied are frequently used to determine the quantity of a certain functional layer or time scale of the forest water conservation function [14,20]. In the rainy season, the water conservation amount for retaining floodwaters in bamboo forests was 469 ± 37 mm, which was higher than that in tea plantations (402 ± 19 mm), indicating that bamboo forests had a higher rainwater interception capacity. The water conservation amounts for regulating runoff in the dry season were 81 ± 17 and 109 ± 33 mm, respectively, for tea plantations and bamboo forests. The results suggest that bamboo forests had higher regulation of runoff than tea plantations in the dry season. In addition, the differences in water conservation amounts between bamboo forests and tea plantations were higher in the rainy season. During the rainy season, the water conservation amount of bamboo forests was approximately 67 mm higher than that of tea plantations. There were similar precipitation and terrain conditions for the bamboo forests and tea plantations in our study area, so we propose that the differences in the water conservation amounts of the bamboo forests and tea plantations were mainly due to differences in vegetation and soil hydrological characteristics. Figure 3 shows the water balance components of the bamboo forests and tea plantations in different seasons. The high drainage (D) (645 ± 288 mm for tea plantations vs. 527 ± 272 mm for bamboo forests), weak water retention capacity of the canopy, and litter and soil layers caused low water conservation in tea plantations in the rainy season. At the beginning of the rainy season period (April and May), canopy pruning of tea plantations resulted in their weak rainwater interception capacity (Figure S5). The rainwater interception capacity of the canopy for tea plantations decreased considerably from 19.3% to 9.1% after pruning during this period because of the low LAI. Meanwhile, the throughfall rate of tea plantations before pruning was 76%–87% and was more than 95% after pruning. In addition, the water-holding capacity of the litter layer of tea plantations (11.76–14.96 t/hm2) was lower than that of bamboo forests (16.91–19.33 t/hm2) in the rainy season (Figure S6), although the pruning of the tea plantation canopy substantially increased the litter layer. Moreover, during the seedling stage of tea plantations, the surface coverage was low, and the soil erosion was severe, which led to soil coarsening and changes in soil physical properties [46,47]. The water storage capacity of tea plantation soils was notably lower than that of bamboo forests, and the mean soil water storage in tea plantations was also lower than that in bamboo forests. In precipitation events, the soil layer intercepted 33%–78% of the total precipitation, and the soil water storage capacity of bamboo forests was approximately 1.7 times that of tea plantations in different seasons (Figure 4 and Figure S7). This supports a finding from the literature that tea plantations drained 30–116 mm more water than bamboo forest sites in the rainy season [9]. In the dry season, the tea plantations exhibited a high canopy interception capacity, though their water yield did not increase markedly. Hence, differences in the hydrological characteristics of the canopy, litter layer, and soil layer resulted in a lower water conservation capacity of tea plantations than that of bamboo forests. It should be noted that the weak water conservation capacity and higher D of tea plantations in the rainy season will increase the risk of flooding with the rapid expansion of tea plantations.

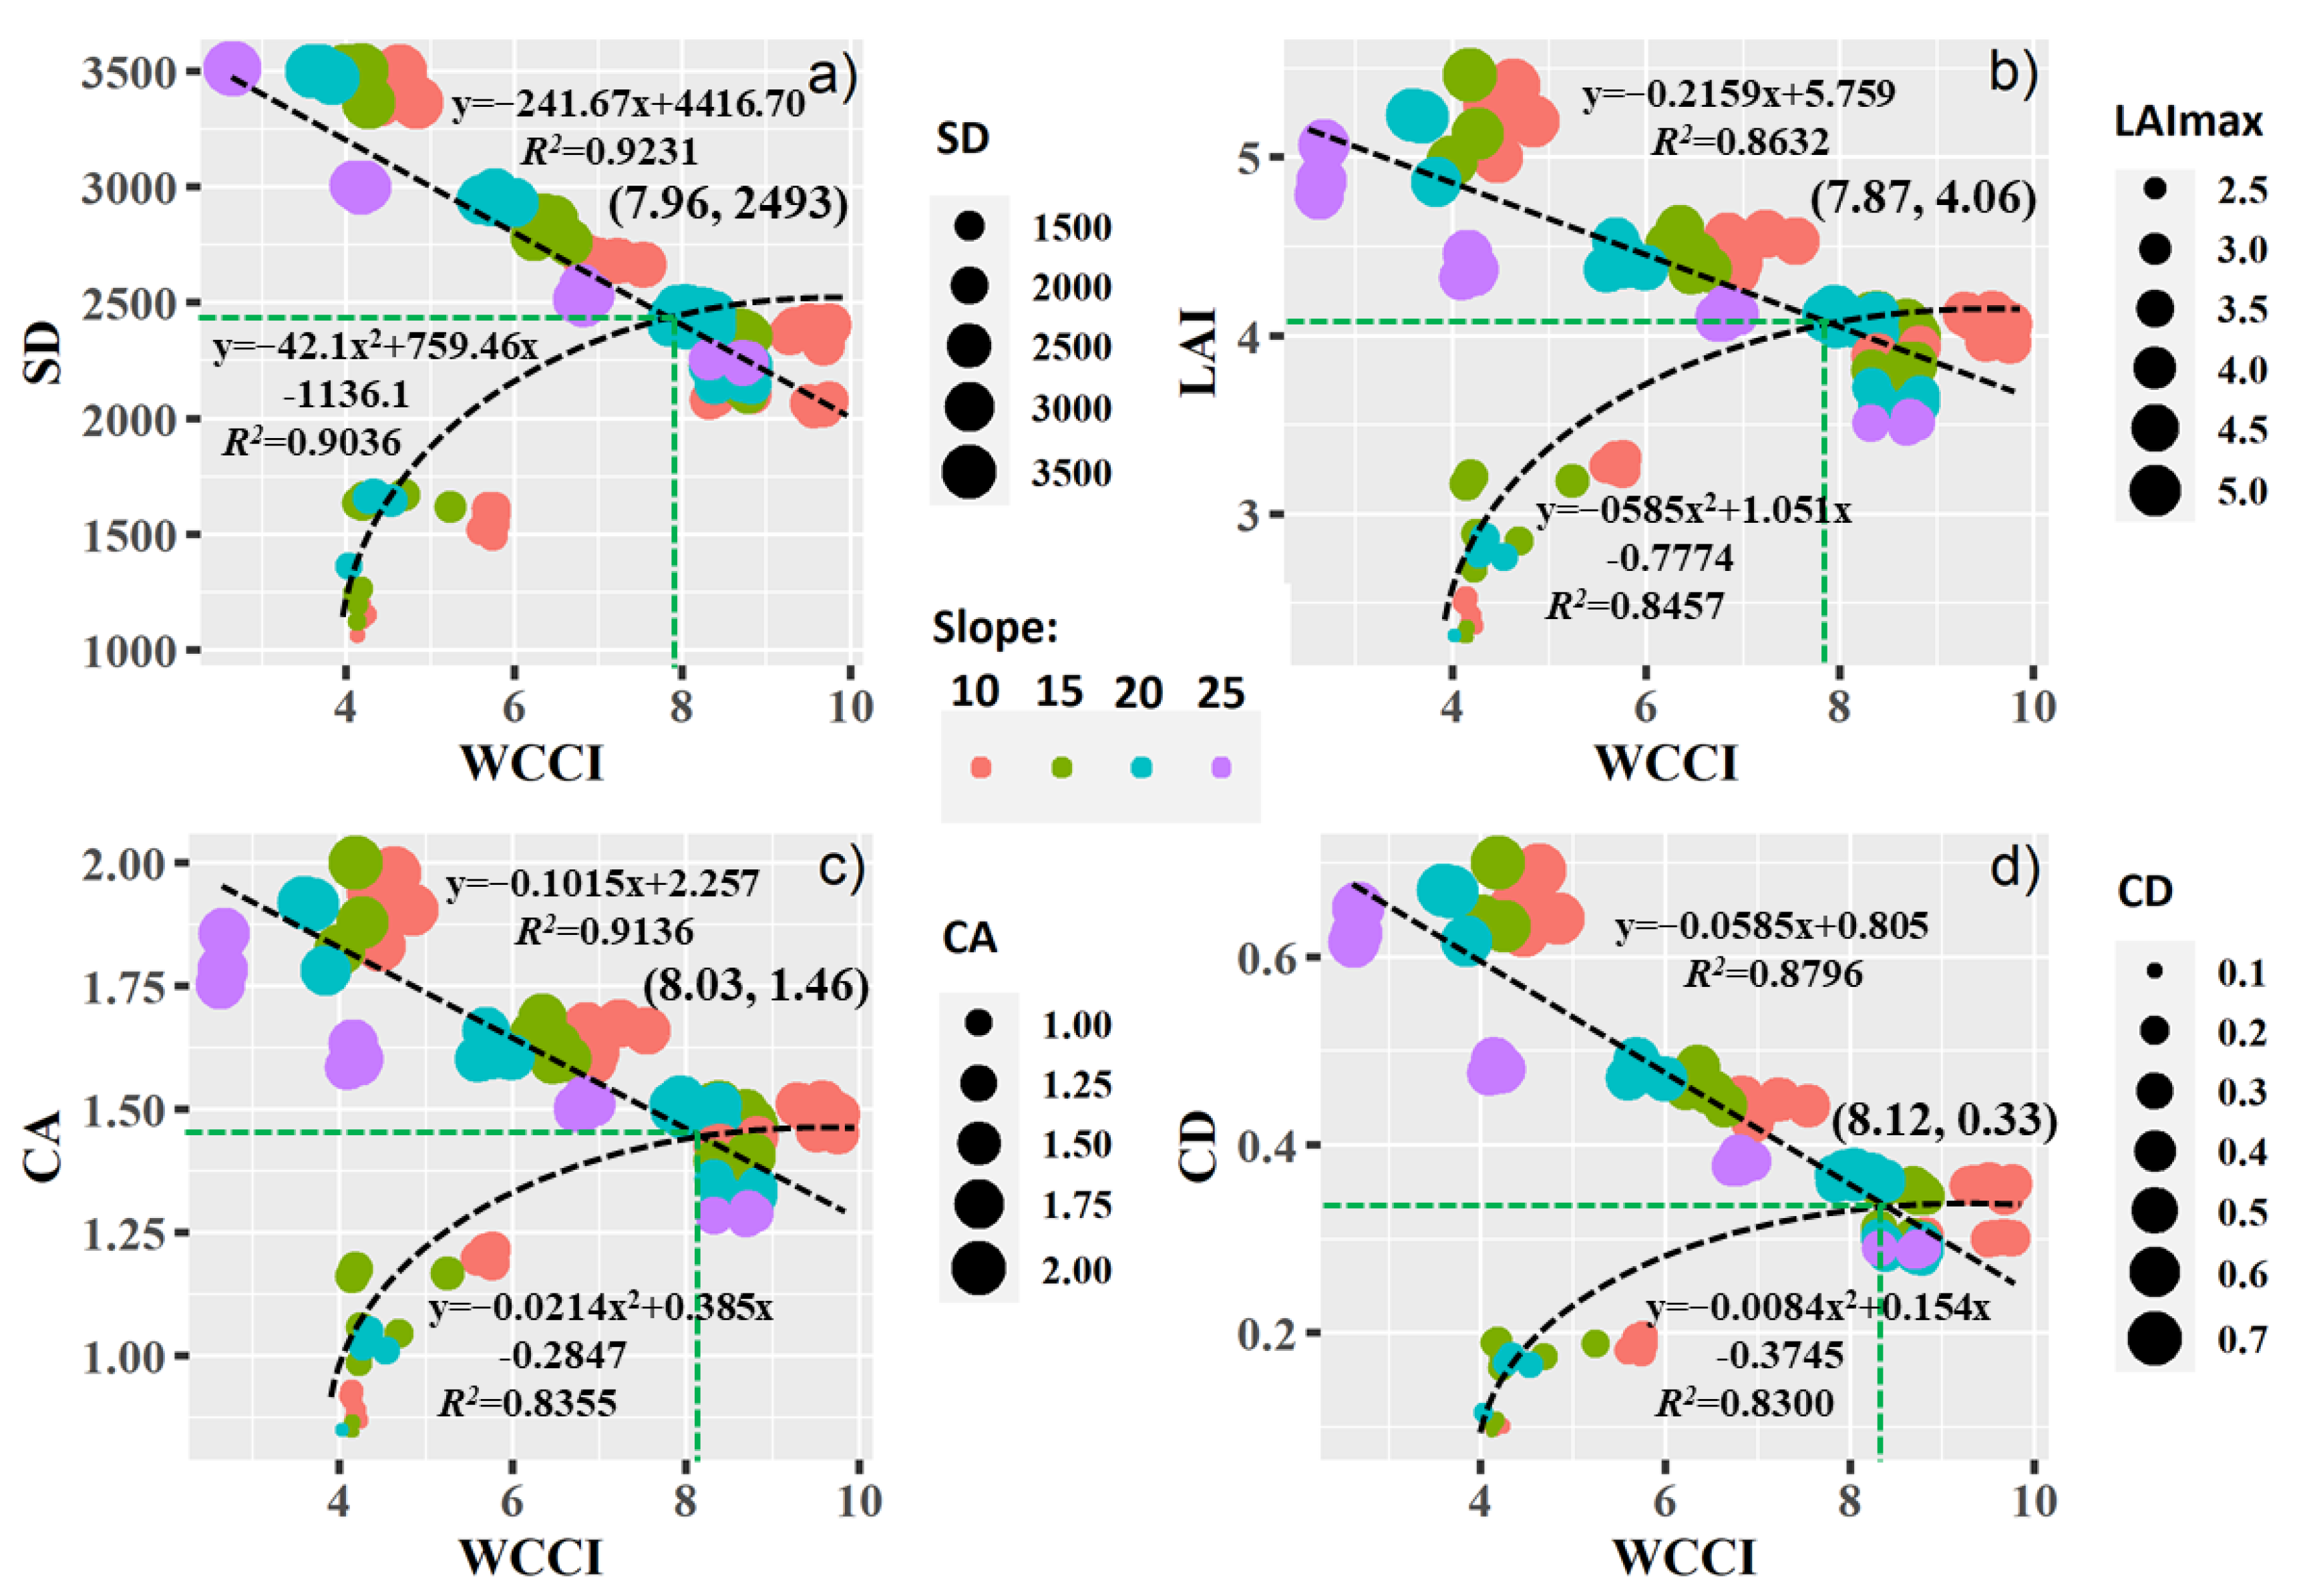
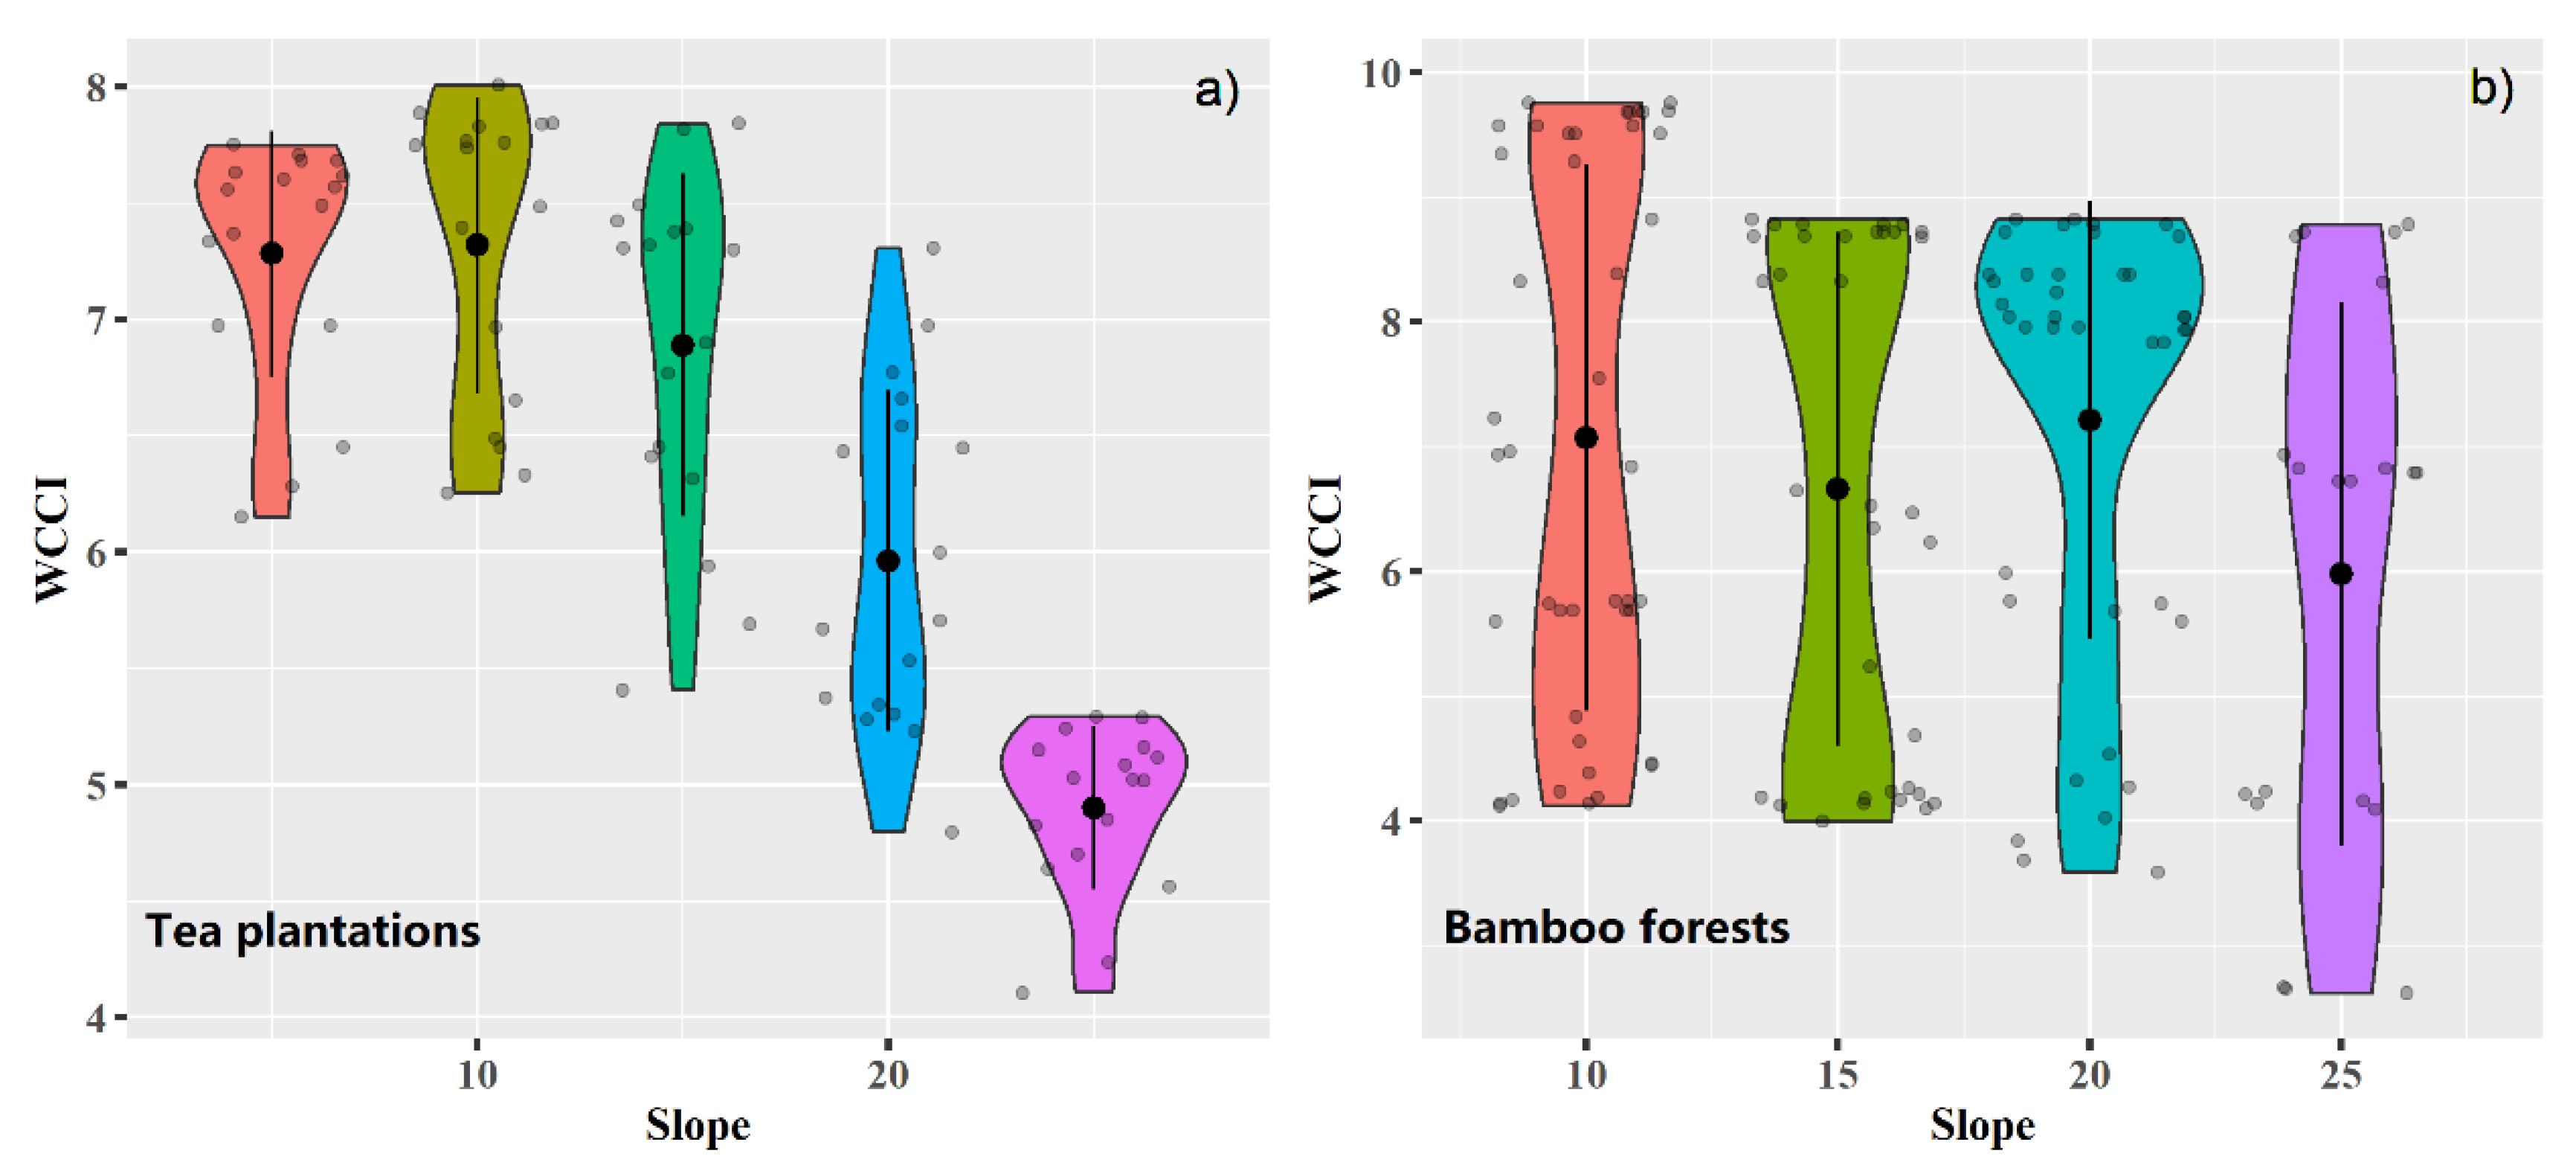
3.3. Characteristics and Influences of WCCI on Tea Plantations and Bamboo Forests

Figure 5 and Tables S2 and S3 show the site conditions and WCCI evaluation results of the survey sample sites, respectively, for 221 bamboo forests and tea plantations. The SD values of bamboo forest sample points ranged from 1000 plants/ha to 3500 plants/ha, with LAImax, CA, CD, and plant DHB values ranging from 2.3 m2 m−2 to 5.4 m2 m−2, 0.85 m2 to 1.98 m2, 0.09 to 0.70, and 5.2 cm to 10 cm, respectively. The selection of tea plantation survey sampling points in this study mainly focused on tea ages of 5 years or more. Given the same planting system, the tea plantation sites had similar SD (approximately 41,000 plants/ha), LAImax (4.6 m2 m−2), CA (0.86 m2), CD (0.83), and plant DHB (3.6 cm) values. The survey sample points of bamboo forests had maximum and minimum WCCI values of 2.62 and 9.76, respectively, with an average WCCI of 6.85. For tea plantations, the maximum and minimum WCCI values were 4.11 and 8.00, respectively, with an average WCCI of 6.47.
Figure 6 shows the relationships among SD, LAImax, CA, and CD of bamboo forests and WCCI. A significant extremum phenomenon was observed between the WCCI and the structural parameters of bamboo forests. When the SD values of bamboo forests ranged from 2000 plants/ha to 2500 plants/ha, the LAImax, CA, and CD values measured 3.5–4.3 m2 m−2, 1.25–1.52 m2, and 0.27–0.40, respectively, and a high WCCI level was observed for the bamboo forests. These results indicate that the structural parameters of bamboo forests are the key factors influencing the water conservation function, and the optimization of bamboo stand structure can enhance its water conservation function. This finding is consistent with those of previous case studies on the improvement of soil conservation and timber production through structural parameter optimization of natural forests [23,24]. Moreover, SD, as the most operational and decisive factor for forest management practice, has been used by many researchers to improve ecosystem functions [48,49]. The SEM results in our study also support SD as a key factor in the water conservation of bamboo forests, which can be used to notably improve their water conservation function (Figure S8).
Compared with the bamboo forests, the tea plantation sample plots in this study exhibited the same planting system and similar stand structures, such as SD and LAI. However, significant differences in the distribution characteristics of WCCI were observed in tea plantations between different slopes (Figure 7a) (p < 0.001). When the slopes of the sample plots were greater than 20°, a considerable decrease in WCCI was detected. In particular, when the slope was greater than 25°, the average WCCI in tea plantations was less than 5. This result was mainly due to the changes in the ecological and hydrological processes in tea plantations caused by the different slopes. On steep slopes, the pruning of the tea plantation canopy during the rainy season led to high runoff production and low water storage, which resulted in a low water conservation function (Figure S9). Previous studies also have reported the significant increase in surface runoff and substantial decline in soil water storage capacity with rising slopes for tea plantations [50,51]. However, no significant differences were observed in the WCCI between various slopes for bamboo forests (p > 0.05) (Figure 7b). The results indicate that strict control should be exercised in development at steep slopes above 20° to prevent a violent decline in the regional water conservation function during tea plantation expansion.

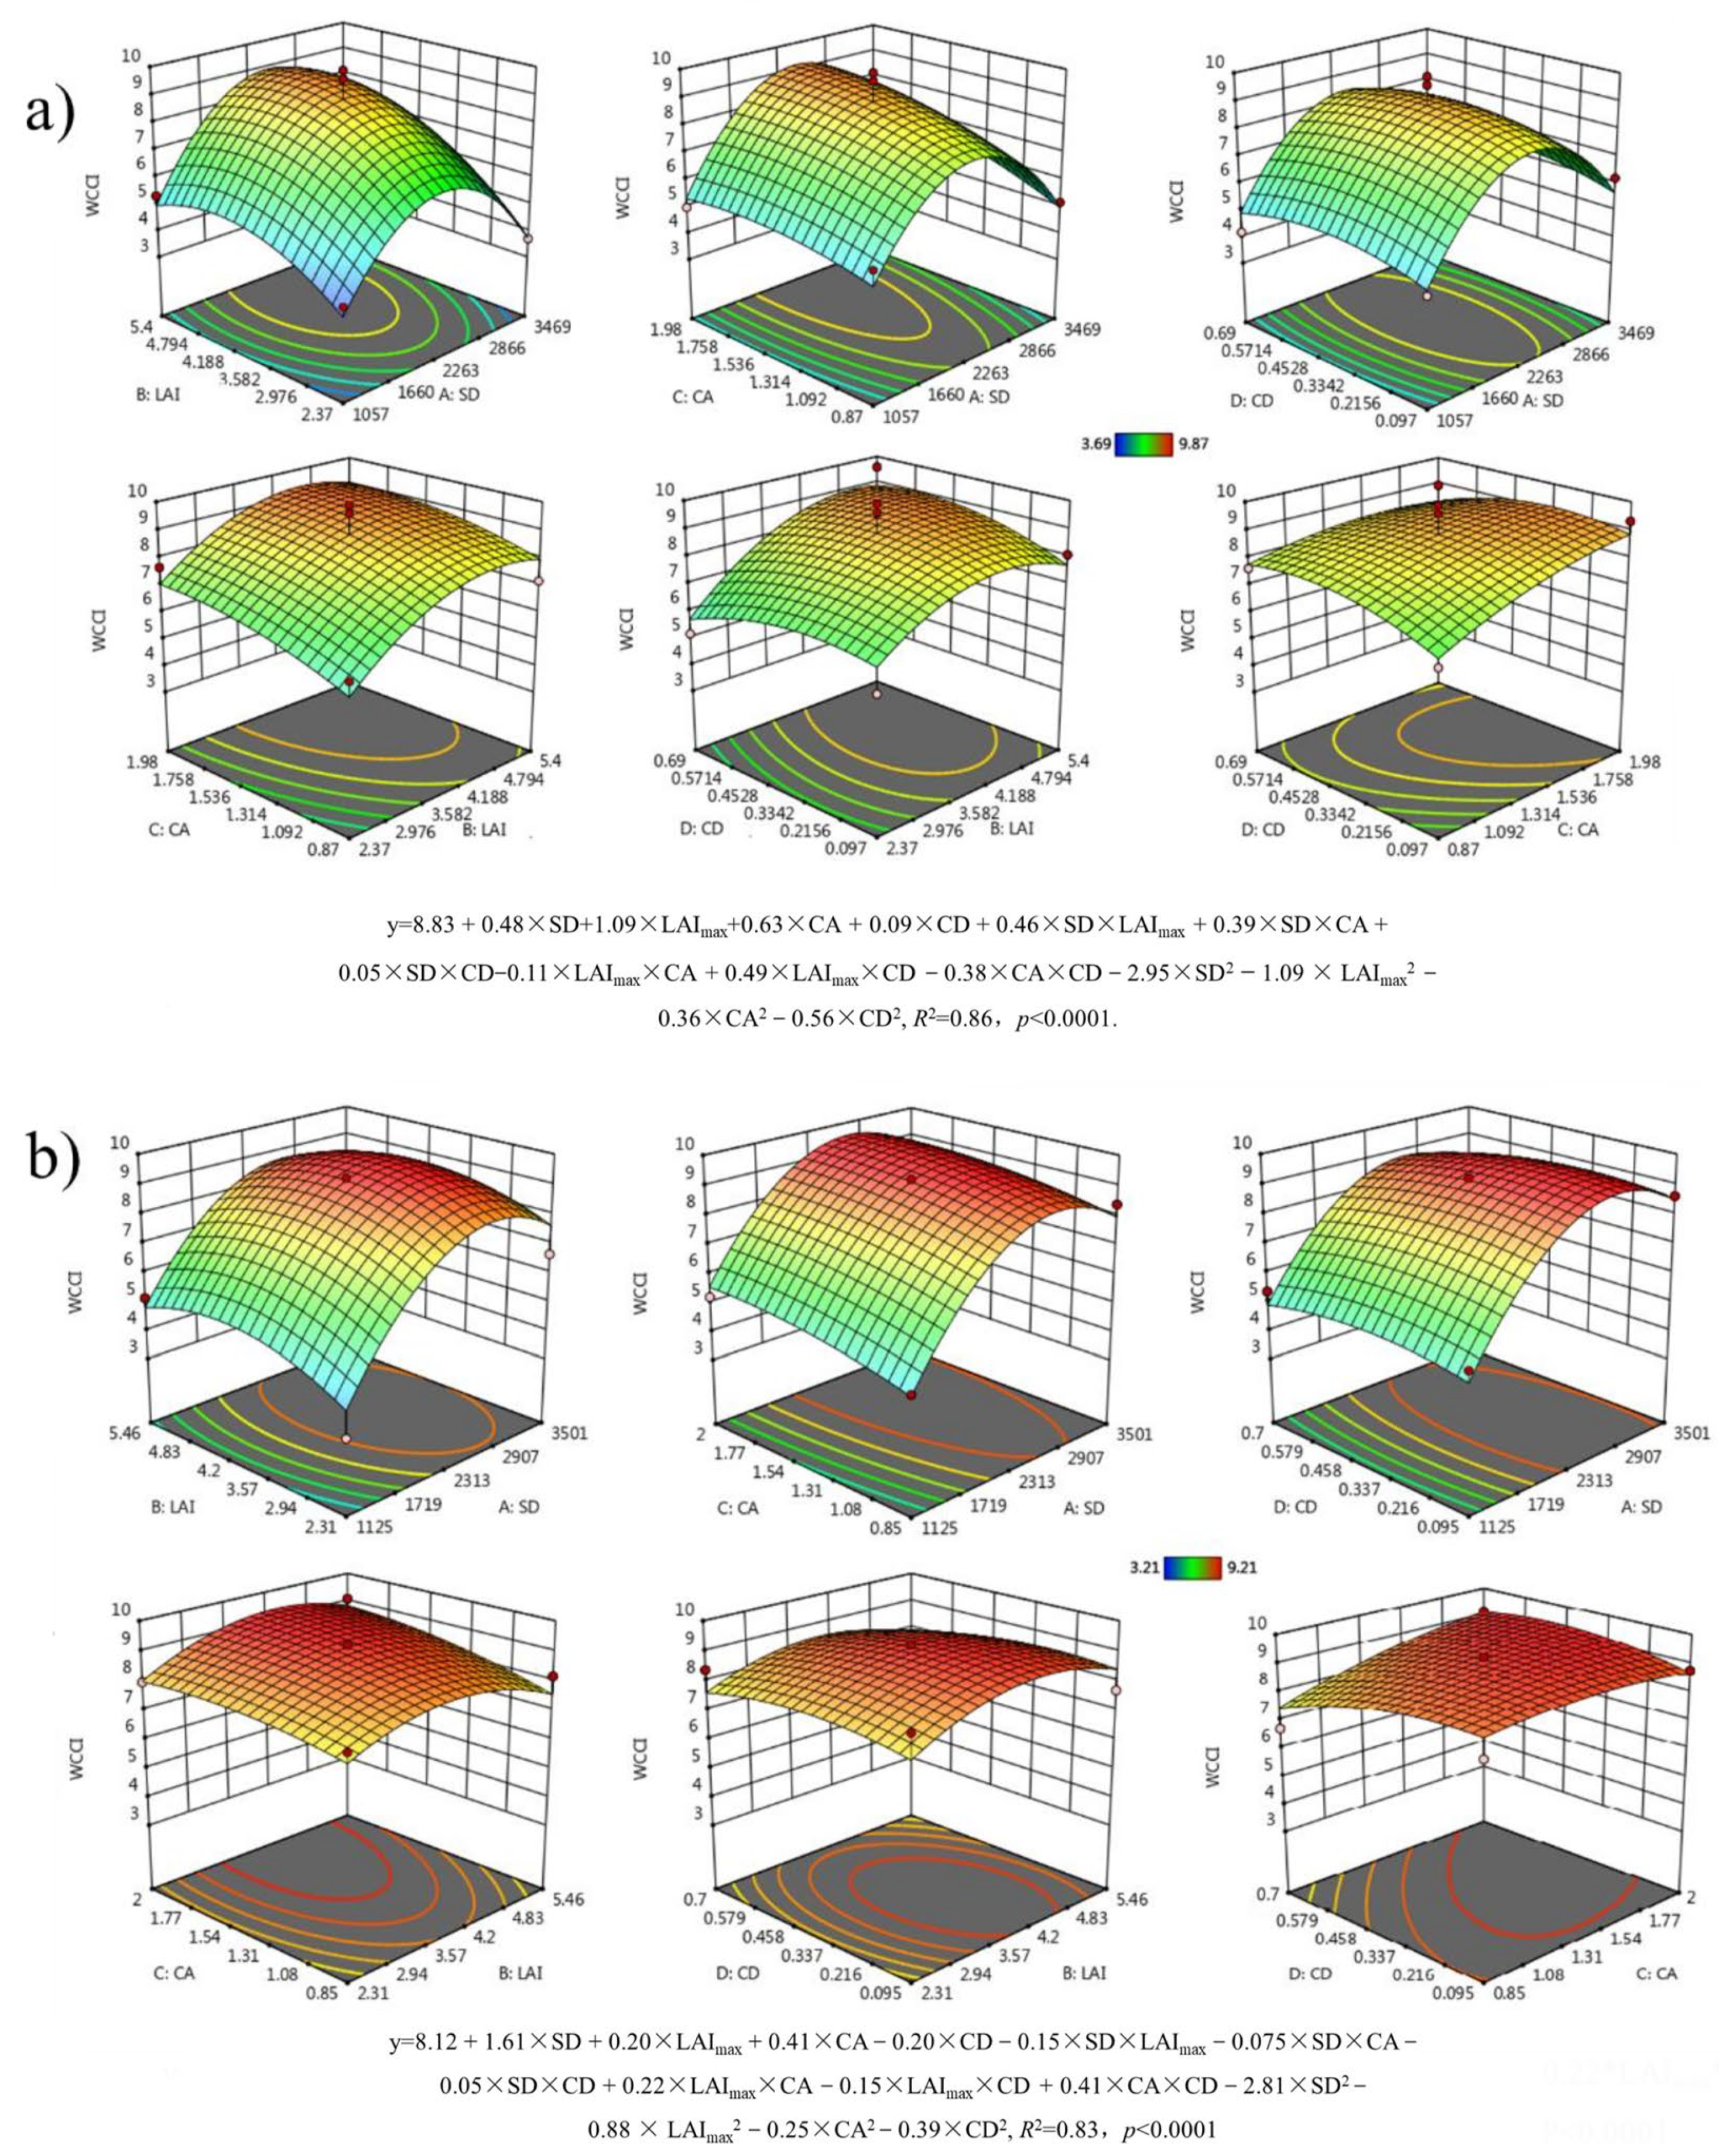
3.4. Optimization of Stand Structures of Bamboo Forests

The structural parameters of bamboo forests are key factors influencing the water conservation function, and the optimization of bamboo stand structures can enhance this function. In this study, we used RSM to optimize the structure of bamboo forests to enhance their water conservation function. Figure 8, Figures S10 and S11 display the RSM results for bamboo forests at different slopes. The determination coefficient (R2) values of the four quadratic multiple regression equations were all above 0.85, and the p values were all less than 0.05, indicating the significance of the quadratic multiple regression equation and the applicability of RSM in determining the optimal stand structures of bamboo forests at different slopes.
Figure 8 illustrates the optimal results for bamboo forests obtained using the RSM within the slope ranges of <10° and 10–15°. The optimal stand structural parameters for the water conservation function of bamboo forests below the 10° slopes predicted by RSM were as follows: SD = 2263 plants/ha, LAImax = 3.57 m2 m−2, CA = 1.42 m2, and CD = 0.53. The optimal stand structural parameters between the 10 and 15° slopes were SD = 2312 plants/ha, LAImax = 3.89 m2 m−2, CA = 1.43 m2, and CD = 0.51. The optimal stand structures for the water conservation function between 15 and 20° slopes of bamboo forests predicted by RSM were as follows: SD = 2430 plants/ha, LAImax = 3.78 m2 m−2, CA = 1.38 m2, and CD = 0.55 (Figure S10). At slopes above 20°, the optimal stand structural parameters of bamboo forests predicted by RSM were SD = 2841 plants/ha, LAImax = 4.28 m2 m−2, CA = 1.57 m2, and CD = 0.56 (Figure S11). Meanwhile, the maximum predicted WCCI values for the four different slopes were 9.87, 9.21, 9.13, and 9.16. The optimization results were different under different slope conditions, and SD showed a considerable increase with increasing slope according to the optimal results of bamboo forests. The main reason for these results is the influence of different slope conditions on the soil and vegetation hydrographic characteristics of bamboo forests. Our simulation results using the LWFBrook90 model show an increasing trend of surface runoff along with a slope increase for bamboo forests at same SD level. In addition, differences in underlying surface conditions (such as initial soil moisture status, soil physical properties, and root distribution) also affect the hydrological processes of the water conservation function of bamboo forests at different slopes [47]. Hence, the differences in soil and vegetation hydrographic characteristics at different slopes resulted in differences in optimal configurations of the stand structures for the bamboo forests. Overall, through the structural optimization of bamboo forests, their water conservation function be improved by approximately 22.6%–53.2%. Previous studies also documented similar results for soil and water conservation through the optimization of forest structural parameters [23,52]. However, the optimization of the structure of bamboo stands was merely aimed at enhancing the water conservation function using the RSM method; other ecological benefits were not considered during optimization, which might lead to exacerbation of the trade-offs between water conservation and other ecological benefits. Therefore, in the practical optimization of bamboo stand structure, other key ecological benefits must be considered for coordination and balance.

3.5. Trade-Off between Water Conservation and Carbon Sequestration in Bamboo Forests

Previous studies have reported an exacerbated trade-off between water conservation and carbon sequestration for natural forests [10,11]. Hence, an attempt was made to determine the optimal stand structure parameters that may balance the competing ecosystem services of water conservation and carbon sequestration based on the model simulation in this study. The bamboo forest carbon sequestration was obtained based on the simulation using the Biome-BGCMUSO 6.2 model. Among the overstory stand structural parameters (SD, LAI, and CD), which can directly or indirectly affect WCCI and carbon sequestration, the correlation between the C-sequestration (NEP) and SD (0.87) was higher than those for the other stand structure parameters. This means that SD has the greatest impact on C-sequestration (NEP) among the stand structure parameters. Meanwhile, SD, as the most operational factor for forest management practices, has been used by many researchers to improve ecosystem functions [49,53]. Hence, SD was chosen as the main predictor for WCCI and C-sequestration. Figure 9 shows plotted variation curves of WCCI and carbon sequestration against SD values at different slopes (R2 = 0.74–0.97, p < 0.001 for WCCI and R2 = 0.72–0.86, p < 0.001 for carbon sequestration), which have goodness of fit. In general, before the WCCI reached its highest value, a significant synergistic relationship was observed between the WCCI and carbon sequestration, which later became a trade-off relationship at slopes less than 20° (Figure 9). The SD at the intersection of the WCCI and carbon sequestration curves corresponded to a WCCI of 7.9–8.6 and a carbon sequestration of 686–717 g C m−2 a−1. The selection of SD around the highest value of WCCI (2200–2300 tree/ha) will lead to disproportionate carbon sequestration loss. Thus, an optimal SD of approximately 2600 tree/ha should be maintained to achieve high WCCI and adequate carbon sequestration. Under the selected SD, the carbon sequestration levels were 1.54%, 3.49%, and 3.65% higher, but the WCCI levels were 1.23%, 1.75%, and 3.63% lower than those under the maximum densities of 2200, 2300, and 2350 trees/ha at different slopes, respectively. Hence, the proper SD values of bamboo forests were approximately 2500, 2600, and 2650 trees/ha at slopes of 10°, 15°, and 20°, respectively. However, at slopes >20°, a strong trade-off was observed between water conservation and carbon sequestration, and competing ecosystem services accompanied those, which were hard to balance and which resulted here in disproportionate water conservation at the cost of carbon sequestration loss. Overall, as precise decision-making tools, the models and relationships developed and fitted in this study can be used to determine the appropriate SD to balance the competitive services of water conservation and carbon sequestration functions. The WCCI and carbon sequestration increased by approximately 22.6% and 13.7%, respectively, compared with their corresponding average values observed in bamboo forests at slopes <20°. However, on steep slopes, the most important ecosystem services must be selected as the optimization and improvement goals (water conservation or carbon sequestration) for bamboo forests in terms of regional needs.

3.6. Limitations of This Study

The preliminary progress made in this study can serve as a reference for future research and guide the restoration and multifunctional management of degraded natural and artificial forests. However, the application potential of the study results is limited due to the uncertainty in model simulation. Overall, the simulation results of the LWF-Brook90 and Biome-BGC models were satisfactory in our study. However, there was an overestimation of soil water for tea plantations in the non-growing season, which might have caused a decrease in the WCCI value of tea plantations. Furthermore, this study only considered a young age range of tea plantations (5–17 years). To improve on this, we propose that future studies should include a broader variation in tea plantation stand structure with a greater age range.

4. Conclusions

In this study, we investigated the water conservation functions of tea plantations and bamboo forests and developed a comprehensive method to evaluate water conservation based on field surveys, monitoring, and process model (LWFBrook90 and Biome-BGC model) simulations of 221 tea plantation and bamboo forest samples in the field. The trade-offs between water conservation and carbon sequestration ecosystem services were also quantified. Overall, tea plantations had lower water conservation levels than bamboo forests. The slope was the most critical influencing variable affecting the water conservation of tea plantations, and steep slopes above 20° significantly decreased the water conservation capacity. SD was the most operational and decisive factor for the water conservation of bamboo forests. Maintaining the SD of bamboo forests at approximately 2600 can maintain a high WCCI and adequate carbon sequestration. Under this scenario, water conservation and carbon sequestration increased by approximately 22.6% and 13.7%, respectively, compared with the average values for bamboo forests. However, at slopes >20°, a strong trade-off was observed between water conservation and carbon sequestration, and competing ecosystem services accompanied those, which were hard to balance and which resulted here in disproportionate water conservation at the cost of carbon sequestration loss from bamboo forests. This study provides evaluation and improvement methods that can serve as a reference for future research and guide the restoration and multifunctional management of degraded natural and artificial forests.

Supplementary Materials

The following supporting information can be downloaded at: https://www.mdpi.com/article/10.3390/f15010189/s1, Figure S1: Simulated and measured values of evapotranspiration (ET) of tea plantation and bamboo forest using LWFBrook90 model from 2016 to 2018; Figure S2: Comparison of soil water storage of tea plantation and bamboo forest between measured and simulated value using the LWFBrook90 model; Figure S3: Simulated and measured values of net ecosystem productivity (NEP) of tea plantation and bamboo forest using the Biome-BGCMUSO 6.2 model in 2018; Figure S4: The general schedule of phenology, managements and rainy/dry season for the study tea plantations; Figure S5: Characteristics of throughfall before and after pruning for tea plantation; Figure S6: Water holding characteristics of new leaves for tea plantation and bamboo forest; Figure S7: Response of soil moisture to precipitation in different seasons for tea plantations and bamboo forests; Figure S8: Structural equation modeling (SEM) effects on water conservation capacity; Figure S9: High-resolution Google remote images illustrating slope and water conservation characteristic for tea plantations; Figure S10: Optimal results of the stand structure in bamboo forests (15° < slope < 20°); Figure S11: Optimal results of the stand structure in bamboo forests (20° < slope); Table S1: Seasonal variations of major biophysical parameters at the tea plantation; Table S2: Evaluation results of the WCCI of the bamboo forests; Table S3: Evaluation results of the WCCI of the tea plantations; Table S4: Error analysis of simulated and observed soil water content of tea plantation in 2015 and bamboo forest in 2017.

Author Contributions

H.L. designed the research; J.G., Y.S. (Yunjie Shi), J.P. and Y.S. (Yuyang Shao) collected the data and performed the measurements; J.G. wrote the manuscript. All authors have read and agreed to the published version of the manuscript.

Funding

This research was supported by the National Natural Science Foundation (Nos. 42201127, 41877513), the Science and Technology Planning Project of the Yunnan Provincial Department of Science and Technology (202202AE090034), and the Science and Technology Planning Project of NIGLAS (NIGLAS2022GS10).

Data Availability Statement

The data presented in this study are available on request from the corresponding author.

Conflicts of Interest

The authors declare no conflict of interest.

References

  1. Li, H.; Aide, T.M.; Ma, Y.; Liu, W.; Cao, M. Demand for rubber is causing the loss of high diversity rain forest in SW China. Biodivers. Conserv. 2007, 16, 1731–1745. [Google Scholar] [CrossRef]
  2. Spera, S.A.; Cohn, A.S.; VanWey, L.K.; Mustard, J.F.; Rudorff, B.F.; Risso, J.; Adami, M. Recent cropping frequency, expansion, and abandonment in Mato Grosso, Brazil had selective land characteristics. Environ. Res. Lett. 2014, 9, 064010. [Google Scholar] [CrossRef]
  3. Su, S.; Zhou, X.; Wan, C.; Li, Y.; Kong, W. Land use changes to cash crop plantations: Crop types, multilevel determinants and policy implications. Land Use Policy 2016, 50, 379–389. [Google Scholar] [CrossRef]
  4. Fan, L.; Han, W. Soil respiration after forest conversion to tea gardens: A chronosequence study. Catena 2020, 190, 104532. [Google Scholar] [CrossRef]
  5. Geng, J.W.; Li, H.P.; Pang, J.P.; Zhang, W.S.; Chen, D.Q. Dynamics and environmental controls of energy exchange and evapotran-spiration in a hilly tea plantation, China. Agric. Water Manag. 2020, 241, 106364. [Google Scholar] [CrossRef]
  6. FAO. FAO Stat Data. 2017. Available online: https://faostat.fao.org (accessed on 27 December 2017).
  7. Chiu, Y.-C.; Chen, B.-J.; Su, Y.-S.; Huang, W.-D.; Chen, C.-C. A Leaf Disc Assay for Evaluating the Response of Tea (Camellia sinensis) to PEG-Induced Osmotic Stress and Protective Effects of Azoxystrobin against Drought. Plants 2021, 10, 546. [Google Scholar] [CrossRef]
  8. Naudiyal, N.; Wang, J.; Ning, W.; Gaire, N.P.; Peili, S.; Wei, Y.; He, J.; Ning, S. Potential distribution of Abies, Picea, and Juniperus species in the sub-alpine forest of Minjiang headwater region under current and future climate scenarios and its implications on ecosystem services supply. Ecol. Indic. 2021, 121, 107131. [Google Scholar] [CrossRef]
  9. Geng, J.; Li, H.; Pang, J.; Zhang, W.; Shi, Y. The effects of land-use conversion on evapotranspiration and water balance of subtropical forest and managed tea plantation in Taihu Lake Basin, China. Hydrol. Process. 2022, 36, e14652. [Google Scholar] [CrossRef]
  10. Takele, E.; Kallenbach, R. Analysis of the impact of alfalfa forage production under summer water-limiting circumstances on productivity, agricultural and growers returns and plant stand. J. Agron. Crop Sci. Z. Acker Pflanzenbau 2001, 187, 41–46. [Google Scholar] [CrossRef]
  11. Zuo, L.; Gao, J. Investigating the compounding effects of environmental factors on ecosystem services relationships for Ecological Conservation Red Line areas. Land Degrad. Dev. 2021, 32, 4609–4623. [Google Scholar] [CrossRef]
  12. Ma, G.; Mansur, S.; Zhang, X. Water Conservation Function of Different Vegetation Types in the Upper Tailan River in Mount Tumor Nature Reserve. J. Soil Water Conserv. 2018, 32, 210–216. [Google Scholar]
  13. He, S.; Li, X.; Mo, F.; Zhou, B.; Gao, G. The water conservation study of typical forest ecosystems in the forest transect of eastern China. Acta Ecol. Sin. 2011, 31, 3285–3295. [Google Scholar]
  14. Wang, X.; Shen, H.; Li, X.; Jing, F. Concepts, processes and quantification methods of the forest water conservation at the multiple scales. Acta Ecol. Sin. 2013, 33, 1019–1030. [Google Scholar] [CrossRef]
  15. Nelson, E.; Mendoza, G.; Regetz, J.; Polasky, S.; Tallis, H.; Cameron, D.R.; Chan, K.M.; Daily, G.C.; Goldstein, J.; Kareiva, P.M.; et al. Modeling multiple ecosystem services, biodiversity conservation, commodity production, and tradeoffs at landscape scales. Front. Ecol. Environ. 2009, 7, 4–11. [Google Scholar] [CrossRef]
  16. Xiao, H.; Ouyang, Z.; Zhao, J.; Wang, X. Forest ecosystem services and their ecological valuation—A case study of tropical forest in Jianfengling of Hainan Island. Ying Yong Sheng Tai Xue Bao J. Appl. Ecol. 2000, 11, 481–484. [Google Scholar]
  17. Zhang, C.; Li, W.; Zhang, B.; Yang, Y.; Dong, D.; Pan, C. Water Conservation of Forest Ecosystem and its Spatial Differences Based on Dynamics of Soil Water Storage in Anji County. J. Nat. Resour. 2012, 27, 697–704. [Google Scholar]
  18. Deng, K.; Shi, P.; Xie, G. Water conservation of forest ecosystem in the upper reaches of Yangtze River and its benefits. Resour. Sci. 2002, 24, 68–73. [Google Scholar]
  19. Zuo, D.; Chen, G.; Wang, G.; Xu, Z.; Han, Y.; Peng, D.; Pang, B.; Abbaspour, K.C.; Yang, H. Assessment of changes in water conservation capacity under land degradation neutrality effects in a typical watershed of Yellow River Basin, China. Ecol. Indic. 2023, 148, 110145. [Google Scholar] [CrossRef]
  20. Wang, T.; Gong, Z. Evaluation and analysis of water conservation function of ecosystem in Shaanxi Province in China based on “Grain for Green” Projects. Environ. Sci. Pollut. Res. 2022, 29, 83878–83896. [Google Scholar] [CrossRef]
  21. Wang, N.; Bi, H.; Peng, R.; Zhao, D.; Liu, Z. Disparities in soil and water conservation functions among different forest types and implications for afforestation on the Loess Plateau. Ecol. Indic. 2023, 155, 110935. [Google Scholar] [CrossRef]
  22. Rana, S.; Cheng, X.; Wu, Y.; Hu, C.; Jemim, R.S.; Liu, Z.; Wang, Y.; Cai, Q.; Geng, X.; Guo, X.; et al. Evaluation of soil and water conservation function in the Wugong mountain meadow based on the comprehensive index method. Heliyon 2022, 8, e11867. [Google Scholar] [CrossRef] [PubMed]
  23. Hou, G.; Bi, H.; Wei, X.; Wang, N.; Cui, Y.; Zhao, D.; Ma, X.; Wang, S. Optimal configuration of stand structures in a low-efficiency Robinia pseudoacacia forest based on a comprehensive index of soil and water conservation ecological benefits. Ecol. Indic. 2020, 114, 106308. [Google Scholar] [CrossRef]
  24. Ahmad, B.; Wang, Y.; Hao, J.; Liu, Y.; Bohnett, E.; Zhang, K. Optimizing stand structure for trade-offs between overstory timber production and understory plant diversity: A case-study of a larch plantation in northwest China. Land Degrad. Dev. 2018, 29, 2998–3008. [Google Scholar] [CrossRef]
  25. Onyenankeya, K.; Onyenankeya, O.; Osunkunle, O. Communicating Water Conservation in Rural South Africa: The Nexus of Dialogue. J. Hum. Ecol. 2019, 67, 66–78. [Google Scholar] [CrossRef]
  26. Pang, J.; Li, H.; Yu, F.; Geng, J.; Zhang, W. Environmental controls on water use efficiency in a hilly tea plantation in southeast China. Agric. Water Manag. 2022, 269, 107678. [Google Scholar] [CrossRef]
  27. Zhou, Z.; Liu, Y.; Zhu, Q.; Lai, X.; Liao, K. Comparing the variations and controlling factors of soil N2O emissions and NO3–-N leaching on tea and bamboo hillslopes. Catena 2020, 188, 104463. [Google Scholar] [CrossRef]
  28. Pang, J.; Li, H.; Tang, X.; Geng, J. Carbon dynamics and environmental controls of a hilly tea plantation in Southeast China. Ecol. Evol. 2019, 9, 9723–9735. [Google Scholar] [CrossRef]
  29. Zhang, W.; Li, H.; Hyndman, D.W.; Diao, Y.; Geng, J.; Pueppke, S.G. Water quality trends under rapid agricultural expansion and enhanced in-stream interception in a hilly watershed of Eastern China. Environ. Res. Lett. 2020, 15, 084030. [Google Scholar] [CrossRef]
  30. Liao, K.H.; Lv, L.G.; Yang, G.S.; Zhu, Q. Sensitivity of simulated hillslope subsurface flow to rainfall patterns, soil texture and land use. Soil Use Manag. 2016, 32, 422–432. [Google Scholar] [CrossRef]
  31. Hui, G.Y.; Klaus, V.G.; Hu, Y.B.; Xu, H. Structure-Based Forest Management; China Forestry Publishing House: Beijing, China, 2007. [Google Scholar]
  32. Schmidt-Walter, P.; Trotsiuk, V.; Meusburger, K.; Zacios, M.; Meesenburg, H. Advancing simulations of water fluxes, soil moisture and drought stress by using the LWF-Brook90 hydrological model in R. Agric. For. Meteorol. 2020, 291, 108023. [Google Scholar] [CrossRef]
  33. Baumgarten, M.; Weis, W.; Kühn, A.; May, K.; Matyssek, R. Forest transpiration—Targeted through xylem sap flux assessment versus hydrological modeling. Eur. J. For. Res. 2014, 133, 677–690. [Google Scholar] [CrossRef]
  34. Bauwe, A.; Criegee, C.; Glatzel, S.; Lennartz, B. Model-based analysis of the spatial variability and long-term trends of soil drought at Scots pine stands in northeastern Germany. Eur. J. For. Res. 2012, 131, 1013–1024. [Google Scholar] [CrossRef]
  35. Schwärzel, K.; Feger, K.-H.; Häntzschel, J.; Menzer, A.; Spank, U.; Clausnitzer, F.; Köstner, B.; Bernhofer, C. A novel approach in model-based mapping of soil water conditions at forest sites. For. Ecol. Manag. 2009, 258, 2163–2174. [Google Scholar] [CrossRef]
  36. Cramer, W.; Kicklighter, D.W.; Bondeau, A.; Iii, B.M.; Churkina, G.; Nemry, B.; Ruimy, A.; Schloss, A.L. The participants of the Potsdam NPP Model Intercomparison. Comparing global models of terrestrial net primary productivity (NPP): Overview and key results. Glob. Chang. Biol. 1999, 5, 1–15. [Google Scholar] [CrossRef]
  37. Thornton, P.E.; Law, B.E.; Gholz, H.L.; Clark, K.L.; Falge, E.; Ellsworth, D.S.; Goldstein, A.H.; Monson, R.K.; Hollinger, D.; Falk, M.; et al. Modeling and measuring the effects of disturbance history and climate on carbon and water budgets in evergreen needleleaf forests. Agric. For. Meteorol. 2002, 113, 185–222. [Google Scholar] [CrossRef]
  38. Engstrom, R.; Hope, A. Parameter Sensitivity of the Arctic Biome–BGC Model for Estimating Evapotranspiration in the Arctic Coastal Plain. Arctic Antarct. Alp. Res. 2011, 43, 380–388. [Google Scholar] [CrossRef]
  39. Li, X.; Sun Osbert, J. Testing parameter sensitivities and uncertainty analysis of Biome-BGC model in simulating carbon and water fluxes in broadleaved-Korean pine forests. Chin. J. Plant Ecol. 2018, 42, 1131–1144. [Google Scholar] [CrossRef]
  40. Hidy, D.; Barcza, Z.; Hollos, R.; Dobor, L.; Acs, T.; Zachary, D.; Filep, T.; Pásztor, L.; Incze, D.; Dencső, M.; et al. Soil-related developments of the Biome-BGCMuSo v6.2 terrestrial ecosystem model. Geosci. Model Dev. 2022, 15, 2157–2181. [Google Scholar] [CrossRef]
  41. Hidy, D.; Barcza, Z.; Marjanović, H.; Sever, M.Z.O.; Dobor, L.; Gelybó, G.; Fodor, N.; Pintér, K.; Churkina, G.; Running, S.; et al. Terrestrial ecosystem process model Biome-BGCMuSo v4.0: Summary of improvements and new modeling possibilities. Geosci. Model Dev. 2016, 9, 4405–4437. [Google Scholar] [CrossRef]
  42. Fodor, N.; Pasztor, L.; Szabo, B.; Laborczi, A.; Pokovai, K.; Hidy, D.; Hollós, R.; Kristóf, E.; Kis, A.; Dobor, L.; et al. Input database related uncertainty of Biome-BGCMuSo agro-environmental model outputs. Int. J. Digit. Earth 2021, 14, 1582–1601. [Google Scholar] [CrossRef]
  43. Ren, H.; Zhang, L.; Yan, M.; Tian, X.; Zheng, X. Sensitivity analysis of Biome-BGCMuSo for gross and net primary productivity of typical forests in China. For. Ecosyst. 2022, 9, 100011. [Google Scholar] [CrossRef]
  44. Aslan, N.; Cebeci, Y. Application of Box–Behnken design and response surface methodology for modeling of some Turkish coals. Fuel 2007, 86, 90–97. [Google Scholar] [CrossRef]
  45. Xue, J.; Li, Z.; Feng, Q.; Gui, J.; Zhang, B. Spatiotemporal variations of water conservation and its influencing factors in ecological barrier region, Qinghai-Tibet Plateau. J. Hydrol. Reg. Stud. 2022, 42, 10598. [Google Scholar] [CrossRef]
  46. Liao, K.-H.; Xu, S.-H.; Wu, J.-C.; Ji, S.-H.; Lin, Q. Assessing Soil Water Retention Characteristics and Their Spatial Variability Using Pedotransfer Functions. Pedosphere 2011, 21, 413–422. [Google Scholar] [CrossRef]
  47. Zhu, Q.; Nie, X.; Zhou, X.; Liao, K.; Li, H. Soil moisture response to rainfall at different topographic positions along a mixed land-use hillslope. Catena 2014, 119, 61–70. [Google Scholar] [CrossRef]
  48. Barbier, S.; Gosselin, F.; Balandier, P. Influence of tree species on understory vegetation diversity and mechanisms involved—A critical review for temperate and boreal forests. For. Ecol. Manag. 2008, 254, 1–15. [Google Scholar] [CrossRef]
  49. Huo, H.; Feng, Q.; Su, Y.-H. The Influences of Canopy Species and Topographic Variables on Understory Species Diversity and Composition in Coniferous Forests. Sci. World J. 2014, 2014, 252489. [Google Scholar] [CrossRef]
  50. Liao, K.; Lai, X.; Zhou, Z.; Zhu, Q. Applying fractal analysis to detect spatio-temporal variability of soil moisture content on two contrasting land use hillslopes. Catena 2017, 157, 163–172. [Google Scholar] [CrossRef]
  51. Zhu, Q.; Zhou, Z.; Duncan, E.W.; Lv, L.; Liao, K.; Feng, H. Integrating real-time and manual monitored data to predict hillslope soil moisture dynamics with high spatio-temporal resolution using linear and non-linear models. J. Hydrol. 2017, 545, 1–11. [Google Scholar] [CrossRef]
  52. Jiang, X.J.; Liu, W.; Wu, J.; Wang, P.; Liu, C.; Yuan, Z.-Q. Land Degradation Controlled and Mitigated by Rubber-Based Agroforestry Systems through Optimizing Soil Physical Conditions and Water Supply Mechanisms: A Case Study in Xishuangbanna, China. Land Degrad. Dev. 2017, 28, 2277–2289. [Google Scholar] [CrossRef]
  53. Wilson, E.J.Z. Managing the Risks of Geologic Carbon Sequestration: A Regulatory and Legal Analysis. Ph.D. Thesis, Carnegie Mellon University, Pittsburgh, PA, USA, 2004. [Google Scholar]
Figure 1. Map of China (a) and locations of the Taihu Lake Basin (b) and the Shahe Reservoir catchment and the monitoring sites (c).
Forests 15 00189 g001
Figure 2. Index system for the comprehensive evaluation of the water conservation of bamboo and tea plantations.
Forests 15 00189 g002
Figure 3. Annual and seasonal precipitation (P), evapotranspiration (ET), soil water depletion (ΔS), and drainage (D) of tea plantations and bamboo forests.
Forests 15 00189 g003
Figure 4. Comparison of rainfall replenishment amounts in soil and coefficients between tea plantations and bamboo forests during different seasons.
Forests 15 00189 g004
Figure 5. Stand structure and WCCI characteristics of bamboo forests and tea plantations. (a) Distribution characteristics of SD for bamboo forests; (b) distribution characteristics of LAImax, CA, CD, and plant DHB for bamboo forests; (c) distribution characteristics of WCCI for bamboo forests; (d) distribution characteristics of WCCI for tea plantations.
Forests 15 00189 g005
Figure 6. WCCI in different stand structures of bamboo forests. (a) SD, (b) LAImax, (c) CA, and (d) crown density (CD). Data range from 90% of SD/LAImax/CA/CD’s average values to the maximum of the structural parameters was used for linear fitting. Data range from the minimum value of structural parameters to 110% of SD/LAImax/CA/CD’s average values was used for polynomial fitting.
Forests 15 00189 g006
Figure 7. Characteristics of WCCI at different slopes of tea plantations (a) and bamboo forests (b). Note that the WCCI value is dimensionless and the WCCI values cannot be directly compared between tea plantations and bamboo forests in absolute terms.
Forests 15 00189 g007
Figure 8. Optimal results for stand structures in bamboo forests based on the RSM at slopes < 10° (a) and (10° < slope < 15°) (b).
Forests 15 00189 g008
Figure 9. Variations in WCCI and carbon sequestration with tree density based on the inventory data for 135 bamboo forest plots and model simulations with different slopes.
Forests 15 00189 g009
Disclaimer/Publisher’s Note: The statements, opinions and data contained in all publications are solely those of the individual author(s) and contributor(s) and not of MDPI and/or the editor(s). MDPI and/or the editor(s) disclaim responsibility for any injury to people or property resulting from any ideas, methods, instructions or products referred to in the content.

