1. Introduction
Water transport in the xylem of coniferous trees is dependent on the efficiency of tracheids and bordered pits [
1,
2,
3]. In comparison with tracheids which have a short conduit-like appearance, the structure of bordered pits which possess a centrally thickened region called the torus, as well as a porous margo with radiating threads, is recognized as an important evolutionary trait that facilitates water transportation and prevents the spread of an embolism [
4,
5]. With the presence of minuscule pores in the margo, it has been suggested that bordered pits contribute more than half of the overall flow resistance in the xylem [
6,
7,
8]. Furthermore, the torus, which is elastically supported by the margo, experiences deflection due to the pressure difference between tracheids [
9]. The torus’s deflection could regulate the flow rate during high flow or even close pits under high pressure, which is the so-called valve effect [
10,
11]. The passive valve effect in bordered pits is characterized by the interaction between water flow and the torus–margo structure, as observed from a physical standpoint. However, there remains a lack of understanding regarding the mechanism of fluid–solid interaction in bordered pits and the impact of the bordered pits’ structure on passive water regulation.
The aspiration of bordered pits, to prevent gas bubbles from flowing out of tracheids, has been widely evidenced in the microscopic observation of samples collected from living trees [
12,
13,
14]. In a microscopic experiment [
15], gas bubbles in tracheids were obstructed by bordered pits. Bordered-pit structures have the potential to function as swinging-diaphragm check valves, controlling the movement of sap between adjacent tracheids [
16]. Sperry and Tyree [
17] revealed a notable decrease in the conifer stem conductivity of balsam fir (
Abies balsamea) and red cedar (
Juniperus virginiana) as the applied pressure increased. In contrast, the stem of the angiosperm sugar maple (
Acer saccharum) was observed to be almost unaffected by pressure variations. Similar findings were observed when the stem conductivities of Scots pine (
Pinus sylvestris), Sitka spruce (
Picea sitchensis), and Atlas cedar (
Cedrus atlantica) were influenced by pressure variations [
18]. The measurement of stem conductivities for western redcedar (
Thuja plicata), douglas fir (
Pseudotsuga menziesii), and western hemlock (
Tsuga heterophylla) demonstrated a nonlinear relationship between sap flux and the pressure gradient in the xylem [
19]. The results from [
17,
18,
19] supported the hypothesis that the deflection of a torus elastically suspended by the margo could passively regulate the hydraulic conductivity in the bordered pit. In a microscopic mechanics study for eastern white pine (
Pinus strobus) and tamarack (
Larix laricina) [
20], torus deflection from the margo stretching necessitated a much smaller force for pit closure than initially anticipated. The results directly confirmed the extreme compliance of the margo and torus deflection when subjected to an external force. As the transpiration pull propelling water movement in the xylem exhibited variability in response to environmental conditions [
21], the nonlinear relationship between the pressure gradient and sap flow rate in the xylem is crucial in understanding the regulation of transpiration and photosynthesis [
22]. Due to the impracticality of monoscopically measuring the flow rate and hydro force in a bordered pit, it is crucial to devise innovative techniques for investigating the fluid–solid interaction and the nonlinear pressure–flux relationship in bordered pits.
Besides experiments, modeling techniques for simulating water flow within bordered pits have emerged as a viable alternative. Lancashire and Ennos [
23] utilized a scale approach to predict the hydraulic resistance. The lattice Boltzmann method (LBM) was introduced by Valli et al. [
24] to simulate the water flow in bordered pits, where the margo is treated as an isotropic porous material. The main challenge in modeling the water flow within bordered pits is the margo’s intricate and irregular structure. The oversimplification cannot be rectified without experiment data. Schulte [
25] employed computational fluid dynamics (CFD) technology to accurately simulate the complex morphology of the pores in the margo with the finite volume method (FVM). The findings indicated that the flow through each pore in the margo was significantly influenced by the size of the pore area, as well as its radial position relative to the torus edge. Schulte et al. [
26] further conducted a comparative analysis of the hydraulic characteristics of bordered pits from the stems and roots of black spruce (
Picea mariana) and white spruce (
Picea glauca). The results suggested that the flow resistance in the root pits was comparatively lower than that in the stem pits. Kvist et al. [
27] computed an effective diffusion coefficient in bordered pits with LBM and the 3D reconstruction of an actual bordered pit. Qu et al. [
28] applied LBM with curved boundary treatment to improve the model’s accuracy. In comparison with FVM, the LBM was inferior in capturing the flow accuracy with complex geometry. In the above studies, the computational fluid dynamics approach offered a well-accepted way to predict the flow resistance of bordered pits. However, CFD models of bordered pits, in which the torus is fixed in the pit center, did not take into account the effects of fluid–solid interaction. In addition to incorporating the CFD model, the modeling of the fluid–solid interaction should take into account the deformation of the torus–margo structure caused by the flow pressure.
To investigate the deflection of the torus when subjected to an external force, the utilization of mechanical analysis has developed as a prominent methodology. Sperry and Hacke [
29] proposed a linear stress–strain model to assess the deformation of the pit membrane in angiosperm vessels. Tixier et al. [
30] provided a mechanical model that incorporated the geometric properties of the pits, based on the Kirchhoff–Love thin-plate theory. When comparing the pit membrane in angiosperms to the torus–margo structure of pits in conifers, it was evident that the latter displayed a greater degree of intricacy. Hacke et al. [
31] created a linear elastic model to predict torus deflection using an oversimplified margo comprised of a regular distribution of spokes. To accurately model the torus–margo structure, Schulte et al. [
32] utilized the finite element method (FEM) to construct an element discrete model which directly incorporated the intricate margo structure. The deflection of the torus was simulated with external forces and the stretching of the margo. Peng et al. [
33] elucidated the development of the contact seal in aspirated bordered pits by incorporating the sealing contact between the torus and the pit border in the FEM model. The aspiration in bordered pits was influenced by the structural and material properties of the torus and margo. Although the FEM method with standard software provided a standard tool of modeling the structural deformation in bordered pits, the flow pressure, which was assumed to be uniformly distributed and independent of the torus deflection, was oversimplified [
32,
33]. In a bordered pit, the water flow applied pressure forces on the torus–margo structure, resulting in torus deflection, while the structure, in turn, influenced the path of water flow. To investigate passive water regulation in bordered pits, it was necessary to develop a fluid–solid interaction model including a flow model of the water flow and a solid model of the torus–margo structure.
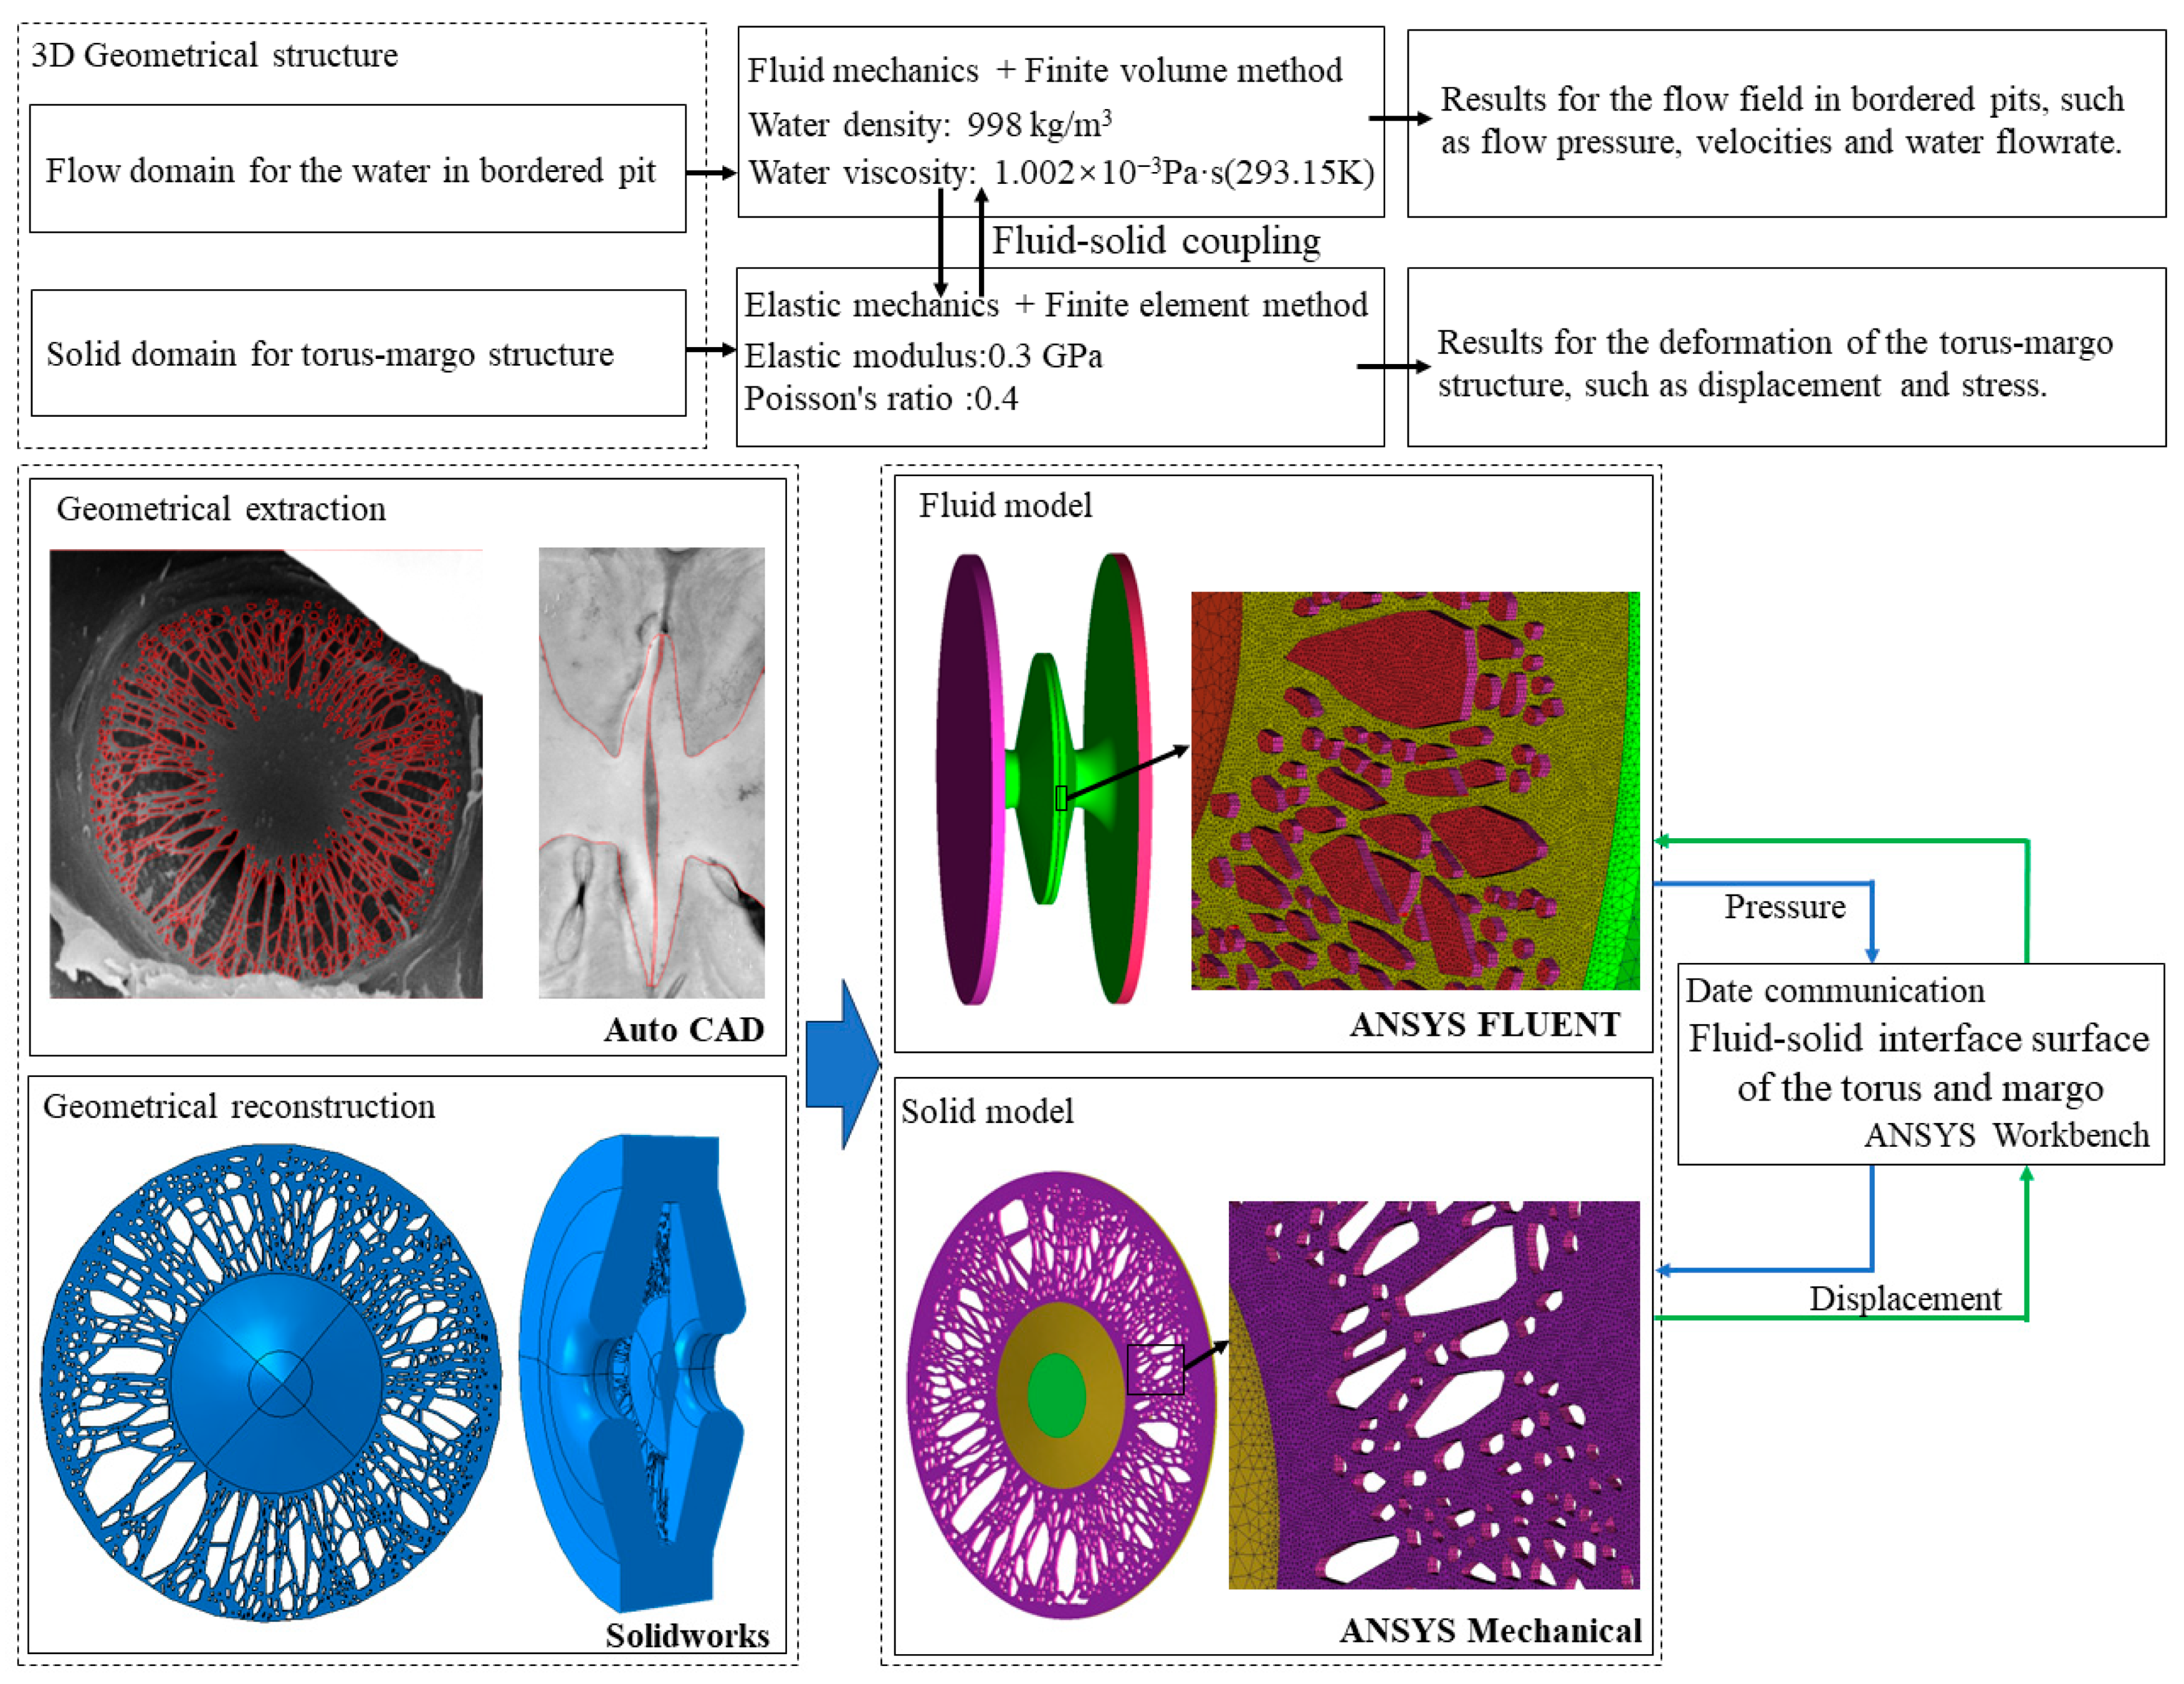
To investigate the mechanism of fluid–solid interaction in the bordered pit and the impact of the pit structure on the nonlinear pressure–flux relationship, a preliminary fluid–solid interaction model was developed by coupling the CFD model of the water flow and the FEM model of the torus–margo structure. The water pressure in the pit chamber, the pressure force on the torus–margo structure, the deflection of the torus, and the pit resistance were calculated with 3D-reconstructed models of bordered pits. The anatomical structure of the bordered pits modeled in the present study was from the stem of oriental arborvitae (
Platycladus orientalis). Among the conifers with characteristic bordered pits, oriental arborvitae is widespread across the forests of China and naturalized in Korea, Japan, India, Florida, and Iran as well. In cities, oriental arborvitae is used as an ornamental tree around the world. More importantly, resistant-to-drought oriental arborvitae has relatively higher
P50 values among 115 conifer species [
34].
3. Results
In our previous study [
33], the data of bordered pits from oriental arborvitae showed a positive correlation between the torus diameter and the pit diameter (
p = 0.2811 × 10
−5 < 0.001) and a negative relationship between the pit diameter and the pit depth (
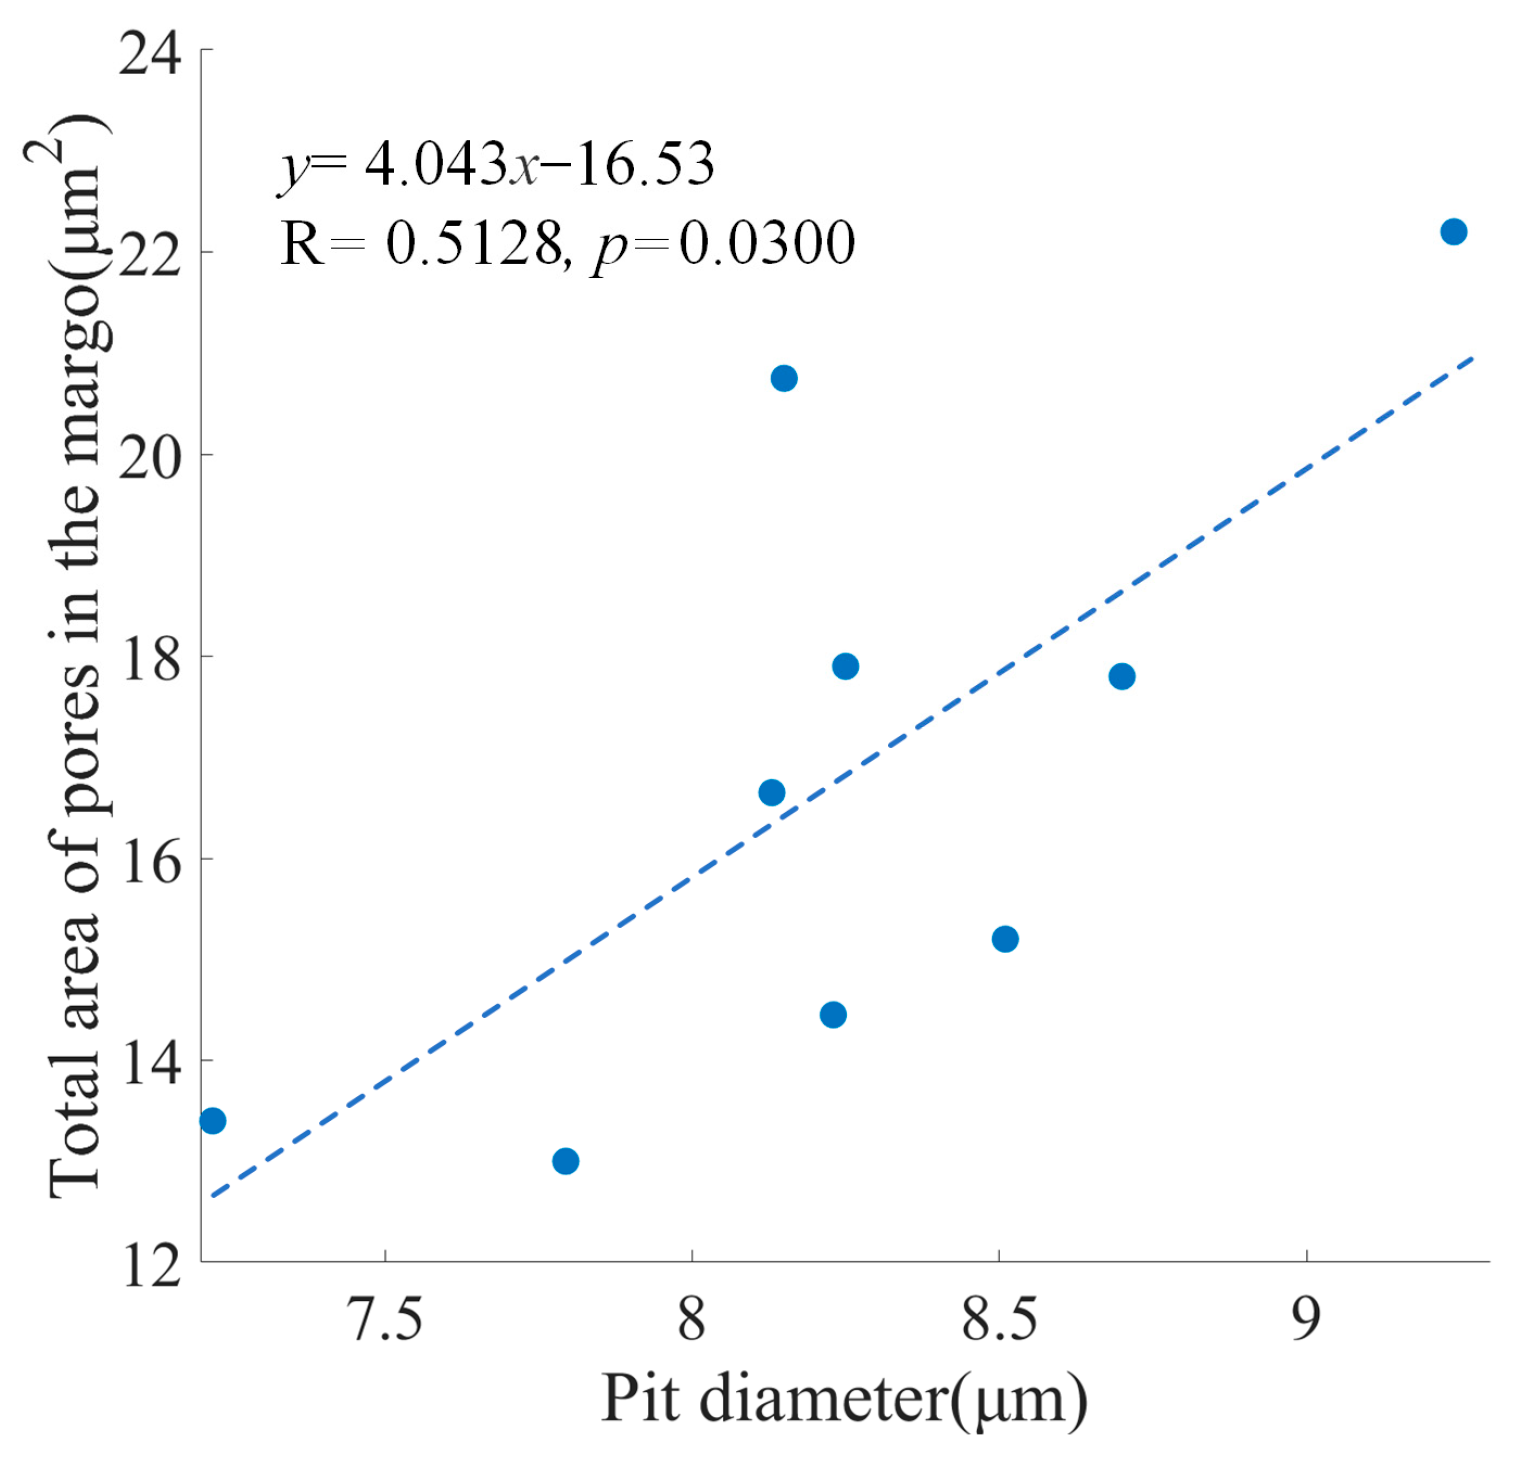
p = 0.1171). Measured in the study, the total area of pores in the margo varied between 13.013 μm
2 and 22.217 μm
2 with an average area of 16.824 μm
2 and a standard deviation of 3.008 μm
2.
Figure 2 showed a positive relationship between the pit diameter and the total area of pores in the margo was significant (
p = 0.0300 < 0.05).
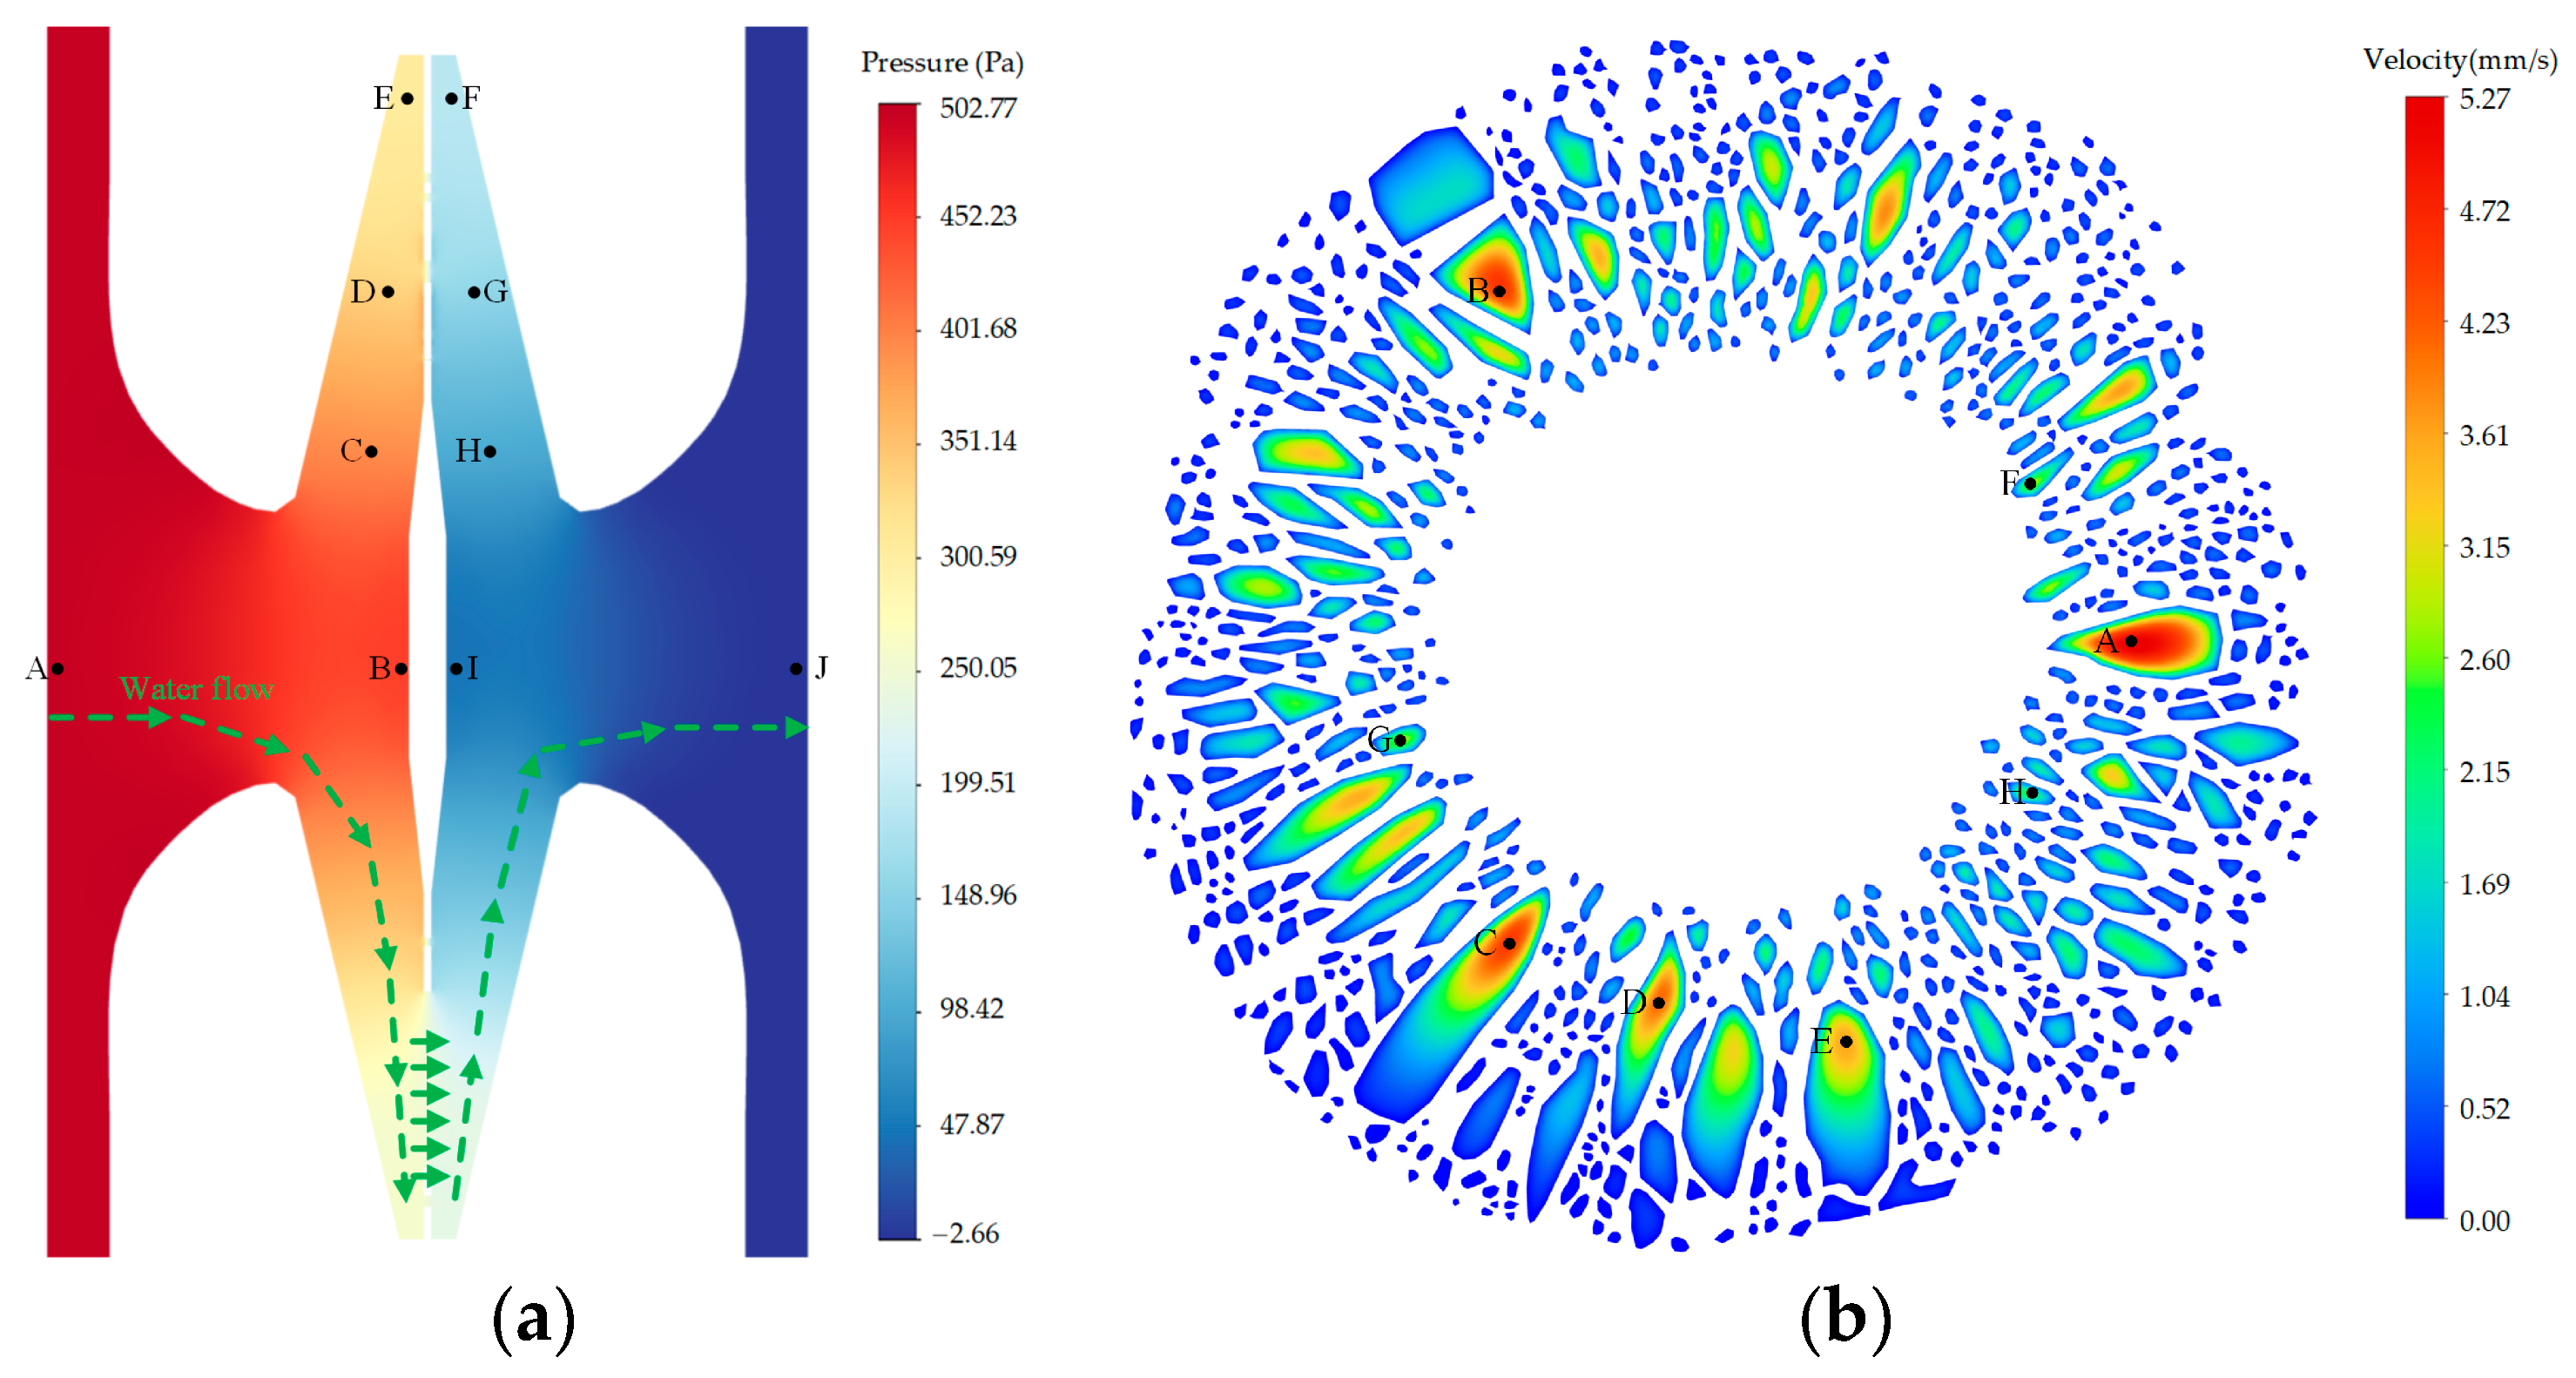
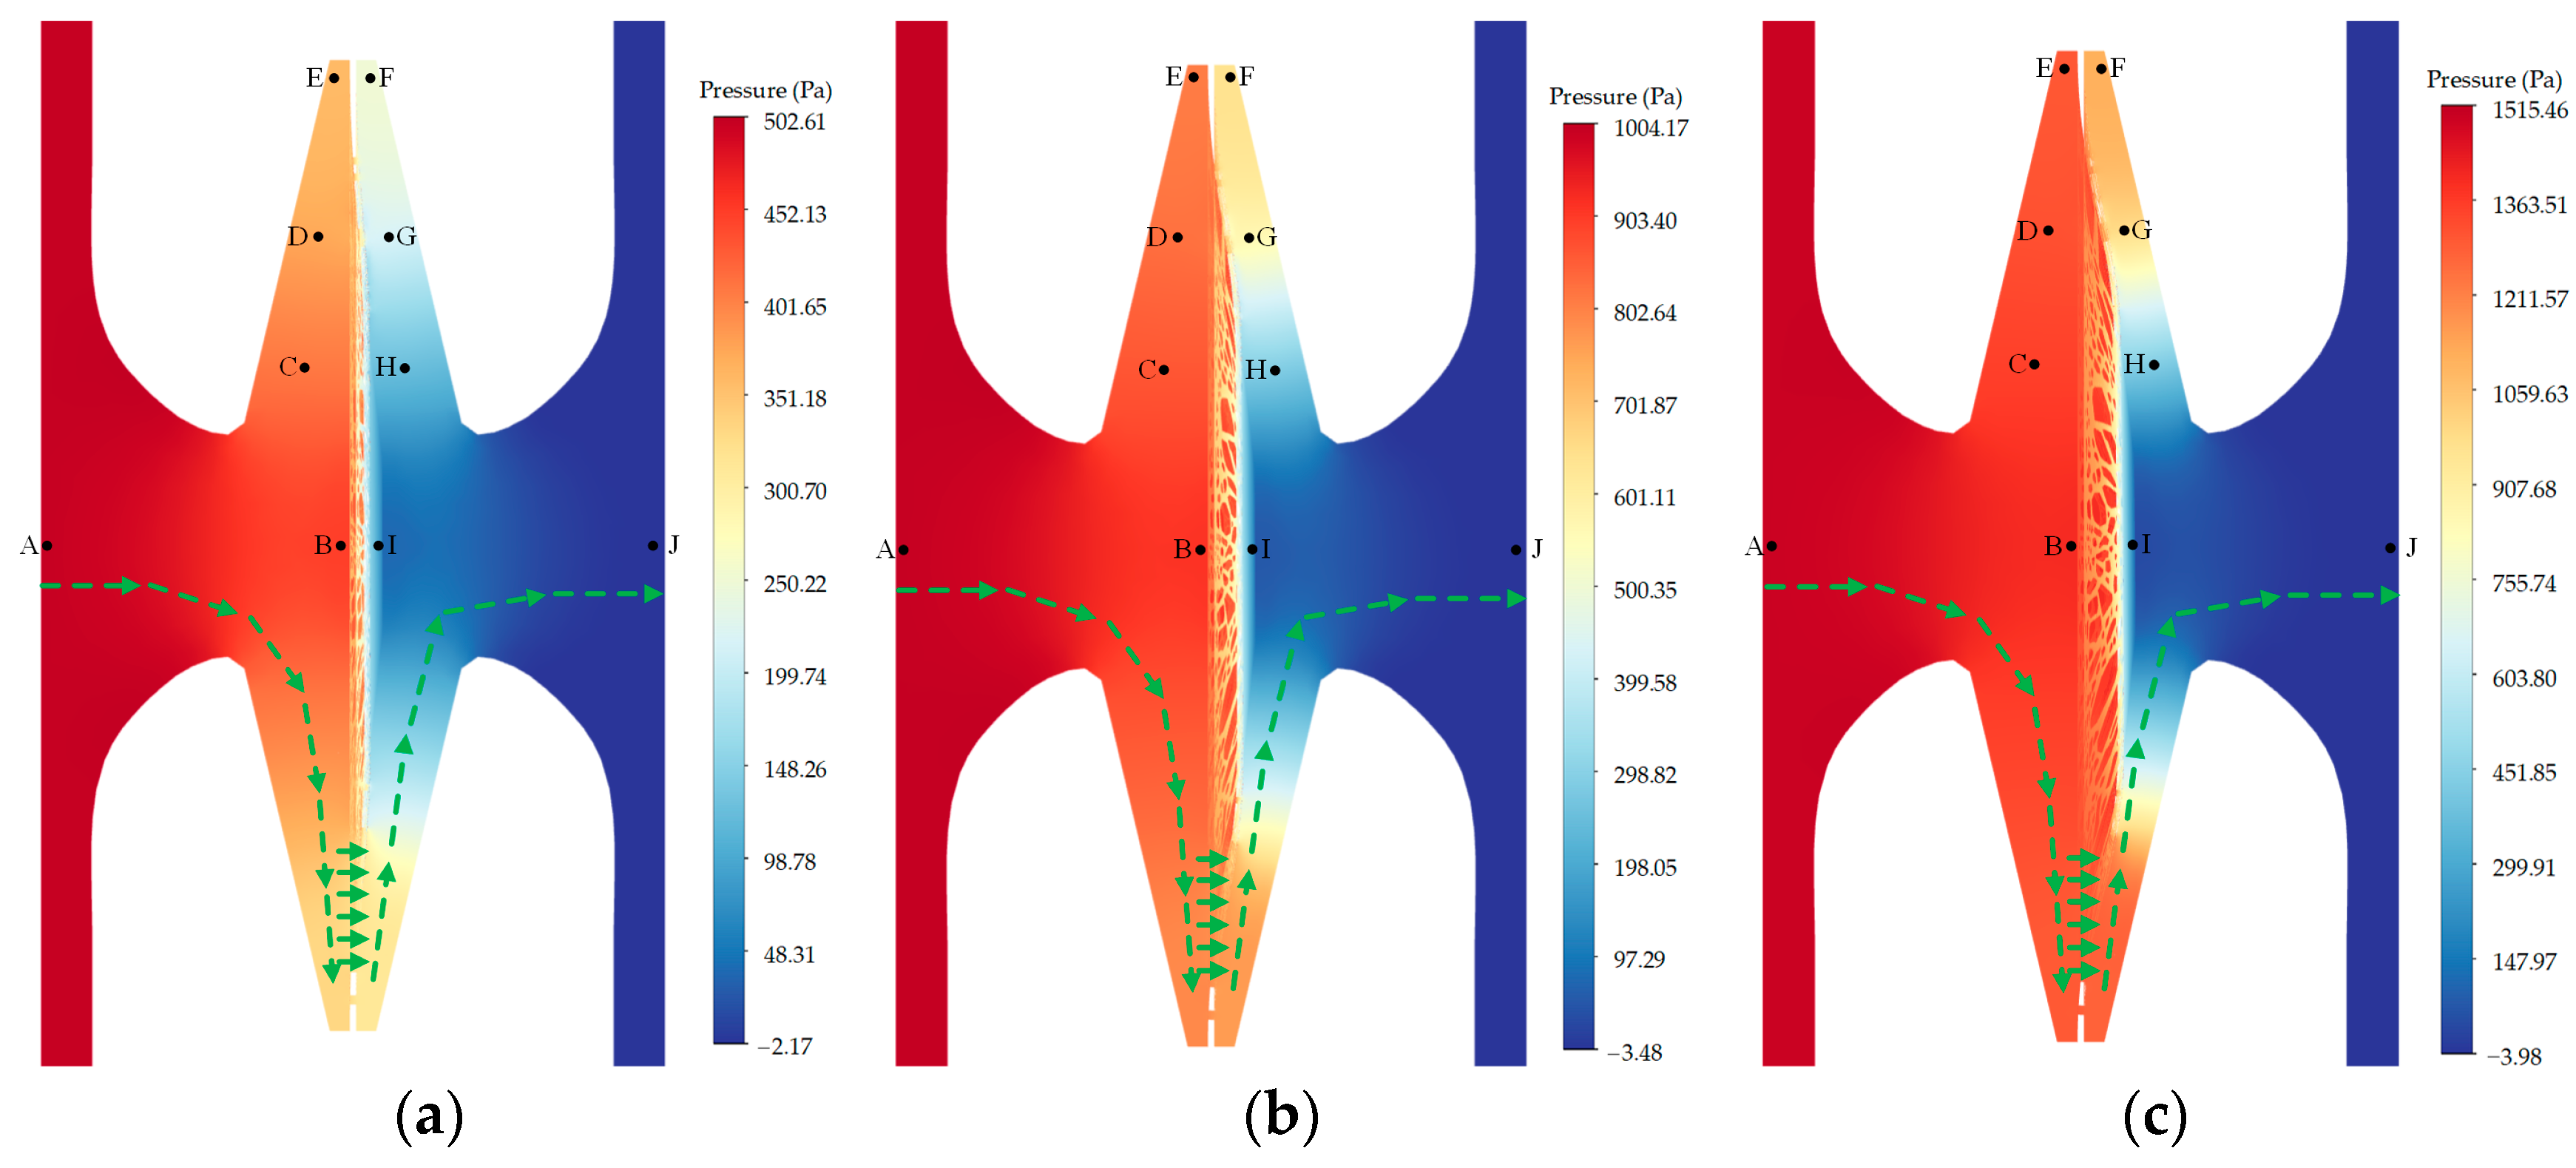
Figure 3a illustrates the occurrence of pressure loss along the flow path within the bordered pit when the torus was initially at the center position. Within the pit aperture and chamber, an average pressure loss of 9.564% was seen between probe A and C, as well as between probe H and J. Within the narrow gap between the torus–margo and pit border, the pressure loss between probe C and E, as well as between probe F and H, averaged 17.185%. Across the margo, the pressure loss between probe C and H was 57.620%, while the pressure loss between probe D and G was 29.294% and the pressure loss between probe E and F was 23.251%. In
Figure 3b, it can be observed that the dimension and position of the pores in the margo had a significant impact on the velocity within each individual pore. The velocity observed in the larger pore was found to be greater than the velocity observed in the smaller pore. Specifically, the velocity measured at probe A (5.15 mm/s) was higher than the velocity measured at probe D (4.12 mm/s). The velocity observed in the pore located adjacent the torus was found to be greater than the velocity in the pore neighboring the margin of the pit membrane. For instance, the velocity measured at probe C (4.48 mm/s) exceeded the velocity measured at probe I (0.68 mm/s).
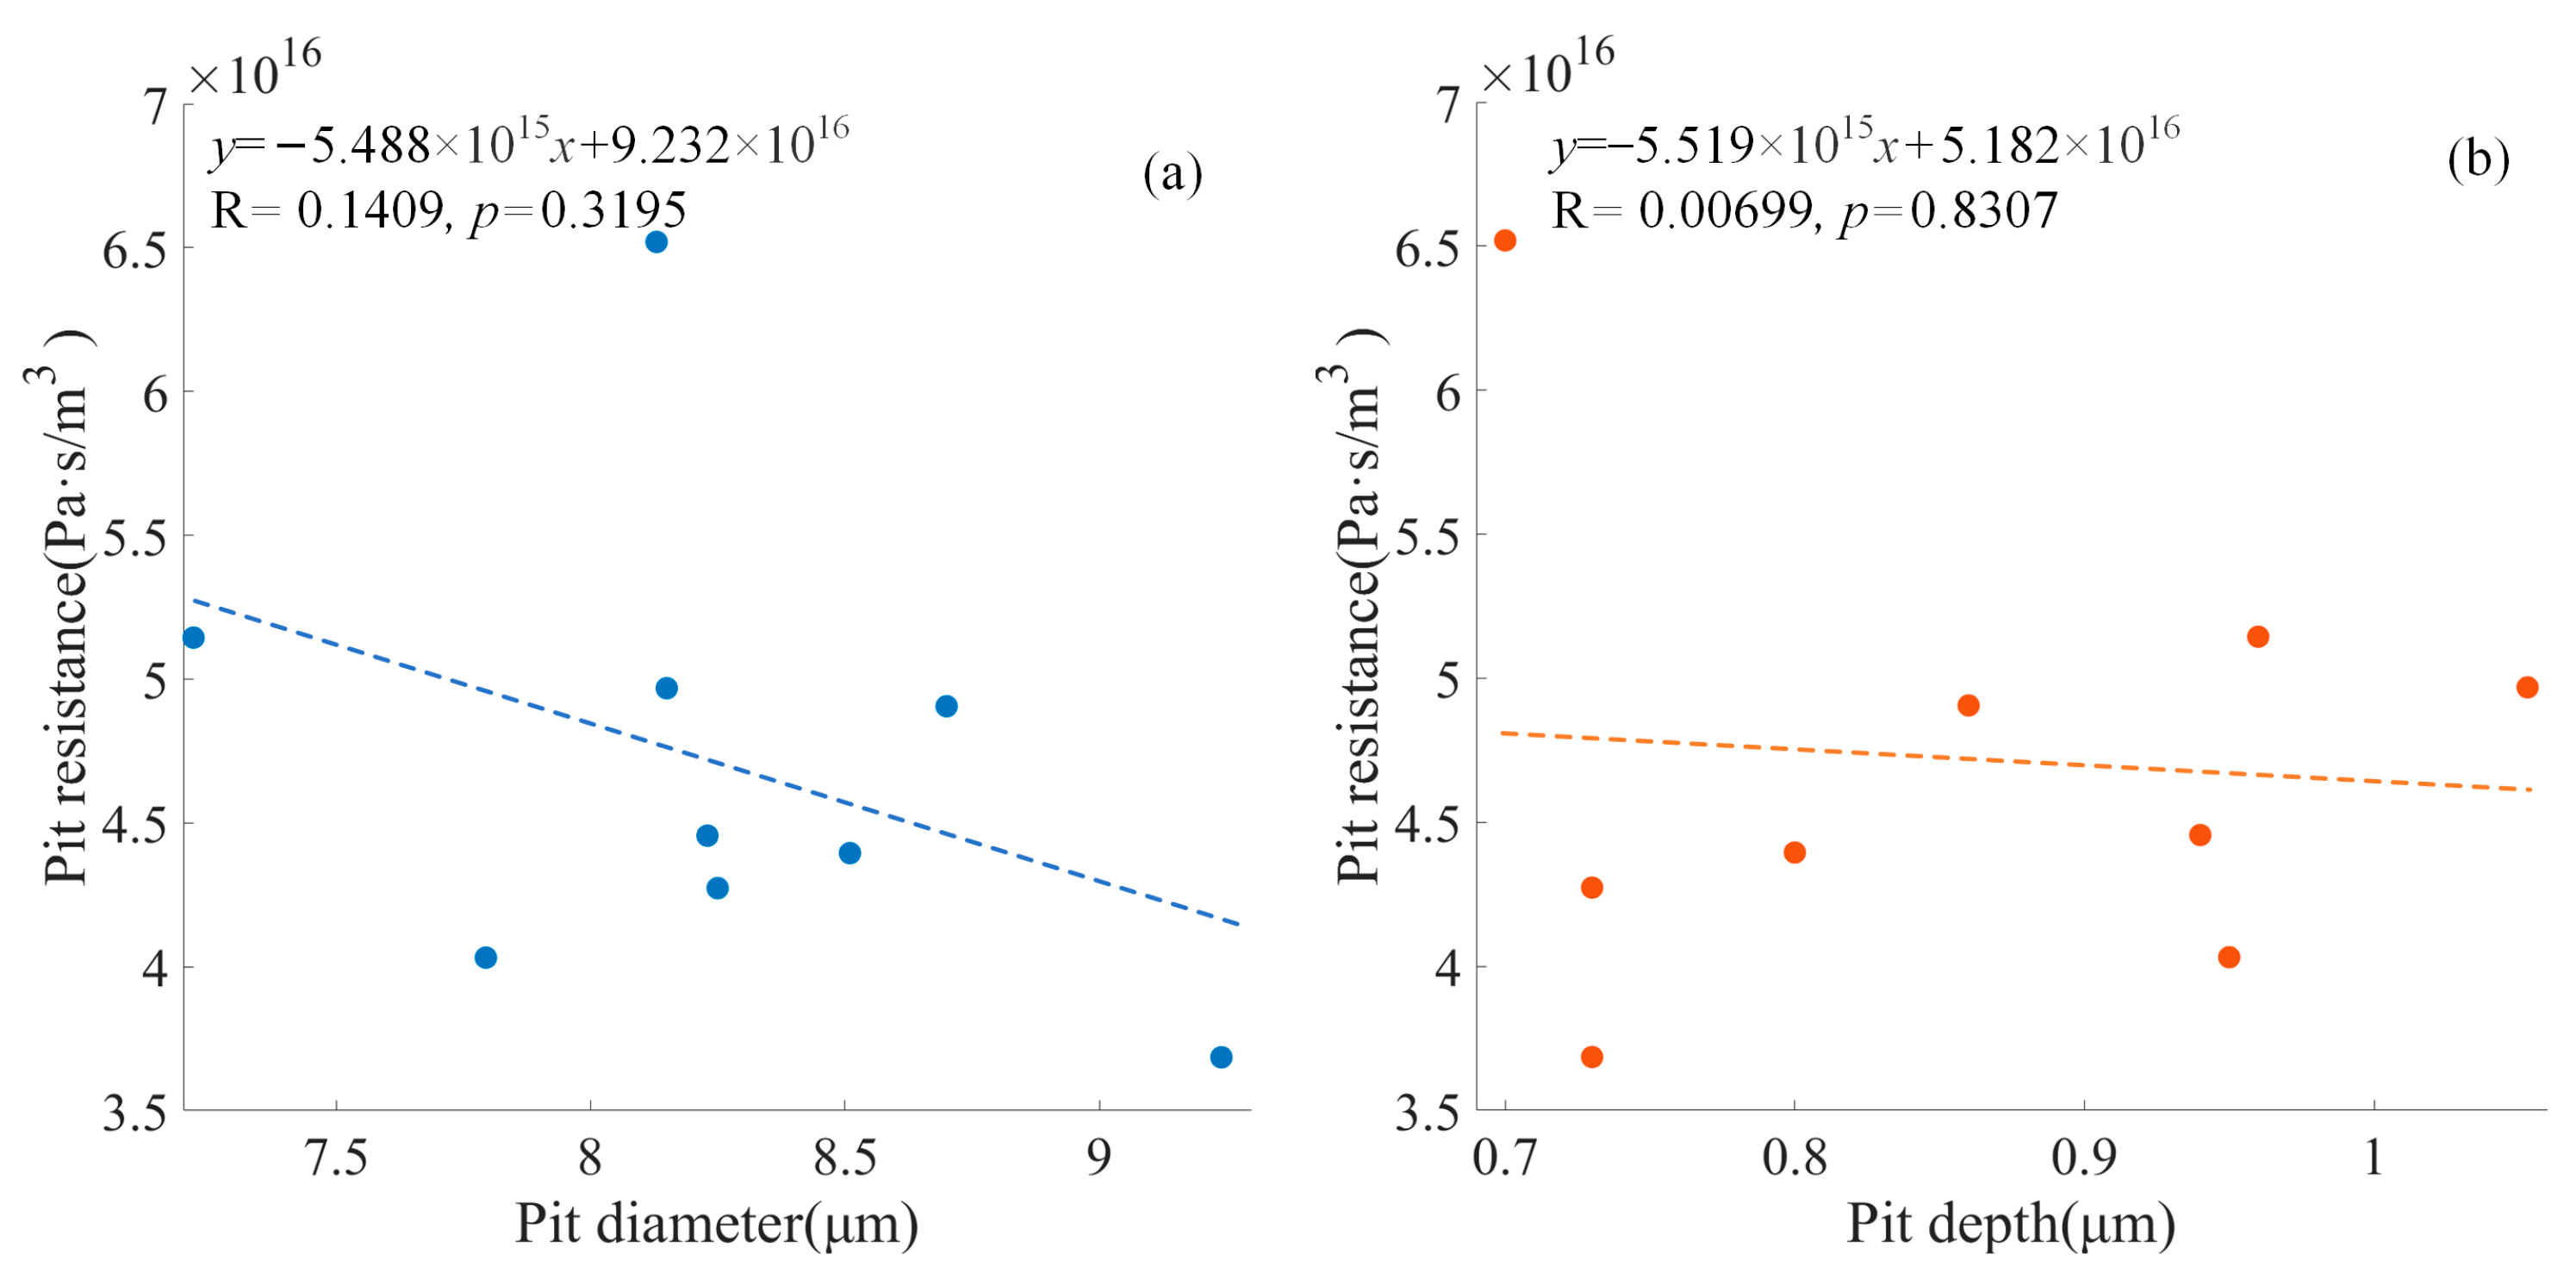
For the pit models with the torus placed at the center position, the pit resistance varied between 3.6851 × 10
16 and 6.5197 × 10
16 Pa·s/m
3, with an average resistance of 4.7086 × 10
16 Pa·s/m
3 and a standard deviation of 0.8242 × 10
16 Pa·s/m
3. As depicted in
Figure 4, a negative correlation can be observed between the pit diameter and the pit resistance (
p = 0.3195), and a negative correlation can be observed between the pit depth and the pit resistance (
p = 0.8307).
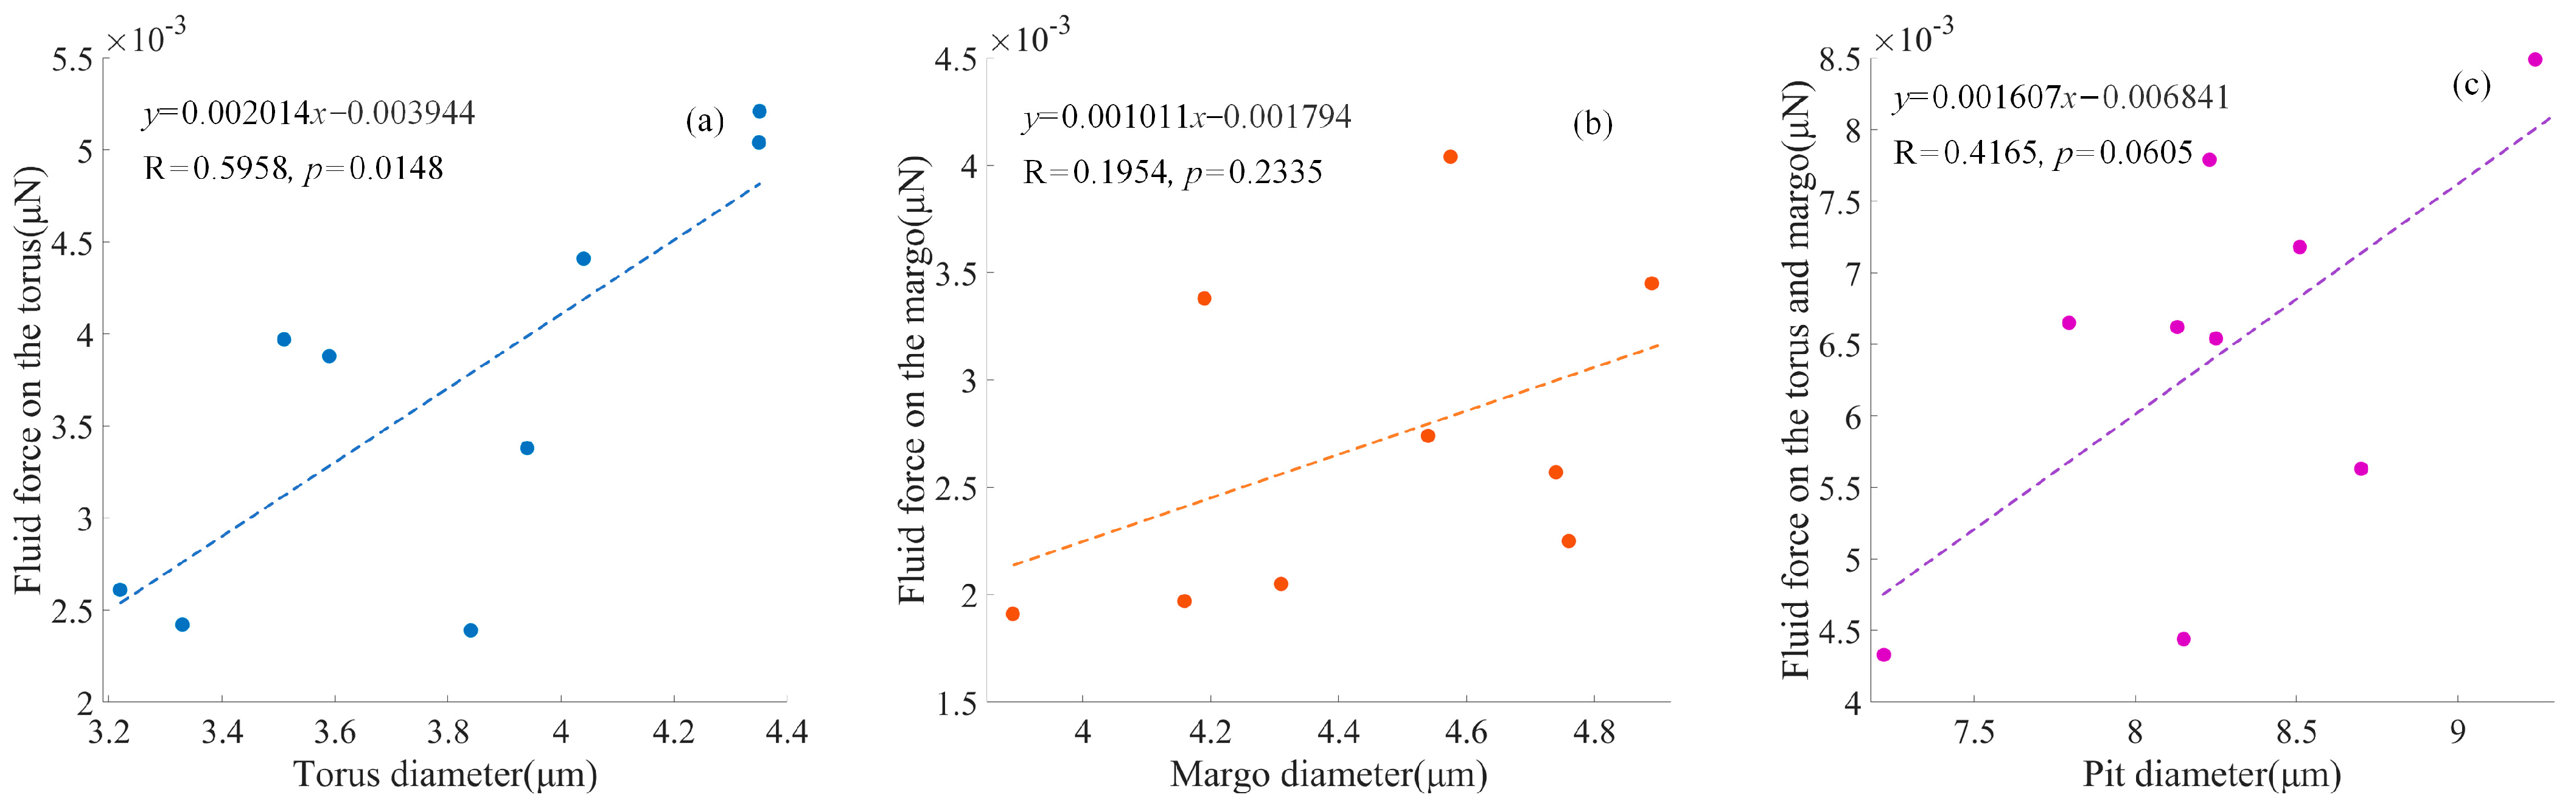
As depicted in
Figure 5, fluid force on the torus varied between 2.388 × 10
−3 μN and 5.207 × 10
−3 μN, with an average force of 3.699 × 10
−3 μN and a standard deviation of 1.018 × 10
−3 μN. The positive relationship between the fluid force on the torus and the torus diameter was significant (
p < 0.05). Fluid force on the margo varied between 1.906 × 10
−3 μN and 4.044 × 10
−3 μN, with an average area of 2.706 × 10
−3 μN and a standard deviation of 0.718 × 10
−3 μN. The positive relationship between the fluid force on the margo and the margo diameter was not significant (
p = 0.2335), as the pores were highly variable in the margo. The fluid force on the pit membrane varied between 4.324 × 10
−3 μN and 8.489 × 10
−3 μN, with an average force of 6.406 × 10
−3 μN and a standard deviation of 1.405 × 10
−3 μN. A positive relationship between the fluid force on the pit membrane and the pit diameter was observed (
p = 0.0605).
The fluid–solid interaction, as depicted in
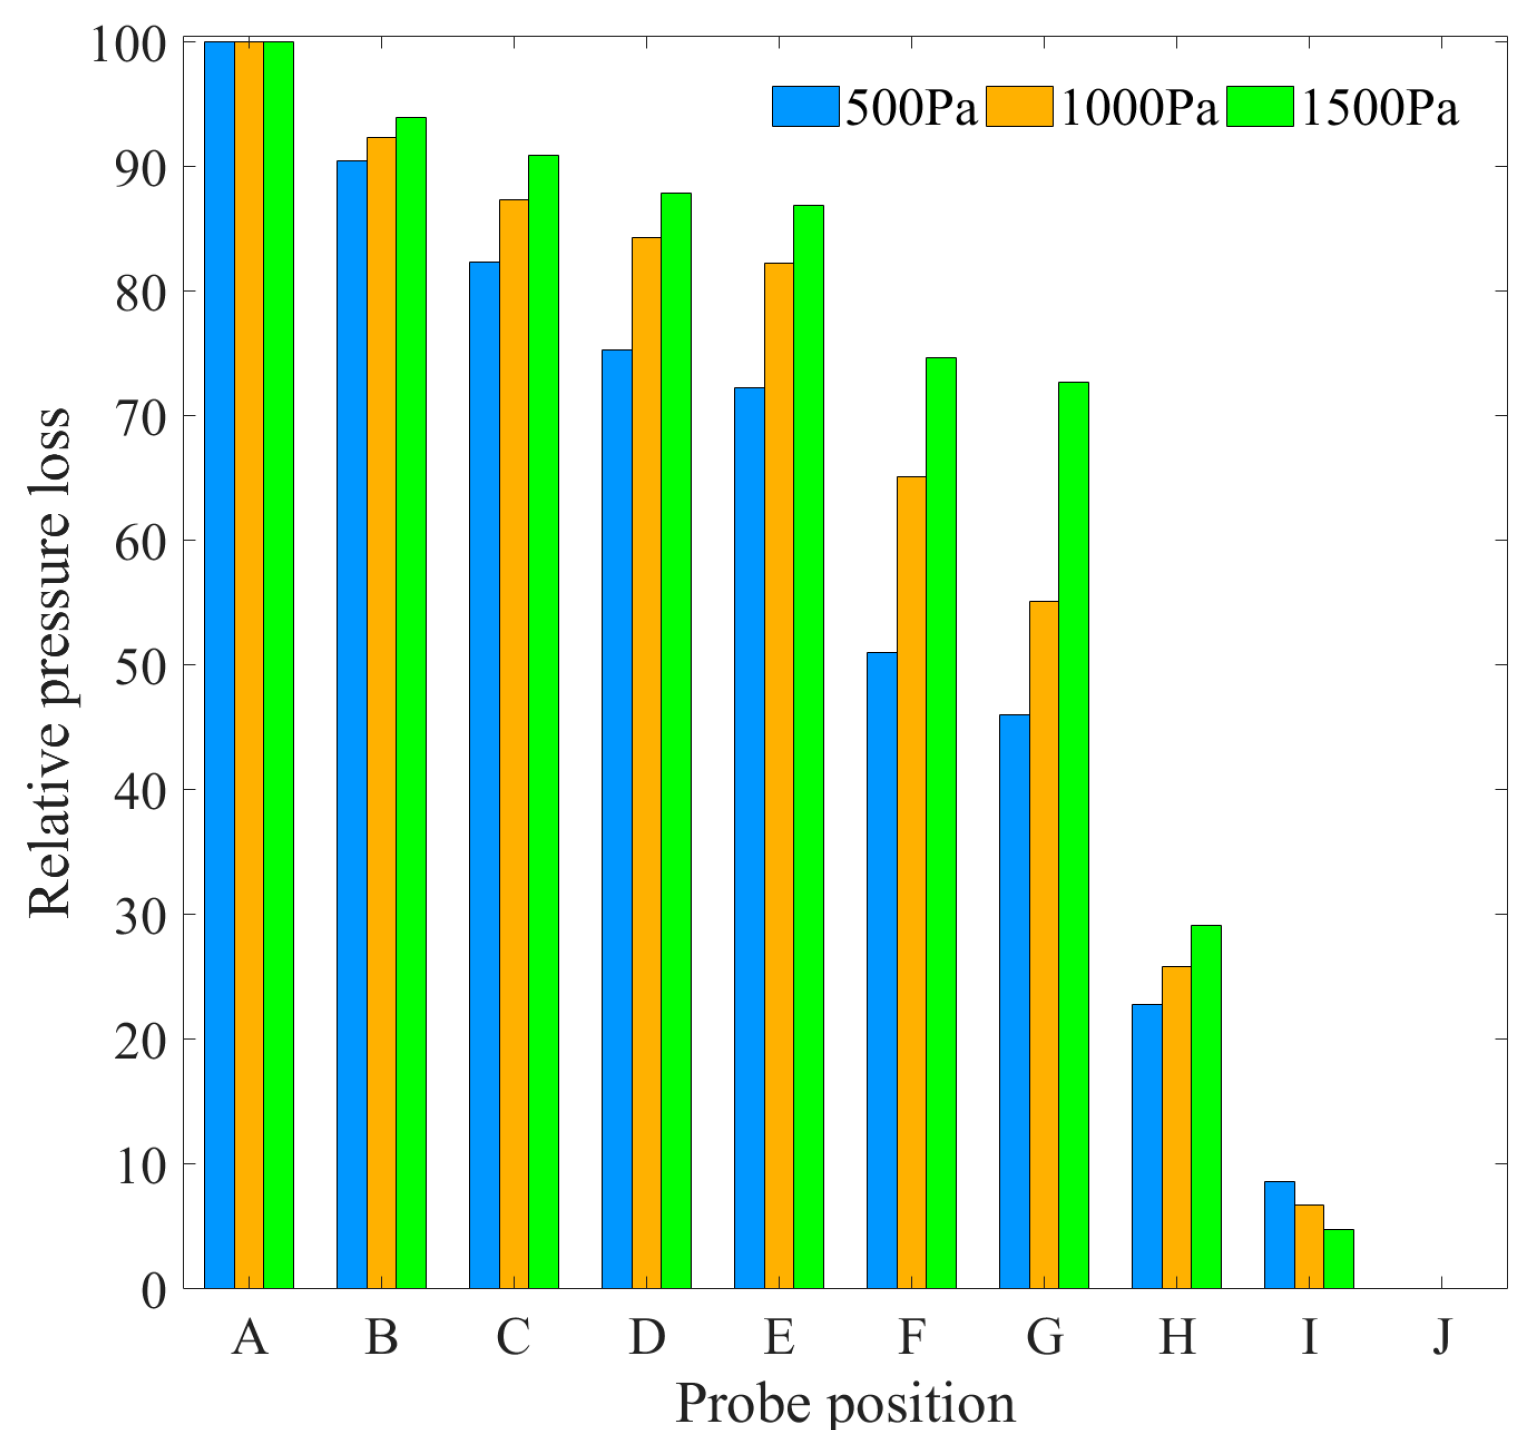
Figure 6, resulted in the expansion of the upstream pit chamber and the narrow gap due to the torus deflection. Conversely, the downstream pit chamber and the narrow gap were shrunk. The act of stretching the margo resulted in the expansion of the pores within the margo. The alteration of the flow resistance in the flow path caused by the deformation of the torus and margo resulted in a corresponding alteration of the pressure loss within the bordered pit. The torus deflection resulted in a decrease in pressure variation in the upstream chamber and the narrow up, while causing a considerable increase in pressure fluctuation in the downstream narrow gap. According to the data presented in
Figure 7, it can be observed that as the pressure difference grew from 500 to 1500 Pa, the relative pressure loss in the downstream gap between the probe G and H exhibited an increase from 23.220 to 43.547%. Conversely, the relative loss across the margo between the probes D and G demonstrated a drop from 29.278 to 15.194%. As shown in
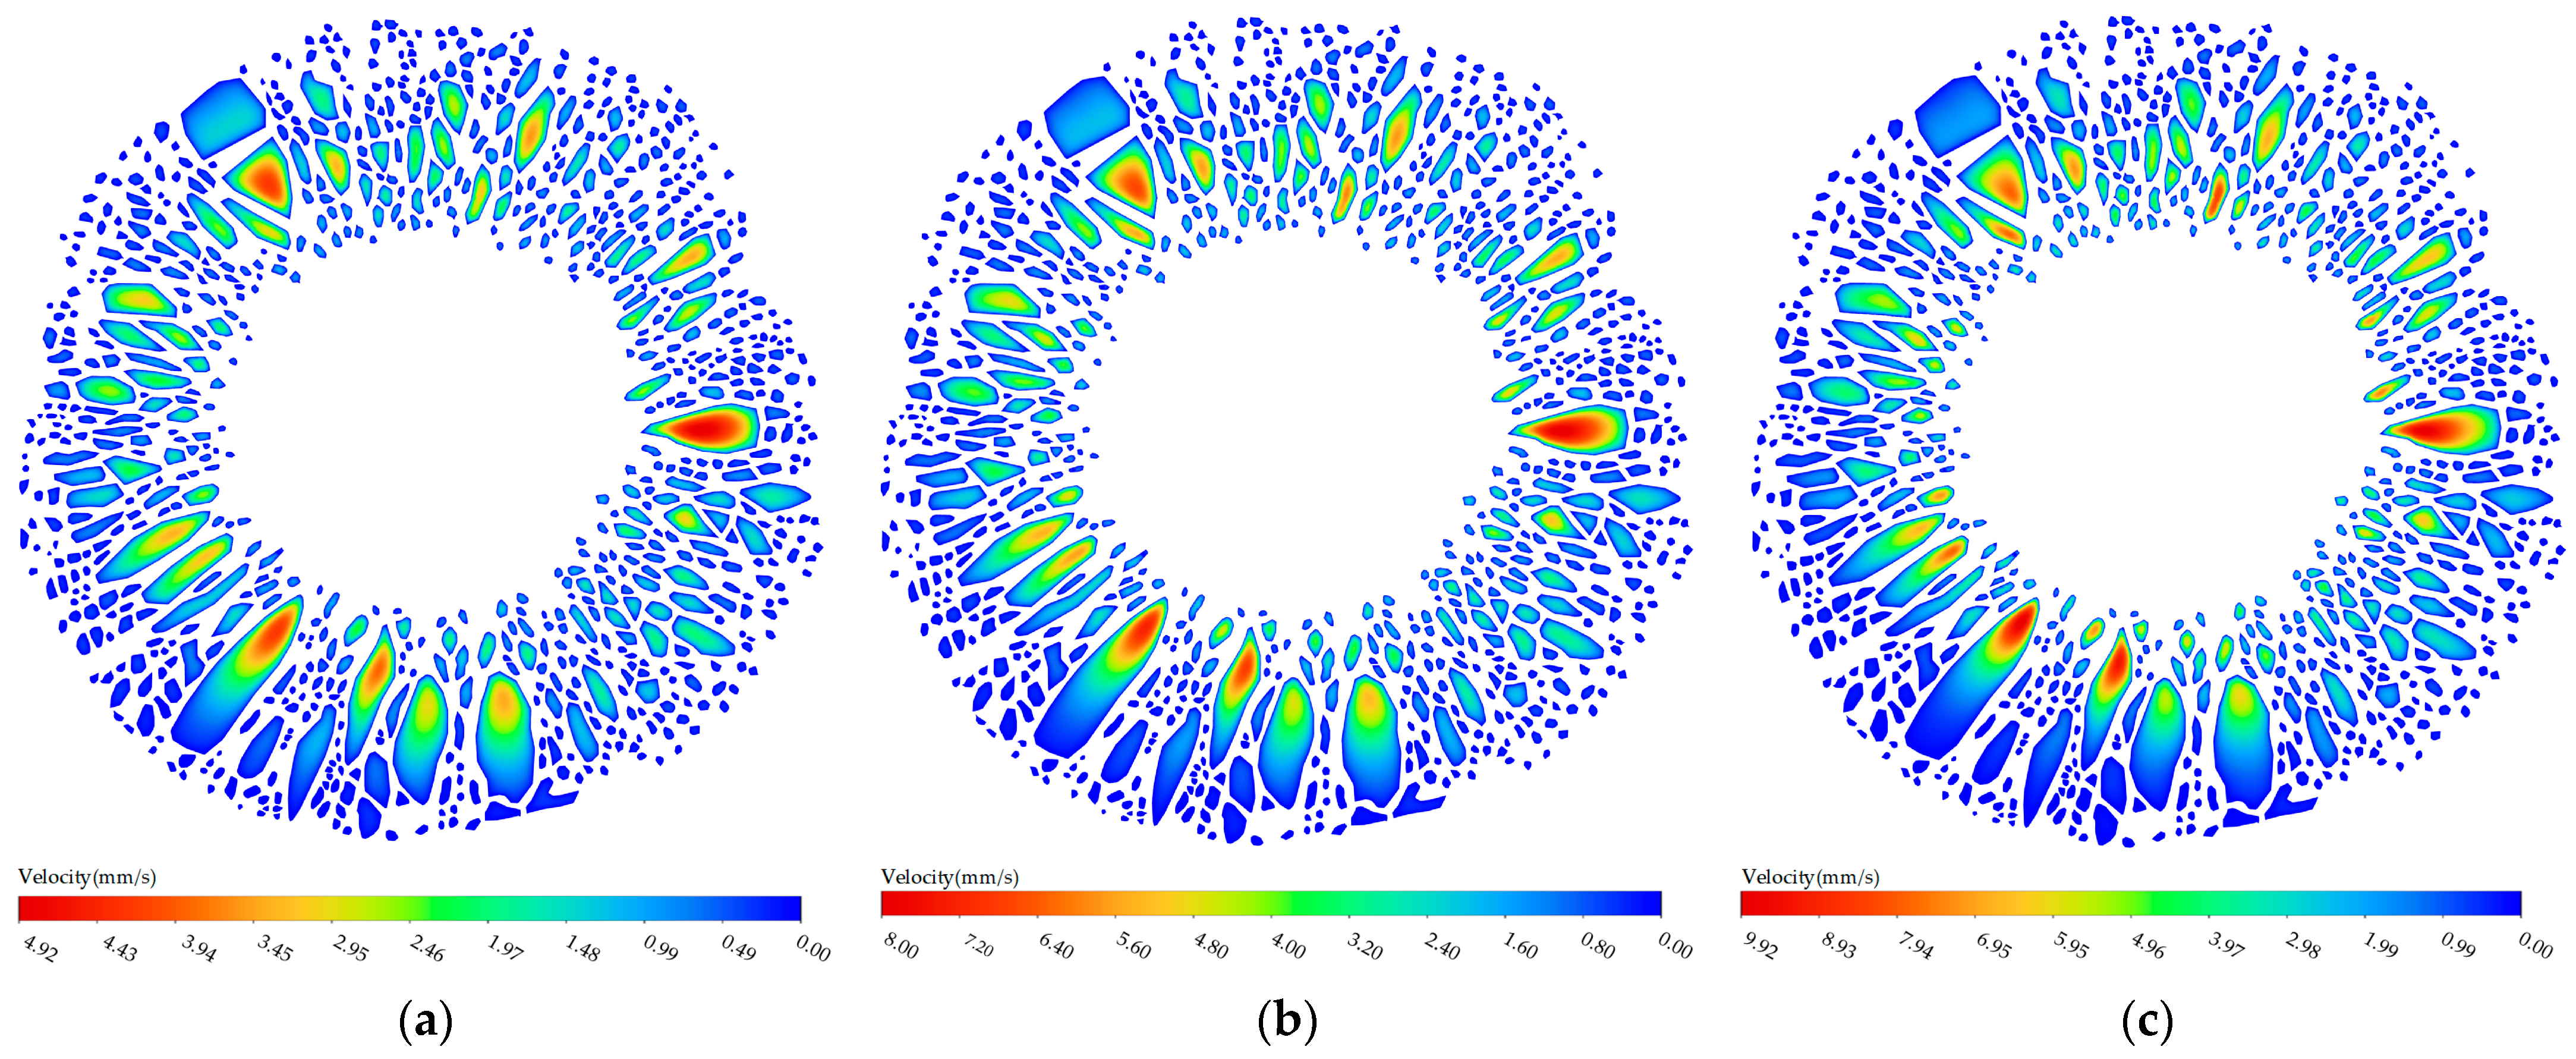
Figure 8, the fluctuation in flow resistance, particularly at the downstream gap, led to a significant increase in flow velocity within the pore adjacent to the torus, compared to the flow velocity in the pore neighboring the margin of the pit membrane.
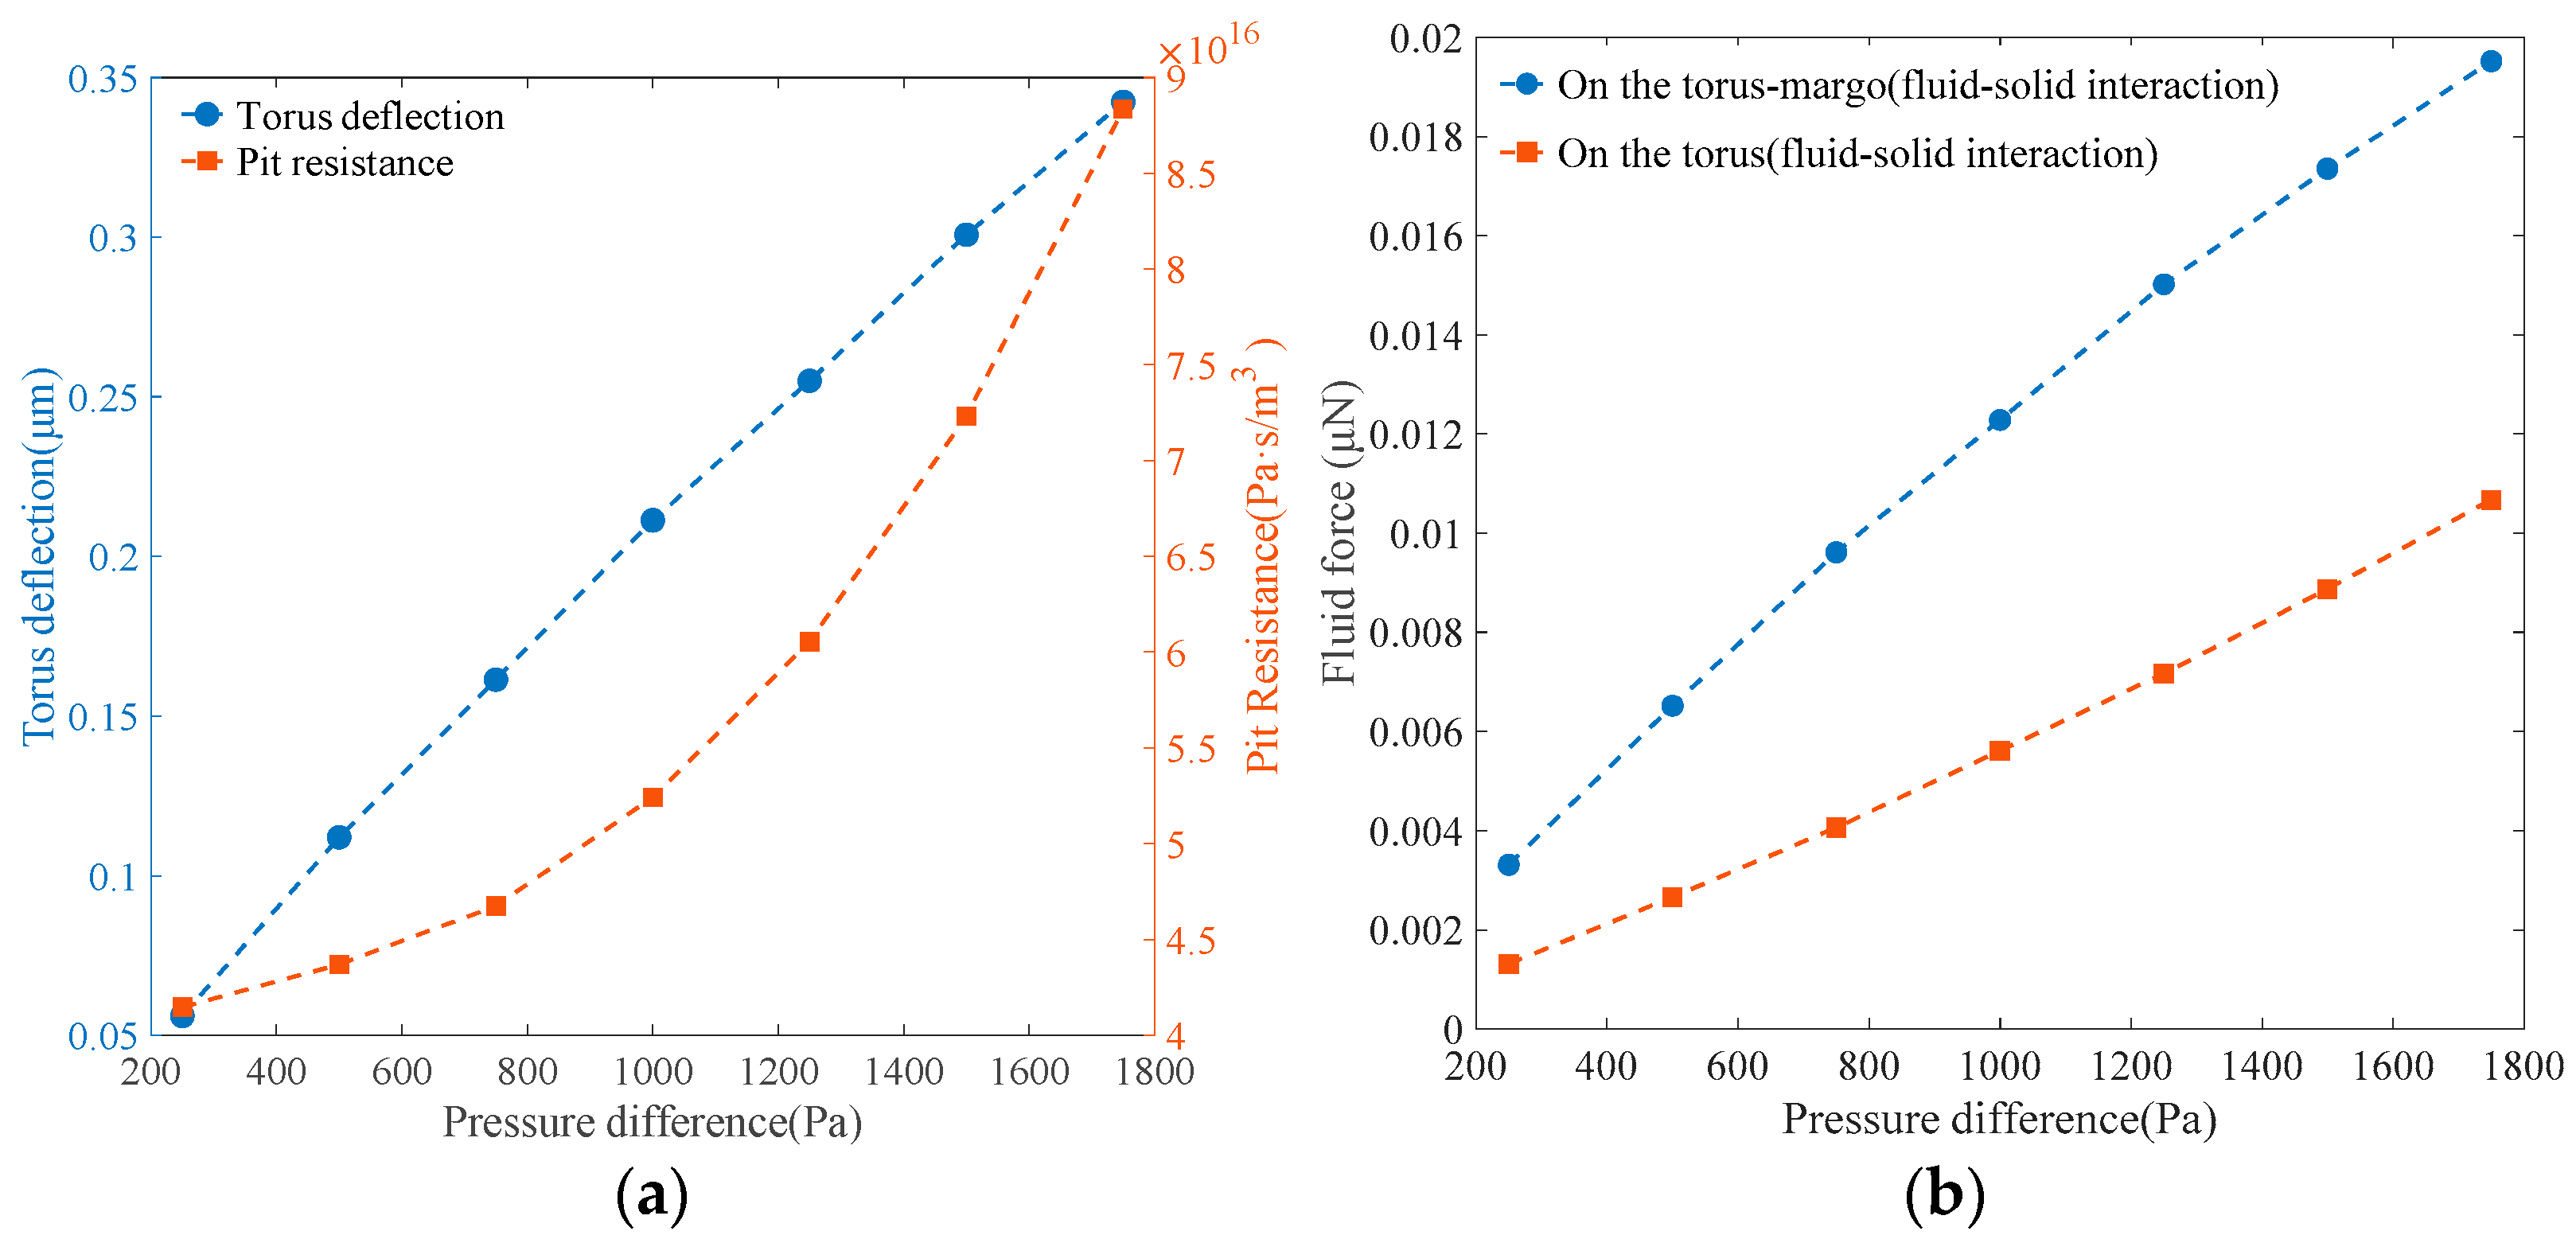
Figure 9a shows that when the pressure difference between the tracheids linearly increased from 250 to 1750 Pa, the deflection of the torus exhibited an almost linear increase from 0.0561 μm to 0.3423 μm. Simultaneously, a nonlinear augmentation from 4.1466 × 10
16 Pa·s/m
3 to 8.8344 × 10
16 Pa·s/m
3 in pit resistance was observed as the resistance gradient escalated with increasing torus deflection. As depicted in
Figure 9b, the fluid force on the torus–margo structure increased from 3.3099 × 10
−3 μN to 19.519 × 10
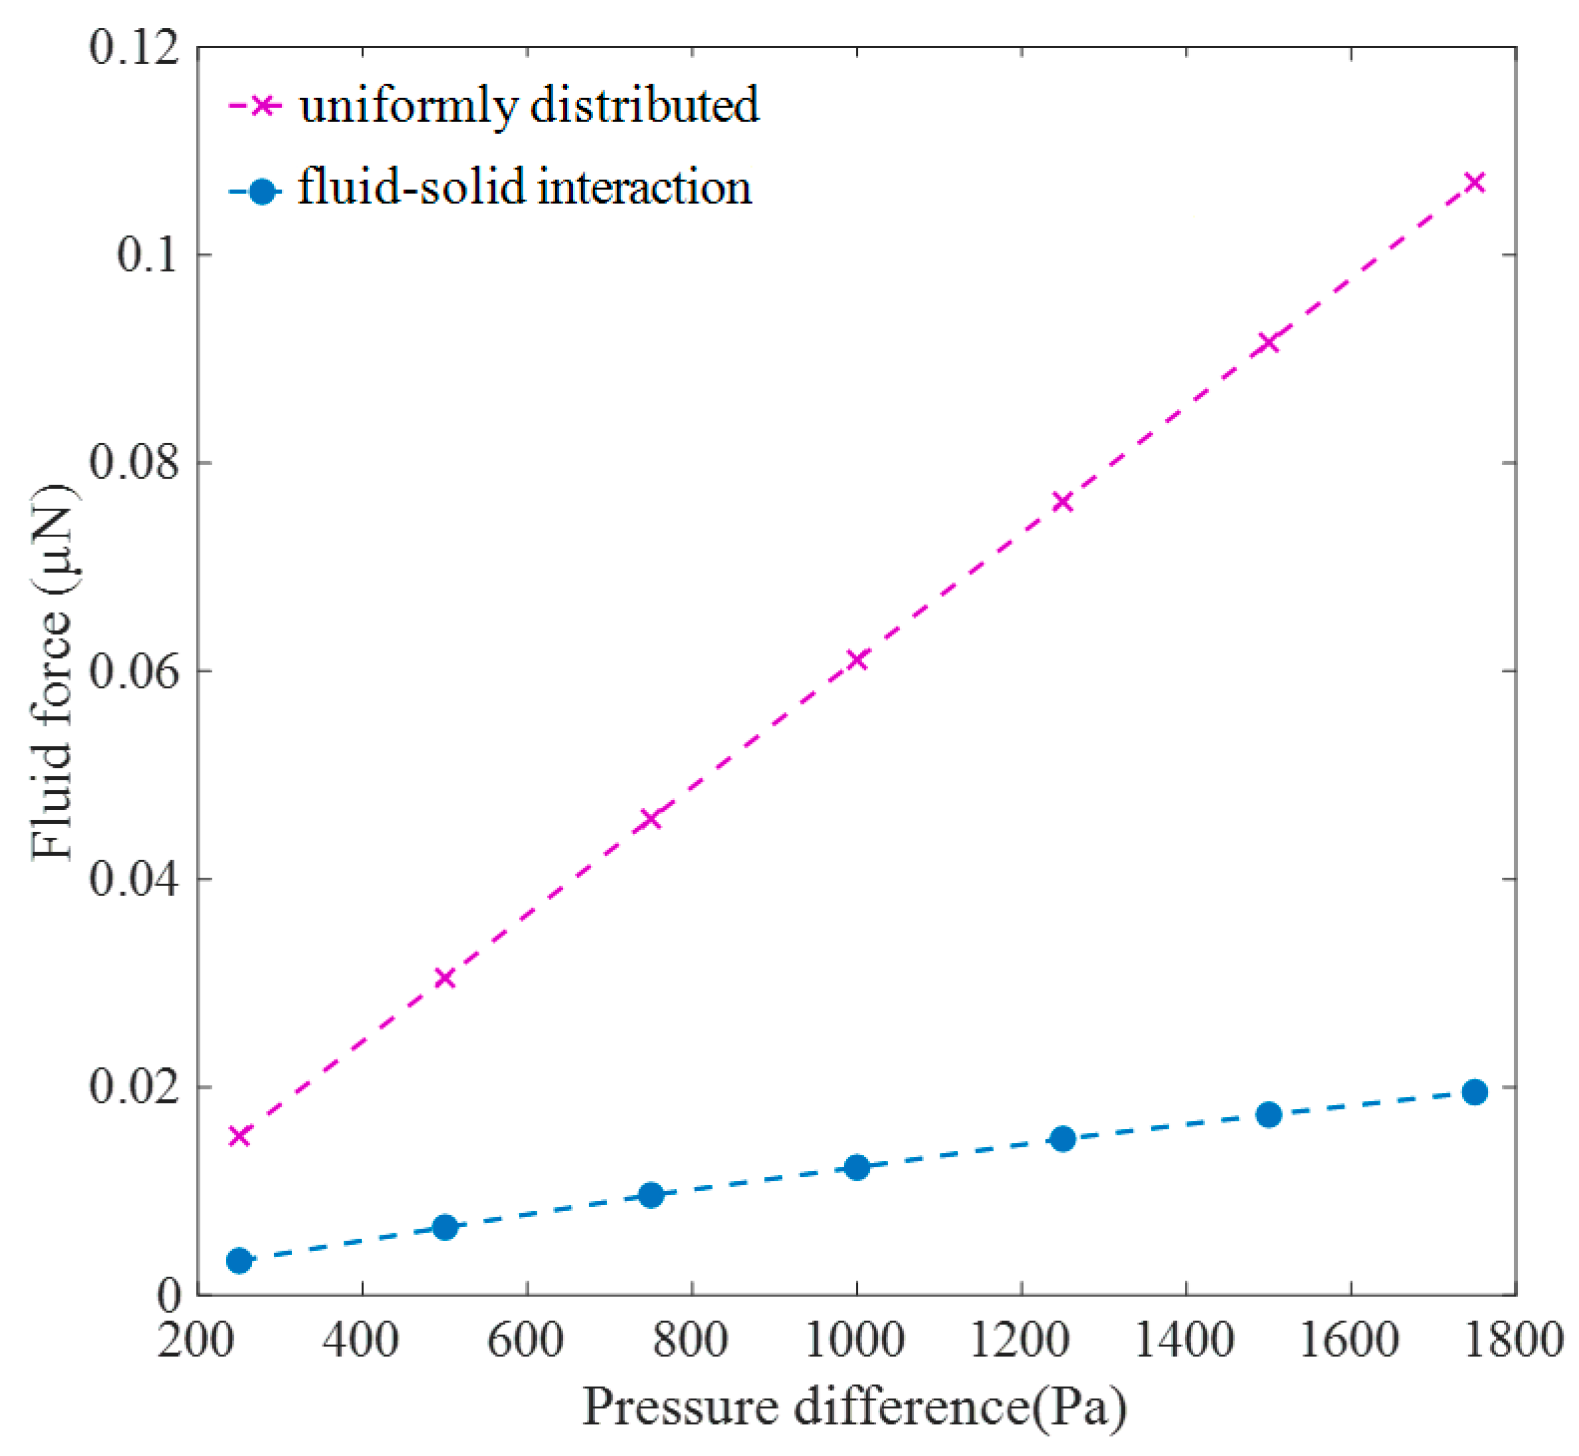
−3 μN, with the gradient slightly decreased at higher torus deflection. When comparing the fluid force exerted on the torus and margo, it was seen that the fluid force on the torus exhibited an increase as the gradients became larger at higher torus deflection. The percentage of the fluid force exerted on the torus relative to the combined fluid force on the torus and margo experienced a rise from 39.62% to 54.68%. Additionally, as depicted in
Figure 10, it was observed that the fluid force calculated in the fluid–solid interaction model was significantly lower than the simplified force, with the assumption that the pressure difference between the tracheids was uniformly distributed on the upstream surface of both the torus and margo, which was employed in a solid mechanical analysis to evaluate the deformation of the torus and margo [
32,
33].
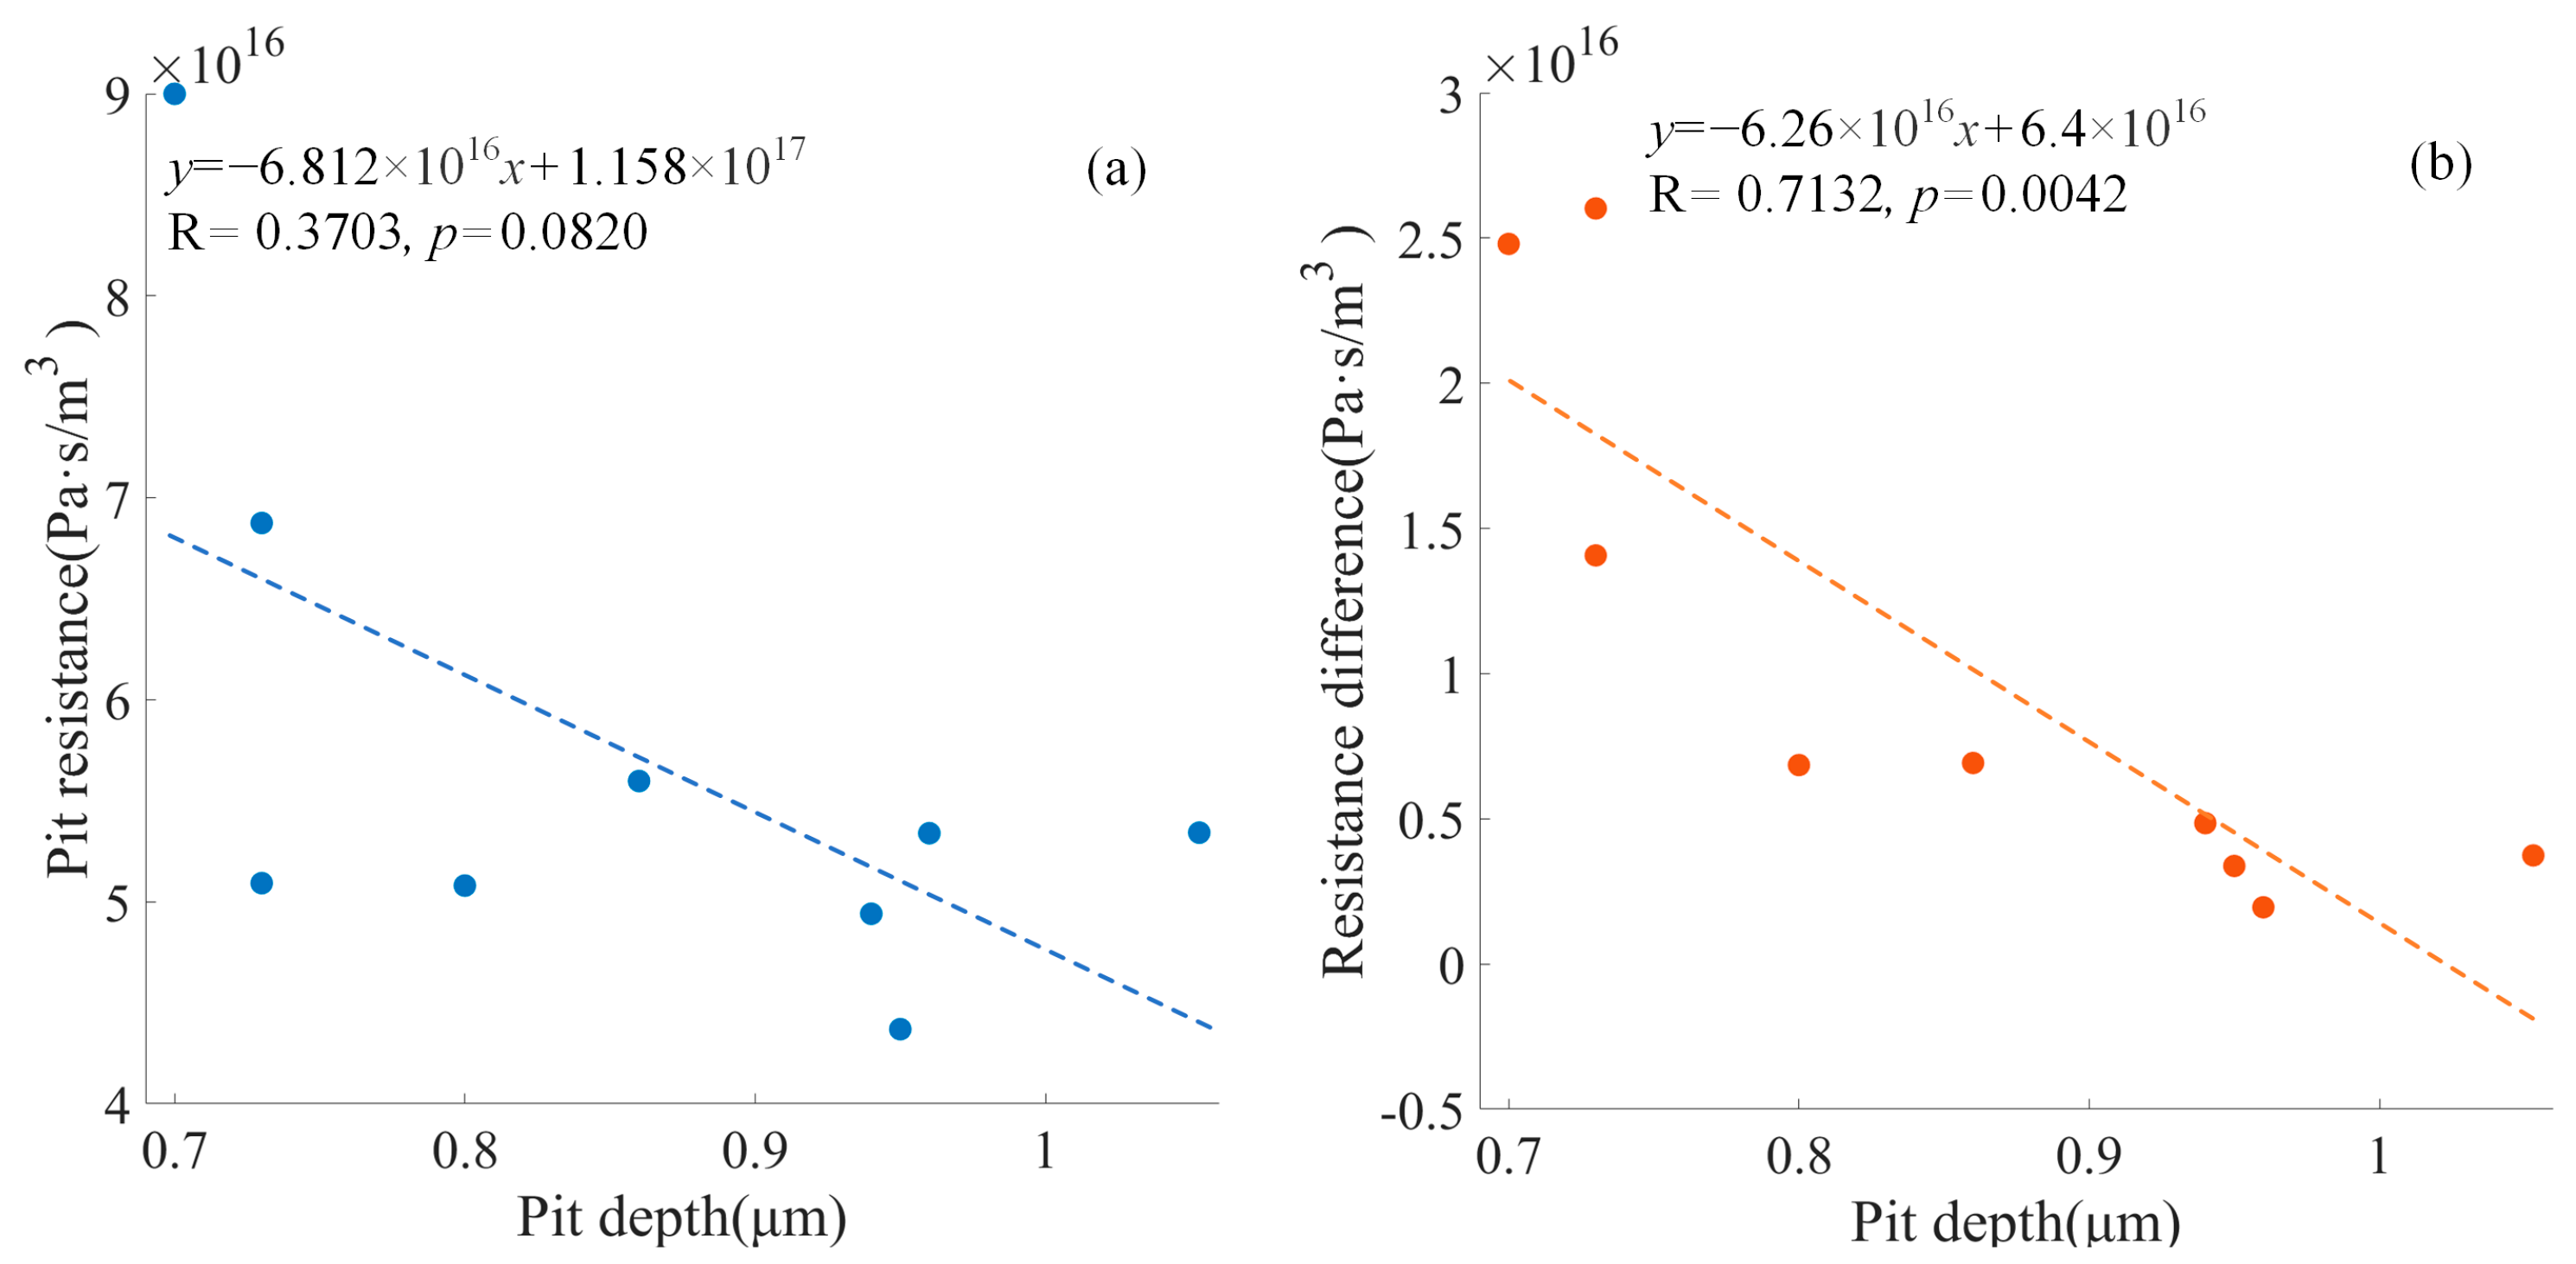
Table 2 shows the geometry data and simulation results for all the pits under the pressure difference of 500 Pa. The torus deflection varied between 0.0689 μm and 0.1704 μm, with an average deflection of 0.1209 μm and a standard deviation of 0.0335 μm. The pit resistance varied between 4.3691 × 10
16 Pa·s/m
3 and 8.9994 × 10
16 Pa·s/m
3, with an average resistance of 5.7373 × 10
16 Pa·s/m
3 and a standard deviation of 1.3976 × 10
16 Pa·s/m
3. The resistance difference between the torus at the center position and the torus with forced deflection varied between 0.1952 × 10
16 Pa·s/m
3 and 2.6020 × 10
16 Pa·s/m
3, with an average area of 1.0286 × 10
16 Pa·s/m
3 and a standard deviation of 0.9255 × 10
16 Pa·s/m
3.
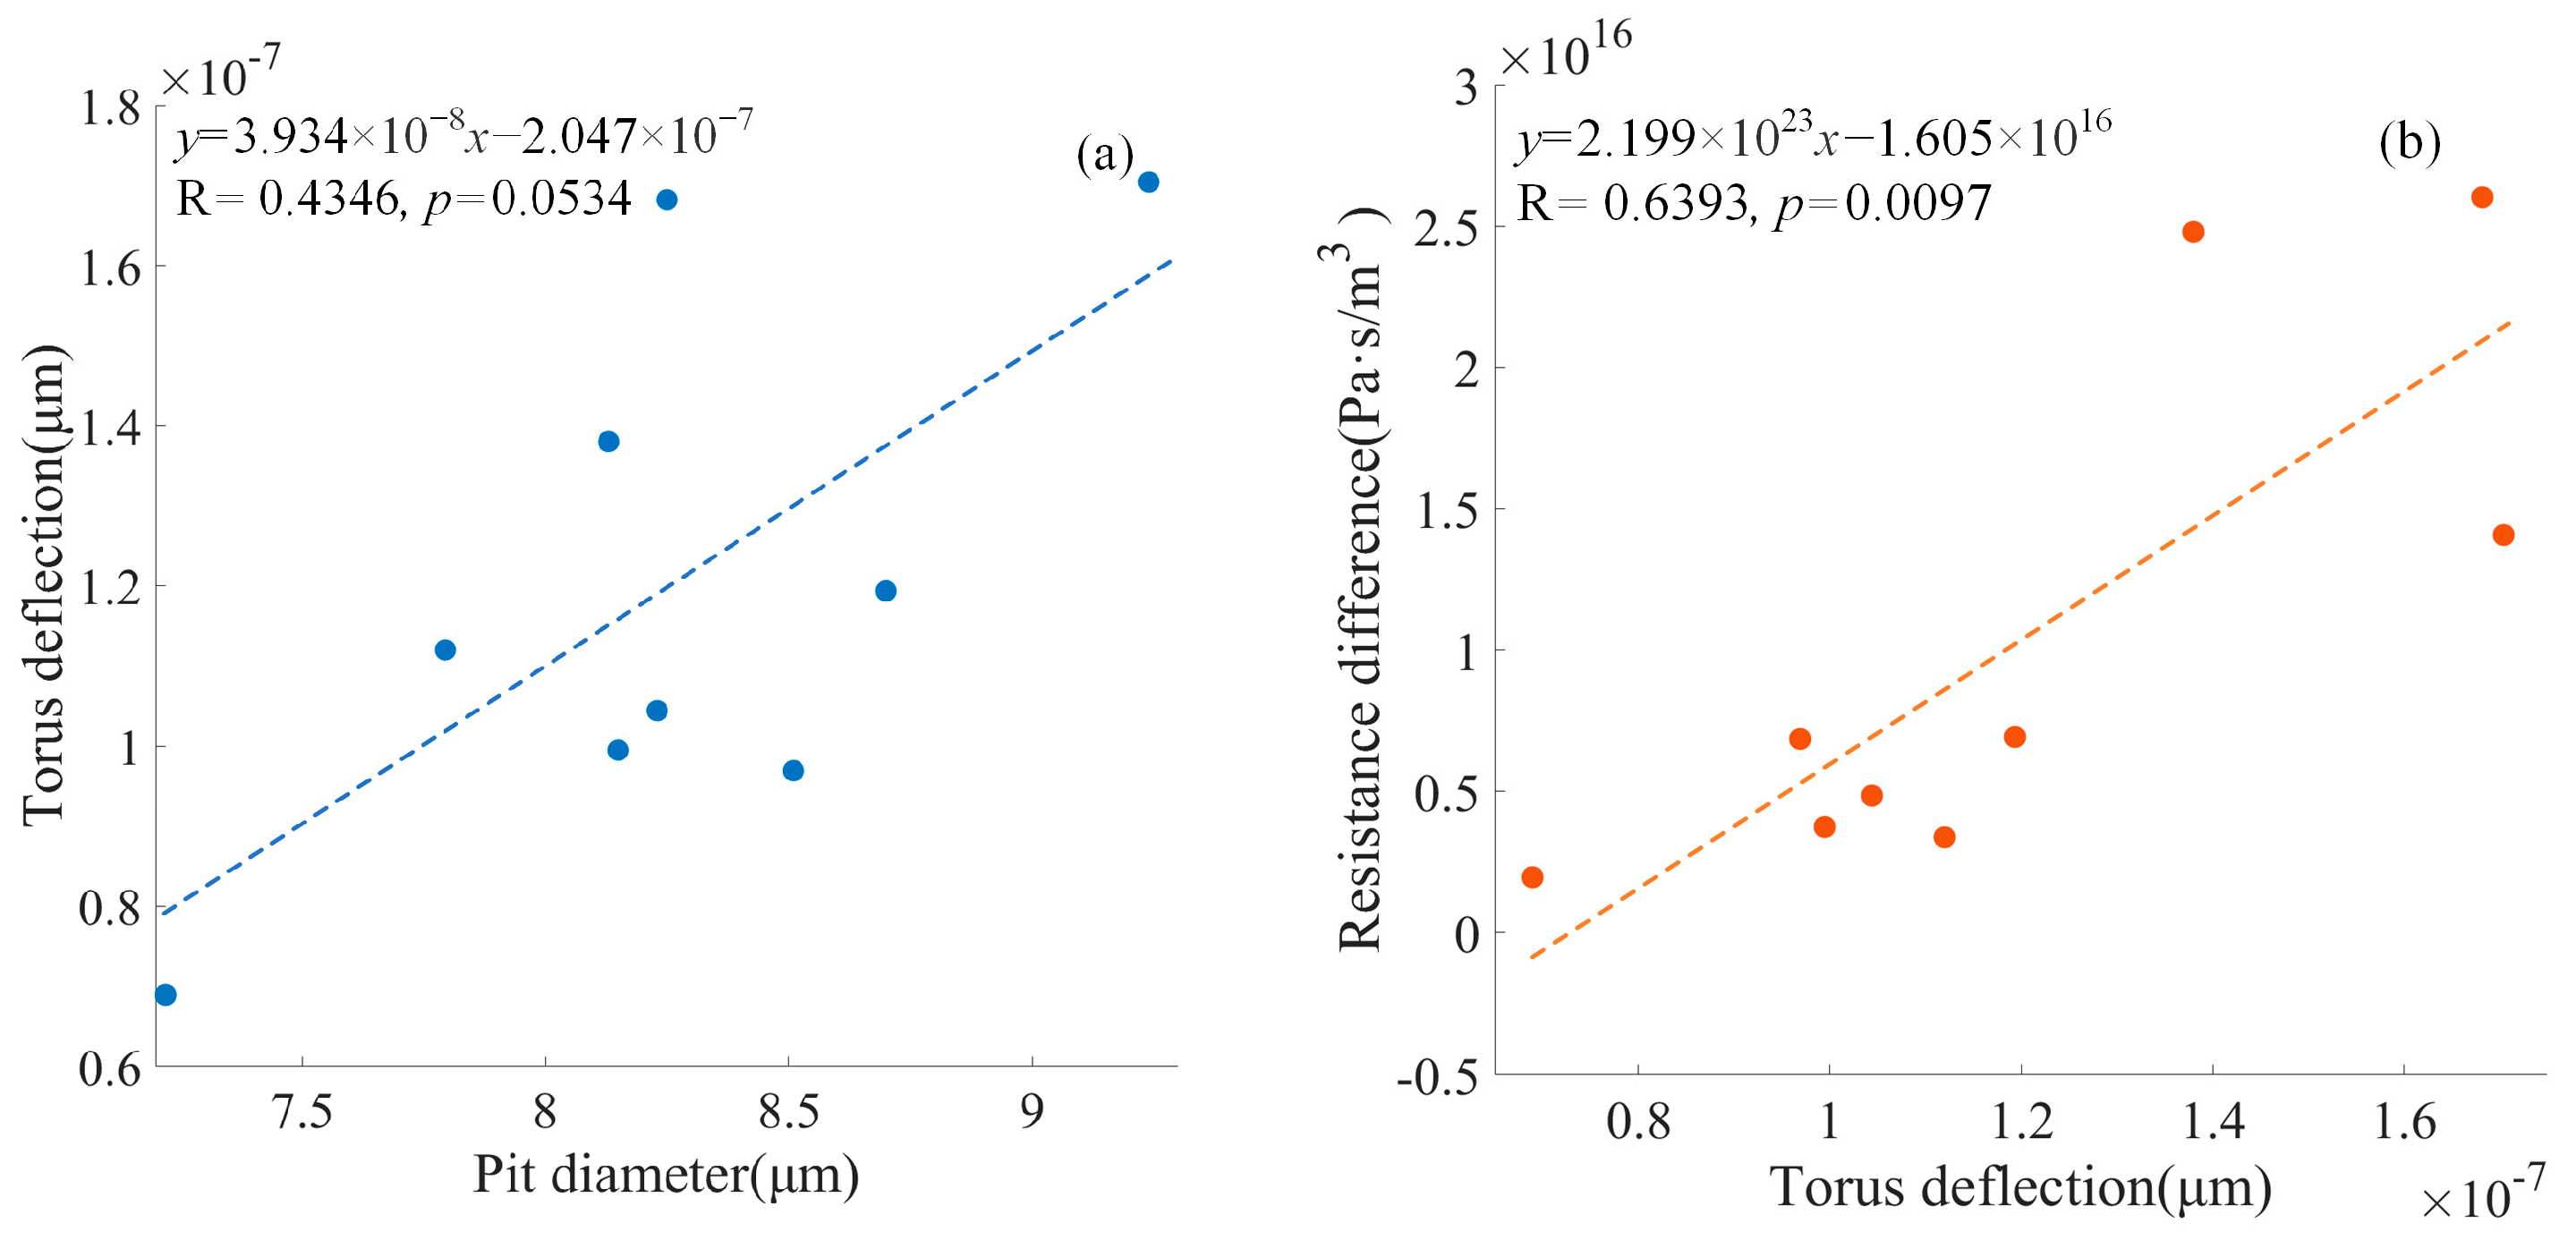
Figure 11 shows the positive relationship between the pit diameter and the torus deflection (
p = 0.0534). The positive relationship between the torus deflection and the resistance difference between the centered torus and the deflected torus was significant (
p < 0.05).
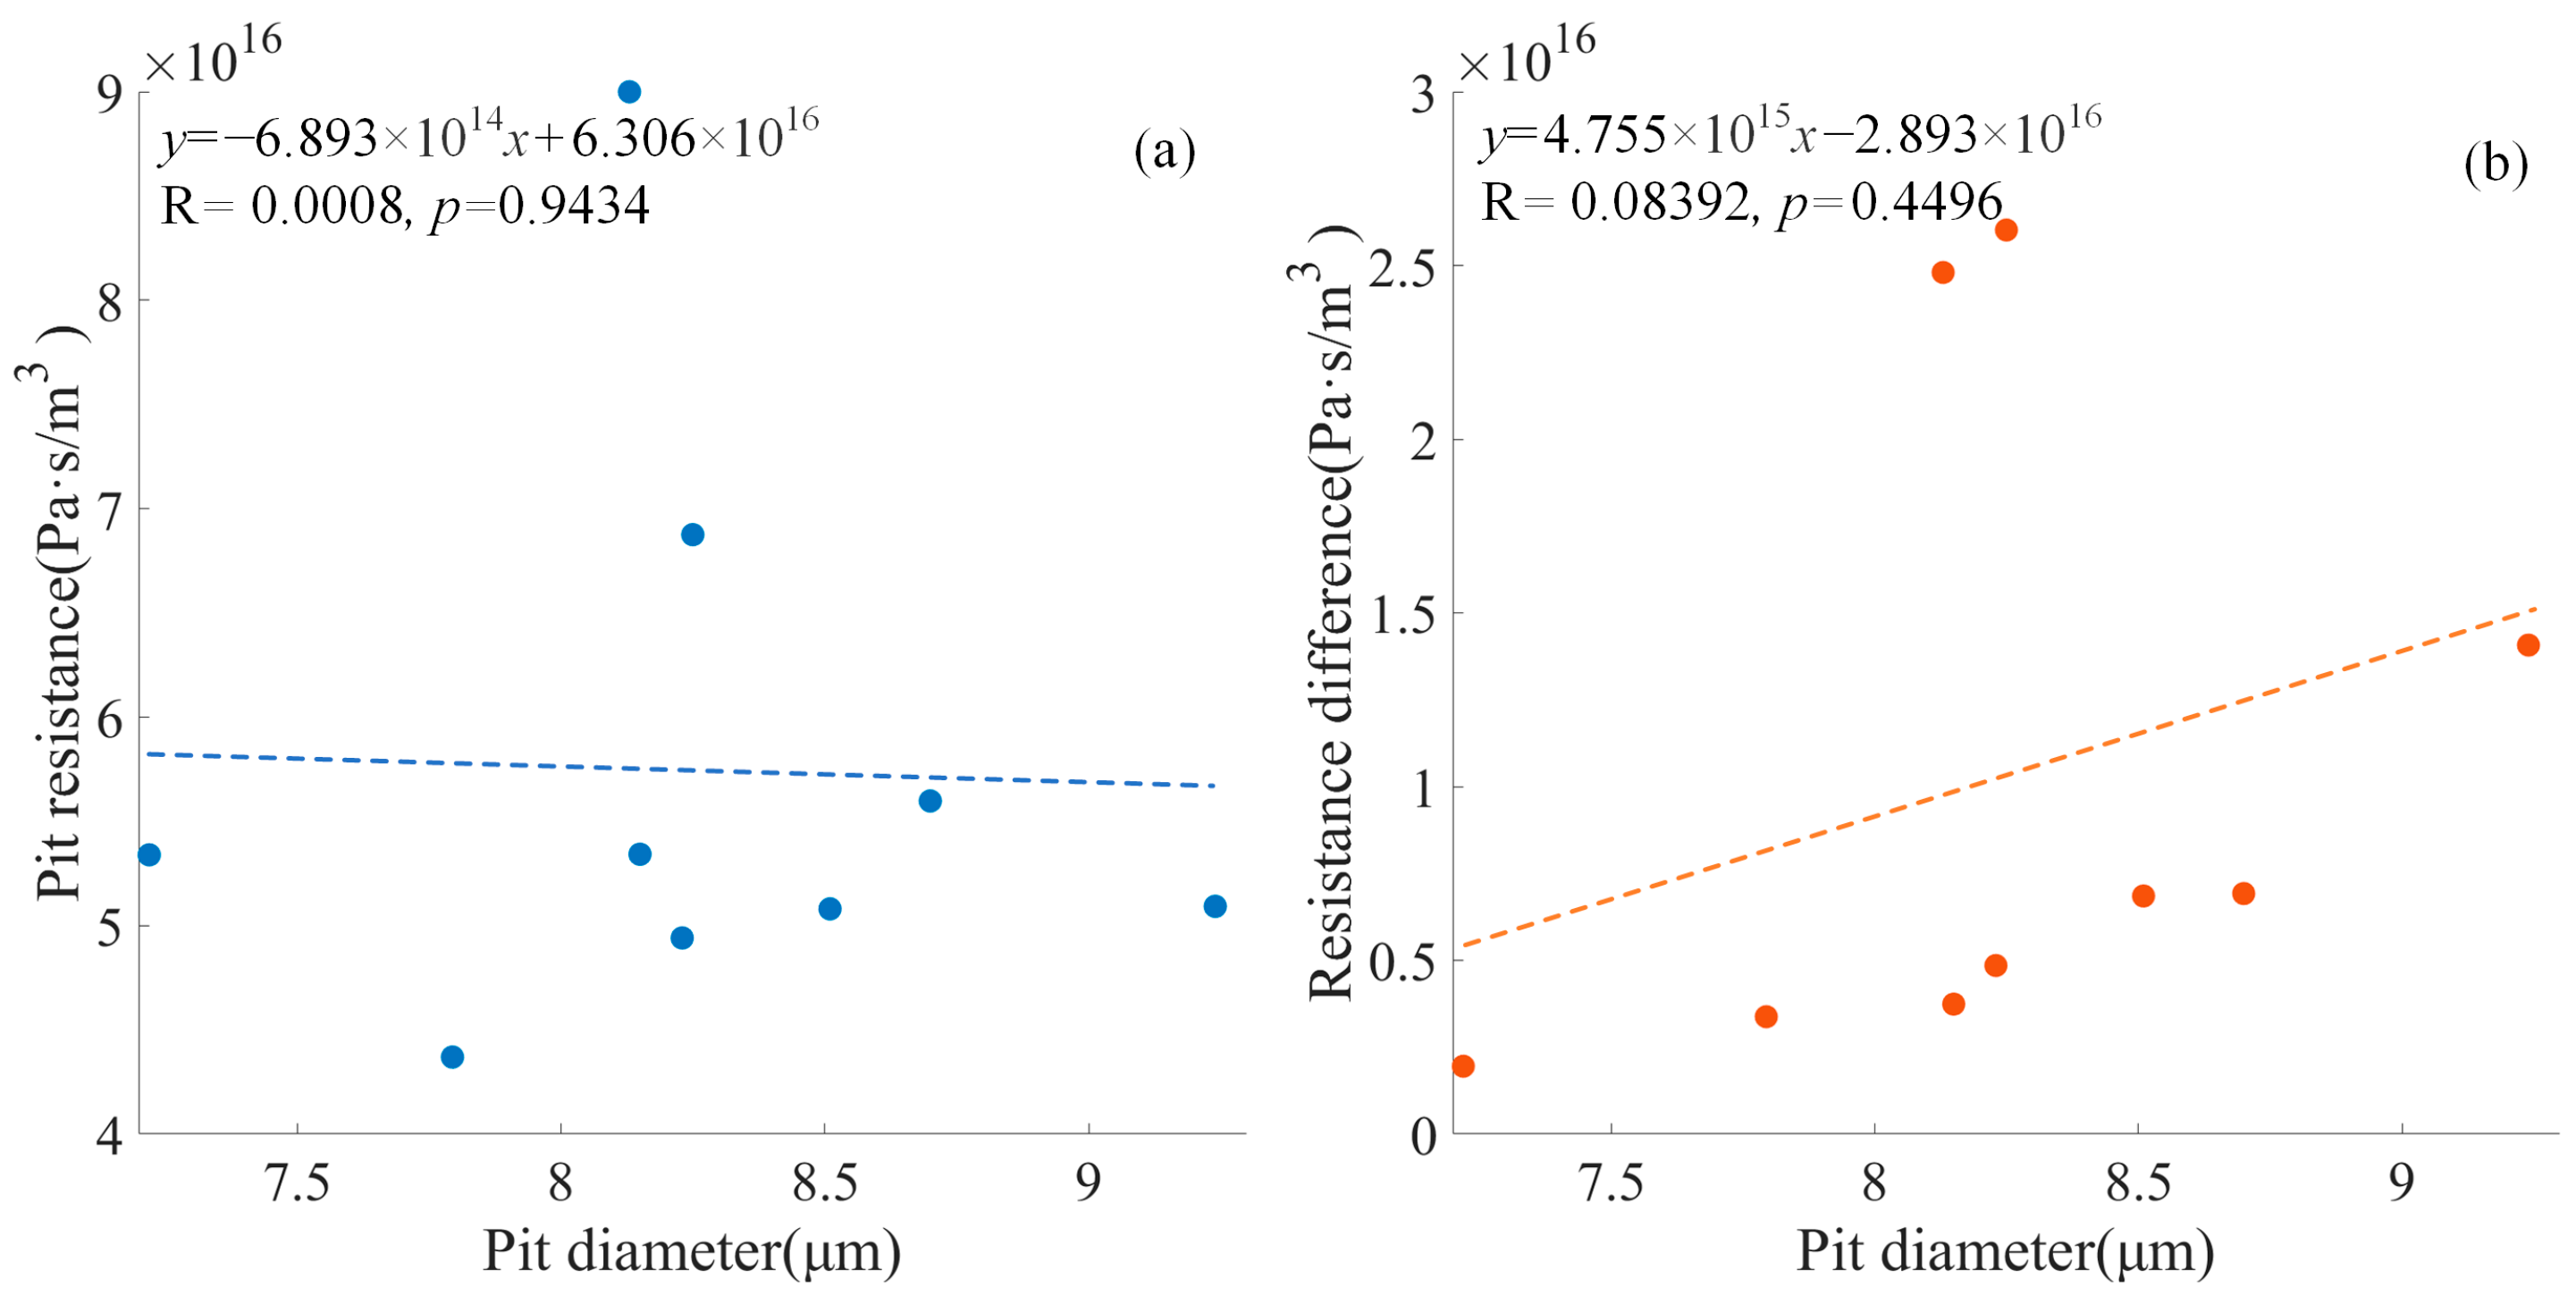
Figure 12 shows the negative relationship between the pit diameter and the pit resistance with the deflected torus (
p = 0.9434) and the positive relationship between the pit diameter and the pit resistance difference (
p = 0.4496).
Figure 13 shows that the negative relationship between the pit depth and the pit resistance with the deflected torus was not significant (
p = 0.0820), and the negative relationship between the pit depth and the resistance difference was significant (
p < 0.05).
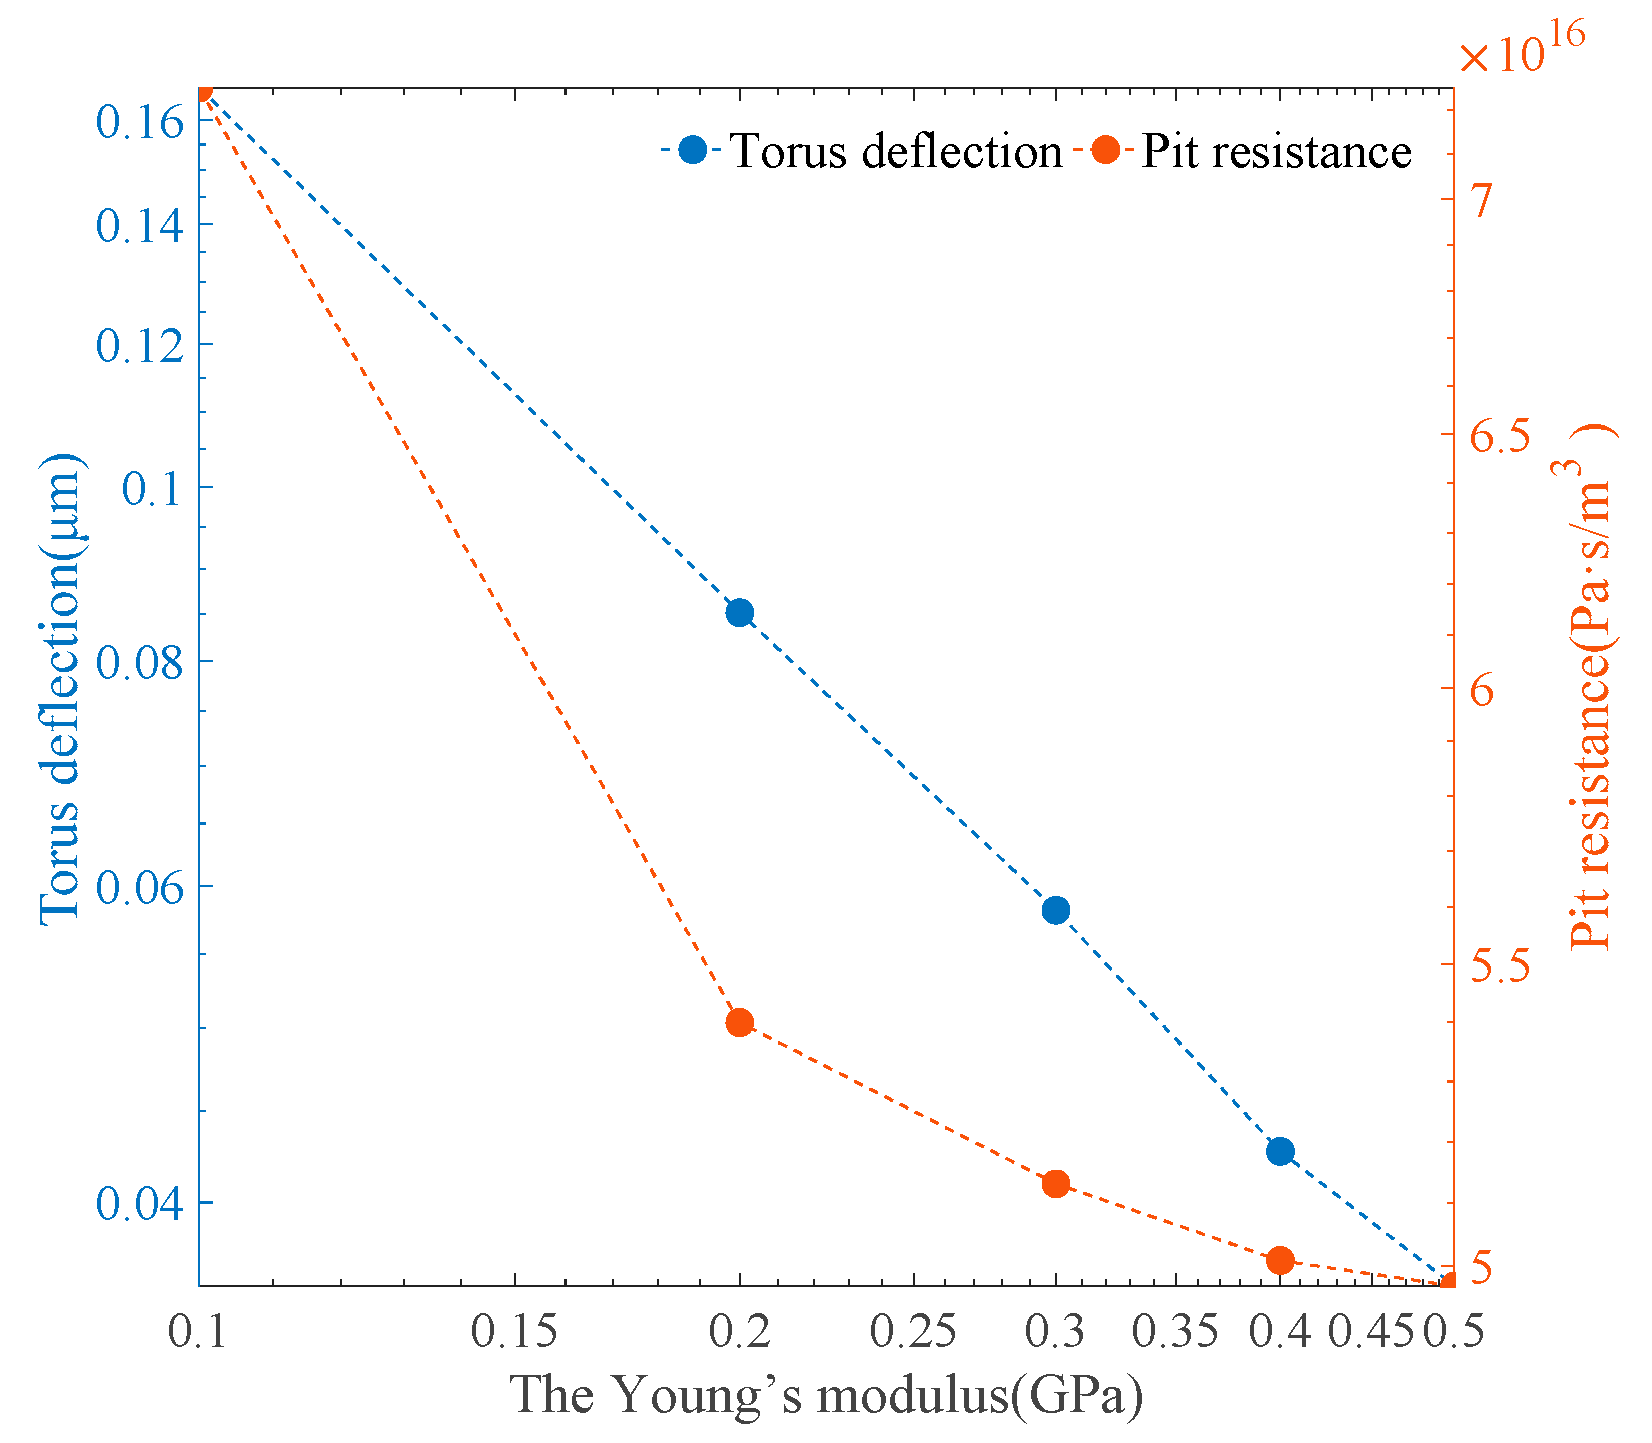
Under the pressure difference of 250 Pa, the effects of Young’s modulus on the torus deflection and the pit resistance were evaluated by implementing one random model out of nine models. As shown in
Figure 14, the variation in the Young’s modulus value had a significant influence on the torus deflection from 0.1666 μm to 0.0359 μm. Similar to the torus deflection under an increasing pressure difference, the relationship between Young’s modulus and the torus deflection had a nearly negative proportion. However, a nonlinear reduction from 7.249 × 10
16 Pa·s/m
3 to 4.968 × 10
16 Pa·s/m
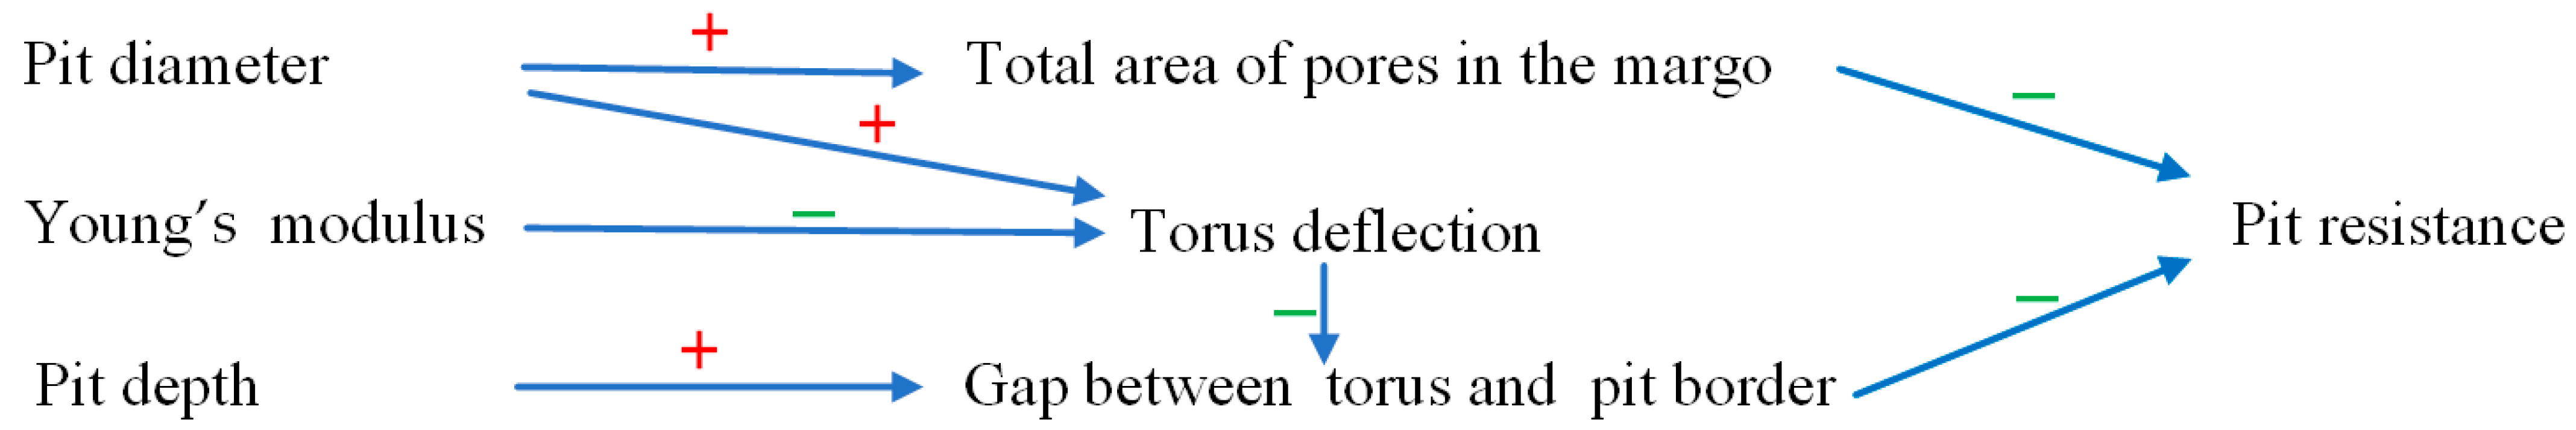
3 in pit resistance was observed as Young’s modulus increased. To summarize the results,
Figure 15 depicts the influences of the pit structure on the pit resistance.
4. Discussion
Within the context of laminar flow, which is characterized by low Reynolds numbers, the primary factor influencing flow resistance within the bordered pit was attributed to the boundaries of the flow field, namely the torus, the margo, and the pit border. When the torus–margo structure was initially positioned at the center, the pores in the margo could be considered as parallel channels for water flow. The Hagen–Poiseuille equation [
40], utilized for the assessment of flow resistance in channel flow, established an inverse correlation between flow resistance and the fourth power of the channel’s hydraulic diameter. Therefore, the larger pores in the margo were more significant in facilitating flow transportation. According to Pittermann et al. [
41] and Schulte [
25], it has been proposed that large pores in the margo might exert a notable influence on the hydraulic conductivity within bordered pits. Additionally, the flow resistance was further influenced by the narrow gap that existed between the torus–margo structure and the pit border, particularly in proximity to the margin of the pit membrane. It is widely recognized that water flow can identify the pathway that offers the least resistance to its movement. The velocity of flow in the pores near the torus exhibited a notable increase compared to the velocity observed in the pores adjacent the margin of the pit membrane. When performing a comparison between the pit chamber, margo, and narrow gap, it was observed that the flow resistance in the pit chamber was less than the resistance in the margo or the narrow gap.
The present investigation confirmed the findings of Schulte et al. [
26] that broader pits with higher pit diameters reduce the flow resistance compared to narrower pits. In the present study, the total area of pores in the margo was found to be positively related to the pit diameter. When the pit diameter increased, the overflow area of the pores in the margo increased and then the pit resistance decreased, similar to the results [
26]. Based on the flow behavior in the bordered pit, a deeper pit with an enlarged narrow gap between the torus–margo and the pit border should have lower flow resistance, as discussed in study [
26]. Nevertheless, the correlation between the pit depth and the pit resistance was found to be insignificant. The discrepancy between the flow theory and the correlation analysis may have arisen due to the complexities of the sample dataset. There was a negative correlation between the pit diameter and the pit depth in the dataset. The correlation analysis failed to reveal the impacts of the pit depth’s increase on the pit resistance, due to the decrease in the pit diameter having a negative impact on the pit resistance when the pit depth increased.
To overcome the flow resistance in the bordered pit, the water had to transform energy from water pressure into water velocity. There was a significant decrease in the water pressure in the margo as well as in the narrow gap where the flow resistance predominated over the pit resistance. When the torus was in the centered position, the pressure difference between the torus’s upstream and downstream surfaces was much higher than the difference across the margo’s upstream and downstream surfaces. Hence, there was a notable link between the fluid force on the torus and the torus diameter. In comparison with the fluid force on the margo, the fluid force on the torus was predominant over the fluid force on the torus–margo structure, despite the fact that the surface area of the margo was larger than that of the torus in all the pit models. As an increase in the pit diameter generally led to an increase in the surface area of the torus and the margo, the increase in pit diameter resulted in a higher fluid force acting on the torus–margo structure.
When the interaction between the fluid flow and the solid structure took effect, the deflection of the torus was significant under a pressure difference between the neighboring tracheids of 250 to 1750 Pa. With the torus and margo approaching the pit border, it gave rise to a narrowing of the downstream gap between the torus–margo structure and the pit borders. Although the torus deflection enlarged the upstream gap and the margo stretching expanded the pores in the margo, the pit resistance increased as the downstream gap was narrowed. Sperry and Tyree [
17] found that the stem conductivity was dependent on the flow rate among several conifers. Domec et al. [
19] suggested that the apparent nonlinear reduction in the stem conductivity with increasing applied pressure might be a result of the torus deflection. The simulation results in the study provided theoretical evidence for the stem nonlinear pressure–flux relationship observed in the experiments. When the flow resistance in the downstream gap was higher than the resistance in the upstream gap and the margo, the pressure variation in the upstream gap and across the margo relatively decreased, while the variation in the downstream gap significantly increased. As the pressure difference between tracheids increased, the fluid force on the torus and the margo also increased, whereas the gradient of the force reduced with increasing torus deflection. In this preliminary study, a linear structural model of the torus and the margo was formulated, while disregarding the effects of material and geometric nonlinearity caused by significant deformation. According to the linear deformation theory, the deflection of the torus should be directly proportional to the fluid force acting on the torus–margo structure. However, the torus’s deflection exhibited an approximately linear relationship with increasing pressure difference. The deviation occurred due to the alteration in the pressure distribution on the torus–margo structure. Specifically, the fluid force acting on the torus, which was more crucial for torus deflection, increased at a faster rate compared to the fluid force acting on the torus–margo structure. Furthermore, the pit resistance increased quickly, particularly at a higher pressure difference, as the flow resistance was negatively related to the higher order of the hydraulic diameter. When air seeding took place in a tracheid, the expansion of gas bubble volume was attributed to two factors: the outflow of water from the tracheid to its neighboring tracheids driven by the pressure difference and the conversion of water into gas under negative pressure. Although the bordered pit could not prevent the water gasification under water saturation steam pressure, the nonlinear increase in the pit resistance when closing the pit could obstruct the water flow and subsequently delay the bubble growth. In addition, when compared to the fluid force calculated under the assumption of uniformly distributed water pressure on the torus–margo structure [
32,
33], the external force derived from the fluid–solid interaction model was much smaller, particularly when the torus had greater deflection. The mechanical analysis [
32,
33] might have underestimated the pressure difference between tracheids for pit aspiration.
When examining the flow resistance of all the pit samples under a pressure difference of 500 Pa, it was observed that there existed an intricate relationship between the structure of the bordered pit and the pit resistance. As the torus approached the pit aperture, the narrow gap between the torus–margo structure and the pit border became the primary factor influencing the flow resistance within the pit. Therefore, a notable positive correlation was observed between the torus deflection and the pit resistance difference between the centered torus and the deflected torus. The torus deflection resulted in a decrease in the impact of the margo on the pit resistance. The correlation between the pit diameter and the pit resistance became statistically insignificant. Furthermore, the torus deflection promoted the negative correlation between the pit depth and the pit resistance, which was more significant than the weak correlation observed when the torus was positioned at the center. These findings provide evidence for the aforementioned supposition that the correlation analysis might not effectively capture the significance of pit depth when the torus was positioned at the central location. The augmentation in pit diameter resulted in an increase in both the surface area of the torus–margo structure, as well as the structural flexibility of the margo. The increase in the pit diameter promoted the torus deflection and the pit resistance. It resulted in a positive correlation between the resistance difference and the pit diameter. As the torus needed to deflect much more to close the pit chamber in a deeper pit, a negative correlation between the resistance difference and the pit depth was found.
When taking into consideration the negative correlation between the pit diameter and pit resistance with the torus at the center position, as well as the positive correlation between the pit diameter and the pit resistance difference with torus deflection, the investigation revealed that a higher pit diameter with lower pit resistance exhibited a greater ability to regulate the water flow in bordered pits. Furthermore, when taking into consideration the negative relationship between the pit depth and pit resistance with the torus at the central position, as well as the negative relationship between the pit depth and the pit resistance difference with the torus deflection, a deeper pit depth with lower pit resistance reduced the ability to regulate the water flow in bordered pits. A negative correlation has been observed between the diameter and the depth of the stem pits in both black spruce [
32] and oriental arborvitae [
33], and a positive relationship between the diameter and the depth of root pits in black spruce has been observed [
32]. It was proposed that the development of bordered pits allowed for an adaptive mechanism that balanced the water transportation efficiency and the water adjustment capacity. Given the notable variations in the geometry of bordered pits across different organs and different species [
34,
42], it was essential to conduct a comparative analysis among different conifer species and organs.
The behavior of the bordered pit in response to applied pressure was heavily influenced by material properties, particularly Young’s modulus. In accordance with the mechanical analysis conducted by reference [
32,
33], the deflection of the torus exhibited a negative correlation with Young’s modulus. As the pit resistance was a higher order of sensitivity than the torus deflection, Young’s modulus played a considerably influential role in determining the pit resistance. When comparing the solid analysis [
32,
33] to the findings of the fluid–solid interaction model, it was noted that the significance of Young’s modulus became more important in regulating the water flow in bordered pits. Despite the importance of material properties, the availability of experimental data for the torus and margo remains limited due to the inherent challenges for measuring these microstructures. As the deformation of the margo was much higher than the torus deformation in the pit-closing process, it was deemed necessary to prioritize the measurement of margo properties.
The passive regulation of the flow transportation in the bordered pit depended on pit structure, the material properties of the torus–margo, and the pressure difference between the tracheids. Under high water stress, the passive hydraulic regulation of bordered pits could increase the flow resistance and reduce the water flow rate in the xylem, inhibiting leaf transpiration. With the fluid–solid interaction between the water flow and the torus–margo deformation, the water regulation of bordered pits could be the basic physiology of conifers. Based on a pit structure, the passive regulation was inherently a tradeoff between the flow efficiency and regulation capability. With increasing regulation capability, the flow resistance under lower pressure had to increase. When comparing xylem conductivities in the experiments in [
17,
18,
19], it was found that the difference in the performance of the passive regulation was significant between species. Therefore, it was important to fully investigate the impact of flow regulation in bordered pits on the xylem network composed of tracheids and bordered pits [
43]. On the other hand, the extent to which the passive regulation works in living trees is related to the pressure gradient in the xylem, which depends on tree transpiration. Therefore, the passive regulation of the bordered pit in the xylem may represent environmental adaptation.
The present study employed a standardized modeling approach, incorporating robust mechanics theory and widely accepted engineering software, to comprehensively investigate the hydraulic characteristics of bordered pits. The investigation of fluid–solid interaction between the structure deformation and flow transportation provided insights into the flow-adjusting behavior of the torus–margo structure. The results of the simulation prompted further investigations of the microstructure of the pit, as well as the material properties of the torus and margo. In order to reduce the uncertainties of the stochasticity of pit structures on the correlation analysis, the number of pit samples should be increased in future studies. To enhance the accuracy of the fluid model, the properties of the sap in stems such as density and viscosity should be measured. To improve the solid model, the material properties of the torus and margo, particularly the orientation and microstructure of the tiny fibrils in the margo, should be measured. Based on the fluid–solid interaction model, to conduct a more comprehensive investigation of the propagation of air seeding in bordered pits, it is suggested that the multiphase flow with the bubble surface-tracking technique should be employed to study the growth and spread of gas bubbles.
5. Conclusions
To investigate the nonlinear pressure–flux phenomenon for water regulation in bordered pits, a theoretical model was developed considering the fluid–solid interaction. This model included the elastic deformation of the torus–margo structure and the flow of water transportation within the pit. Nine pit samples of oriental arborvitae stems were reconstructed using scanning electron microscopy and transmission electron microscopy images.
The flow resistance in bordered pits was attributed to the margo, the narrow space between the torus–margo structure and the pit border, as well as the pit chamber. In comparison to the pit chamber and the gap, the resistance from the margo was dominant when the torus was positioned in the pit center. When the torus deflected towards the pit border, however, the downstream gap was narrowed and became the prevailing factor for the pit resistance. Although the deflection of the torus was roughly proportional to the pressure difference, the flow resistance exhibited a considerable nonlinear increase as the pressure difference increased. When the pit diameter increased, the pit resistance decreased with the increasing total area of the margo pores, and the ability to regulate water flow was improved with increasing margo flexibility. Both the pit resistance and the ability to regulate water flow reduced as a result of increasing the pit depth, which enlarged the gap between the torus–margo and the pit border. The Young’s modulus of the margo exerted a substantial impact on the nonlinear pressure–flux correlation within the bordered pit.
The simulation results provide theoretical support for the nonlinear relationship between the pressure difference and the flux in a bordered pit, as well as for the prevention of gas bubble spread through a bordered pit during tracheid cavitation. The model developed in this study can be used to investigate tracheid water regulation and pit aspiration for tracheid embolism.


