Article

Revealing Three-Dimensional Variations in Fuel Structures in Subtropical Forests through Backpack Laser Scanning

1
Key Laboratory of Natural Disaster Monitoring Early Warning and Assessment of Jiangxi Province, Key Laboratory of Poyang Lake Wetland and Watershed Research, Ministry of Education, College of Geography and Environment, Jiangxi Normal University, Nanchang 330022, China
2
Forestry Department, Jiangxi Environment Engineering Vocational College, Ganzhou 341000, China
3
Key Laboratory of National Forestry and Grassland Administration on Forest Ecosystem Protection and Restoration of Poyang Lake Watershed, College of Forestry, Jiangxi Agricultural University, Nanchang 330045, China
4
Jiangxi Provincial Key Laboratory of Soil Erosion and Control, Jiangxi Academy of Water Science and Engineering, Nanchang 330029, China
5
College of Forestry, Northeast Forestry University, Harbin 150040, China
*
Author to whom correspondence should be addressed.
Forests 2024, 15(1), 155; https://doi.org/10.3390/f15010155
Submission received: 2 December 2023 / Revised: 23 December 2023 / Accepted: 10 January 2024 / Published: 11 January 2024
(This article belongs to the Special Issue Wildfire Monitoring and Risk Management in Forests)

Abstract

:
Wildfire hazard is a prominent issue in subtropical forests as climate change and extreme drought events increase in frequency. Stand-level fuel load and forest structure are determinants of forest fire occurrence and spread. However, current fuel management often lacks detailed vertical fuel distribution, limiting accurate fire risk assessment and effective fuel policy implementation. In this study, backpack laser scanning (BLS) is used to estimate several 3D structural parameters, including canopy height, crown base height, canopy volume, stand density, vegetation area index (VAI), and vegetation coverage, to characterize the fuel structure characteristics and vertical density distribution variation in different stands of subtropical forests in China. Through standard measurement using BLS point cloud data, we found that canopy height, crown base height, stand density, and VAI in the lower and middle-height strata differed significantly among stand types. Compared to vegetation coverage, the LiDAR-derived VAI can better show significant stratified changes in fuel density in the vertical direction among stand types. Among stand types, conifer-broadleaf mixed forest and C. lanceolata had a higher VAI in surface strata than other stand types, while P. massoniana and conifer-broadleaf mixed forests were particularly unique in having a higher VAI in the lower and middle-height strata, corresponding to the higher surface fuel and ladder fuel in the stand, respectively. To provide more informative support for forest fuel management, BLS LiDAR data combined with other remote sensing data were advocated to facilitate the visualization of fuel density distribution and the development of fire risk assessment.

1. Introduction

Climate change, pests, diseases, and inappropriate forest management practices have created conditions that can lead to a high risk of fire damage and fire suppression costs [1,2,3]. This calls for the urgent recognition of managing forest fuels better and minimizing fire hazards [4]. Forest fuels are the basis for forest fire occurrence and spread [5,6]. The three-dimensional (3D) structures of vegetation significantly impact fire risk and burn severity, especially the vertical density and spatial arrangement of branches and leaves below the canopy [7,8]. For example, the average height from the ground to the base of the canopy (canopy base height) can influence the probability of surface fires transforming into the canopy [9,10]. Likewise, canopy height and canopy bulk density can affect fire intensity and burn severity in different tree species [10,11,12,13]. Information on how fuel density varies from the surface layer, the ladder layer, to the canopy layer is critical for understanding fire intensities and has implications for subsequent fuel management [14,15].
At present, the estimation of forest fuel parameters mainly relies on satellite remote sensing to obtain forest fuel coverage, fuel load, fuel type, and other plane parameters at broader scales, while rarely quantifying the vertical structures below the canopy that might be related to fire behaviors [16,17]. However, quantifying stands with significant vertical vegetation structure changes remains challenging due to satellite remote sensing techniques’ limited canopy penetration capabilities. The lack of detailed estimates of the 3D structural properties of different stand/fuel types may lead to greater limitations and uncertainties in identifying forest fuels with higher fire risks [18,19]. Field measurements of fuel data in situ can allow for a much clearer picture of its vertical structures. However, they are labor-intensive, and it is challenging to quantify spatially explicit heterogeneity at relevant spatial scales [20]. Therefore, it is necessary to develop new remote sensing technology platforms and parameters to accurately quantify the intact vertical structure of vegetation at fine scales, which enables us to effectively assess the density distribution of fuels at different height strata.
Light detection and ranging (LiDAR) is particularly useful for acquiring information on the vertical structure of forest fuels [21,22,23]. Airborne LiDAR offers advantages in acquiring canopy fuel parameters [11]; however, its accuracy in estimating vertical structure is limited when dealing with dense forest canopies due to inadequate penetration [24,25,26]. In contrast, backpack laser scanning (BLS) enables a more explicit and detailed description of structural complexity relating to forest fuels, providing complementary information to airborne LiDAR data by quantifying the forest structure in middle and lower strata [17,27]. BLS LiDAR offers high-resolution data that accurately describe the vertical and horizontal structural parameters of forest fuels beneath the top canopy [28], facilitating the precise characterization of novel metrics such as structural complexity and vegetation area index (VAI) [29,30]. The VAI data derived from LiDAR describe the 3D spatial variation in vegetation density, as well as the location of vegetation elements (e.g., branches and leaves), which has been used to assess structural differences among forest types and disturbances in forests [31,32]. In order to guide priorities for fuel management and fire risk assessment, consistent monitoring of detailed 3D imagery is needed for quantifying fuel density changes across different stand types and height strata; here, BLS-derived data could be an alternative for quantifying and monitoring forest fuel structure parameters.
In recent years, the increase in global warming and extreme drought events has led to an elevation in the frequency of wildfires in subtropical forests in China [33,34]. Although previous studies have utilized satellite or aerial remote sensing to estimate crown fuel characteristics at a large scale [12,35], the complex crown structure of subtropical forests makes it challenging for traditional optical sensors to directly monitor forest fuels beneath the crown, limiting the accuracy of fuel density estimation and potentially underestimating the risk of wildfires in Chinese subtropical forests. To address this issue, this study aims to precisely quantify the vertical distribution of fuel density in Chinese subtropical forests using BLS. By employing high-resolution point cloud data provided by BLS, we accurately quantified variations in surface, ladder, and crown fuel for different forest types, which is crucial for effective fuel management and subsequent wildfire risk assessment [20,27]. To achieve this, representative sites in Chinese subtropical forests were selected, and the following parameters were measured to extract from point cloud data: (1) basic stand structure attributes related to forest fuels (canopy height, crown base height, canopy volume, and stand density); (2) vegetation area index (VAI) and vegetation coverage derived from LiDAR data at different height strata to quantify fuel density distribution in the vertical profile; (3) by comparing these measured parameters, this study will identify which structural parameters or features exhibit significant variations among different forest types, thus inferring which forest types have a higher surface, ladder, or crown fuel density.

2. Materials and Methods
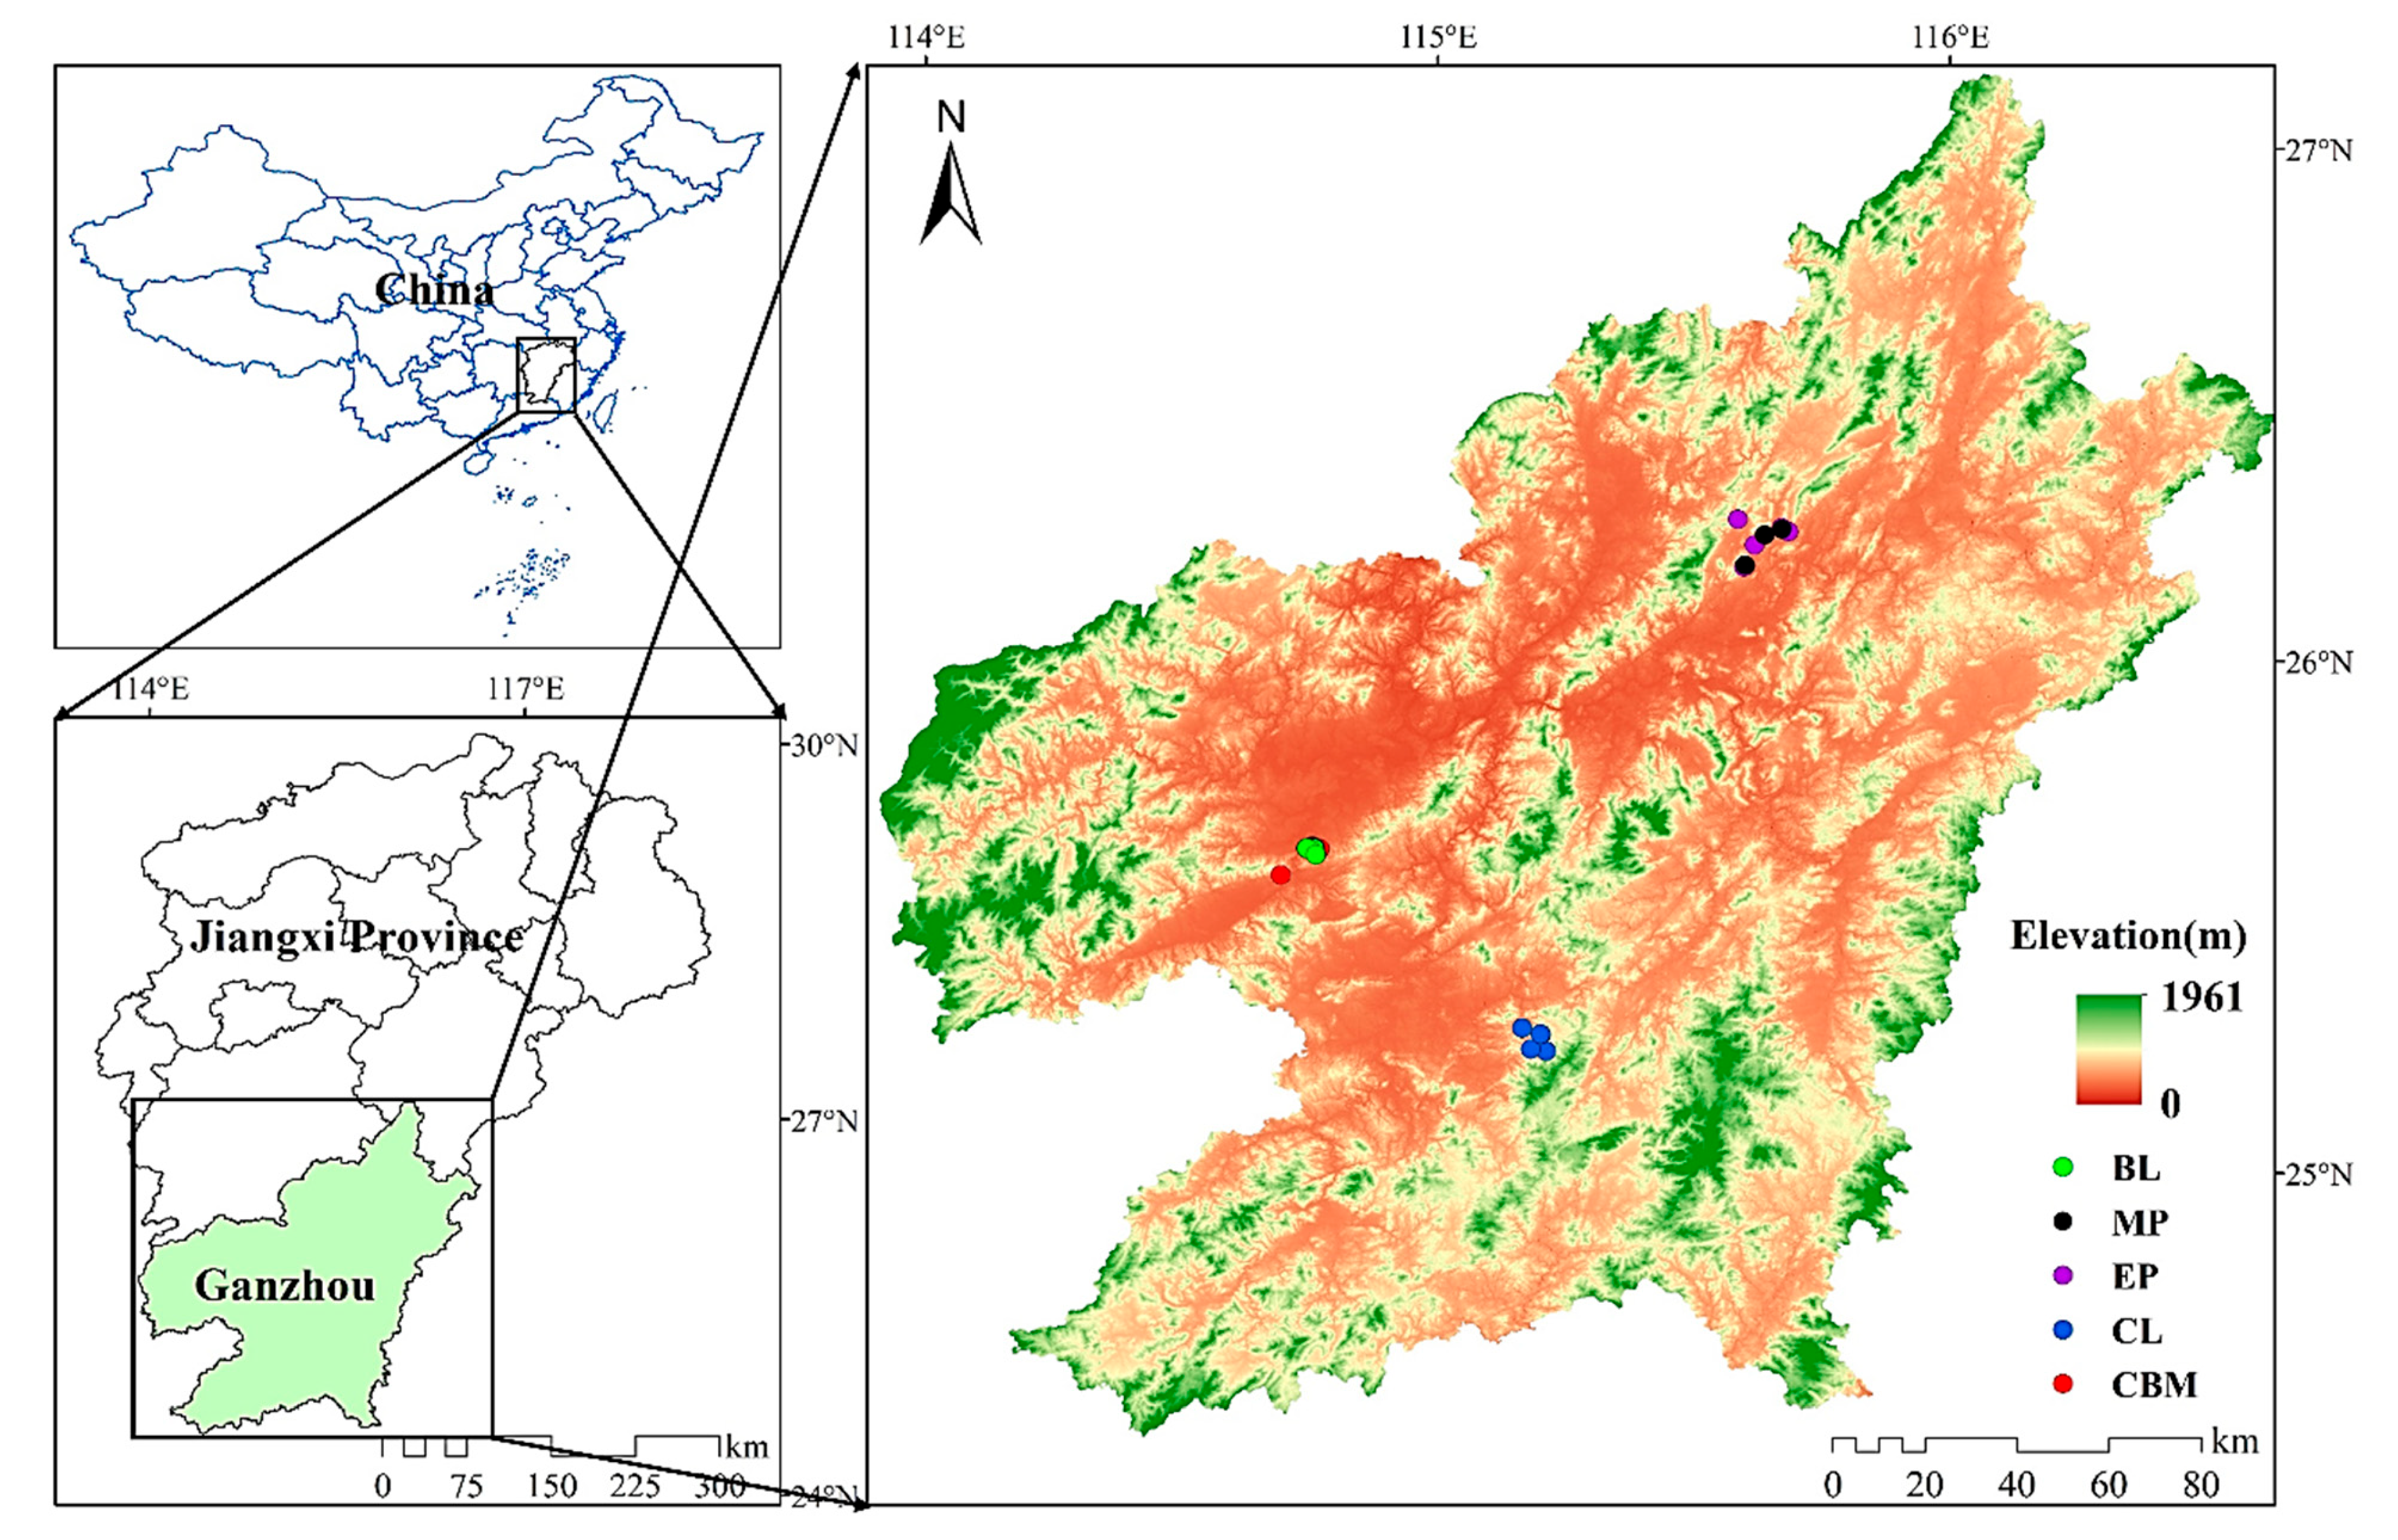
2.1. Study Area

Our study took place in the southern part of Jiangxi Province in China (24°29′–27°09′ N and 113°54′–116°38′ E) (Figure 1). This region is mountainous with a high variation in elevation and occurs within a typical subtropical monsoon climate that has high inter-annual and seasonal fluctuations in precipitation. An increased frequency of extreme droughts in the region has led to an increase in the frequency and intensity of wildfires [36] (Figure S1). Forest coverage in the region is high and includes a typical subtropical evergreen broad-leaved forest with tree species dominated by Pinus massoniana, Pinus elliottii, Schima superba, and Cunninghamia lanceolata. Among these, P. massoniana is most flammable because of the volatile oils in their branches and wood [13].

2.2. Plot Selection and Data Acquisition

In order to quantify the heterogeneity in a local fuel structure among forest stands, we selected 30 plots (20 m × 20 m) in 5 different stand types that represent a variation in forest types in the region: (1) forest dominated by P. massoniana (nine plots); (2) forest dominated by P. elliottii (six plots); (3) forest dominated by C. lanceolata (five plots); (4) broadleaf mixed forest with a mixture of several broadleaf species, including Schima superba, Liquidambar formosana, and Cinnamomum camphora (5 plots); and (5) conifer-broadleaf mixed forest, with a mixture of broadleaf (S. superba, L. formosana, and C. camphora) and conifer (P. massoniana and C. lanceolata) species (five plots) (Table S1 and Figure S2). In each plot, we used BLS LiDAR (LiBackpack50, Digital Green Valley Technology, Beijing, China) to obtain the point cloud data of forest vegetation structure. The parameter settings of the scan are shown in Table 1. During scanning, we adopted a zigzag route (Figure S3) and kept the equipment stable to avoid large fluctuations in the collected point cloud data. For each plot, we also recorded the stand type, geographical location, elevation, slope, aspect, and slope position.

2.3. Point Cloud Data Preprocessing

Prior to processing the data, we implemented several preprocessing procedures, including data clipping (cropped out the required plot cloud data), ground point filtering (classified the ground and vegetation), normalization (the point cloud elevation was normalized to facilitate visualization, analysis, and processing), point cloud thinning (made point cloud data more lightweight and improved the speed and efficiency of data processing), and resampling (resampling reduced the density of point cloud data and thus reduced computing and storage costs). We used LiDAR360 5.0 software (Digital Green Valley Technology, Beijing, China) to preprocess the data. Specifically, we used the Triangulated Irregular Network (TIN) algorithm to classify ground and non-ground point cloud data, which describe complex terrain at different spatial resolutions [37]. We generated the digital elevation model (DEM) and the digital surface model (DSM) (spatial resolution of 0.05 m) using the inverse distance weighted (IDW) interpolation method. We obtained the canopy height model by subtracting the DEM from the DSM. During the process of thinning and resampling the point cloud data, we converted the point cloud into a voxel grid (1 cm3) consisting of cover values using the “lidR” package in R version 4.2.1 (R Core Team, Vienna, Austria, 2022) in order to estimate forest fuel structure metrics [38].

2.4. Parameter Extraction and Estimation

We estimated six structural parameters including canopy height, CBH, canopy volume, stand density, VAI, and vegetation coverage of different point cloud data produced by the BLS. These parameters are an important basis for describing the 3D structure of vegetation and the vertical variation in fuels [39].

2.4.1. Canopy Height

Canopy height refers to the average height of the highest canopy in a stand [40], which is an important index to predict the fuel load and fire intensity in a forest [10]. In this study, we directly estimated the canopy height from the rasterized canopy height model by obtaining the canopy height of each grid and taking the average value [41].

2.4.2. Crown Base Height (CBH)

CBH is the average height from the ground to the crown base of the canopy [9,10]. We used the method of Stefanidou et al. to determine CBH by analyzing the distribution curve of the frequency of the vertical profile points and finding the height of the mutation inflection point (Figure S4) [42,43,44].

2.4.3. Canopy Volume

Canopy volume is an important vegetation structure parameter that affects the burn severity of a forest [45]. We estimated the canopy volume using voxelized point cloud data with a size of 1 cm3 by counting the number of voxels of the canopy part [46,47].

2.4.4. Stand Density

Stand density is the number of trees per unit area [39], which is a major factor affecting the distribution patterns of fuel [48]. In this study, we used a bottom-up method based on high point cloud density to obtain the number of trees in each plot [49]. The stand density was calculated by dividing the number of trees by the area of the plot.

2.4.5. Vegetation Area Index (VAI) and Vegetation Coverage of Different Height Strata

To describe the vertical change in forest fuel density, we calculated the VAI from the ground surface to the top of the canopy of each plot. The VAI describes the amount of vegetation area per unit area in the vertical profiles of a stand [29,50], which allows for the quantification of the density distribution and relative position of fuel within the stand using point cloud data [29]. We took 1 cm as the basic unit of stratification in the vertical direction and then counted the vegetation area of each layer. The VAI is obtained by dividing the number of voxels in each layer by the total area of the plot.
Vegetation coverage is traditionally a common index to describe forest fuel density in a horizontal range [51]. We used point cloud data to estimate the vegetation coverage of different height strata. We intercepted the point cloud data of different height strata from each plot and obtained the vegetation coverage area through point cloud voxelization (1 cm3) and rasterization (1 m2). Then, the vegetation coverage area was divided by the total area to obtain the vegetation coverage of different height strata.
To characterize and compare the changes in fuel density in different height strata, we subdivided each stand type into four vegetation strata as follows: (1) surface strata (0–1.5 m), mainly including litter, shrubs, grasses and herbs, and seedlings; (2) lower-height strata (1.5–5 m), generally encompassing lower-height trees or shrubs, where ladder fuels were distributed; (3) middle-height strata (5–10 m), typically including medium-height trees or the middle layer of tall trees; and (4) upper-height strata (more than 10 m height), mainly composed of tall trees, forming the upper canopy of the forest.

2.5. Data Analysis

The Kruskal–Wallis test was employed to determine the structural parameters that exhibit significant variations across stand types. To further compare the differences in structural parameters, a post hoc comparison based on the linear mixed effect model was used to ascertain whether there were significant variations in the structural parameters of each fuel across stand types. Although terrain is also an important factor affecting fuel structures [52], it is outside the scope of this study. Consequently, stand type is treated as a fixed factor, while terrains are considered random factors to construct linear mixed-effect models. Response variables are the forest structural metrics derived from BLS (canopy height, CBH, canopy volume, stand density, VAI, and vegetation coverage of different height strata), while fuel/stand type was the fixed independent variable. Terrain factors, such as aspect, geomorphological locations, and elevation, were incorporated into the models as random factors. We performed analyses using the “lme4” packages in R [53]. For all fitted models, we used the “glht” function and Tukey’s test for multiple comparisons.

3. Results

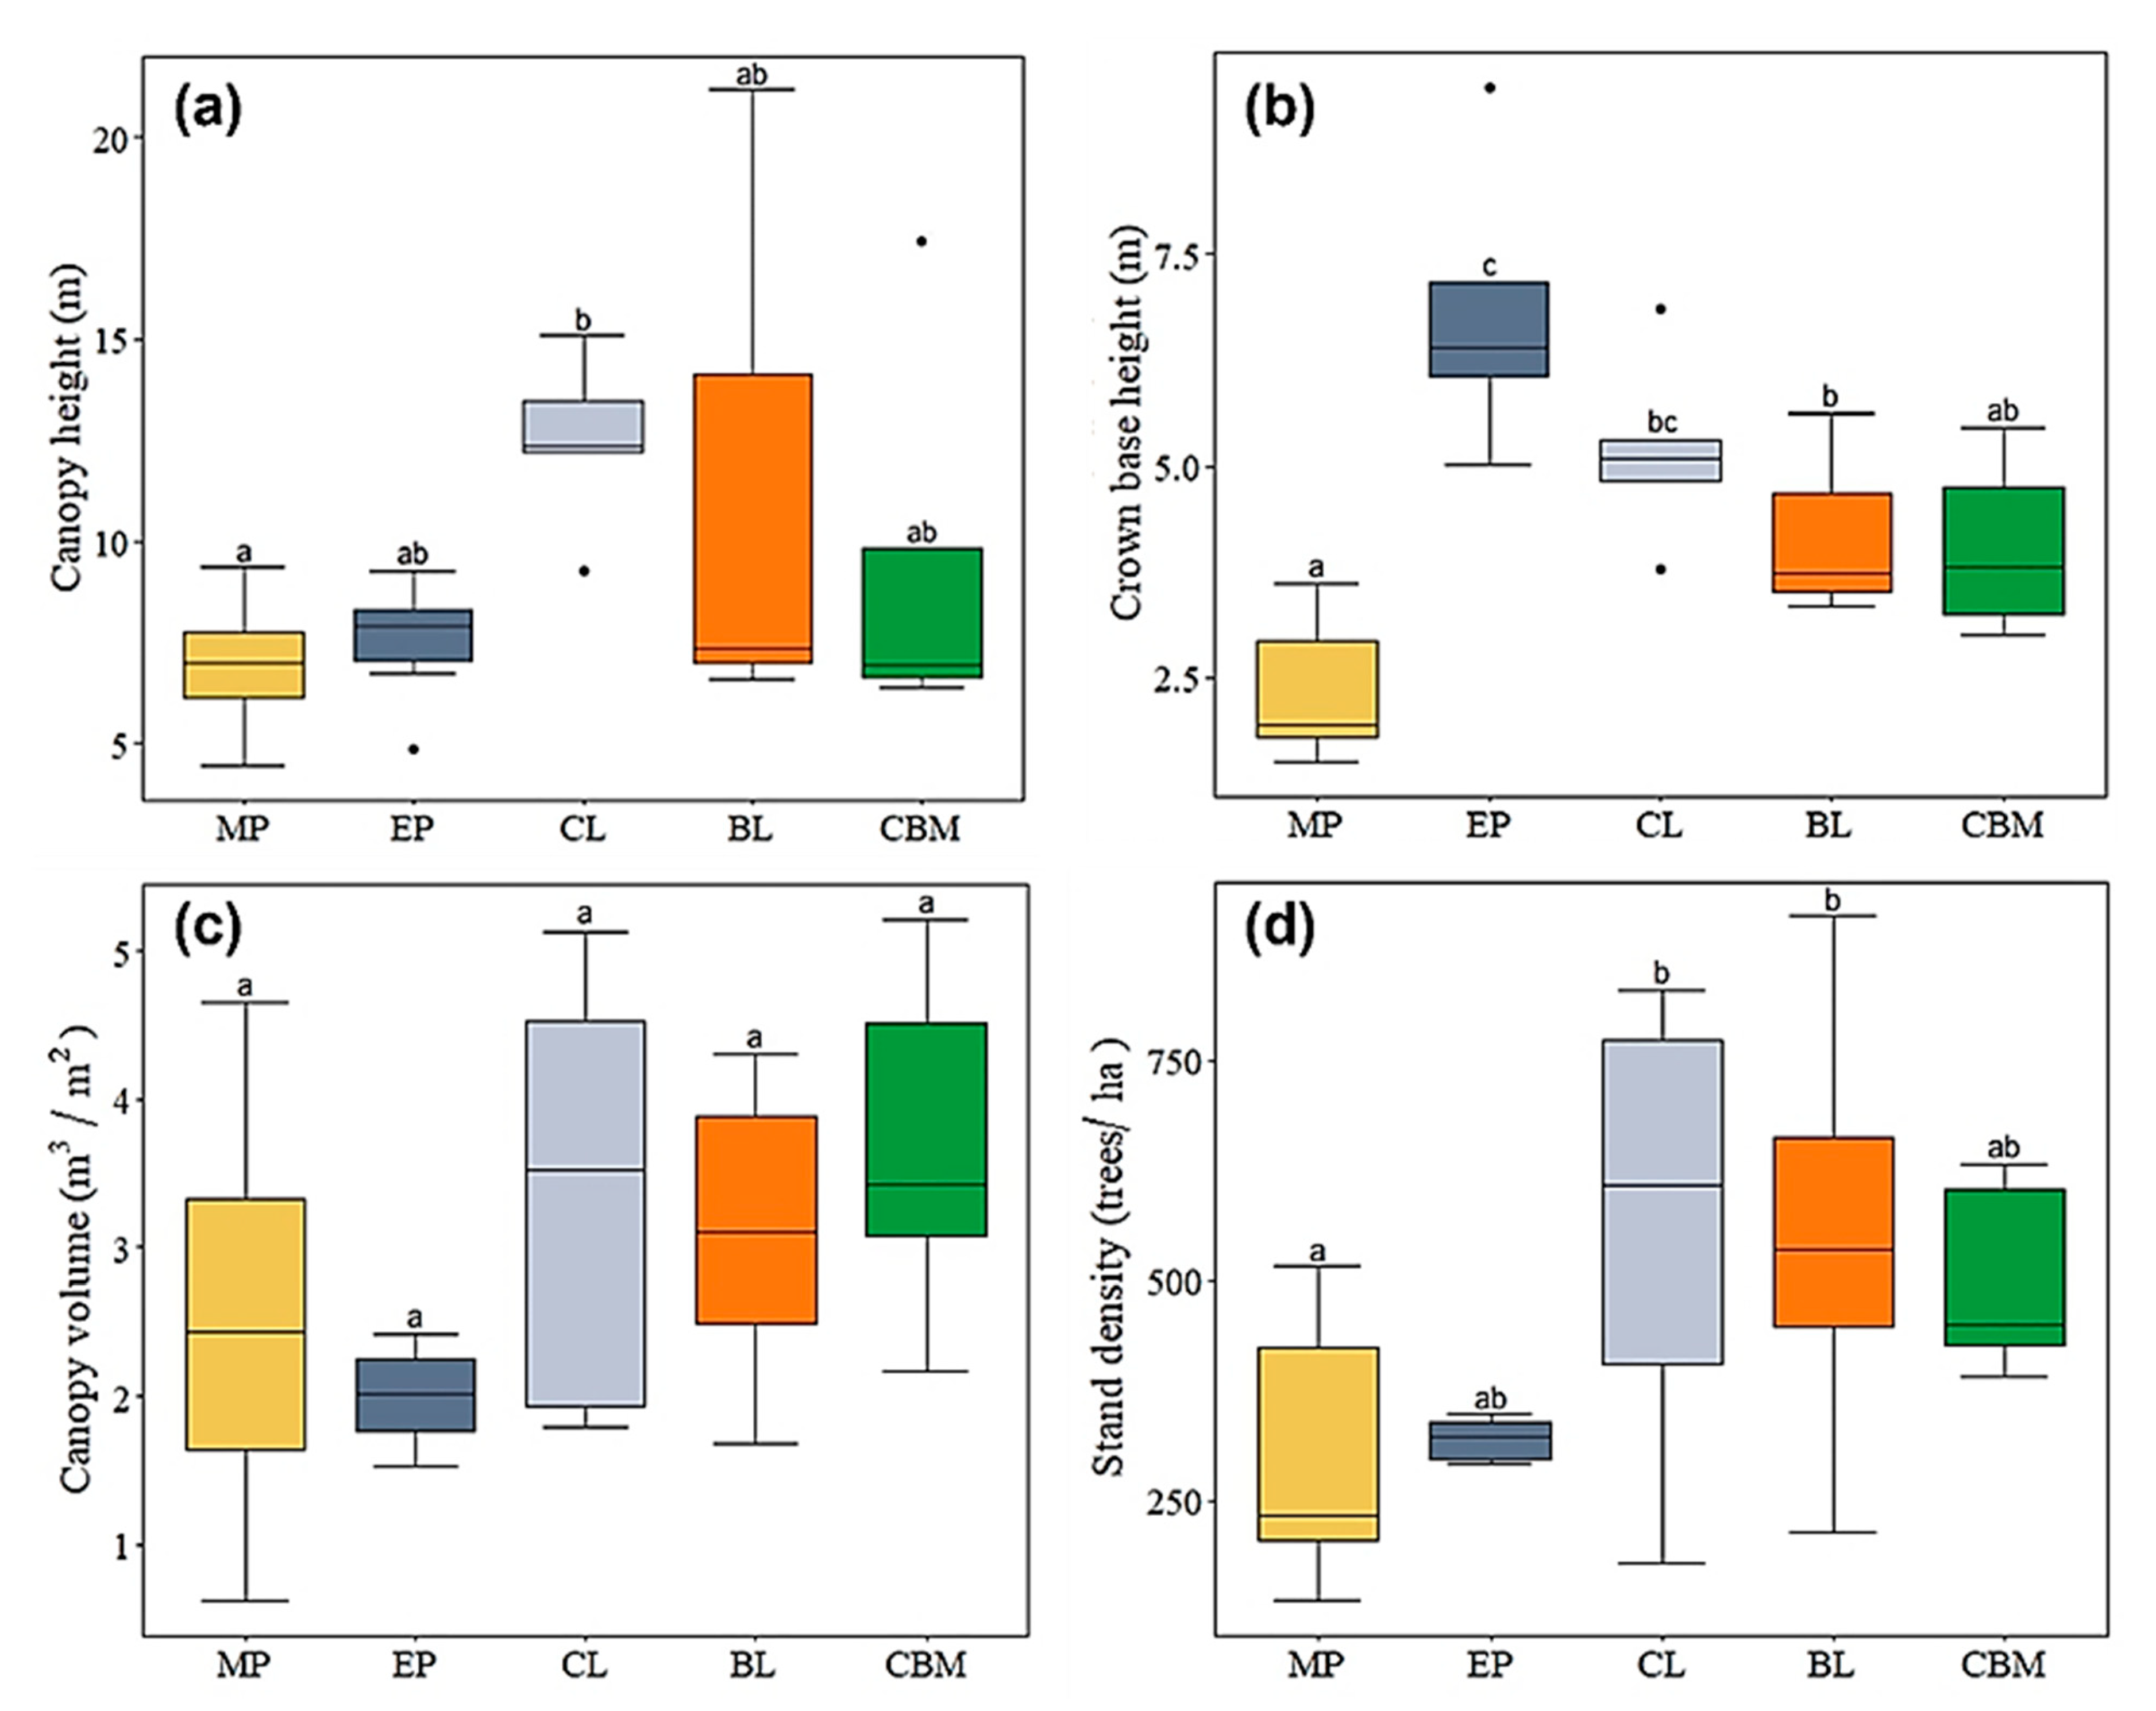
3.1. The Difference in Basic Structural Parameters

Overall, we found that several basic properties of the forest stand types differed. Canopy height, crown base height, and stand density exhibited significant difference between stand types, whereas canopy volume did not show such variation (Table 2). Stands of P. massoniana tended to have a lower crown base height and stand density than most other stand types, while P. elliottii stands tended to have a higher crown base height than most other stand types (Figure 2). The stand of P. massioniana also had a lower canopy height than that of C. lanceolata (Table S2 and Figure 2). The mean number of trees of different stand types in the study area ranges from 290 to about 600 trees per hectare, and the stands of C. lanceolata had the highest stand density, which was about twice that of P. massoniana stands. Although the difference in canopy volume was not significant among stand types, P. elliottii stands had the lowest canopy volume compared with other stand types, accounting for only about half of the conifer-broadleaf mixed forest (Tables S2 and S3, Figure 2).

3.2. The Difference in Fuel Density Distribution in Vertical Profile

The VAI describes how fuel density distribution changes vertically in each stand type (Figure 3). We found that the VAI was quite distinct between P. massoniana, mixed broad-leaved forest, and conifer-broadleaf mixed forest, where fuel densities were mostly concentrated in the lower-height strata (<5 m), compared to P. elliottii and C. lanceolata, where fuels were denser in the middle and upper-height strata (>5 m).
We both used the VAI and vegetation coverage from LiDAR data to characterize the variation in fuel density across different canopy layers. We found that the VAI differed between the stand types in the height range of 1.5–10 m, but not in the height range of 0–1.5 m and greater than 10 m (Table 2). Specifically, P. elliottii and C. lanceolata had the lowest VAI in the lower-height strata, while P. massoniana and conifer-broadleaf mixed forest tended to have a higher VAI (Figure 4b). In the middle-height strata, P. elliottii was lower than several other stand types (Figure 4c). There were no such differences in vegetation coverage among the stand types (Table 2 and Figure 5). The VAI is superior to vegetation coverage in expressing the spatial distribution heterogeneity of fuel density.

4. Discussion

We used BLS LiDAR data to quantify heterogeneity in basic forest structural parameters among stand types. Using standard measurements, such as canopy height and crown base height, we found some differences among stand types. For example, we found that P. massoniana was lower than other stand types in canopy height and CBH, suggesting an increased probability of canopy fires. This is consistent with the observation that P. massoniana is one of the stand types with a higher canopy fire frequency [13,54]. However, these differences were coarse, and it was not entirely clear which properties of the vertical distribution of fuels varied among stand types. When we used the LiDAR-derived VAI and vegetation coverage to quantify the fuel density in each height strata and compared them among the stand types, we found more nuanced, but important, heterogeneity among stands. Although stands did not differ in vegetation coverage, we found that the VAI comparisons showed significant stratified changes in fuel density in the vertical direction among stand types. Specifically, conifer-broadleaf mixed forest and C. lanceolata had a higher VAI in surface strata than other stand types. This was likely related to the accumulation of large amounts of litter under these forests, which can influence the occurrence and spread of surface fires [55]. Likewise, among the forest types, P. massoniana and conifer-broadleaf mixed forests were particularly unique in having a higher VAI in the lower and middle-height strata, which can influence the density and continuity of the ladder fuels [15,56].
Our results suggest that differences in the VAI, but not more commonly used vegetation coverage, can better reveal spatial heterogeneity in the distribution of fuels at fine scales. In fact, the VAI is often used to characterize the vertical structural complexity and heterogeneity within forests [31,57]. Here, we argue that by quantifying the vertical stratification of fuels more explicitly, the VAI provides a more comprehensive analysis and evaluation of fuel properties. Indeed, it has been suggested previously that P. massoniana and conifer-broadleaf mixed forests have a relatively higher potential for canopy fires [58]. Even though we found no differences in the VAI within the upper-height strata, the fuel density in this stratum tends to be more related to other fuel properties, such as moisture content [59]. A high density of fuels in the upper canopy generally means less sunlight and higher surface evaporation and surface moisture content of fine fuels [60,61].
The BLS-derived VAI can allow for a more comprehensive quantification of fuel density distribution among strata, facilitating fuel management solutions for monitoring stand types at higher risk of forest fires. While structural parameters like canopy height and CBH have been widely used to predict canopy fire probability in forest fire prediction models [62,63], these are limited at scale and often provide poor prediction accuracy on potential fire behaviors [15,26]. By using high-resolution voxels (1 cm3) to calculate these basic structural parameters at the stand level, we were able to significantly improve the local-scale measurement accuracy of fuel structures, which can provide important high-resolution information on spatial heterogeneity that can improve fire risk prediction of forest fuels [20,64].
Since forest fuel management is generally conducted during the non-intensive fire prevention period (May to September each year), we implemented field surveys and BLS during the summer. We only selected five representative stand types for analysis in the study area. As a result, our study cannot fully represent the fuel structure characteristics of the entire subtropical forest in this region, nor across the entire year. Nevertheless, our results provide an important “proof of concept” that the parameters derived from BLS can provide a more detailed view into the subtle variation in fuel structures that might infer the potential fire behaviors or fire risk of different forest fuels.

5. Conclusions and Management Implications

This study aims to provide data support for regional-scale forest fuel management and wildfire risk assessment by accurately determining the vertical fuel density of different stand types in Chinese subtropical forests. Our results demonstrate that BLS data can offer a spatially explicit vertical distribution of forest fuel density, aiding in the implementation of stratified forest fuel management measures [65,66]. In Chinese subtropical forests, Chinese fir and mixed coniferous-broadleaved forests exhibit lower CBH and higher fuel density, potentially increasing the likelihood of crown fires. Current fuel management measures for reducing wildfire risk mainly include reducing surface fuel load, interrupting the continuity of ladder fuels, and lowering stand density [67]. The risk of surface fuel layer fires primarily exists in stands with a high fuel load and low moisture content [68]. Due to the higher surface fuel density and lower upper crown density, Chinese fir and mixed coniferous-broadleaved forests may have a higher probability of surface fires, consistent with previous research indicating that these stands possess highly flammable loads [58]. Furthermore, the ladder fuel density in Chinese fir and mixed coniferous-broadleaved forests is also higher, potentially making crown fires more likely [15,69,70]. This study emphasizes the need for pruning excess branches and increasing CBH in fuel management in Chinese subtropical forests to reduce contact with surface fuels [71,72]. To provide more accurate information on forest fuel management structure, we recommend using the vertical vegetation structure index (VAI) extracted from BLS LiDAR data instead of traditional vegetation coverage to more accurately describe the changes in vertical fuel density at the regional scale. Future research on estimating forest fuels and their spatial distribution should combine BLS data with other remote sensing or environmental data, such as multispectral airborne LiDAR data and meteorological data, to formulate more precise forest fuel management strategies [12,73].

Supplementary Materials

The following supporting information can be downloaded at: https://www.mdpi.com/article/10.3390/f15010155/s1, Table S1: Detailed information of each forest plot; Table S2: Multiple comparisons of structural metrics of the five stand types; Table S3: Forest structural parameters of five stand types; Figure S1: Number of wildfires in southern Jiangxi in recent five years (data from National Bureau of Statistics: https://www.stats.gov.cn/). Figure S2: Field photos of each stand type; Figure S3: LiDAR scanning route; Figure S4: A vertical point frequency curve distribution (green line) graph of one plot. Figure S5: Quantile-Quantile plot: examine whether the extracted parameters of each forest stand follow a normal distribution.

Author Contributions

P.K.: literature search, figures, data collection, data analysis, and writing. S.L. (Shitao Lin): data collection, data analysis, and data interpretation. C.H.: figures, study design, data interpretation, and writing. S.L. (Shun Li): literature search, figures, study design, data analysis, data interpretation, and writing. Z.W.: data analysis, data interpretation, and supervision. L.S.: data interpretation, writing, and project administration. All authors have read and agreed to the published version of the manuscript.

Funding

This research was funded by National Key R&D Program “Research on forest and grassland fire early warning and prevention technology and key equipment” (Project No. 2018YFE0207800), National Natural Science Foundation of China “Assessing the effect of wildfire disturbance on canopy interception in forest ecosystem based on Ground-Based LiDAR” (Project No. 32201575), Opening fund of Jiangxi Academy of Water Science and Engineering “Study on improvement and influence mechanism of canopy interception model based on LiDAR technology” (Project No. 2022SKTR07), Opening fund of Key Laboratory of Poyang Lake Wetland and Watershed Research (Jiangxi Normal University), Ministry of Education (Project No. PK.2022002), JIANGXI DOUBLE THOUSAND PLANS (jxsq2020101080), and the Natural Science Foundation of Jiangxi province (20224BAB205008).

Data Availability Statement

The data presented in this study are available on request from the corresponding author. In the interest of transparency and reproducibility, we are committed to sharing our data with interested researchers. To request access to the data, readers can contact the corresponding author and provide a brief description of their intended use. We will review all requests and aim to respond within a reasonable time limit.

Acknowledgments

We are grateful to Qingyun Wu, Lingling Guo, Shihao Zhu, Zhengjie Li, Weifu Peng, Xiulian Wang, and Tiansheng Yuan for their support during field data collection.

Conflicts of Interest

The authors declare no conflicts of interest.

References

  1. Tian, X.; Zhao, F.; Shu, L.; Wang, M. Distribution characteristics and the influence factors of forest fires in China. For. Ecol. Manag. 2013, 310, 460–467. [Google Scholar] [CrossRef]
  2. Ji, L.; Wang, Z.; Wang, X.; An, L. Forest insect pest management and forest management in China: An overview. Environ. Manag. 2011, 48, 1107–1121. [Google Scholar] [CrossRef]
  3. Seidl, R.; Thom, D.; Kautz, M.; Martin-Benito, D.; Peltoniemi, M.; Vacchiano, G.; Wild, J.; Ascoli, D.; Petr, M.; Honkaniemi, J.; et al. Forest disturbances under climate change. Nat. Clim. Chang. 2017, 7, 395–402. [Google Scholar] [CrossRef] [PubMed]
  4. Hood, S.M.; Varner, J.M.; Jain, T.B.; Kane, J.M. A framework for quantifying forest wildfire hazard and fuel treatment effec-tiveness from stands to landscapes. Fire Ecol. 2022, 18, 33. [Google Scholar] [CrossRef]
  5. Bilgili, E. Stand development and fire behavior. For. Ecol. Manag. 2003, 179, 333–339. [Google Scholar] [CrossRef]
  6. Crowley, M.A.; Stockdale, C.A.; Johnston, J.M.; Wulder, M.A.; Liu, T.; McCarty, J.L.; Rieb, J.T.; Cardille, J.A.; White, J.C. To-wards a whole-system framework for wildfire monitoring using Earth observations. Glob. Chang. Biol. 2023, 29, 1423–1436. [Google Scholar] [CrossRef]
  7. Gale, M.G.; Cary, G.J.; van Dijk, A.I.J.M.; Yebra, M. Forest fire fuel through the lens of remote sensing: Review of approaches, challenges and future directions in the remote sensing of biotic determinants of fire behaviour. Remote Sens. Environ. 2021, 255, 112282. [Google Scholar] [CrossRef]
  8. Loudermilk, E.L.; O’Brien, J.J.; Goodrick, S.L.; Linn, R.R.; Skowronski, N.S.; Hiers, J.K. Vegetation’s influence on fire behavior goes beyond just being fuel. Fire Ecol. 2022, 18, 9. [Google Scholar] [CrossRef]
  9. Cruz, M.G.; Alexander, M.E.; Wakimoto, R.H. Modeling the Likelihood of Crown Fire Occurrence in Conifer Forest Stands. For. Sci. 2004, 50, 640–658. [Google Scholar] [CrossRef]
  10. Molina, J.R.; Ortega, M.; Rodríguez y Silva, F. Scorch height and volume modeling in prescribed fires: Effects of canopy gaps in Pinus pinaster stands in Southern Europe. For. Ecol. Manag. 2022, 506, 119979. [Google Scholar] [CrossRef]
  11. Andersen, H.-E.; McGaughey, R.J.; Reutebuch, S.E. Estimating forest canopy fuel parameters using LIDAR data. Remote Sens. Environ. 2005, 94, 441–449. [Google Scholar] [CrossRef]
  12. Hu, T.; Ma, Q.; Su, Y.; Battles, J.J.; Collins, B.M.; Stephens, S.L.; Kelly, M.; Guo, Q. A simple and integrated approach for fire severity assessment using bi-temporal airborne LiDAR data. Int. J. Appl. Earth Obs. Geoinf. 2019, 78, 25–38. [Google Scholar] [CrossRef]
  13. Guo, L.; Li, S.; Wu, Z.; Parsons, R.A.; Lin, S.; Wu, B.; Sun, L. Assessing spatial patterns and drivers of burn severity in subtropical forests in Southern China based on Landsat 8. For. Ecol. Manag. 2022, 524, 120515. [Google Scholar] [CrossRef]
  14. Castagneri, D.; Esposito, A.; Bovio, G.; Mazzoleni, S.; Seneca, U.; Catalanotti, A.E.; Ascoli, D. Fuel vertical structure affects fire sustainability and behaviour of prescribed burning in Spartium junceum shrublands. Ann. For. Sci. 2013, 70, 863–871. [Google Scholar] [CrossRef]
  15. Marino, E.; Montes, F.; Tomé, J.L.; Navarro, J.A.; Hernando, C. Vertical forest structure analysis for wildfire prevention: Comparing airborne laser scanning data and stereoscopic hemispherical images. Int. J. Appl. Earth Obs. Geoinf. 2018, 73, 438–449. [Google Scholar] [CrossRef]
  16. Hudak, A.T.; Kato, A.; Bright, B.C.; Loudermilk, E.L.; Hawley, C.; Restaino, J.C.; Ottmar, R.D.; Prata, G.A.; Cabo, C.; Prichard, S.J.; et al. Towards Spatially Explicit Quantification of Pre- and Postfire Fuels and Fuel Consumption from Traditional and Point Cloud Measurements. For. Sci. 2020, 66, 428–442. [Google Scholar] [CrossRef]
  17. Liu, X.; Ma, Q.; Wu, X.; Hu, T.; Liu, Z.; Liu, L.; Guo, Q.; Su, Y. A novel entropy-based method to quantify forest canopy structural complexity from multiplatform lidar point clouds. Remote Sens. Environ. 2022, 282, 113280. [Google Scholar] [CrossRef]
  18. Hillman, S.; Wallace, L.; Reinke, K.; Hally, B.; Jones, S.; Saldias, D.S. A Method for Validating the Structural Completeness of Understory Vegetation Models Captured with 3D Remote Sensing. Remote Sens. 2019, 11, 2118. [Google Scholar] [CrossRef]
  19. Kükenbrink, D.; Schneider, F.D.; Leiterer, R.; Schaepman, M.E.; Morsdorf, F. Quantification of hidden canopy volume of airborne laser scanning data using a voxel traversal algorithm. Remote Sens. Environ. 2017, 194, 424–436. [Google Scholar] [CrossRef]
  20. Taneja, R.; Hilton, J.; Wallace, L.; Reinke, K.; Jones, S. Effect of fuel spatial resolution on predictive wildfire models. Int. J. Wildland Fire 2021, 30, 776. [Google Scholar] [CrossRef]
  21. Hall, S.A.; Burke, I.C.; Box, D.O.; Kaufmann, M.R.; Stoker, J.M. Estimating stand structure using discrete-return lidar: An example from low density, fire prone ponderosa pine forests. For. Ecol. Manag. 2005, 208, 189–209. [Google Scholar] [CrossRef]
  22. García, M.; Riaño, D.; Chuvieco, E.; Salas, J.; Danson, F.M. Multispectral and LiDAR data fusion for fuel type mapping using Support Vector Machine and decision rules. Remote Sens. Environ. 2011, 115, 1369–1379. [Google Scholar] [CrossRef]
  23. Alonzo, M.; Morton, D.C.; Cook, B.D.; Andersen, H.-E.; Babcock, C.; Pattison, R. Patterns of canopy and surface layer con-sumption in a boreal forest fire from repeat airborne lidar. Environ. Res. Lett. 2017, 12, 65004. [Google Scholar] [CrossRef]
  24. Jubanski, J.; Ballhorn, U.; Kronseder, K.; Siegert, F. Detection of large above-ground biomass variability in lowland forest ecosystems by airborne LiDAR. Biogeosciences 2013, 10, 3917–3930. [Google Scholar] [CrossRef]
  25. Greaves, H.E.; Vierling, L.A.; Eitel, J.U.H.; Boelman, N.T.; Magney, T.S.; Prager, C.M.; Griffin, K.L. High-resolution mapping of aboveground shrub biomass in Arctic tundra using airborne lidar and imagery. Remote Sens. Environ. 2016, 184, 361–373. [Google Scholar] [CrossRef]
  26. Campbell, M.J.; Dennison, P.E.; Hudak, A.T.; Parham, L.M.; Butler, B.W. Quantifying understory vegetation density using small-footprint airborne lidar. Remote Sens. Environ. 2018, 215, 330–342. [Google Scholar] [CrossRef]
  27. Hillman, S.; Wallace, L.; Reinke, K.; Jones, S. A comparison between TLS and UAS LiDAR to represent eucalypt crown fuel characteristics. ISPRS J. Photogramm. Remote Sens. 2021, 181, 295–307. [Google Scholar] [CrossRef]
  28. Béland, M.; Widlowski, J.-L.; Fournier, R.A.; Côté, J.-F.; Verstraete, M.M. Estimating leaf area distribution in savanna trees from terrestrial LiDAR measurements. Agric. For. Meteorol. 2011, 151, 1252–1266. [Google Scholar] [CrossRef]
  29. Atkins, J.W.; Bohrer, G.; Fahey, R.T.; Hardiman, B.S.; Morin, T.H.; Stovall, A.E.L.; Zimmerman, N.; Gough, C.M. Quantifying vegetation and canopy structural complexity from terrestrial LiDAR data using the forestr R package. Methods Ecol. Evol. 2018, 9, 2057–2066. [Google Scholar] [CrossRef]
  30. Reed, S.P.; Royo, A.A.; Fotis, A.T.; Knight, K.S.; Flower, C.E.; Curtis, P.S. The long-term impacts of deer herbivory in deter-mining temperate forest stand and canopy structural complexity. J. Appl. Ecol. 2022, 59, 812–821. [Google Scholar] [CrossRef]
  31. Decuyper, M.; Mulatu, K.A.; Brede, B.; Calders, K.; Armston, J.; Rozendaal, D.M.A.; Mora, B.; Clevers, J.G.P.W.; Kooistra, L.; Herold, M.; et al. Assessing the structural differences between tropical forest types using Terrestrial Laser Scanning. For. Ecol. Manag. 2018, 429, 327–335. [Google Scholar] [CrossRef]
  32. Li, S.; Hou, Z.; Ge, J.; Wang, T. Assessing the effects of large herbivores on the three-dimensional structure of temperate forests using terrestrial laser scanning. For. Ecol. Manag. 2022, 507, 119985. [Google Scholar] [CrossRef]
  33. Fang, K.; Yao, Q.; Guo, Z.; Zheng, B.; Du, J.; Qi, F.; Yan, P.; Li, J.; Ou, T.; Liu, J.; et al. ENSO modulates wildfire activity in China. Nat. Commun. 2021, 12, 1764. [Google Scholar] [CrossRef] [PubMed]
  34. Senande-Rivera, M.; Insua-Costa, D.; Miguez-Macho, G. Spatial and temporal expansion of global wildland fire activity in response to climate change. Nat. Commun. 2022, 13, 1208. [Google Scholar] [CrossRef] [PubMed]
  35. Cao, L.; Coops, N.C.; Innes, J.L.; Sheppard, S.R.J.; Fu, L.; Ruan, H.; She, G. Estimation of forest biomass dynamics in subtropical forests using multi-temporal airborne LiDAR data. Remote Sens. Environ. 2016, 178, 158–171. [Google Scholar] [CrossRef]
  36. Wu, Z.; He, H.S.; Keane, R.E.; Zhu, Z.; Wang, Y.; Shan, Y. Current and future patterns of forest fire occurrence in China. Int. J. Wildland Fire 2020, 29, 104. [Google Scholar] [CrossRef]
  37. Cai, S.; Xing, Y.; Duanmu, J. Extraction of DBH from filtering out low intensity point cloud by Backpack Laser Scanning. For. Eng. 2021, 37, 12–19. [Google Scholar] [CrossRef]
  38. Wilson, N.; Bradstock, R.; Bedward, M. Detecting the effects of logging and wildfire on forest fuel structure using terrestrial laser scanning (TLS). For. Ecol. Manag. 2021, 488, 119037. [Google Scholar] [CrossRef]
  39. Andreu, A.G.; Blake, J.I.; Zarnoch, S.J. Estimating canopy fuel characteristics for predicting crown fire potential in common forest types of the Atlantic Coastal Plain, USA. Int. J. Wildland Fire 2018, 27, 742. [Google Scholar] [CrossRef]
  40. Nakai, T.; Sumida, A.; Kodama, Y.; Hara, T.; Ohta, T. A comparison between various definitions of forest stand height and aerodynamic canopy height. Agric. For. Meteorol. 2010, 150, 1225–1233. [Google Scholar] [CrossRef]
  41. Huang, H.; Li, Z.; Gong, P.; Cheng, X.; Clinton, N.; Cao, C.; Ni, W.; Wang, L. Automated Methods for Measuring DBH and Tree Heights with a Commercial Scanning Lidar. Photogramm. Eng. Remote. Sens. 2011, 77, 219–227. [Google Scholar] [CrossRef]
  42. Stefanidou, A.; Gitas, I.; Korhonen, L.; Stavrakoudis, D.; Georgopoulos, N. LiDAR-Based Estimates of Canopy Base Height for a Dense Uneven-Aged Structured Forest. Remote Sens. 2020, 12, 1565. [Google Scholar] [CrossRef]
  43. Popescu, S.C.; Zhao, K. A voxel-based lidar method for estimating crown base height for deciduous and pine trees. Remote Sens. Environ. 2008, 112, 767–781. [Google Scholar] [CrossRef]
  44. Viedma, O.; Almeida, D.R.A.; Moreno, J.M. Postfire Tree Structure from High-Resolution LiDAR and RBR Sentinel 2A Fire Severity Metrics in a Pinus halepensis-Dominated Burned Stand. Remote Sens. 2020, 12, 3554. [Google Scholar] [CrossRef]
  45. Fernández-Guisuraga, J.M.; Suárez-Seoane, S.; García-Llamas, P.; Calvo, L. Vegetation structure parameters determine high burn severity likelihood in different ecosystem types: A case study in a burned Mediterranean landscape. J. Environ. Manag. 2021, 288, 112462. [Google Scholar] [CrossRef] [PubMed]
  46. Kato, A.; Moskal, L.M.; Schiess, P.; Swanson, M.E.; Calhoun, D.; Stuetzle, W. Capturing tree crown formation through implicit surface reconstruction using airborne lidar data. Remote Sens. Environ. 2009, 113, 1148–1162. [Google Scholar] [CrossRef]
  47. Riaño, D. Modeling airborne laser scanning data for the spatial generation of critical forest parameters in fire behavior modeling. Remote Sens. Environ. 2003, 86, 177–186. [Google Scholar] [CrossRef]
  48. Botequim, B.; Fernandes, P.M.; Borges, J.G.; González-Ferreiro, E.; Guerra-Hernández, J. Improving silvicultural practices for Mediterranean forests through fire behaviour modelling using LiDAR-derived canopy fuel characteristics. Int. J. Wildland Fire 2019, 28, 823. [Google Scholar] [CrossRef]
  49. Lu, X.; Guo, Q.; Li, W.; Flanagan, J. A bottom-up approach to segment individual deciduous trees using leaf-off lidar point cloud data. ISPRS J. Photogramm. Remote Sens. 2014, 94, 1–12. [Google Scholar] [CrossRef]
  50. Niedermaier, K.M.; Atkins, J.W.; Grigri, M.S.; Bond-Lamberty, B.; Gough, C.M. Structural complexity and primary production resistance are coupled in a temperate forest. Front. For. Glob. Change 2022, 5, 941851. [Google Scholar] [CrossRef]
  51. Palaiologou, P.; Kalabokidis, K.; Kyriakidis, P. Forest mapping by geoinformatics for landscape fire behaviour modelling in coastal forests, Greece. Int. J. Remote Sens. 2013, 34, 4466–4490. [Google Scholar] [CrossRef]
  52. Scholten, T.; Goebes, P.; Kühn, P.; Seitz, S.; Assmann, T.; Bauhus, J.; Bruelheide, H.; Buscot, F.; Erfmeier, A.; Fischer, M.; et al. On the combined effect of soil fertility and topography on tree growth in subtropical forest ecosystems—A study from SE China. J. Plant Ecol. 2017, 10, 111–127. [Google Scholar] [CrossRef]
  53. Bates, D.; Mächler, M.; Bolker, B.; Walker, S. Fitting Linear Mixed-Effects Models Using lme4. J. Stat. Soft. 2015, 67. [Google Scholar] [CrossRef]
  54. Su, Z.; Tigabu, M.; Cao, Q.; Wang, G.; Hu, H.; Guo, F. Comparative analysis of spatial variation in forest fire drivers between boreal and subtropical ecosystems in China. For. Ecol. Manag. 2019, 454, 117669. [Google Scholar] [CrossRef]
  55. Varner, J.M.; Kane, J.M.; Kreye, J.K.; Engber, E. The Flammability of Forest and Woodland Litter: A Synthesis. Curr For. Rep 2015, 1, 91–99. [Google Scholar] [CrossRef]
  56. Harrod, R.J.; Peterson, D.W.; Povak, N.A.; Dodson, E.K. Thinning and prescribed fire effects on overstory tree and snag structure in dry coniferous forests of the interior Pacific Northwest. For. Ecol. Manag. 2009, 258, 712–721. [Google Scholar] [CrossRef]
  57. Ehbrecht, M.; Schall, P.; Ammer, C.; Seidel, D. Quantifying stand structural complexity and its relationship with forest management, tree species diversity and microclimate. Agric. For. Meteorol. 2017, 242, 1–9. [Google Scholar] [CrossRef]
  58. Pan, D. Distribution of Fuel and Potential Fire Behavior of Typical Plantations in Southern China; Central South University of Forestry and Technology: Changsha, China, 2017. [Google Scholar]
  59. Li, L.; Mu, X.; Qi, J.; Pisek, J.; Roosjen, P.; Yan, G.; Huang, H.; Liu, S.; Baret, F. Characterizing reflectance anisotropy of back-ground soil in open-canopy plantations using UAV-based multiangular images. ISPRS J. Photogramm. Remote Sens. 2021, 177, 263–278. [Google Scholar] [CrossRef]
  60. Flannigan, M.D.; Wotton, B.M.; Marshall, G.A.; de Groot, W.J.; Johnston, J.; Jurko, N.; Cantin, A.S. Fuel moisture sensitivity to temperature and precipitation: Climate change implications. Clim. Change 2016, 134, 59–71. [Google Scholar] [CrossRef]
  61. Peng, B.; Zhang, J.; Xing, J.; Liu, J. Distribution prediction of moisture content of dead fuel on the forest floor of Maoershan national forest, China using a LoRa wireless network. J. For. Res. 2022, 33, 899–909. [Google Scholar] [CrossRef]
  62. García, M.; Danson, F.M.; Riaño, D.; Chuvieco, E.; Ramirez, F.A.; Bandugula, V. Terrestrial laser scanning to estimate plot-level forest canopy fuel properties. Int. J. Appl. Earth Obs. Geoinf. 2011, 13, 636–645. [Google Scholar] [CrossRef]
  63. Farhadur Rahman, M.; Onoda, Y.; Kitajima, K. Forest canopy height variation in relation to topography and forest types in central Japan with LiDAR. For. Ecol. Manag. 2022, 503, 119792. [Google Scholar] [CrossRef]
  64. Atchley, A.L.; Linn, R.; Jonko, A.; Hoffman, C.; Hyman, J.D.; Pimont, F.; Sieg, C.; Middleton, R.S. Effects of fuel spatial dis-tribution on wildland fire behaviour. Int. J. Wildland Fire 2021, 30, 179. [Google Scholar] [CrossRef]
  65. Latifi, H.; Fassnacht, F.E.; Hartig, F.; Berger, C.; Hernández, J.; Corvalán, P.; Koch, B. Stratified aboveground forest biomass estimation by remote sensing data. Int. J. Appl. Earth Obs. Geoinf. 2015, 38, 229–241. [Google Scholar] [CrossRef]
  66. Price, O.F.; Gordon, C.E. The potential for LiDAR technology to map fire fuel hazard over large areas of Australian forest. J. Environ. Manag. 2016, 181, 663–673. [Google Scholar] [CrossRef]
  67. Agee, J.K.; Skinner, C.N. Basic principles of forest fuel reduction treatments. For. Ecol. Manag. 2005, 211, 83–96. [Google Scholar] [CrossRef]
  68. Cowman, D.; Russell, W. Fuel load, stand structure, and understory species composition following prescribed fire in an old-growth coast redwood (Sequoia sempervirens) forest. Fire Ecol. 2021, 17, 17. [Google Scholar] [CrossRef]
  69. Mitsopoulos, I.D.; Dimitrakopoulos, A.P. Canopy fuel characteristics and potential crown fire behavior in Aleppo pine (Pinus halepensis Mill.) forests. Ann. For. Sci. 2007, 64, 287–299. [Google Scholar] [CrossRef]
  70. Qi, Y.; Coops, N.C.; Daniels, L.D.; Butson, C.R. Assessing the effects of burn severity on post-fire tree structures using the fused drone and mobile laser scanning point clouds. Front. Environ. Sci. 2022, 10, 949442. [Google Scholar] [CrossRef]
  71. Ottmar, R.D.; Prichard, S.J. Fuel treatment effectiveness in forests of the upper Atlantic Coastal Plain—An evaluation at two spatial scales. For. Ecol. Manag. 2012, 273, 17–28. [Google Scholar] [CrossRef]
  72. Hartsough, B.R.; Abrams, S.; Barbour, R.J.; Drews, E.S.; McIver, J.D.; Moghaddas, J.J.; Schwilk, D.W.; Stephens, S.L. The eco-nomics of alternative fuel reduction treatments in western United States dry forests: Financial and policy implications from the National Fire and Fire Surrogate Study. For. Policy Econ. 2008, 10, 344–354. [Google Scholar] [CrossRef]
  73. Chuvieco, E.; Aguado, I.; Salas, J.; García, M.; Yebra, M.; Oliva, P. Satellite Remote Sensing Contributions to Wildland Fire Science and Management. Curr. For. Rep. 2020, 6, 81–96. [Google Scholar] [CrossRef]
Figure 1. Location of sample plots (BL represents locations of plots of mixed broad-leaved forest; MP represents P. massoniana forests; EP represents locations of P. elliottii forest plots; CL represents locations of C. lanceolata forest; and CBM represents locations of conifer-broadleaf mixed forest).
Forests 15 00155 g001
Figure 2. Structural metrics among the five stand types: (a) canopy height, (b) crown base height, (c) canopy volume, and (d) stand density. Error bars are the level of dispersions among the data for each vegetation structural metric of five stand types. Different letters above boxes represent significant difference (p < 0.05); MP stands for P. massoniana forest, EP stands for P. elliottii forest, CL stands for C. lanceolata forest, BL stands for of mixed broad-leaved forest, and CBM stands for conifer-broadleaf mixed forest.
Forests 15 00155 g002
Figure 3. VAI distribution between each stand type. The solid line is the expected value of VAI at each height, and the shaded area is the interval estimation of VAI values (±SE, n = 30 plots).
Forests 15 00155 g003
Figure 4. Total VAI values among the five stand types: (a) surface strata, (b) lower-height strata, (c) middle-height strata, and (d) upper-height strata. Error bars are the level of dispersions among the VAI for each vegetation strata of five stand types. Different letters above boxes indicate significant differences among stand types (p < 0.05); MP stands for P. massoniana forest, EP stands for P. elliottii forest, CL stands for C. lanceolata forest, BL stands for of mixed broad-leaved forest, and CBM stands for conifer-broadleaf mixed forest.
Forests 15 00155 g004
Figure 5. Vegetation coverage among the five stand types: (a) surface strata, (b) lower-height strata, (c) middle-height strata, and (d) upper-height strata. Error bars are the level of dispersions among the vegetation coverage for each vegetation strata of five stand types. Different letters above boxes indicate significant differences among stand types (p < 0.05); MP stands for P. massoniana forest, EP stands for P. elliottii forest, CL stands for C. lanceolata forest, BL stands for of mixed broad-leaved forest, and CBM stands for conifer-broadleaf mixed forest.
Forests 15 00155 g005
Table 1. Technical parameters of the scanning system.
Parameter TypeParameters
Scanning distance/m100
Vertical scan angle range/(°)−90~90
Horizontal scan angle range/(°)0~360
LiDAR precision/cm±3
Scanning frequency/pts/s600,000
Point density/pts/m230,000
Laser wavelength/nm903
Table 2. Kruskal–Wallis significance values for uniqueness of fuel characteristics between fuel types.
ParametersSignificance of Difference
Canopy height0.013 *
Crown base height<0.001 ***
Canopy volume0.13
Stand density0.018 *
VAI (0–1.5 m)0.598
VAI (1.5–5 m)<0.001 ***
VAI (5–10 m)0.0037 **
VAI (>10 m)0.166
Vegetation coverage (0–1.5 m)0.236
Vegetation coverage (1.5–5 m)0.482
Vegetation coverage (5–10 m)0.087
Vegetation coverage (>10 m)0.0989
Note: *** p < 0.001, ** p < 0.01, * p < 0.05.
Disclaimer/Publisher’s Note: The statements, opinions and data contained in all publications are solely those of the individual author(s) and contributor(s) and not of MDPI and/or the editor(s). MDPI and/or the editor(s) disclaim responsibility for any injury to people or property resulting from any ideas, methods, instructions or products referred to in the content.

