
A Novel Method of Boreal Zone Reforestation/Afforestation Estimation Using PALSAR-1,2 and Landsat-5,8 Data


Abstract
1. Introduction
2. Related Works
“JJ-FAST is a web-based system using JAXA’s ALOS-2 to monitor tropical forests in 78 countries every 1.5 months and release deforestation data, even in the rainy season. Users can easily access the data for deforested areas from PCs and mobile devices and download the data”.
- -
- -
- -
- Combined optical and microwave data use methods for a comprehensive analysis of forest parameters [16].
3. Study Area and Materials
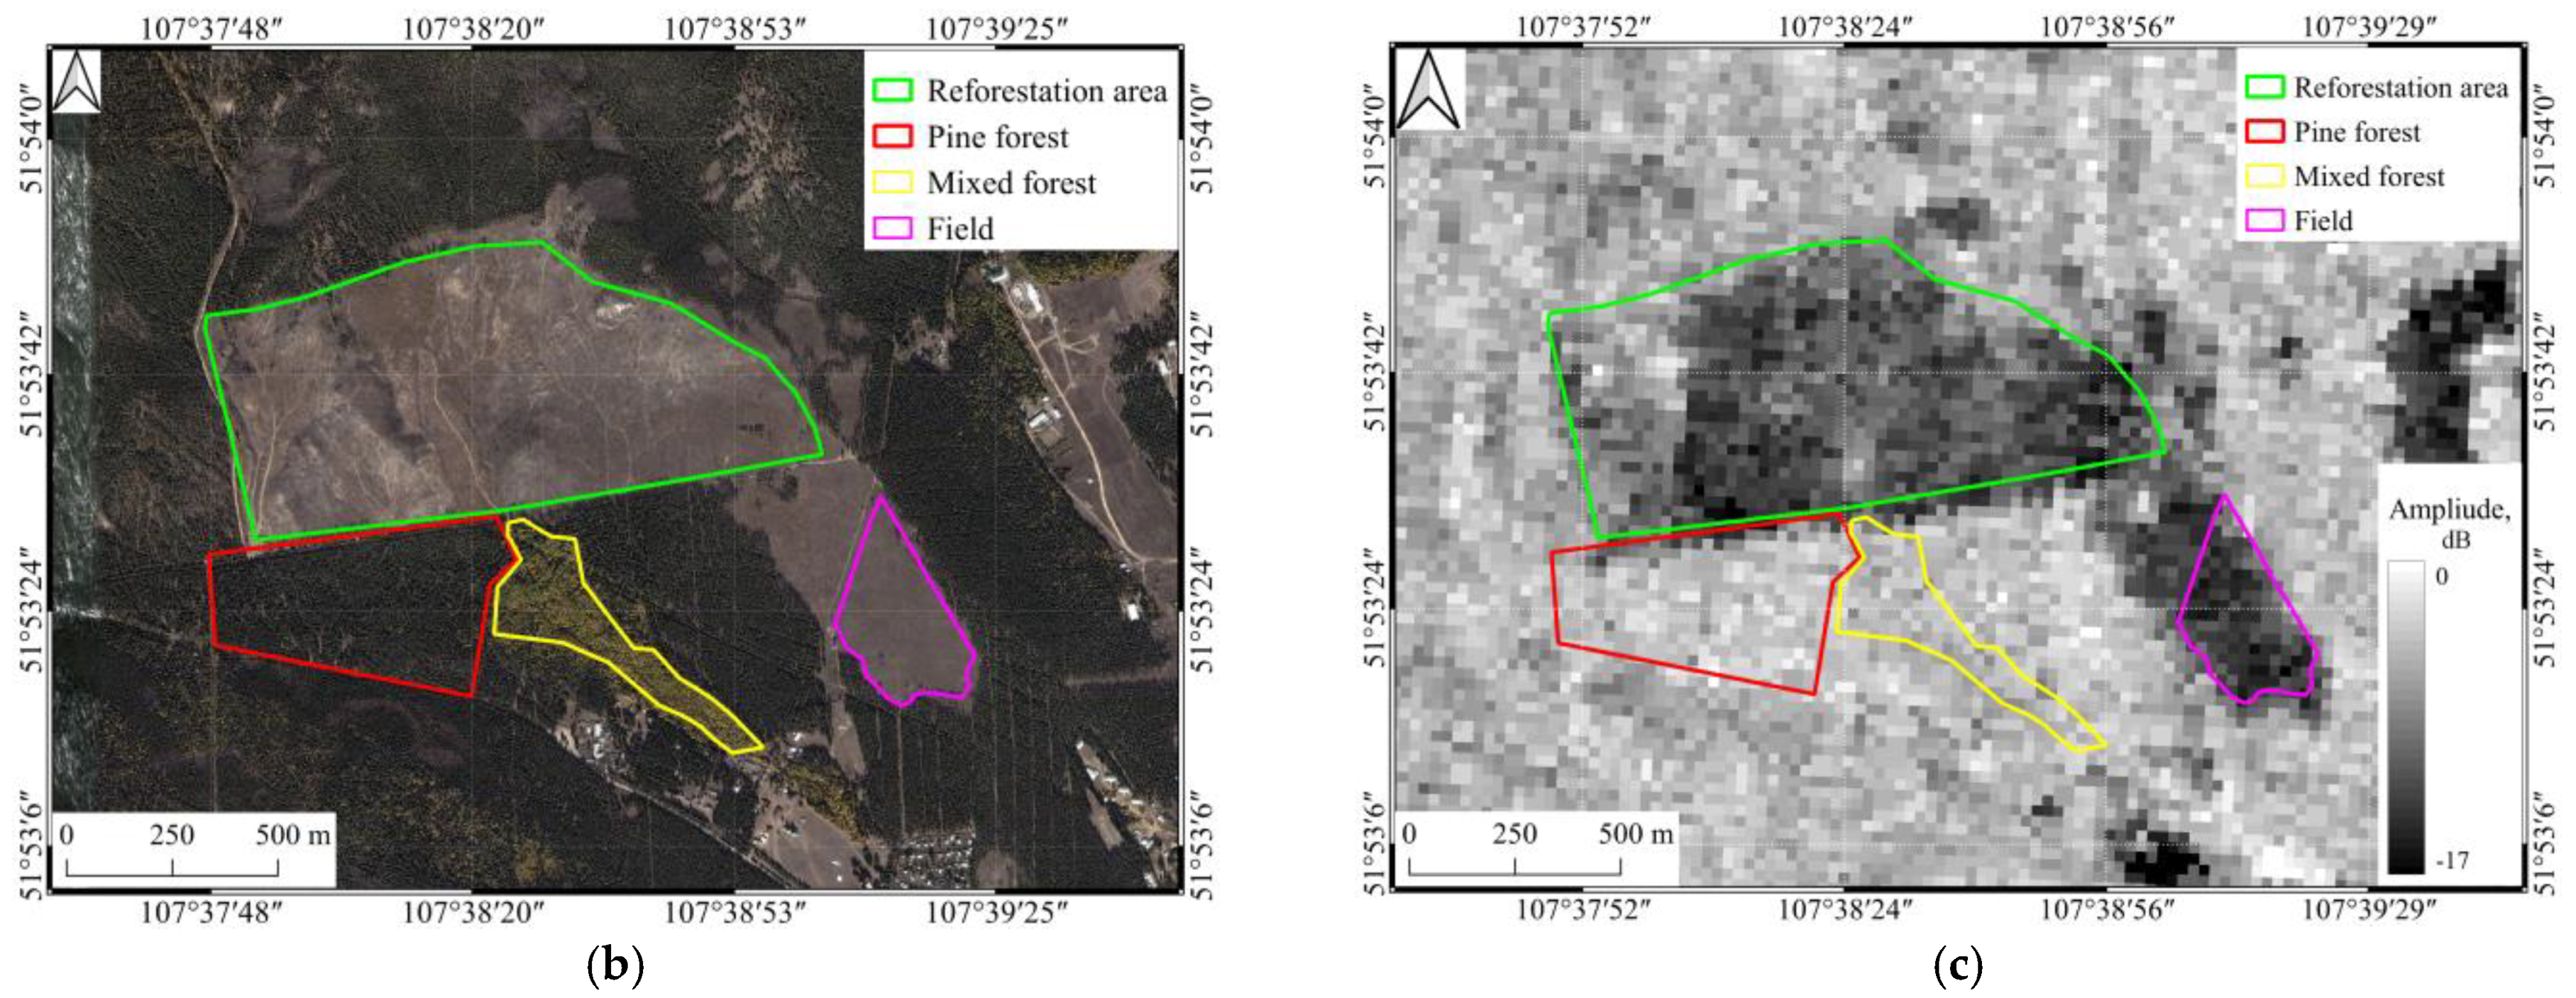
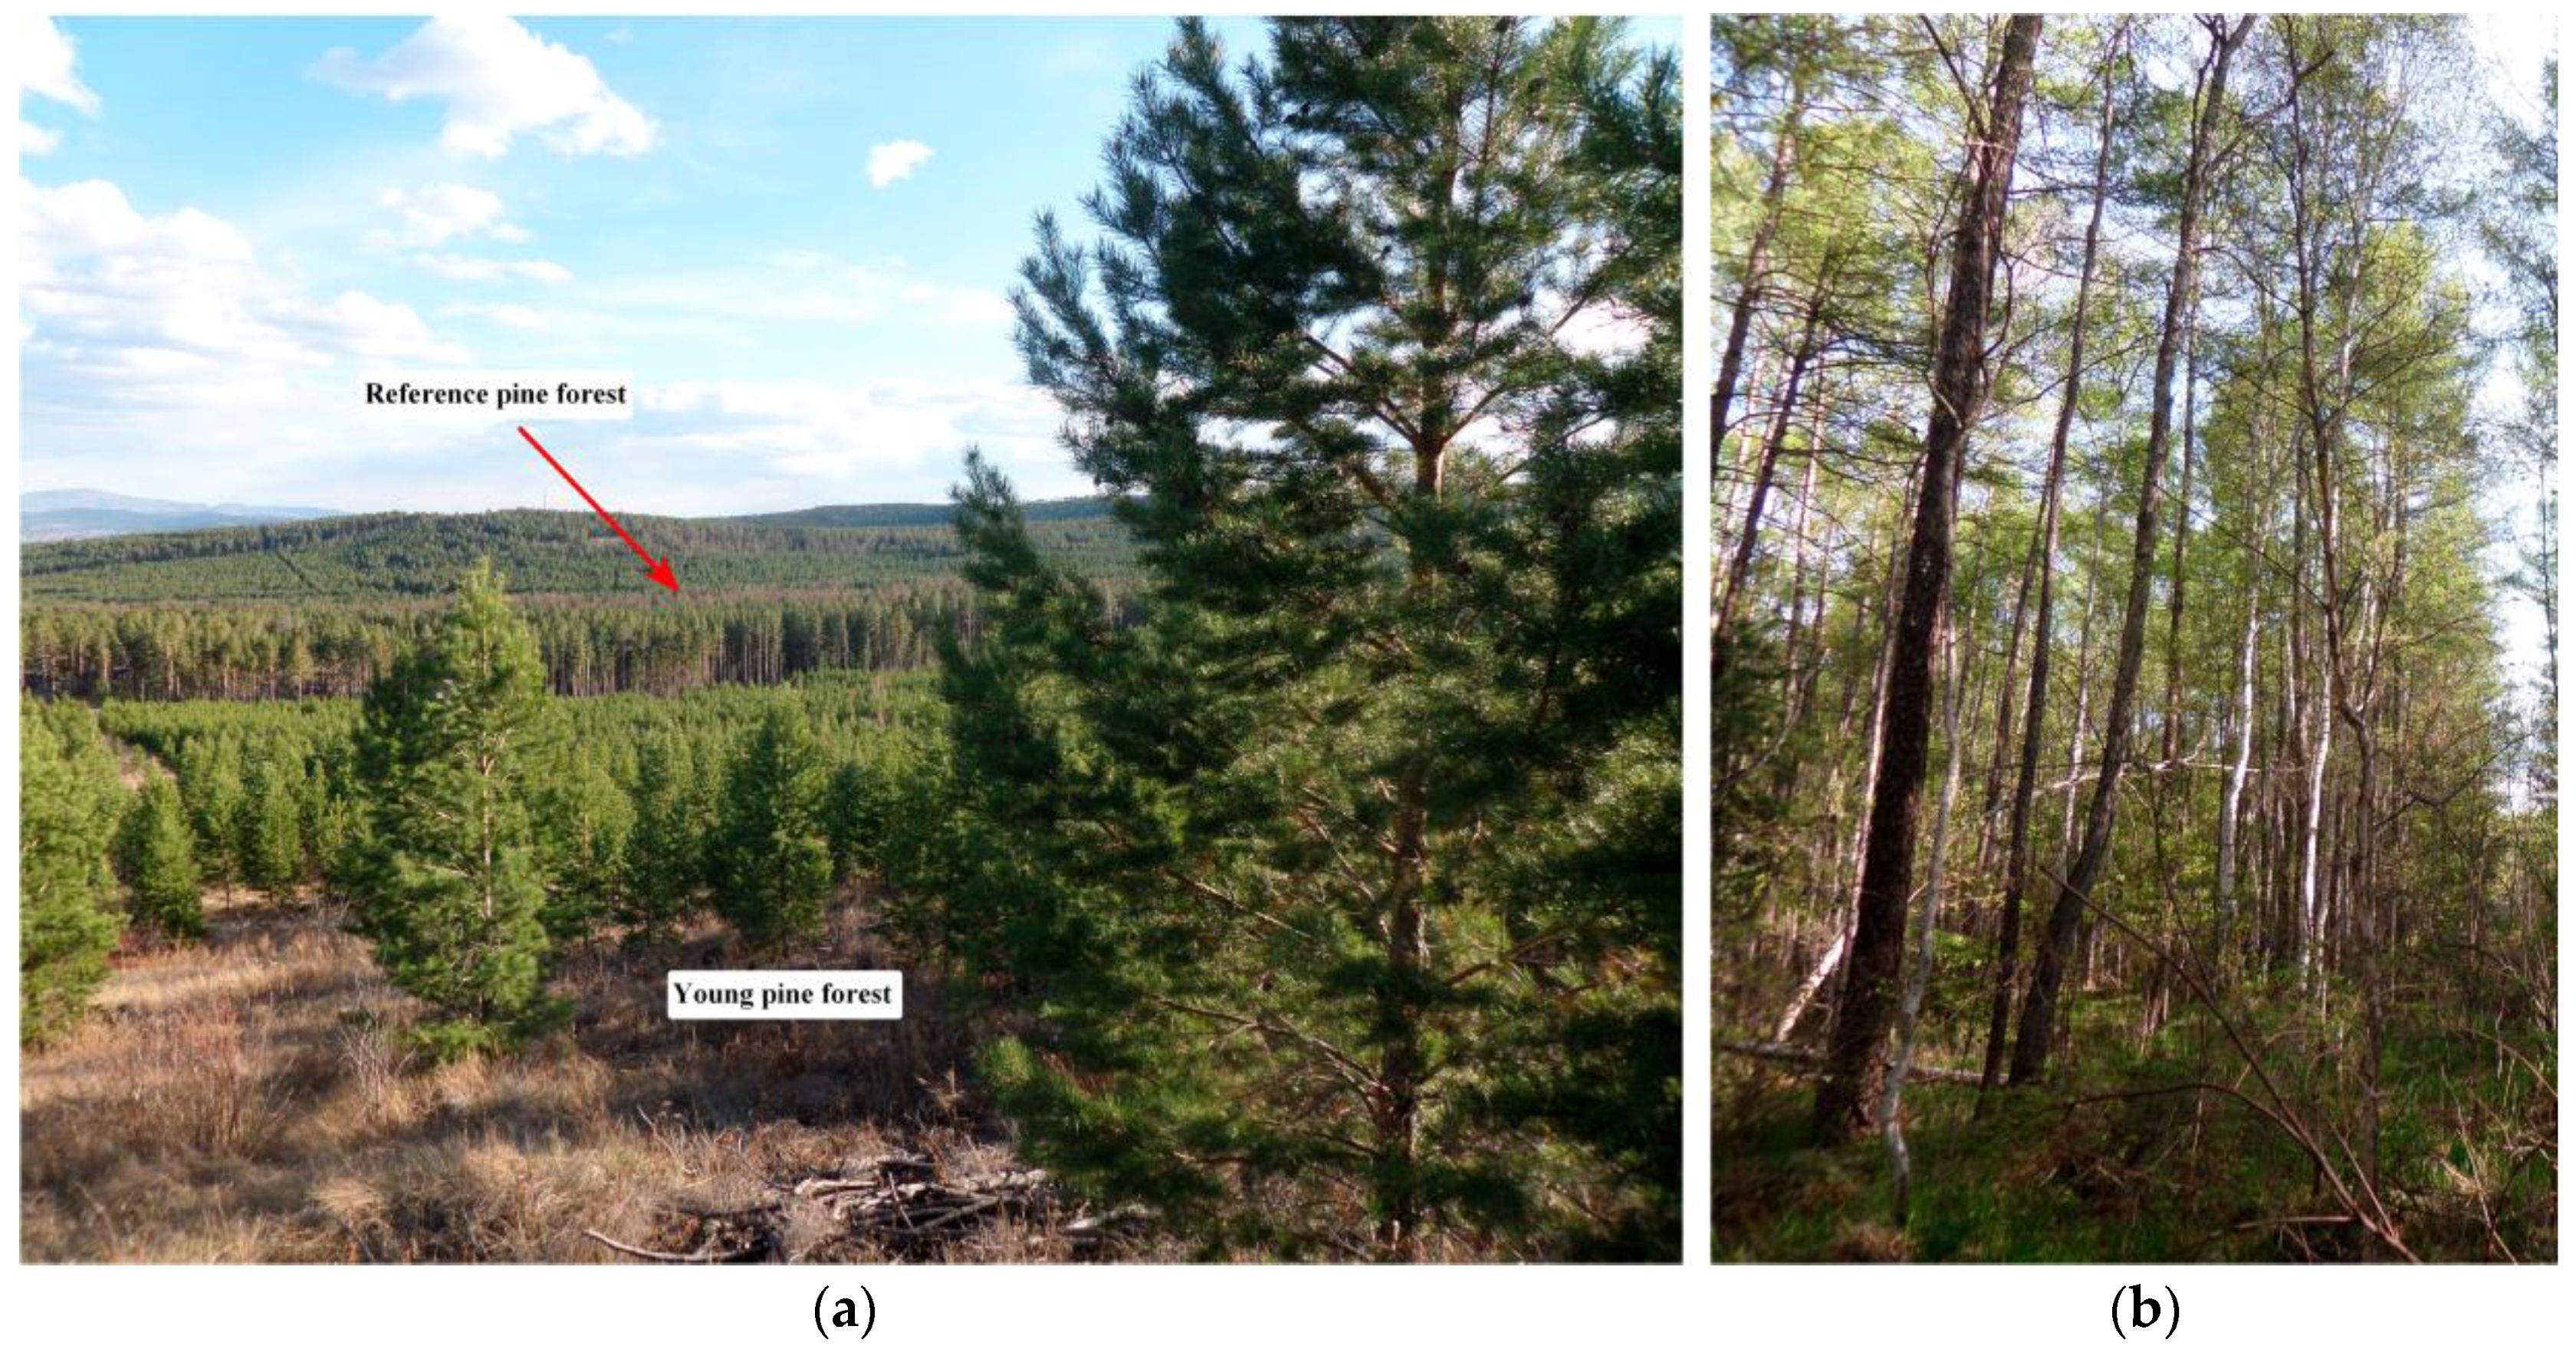
3.1. Study Area
3.2. Materials
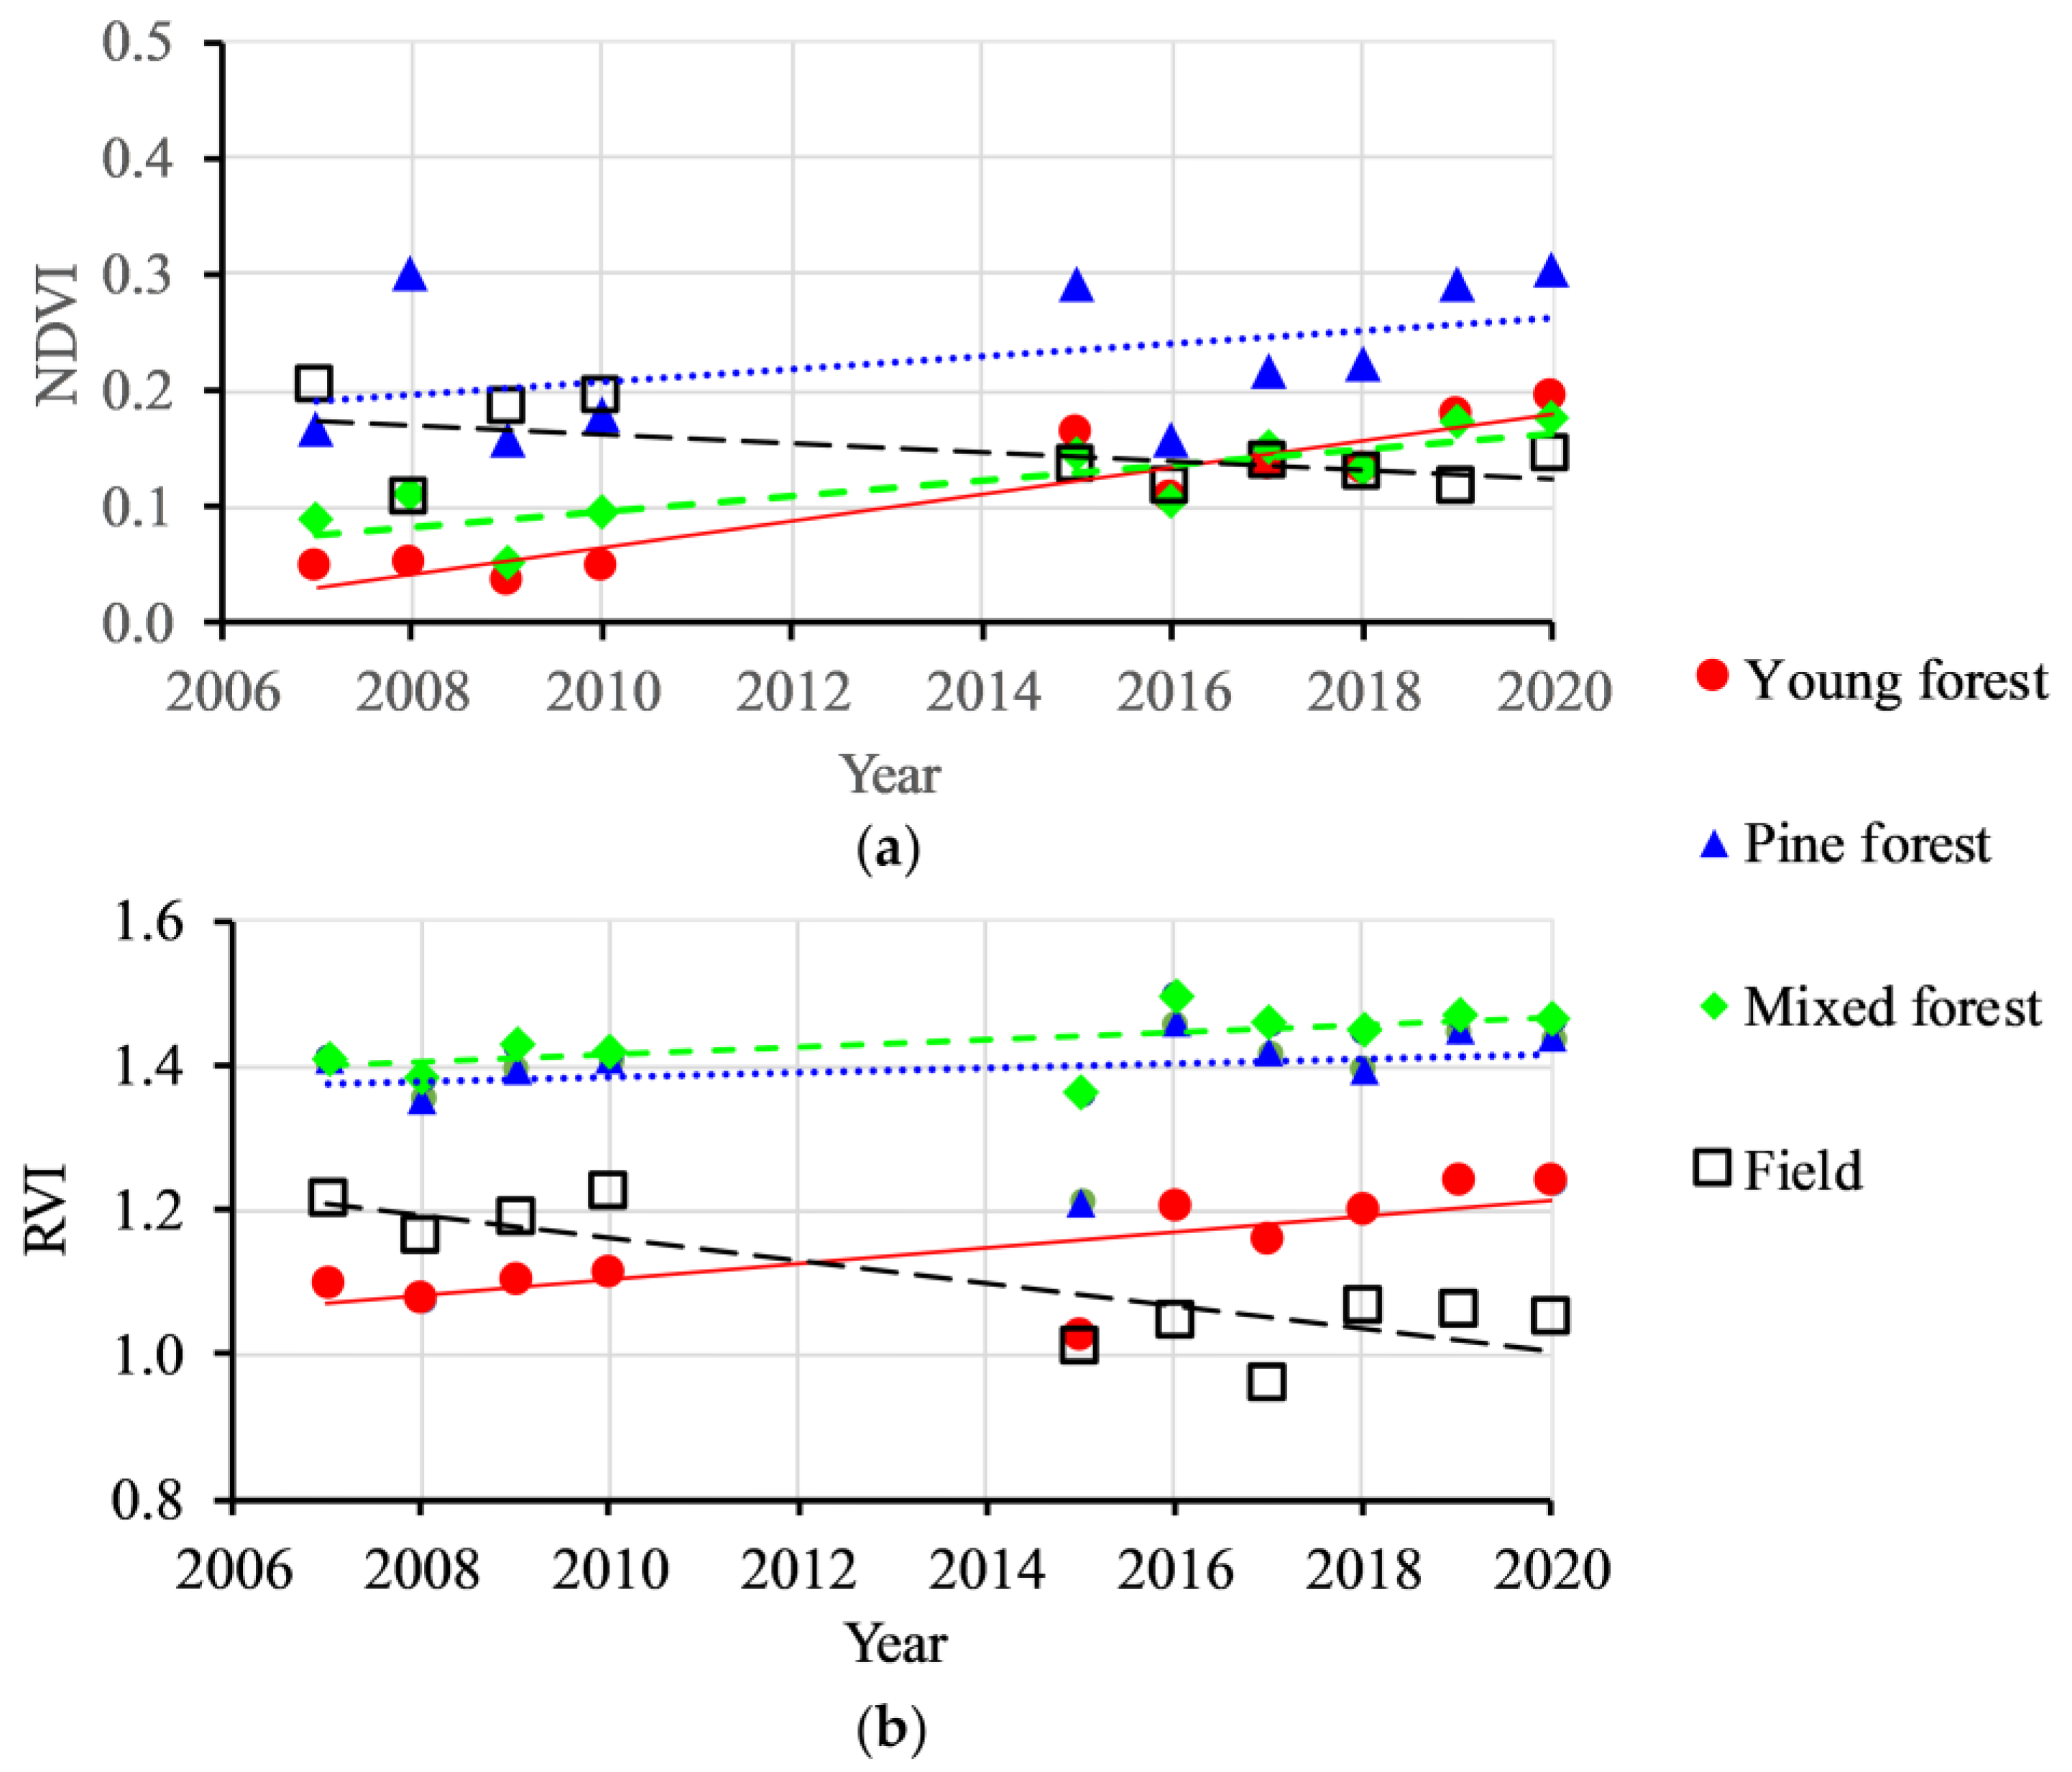
3.2.1. Landsat Data
3.2.2. ALOS-1,2 PALSAR-1,2 Data
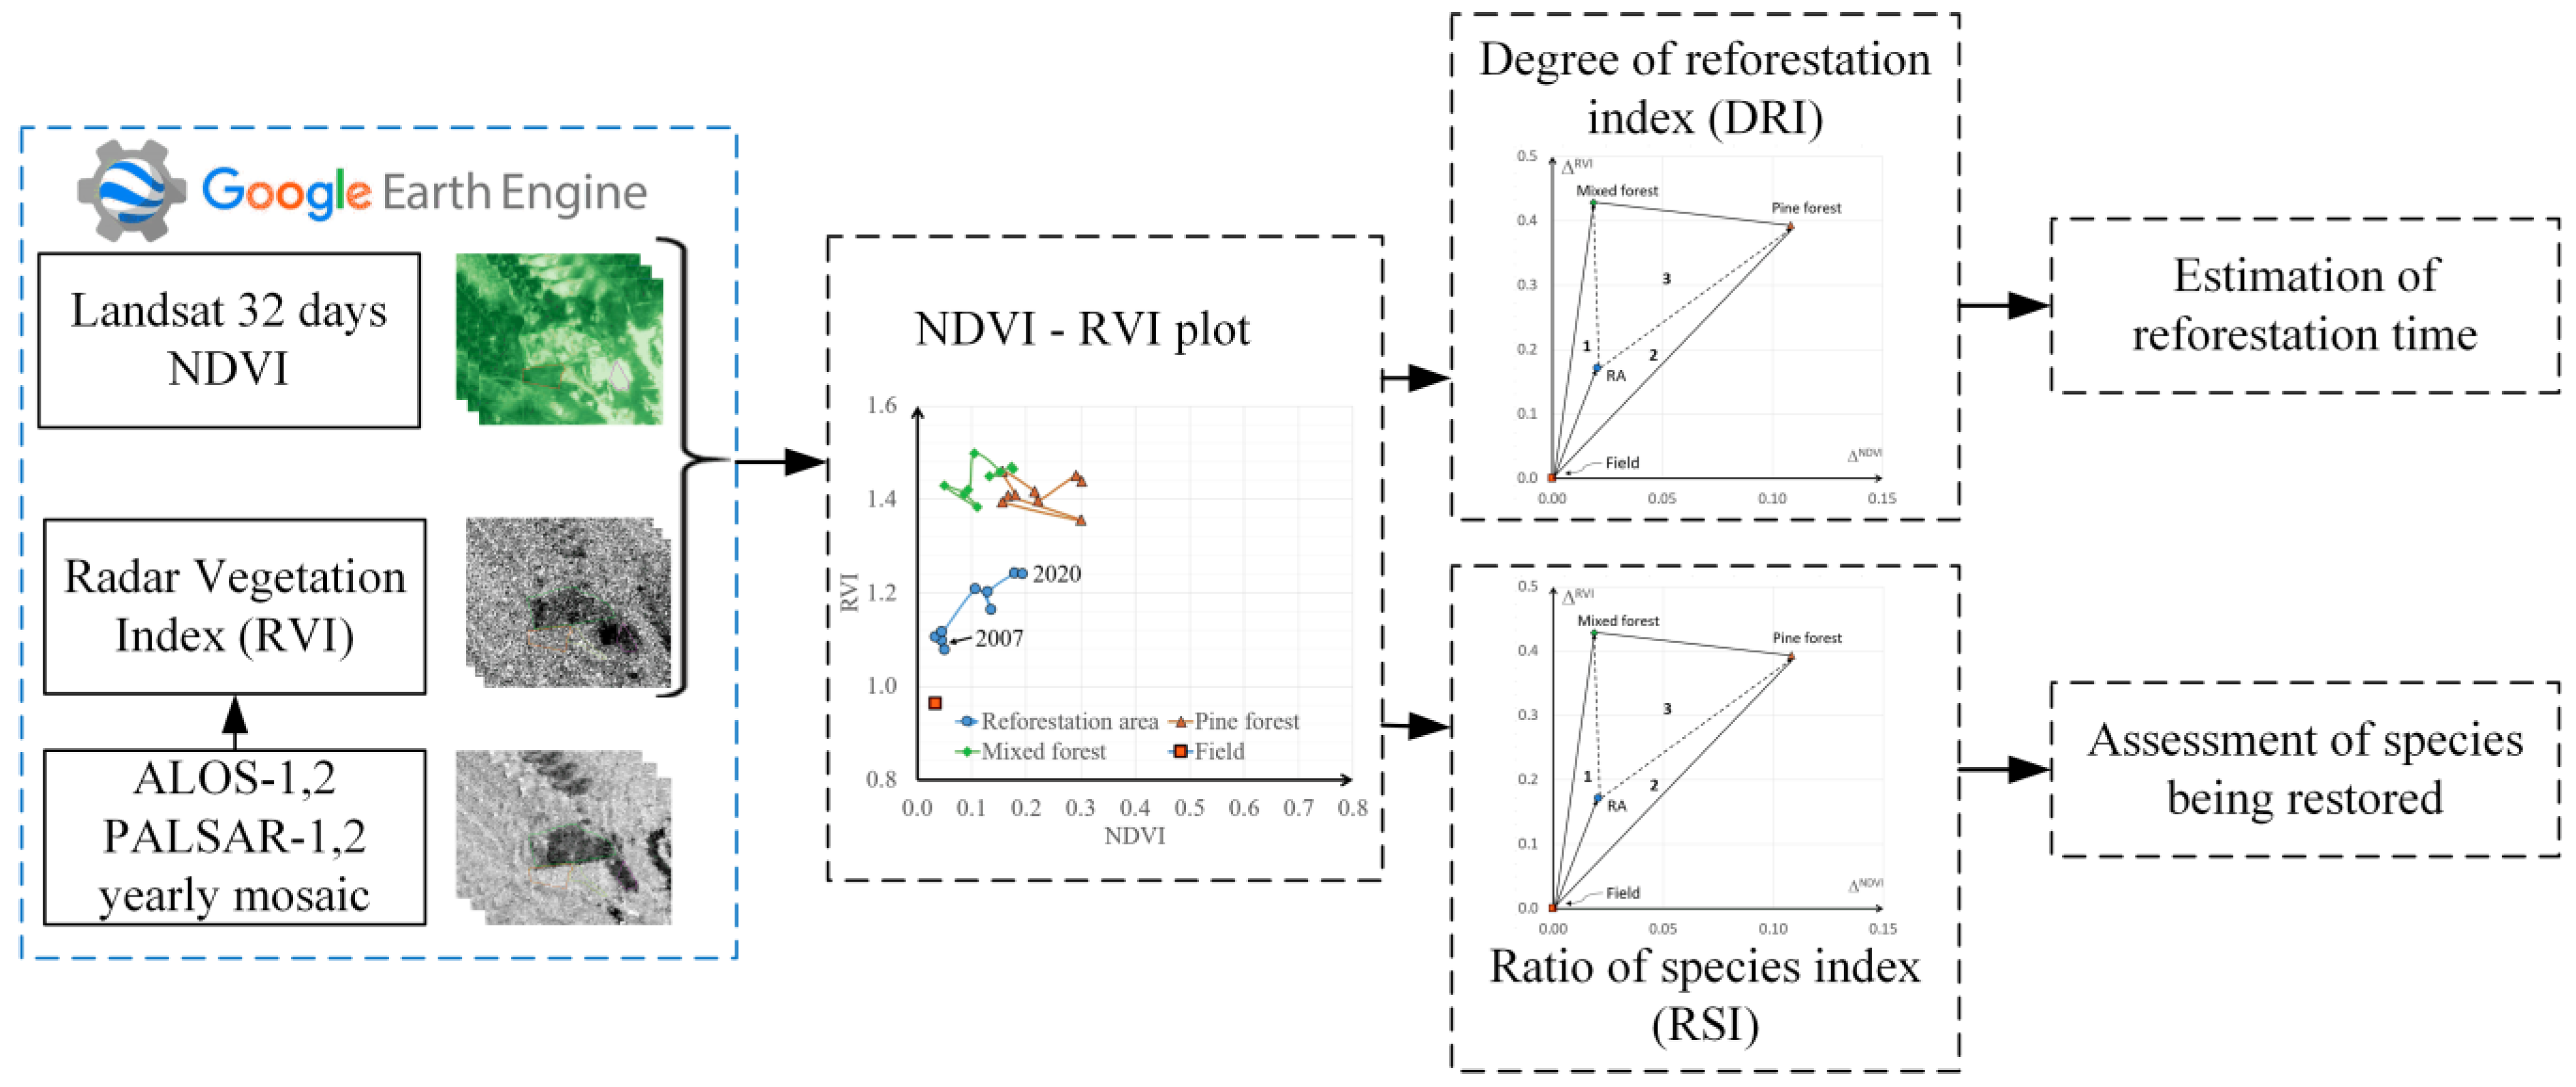
4. Proposed Method and Results
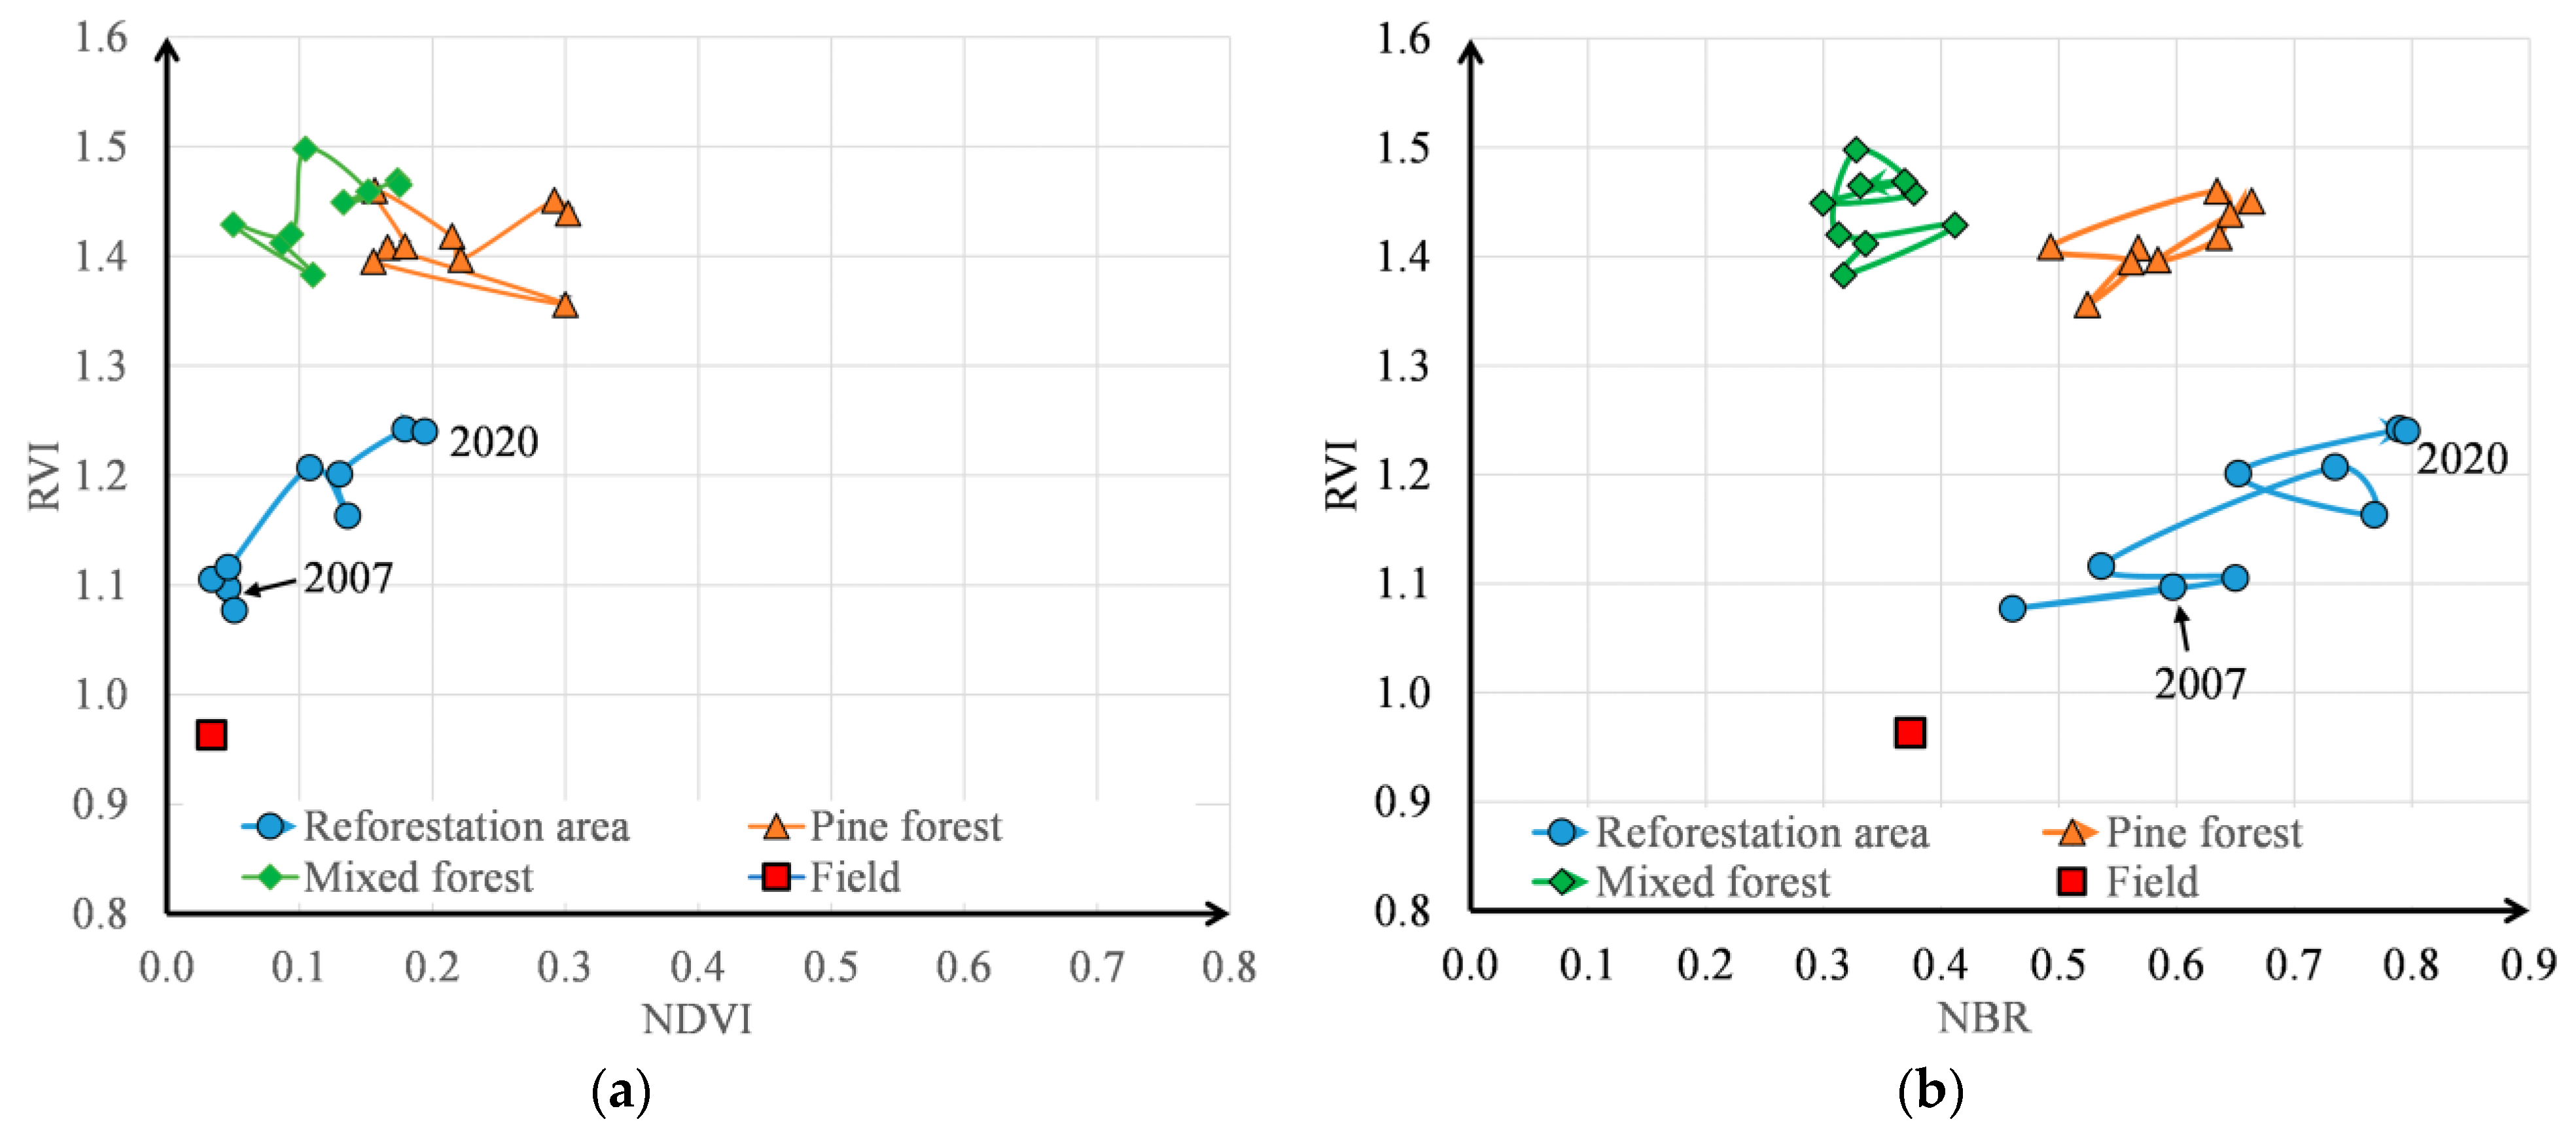
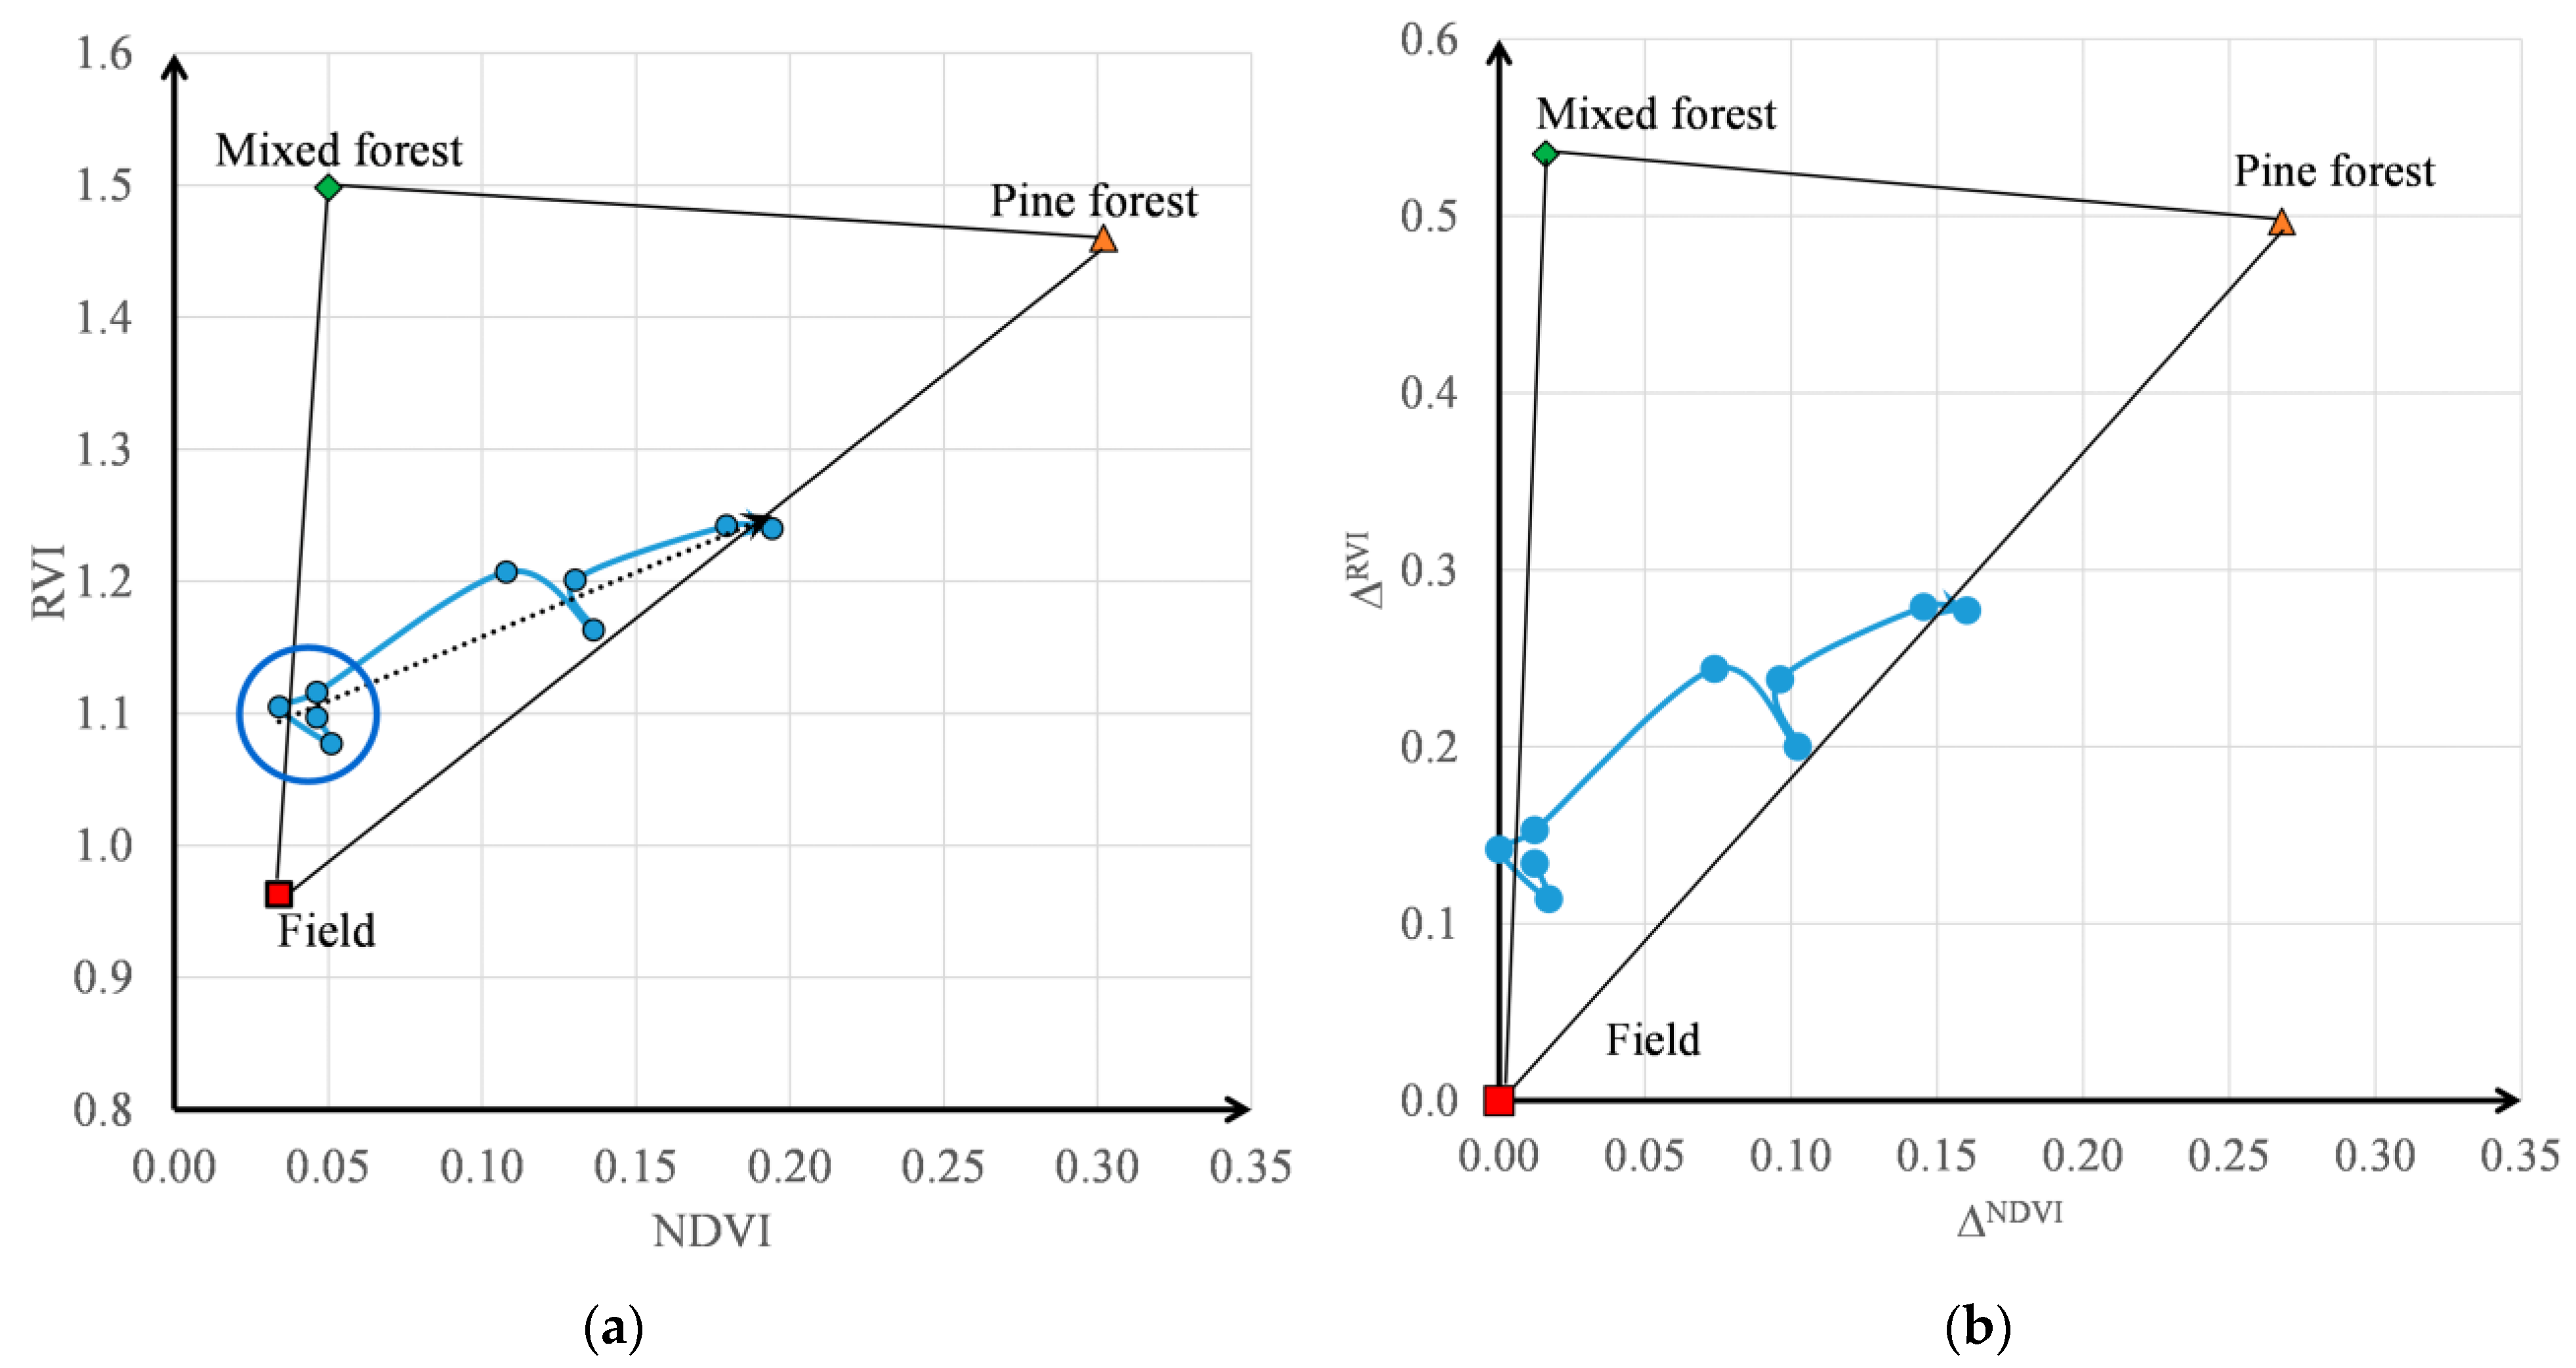
4.1. Description of the Method

- A point in the reference mixed forest was assigned minimum NDVI and NBR values in the X-direction and maximum RVI values in the Y-direction;
- A point in the reference coniferous forest was assigned maximum NDVI and NBR values in the X-direction and minimum RVI values in the Y-direction.
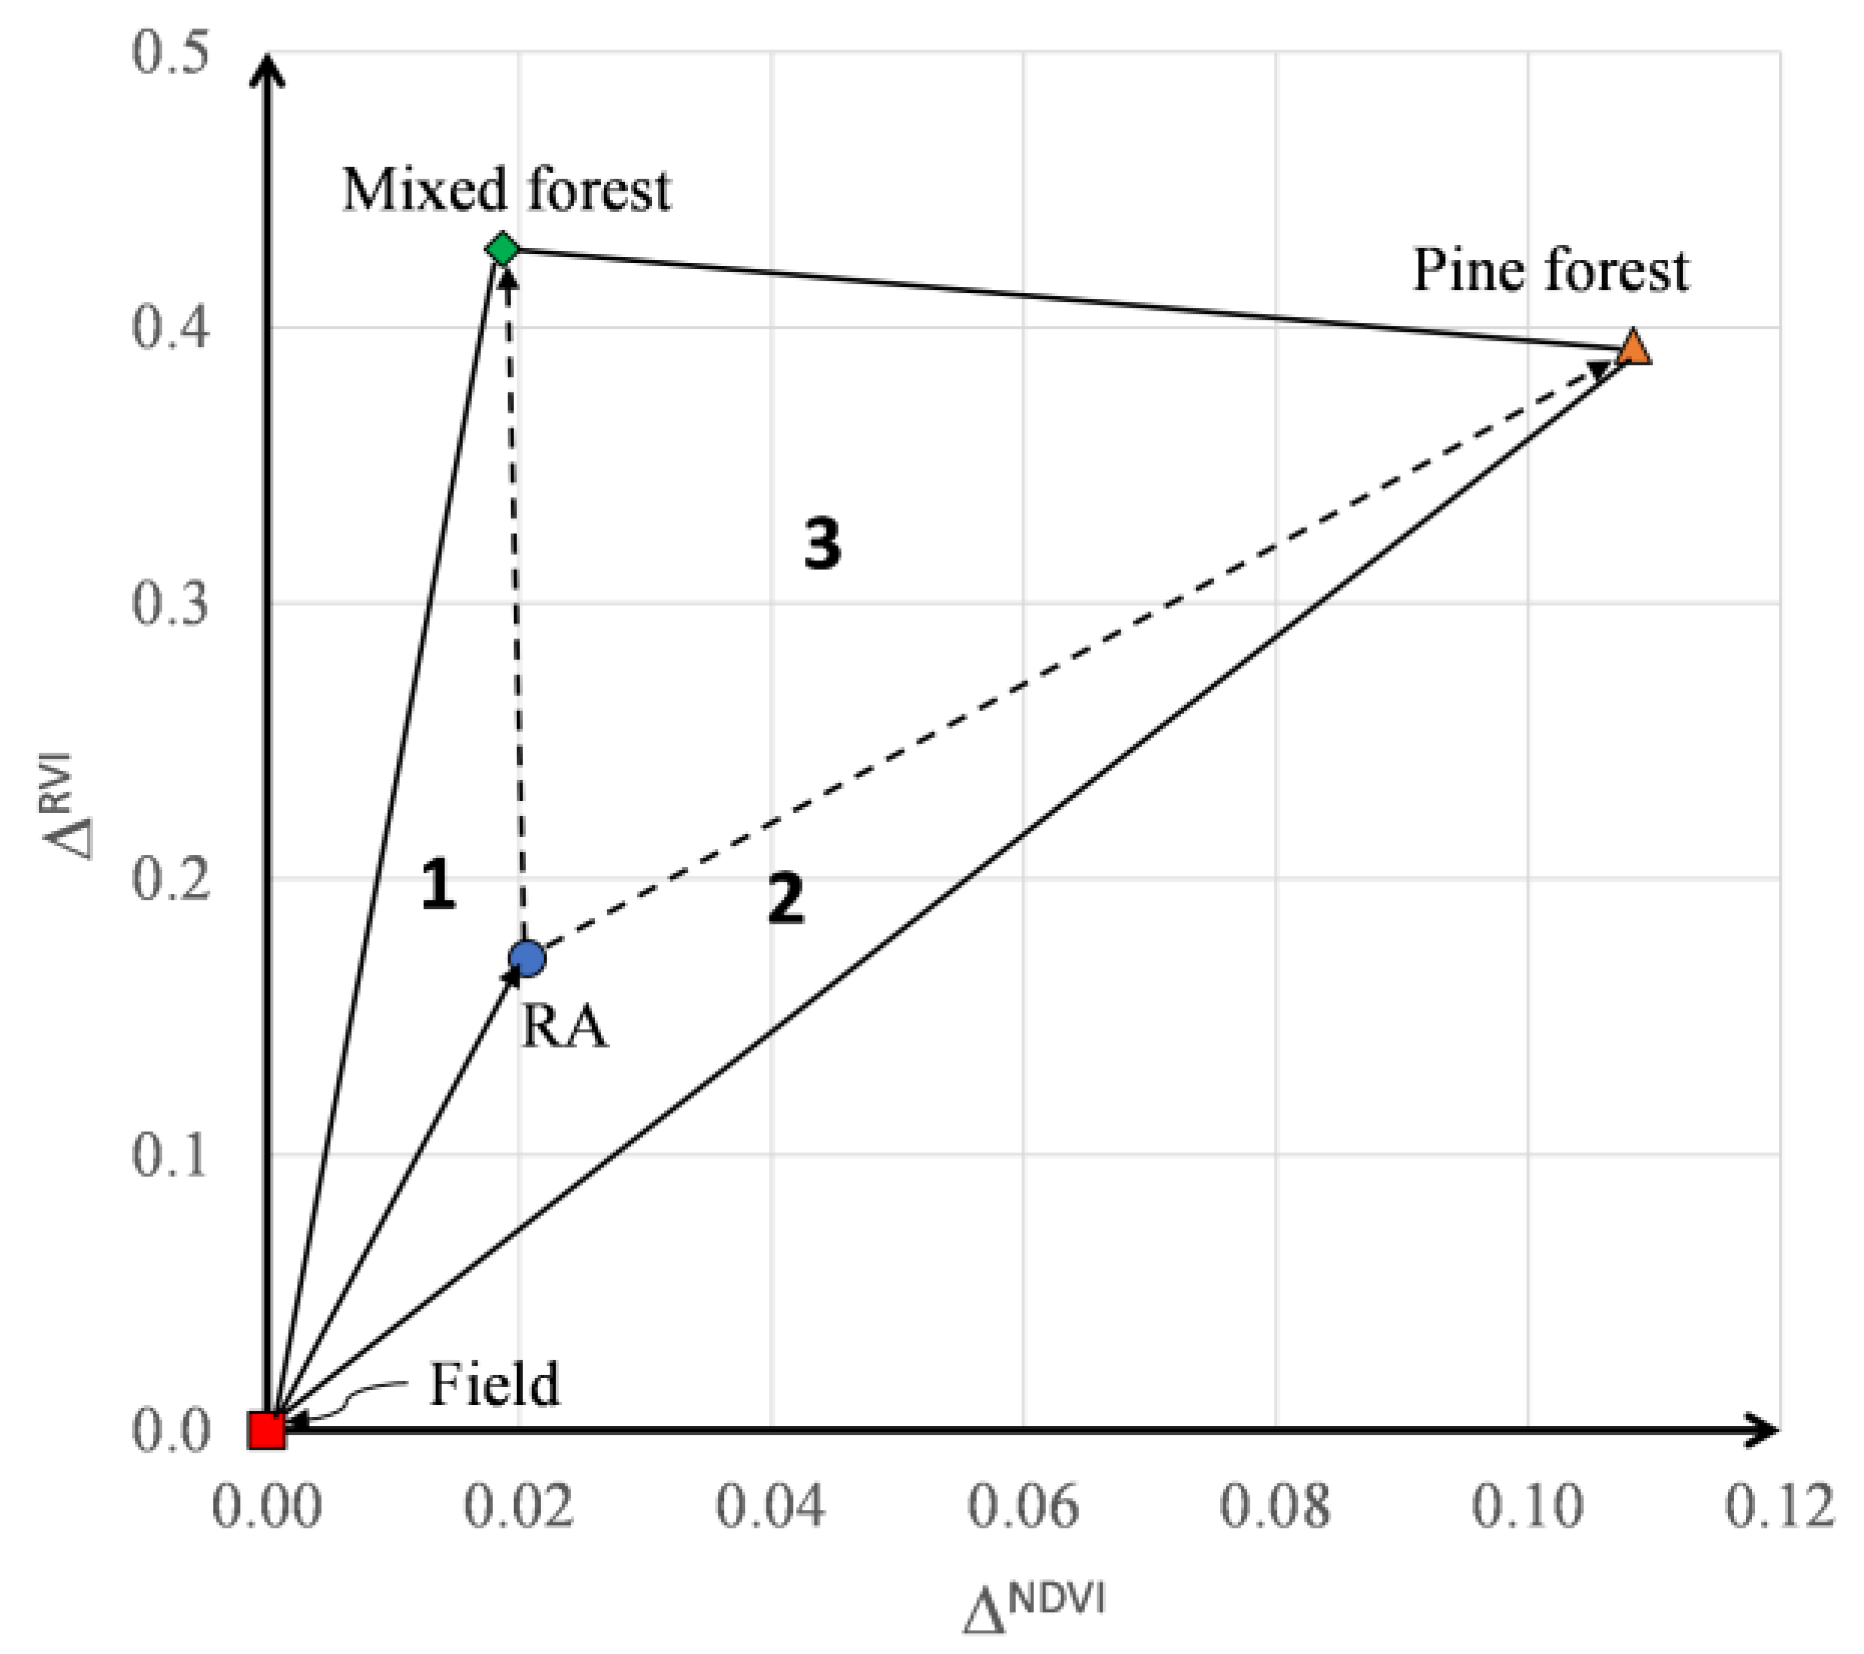
4.2. Quantitative Reforestation Assessment
5. Separate Assessment for NDVI/RVI and Discussion
- -
- The average degree of total post-fire reforestation, the DRI, is equal to 0.29 (the DRI is equal to 1, or 100%, for the reference pine forest). The DRI increases at an average rate of 1.45% per year (DRI = 0.0145∙t + 0.1386 with r2 = 0.63). The estimated time to reach the level of the reference pine forest is 60 years (at a constant growth rate);
- -
- Average projective cover by young pine trees; RSIpine is equal to 0.35 (the RSI is equal to 1, or 100% for the reference pine forest). The RSI increases at an average rate of 7.12% per year (RSI = 0.0712∙t − 0.2472 with r2 = 0.89. The estimated time of the projective cover restoration is about 18 years after the fire.
6. Conclusions
Author Contributions
Funding
Data Availability Statement
Acknowledgments
Conflicts of Interest
References
- Bellassen, V.; Luyssaert, S. Carbon sequestration: Managing forests in uncertain times. Nature 2014, 506, 153–155. [Google Scholar] [CrossRef] [PubMed]
- Jiang, M.; Medlyn, B.E.; Drake, J.E.; Duursma, R.A.; Anderson, I.C.; Barton, C.V.M.; Boer, M.M.; Carrillo, Y.; Castañneda-Gómez, L.; Collins, L.; et al. The fate of carbon in a mature forest under carbon dioxide enrichment. Nature 2020, 580, 227–231. [Google Scholar] [CrossRef] [PubMed]
- Pinnington, E.M.; Casella, E.; Dance, S.L.; Lawless, A.S.; Morison, J.I.; Nichols, N.K.; Wilkinson, M.; Quaife, T.L. Understanding the effect of disturbance from selective felling on the carbon dynamics of a managed woodland by combining observations with model predictions. J. Geophys. Res. Biogeosci. 2017, 122, 886–902. [Google Scholar] [CrossRef]
- Pugh, T.A.M.; Lindeskog, M.; Smith, B.; Poulter, B.; Arneth, A.; Haverd, V.; Calle, L. Role of forest regrowth in global carbon sink dynamics. Proc. Natl. Acad. Sci. USA 2019, 116, 4382–4387. [Google Scholar] [CrossRef]
- Chazdon, R.L.; Broadbent, E.N.; Rozendaal, D.M.A.; Bongers, F.; Zambrano, A.M.A.; Aide, T.M.; Balvanera, P.; Becknell, J.M.; Boukili, V.; Brancalion, P.H.S.; et al. Carbon sequestration potential of second-growth forest regeneration in the Latin American tropics. Sci. Adv. 2016, 2, e1501639. [Google Scholar] [CrossRef]
- Ivanov, A.Y.; Durmanov, N.D.; Orlov, M.P.; Piksendeev, K.V.; Rovnov, Y.E.; Luksha, P.O.; Makarov, I.A.; Ptichnikov, A.V.; Stepanov, I.A.; Kharchenko, M.M.; et al. Bitva za Klimat: Karbonovoye Zemledeliye Kak Stavka Rossii (Battle for Climate: Carbon Farming Like Russia’s Bet); Expert Report; HSE University Publication: Moscow, Russia, 2021; 120p. (In Russian) [Google Scholar]
- Erbaugh, J.T.; Pradhan, N.; Adams, J.; Oldekop, J.A.; Agrawal, A.; Brockington, D.; Pritchard, R.; Chhatre, A. Global forest restoration and the importance of prioritizing local communities. Nat. Ecol. Evol. 2020, 4, 1472–1476. [Google Scholar] [CrossRef]
- Koch, A.; Kaplan, J.O. Tropical forest restoration under future climate change. Nat. Clim. Chang. 2022, 12, 279–283. [Google Scholar] [CrossRef]
- Bondur, V.G.; Gordo, K.A.; Kladov, V.L. Spacetime distributions of wildfire areas and emissions of carbon-containing gases and aerosols in northern Eurasia according to satellite-monitoring data. Izv. Atmos. Ocean. Phys. 2017, 53, 859–874. [Google Scholar] [CrossRef]
- Bondur, V.G.; Gordo, K.A. satellite monitoring of burnt-out areas and emissions of harmful contaminants due to forest and other wildfires in Russia. Izv. Atmos. Ocean. Phys. 2018, 54, 955–965. [Google Scholar] [CrossRef]
- Jung, M.; Lesiv, M.; Warren-Thomas, E.; Shchepashchenko, D.; See, L.; Fritz, S. The importance of capturing management in forest restoration targets. Nat. Sustain. 2023, 6, 1717. [Google Scholar] [CrossRef]
- Loupian, E.; Burtsev, M.; Proshin, A.; Kashnitskii, A.; Balashov, I.; Bartalev, S.; Konstantinova, A.; Kobets, D.; Radchenko, M.; Tolpin, V.; et al. Usage Experience and Capabilities of the VEGA-Science System. Remote Sens. 2022, 14, 77. [Google Scholar] [CrossRef]
- The JJ-FAST System. Available online: https://www.eorc.jaxa.jp/jjfast/system.html (accessed on 4 January 2024).
- Koyama, C.N.; Watanabe, M.; Hayashi, M.; Shimada, M.; Kobayashi, K.; Tadono, T. Advancements in Global Forest Monitoring Research Founded on ALOS-2 Long-Term Pantropical Land Observation. In Proceedings of the IGARSS 2022—2022 IEEE International Geoscience and Remote Sensing Symposium, Kuala Lumpur, Malaysia, 17 July 2022; pp. 4445–4448. [Google Scholar] [CrossRef]
- Watanabe, M.; Koyama, C.N.; Hayashi, M.; Nagatani, I.; Tadono, T.; Shimada, M. Refined algorithm for forest early warning system with ALOS-2/PALSAR-2 ScanSAR data in tropical forest regions. Remote Sens. Environ. 2021, 265, 112643. [Google Scholar] [CrossRef]
- Bondur, V.; Chimitdorzhiev, T.; Kirbizhekova, I.; Dmitriev, A. Estimation of Postfire Reforestation with SAR Polarimetry and NDVI Time Series. Forests 2022, 13, 814. [Google Scholar] [CrossRef]
- Cavalli, A.; Francini, S.; Cecili, G.; Cocozza, C.; Congedo, L.; Falanga, V.; Spadoni, G.L.; Maesano, M.; Munafò, M.; Chirici, G.; et al. Afforestation monitoring through automatic analysis of 36-years Landsat Best Available Composites. Forests 2022, 15, 220–228. [Google Scholar] [CrossRef]
- Cavalli, A.; Francini, S.; McRoberts, R.E.; Falanga, V.; Congedo, L.; De Fioravante, P.; Maesano, M.; Munafò, M.; Chirici, G.; Scarascia Mugnozza, G. Estimating Afforestation Area Using Landsat Time Series and Photointerpreted Datasets. Remote Sens. 2023, 15, 923. [Google Scholar] [CrossRef]
- Ershov, D.V.; Gavrilyuk, E.A.; Koroleva, N.V.; Belova, E.I.; Tikhonova, E.V.; Shopina, O.V.; Titovets, A.V.; Tikhonov, G.N. Natural Afforestation on Abandoned Agricultural Lands during Post-Soviet Period: A Comparative Landsat Data Analysis of Bordering Regions in Russia and Belarus. Remote Sens. 2022, 14, 322. [Google Scholar] [CrossRef]
- The BAP Library. Available online: https://code.earthengine.google.com/?accept_repo=users/sfrancini/bap (accessed on 4 January 2024).
- Landsat 5 TM Collection 1 Tier 1 32-Day NDVI Composite. Available online: https://developers.google.com/earth-engine/datasets/catalog/LANDSAT_LT05_C01_T1_32DAY_NDVI (accessed on 4 January 2024).
- Landsat 8 Collection 1 Tier 1 32-Day NDVI Composite. Available online: https://developers.google.com/earth-engine/datasets/catalog/LANDSAT_LC08_C01_T1_32DAY_NDVI (accessed on 4 January 2024).
- Landsat 8 Collection 1 Tier 1 32-Day NBRT Composite. Available online: https://developers.google.com/earth-engine/datasets/catalog/LANDSAT_LC08_C01_T1_32DAY_NBRT (accessed on 4 January 2024).
- Chuvieco, E.; Congalton, R. Mapping and inventory of forest fires from digital processing of tm data. Geocarto Intern. 1988, 3, 41–53. [Google Scholar] [CrossRef]
- Alcaras, E.; Costantino, D.; Guastaferro, F.; Parente, C.; Pepe, M. Normalized Burn Ratio Plus (NBR+): A New Index for Sentinel-2 Imagery. Remote Sens. 2022, 14, 1727. [Google Scholar] [CrossRef]
- Global PALSAR-2/PALSAR Yearly Mosaic, Version 1. Available online: https://developers.google.com/earth-engine/datasets/catalog/JAXA_ALOS_PALSAR_YEARLY_SAR (accessed on 4 January 2024).
- Yadav, V.P.; Prasad, R.; Bala, R.; Srivastava, P.K.; Vanama, V.S.K. Appraisal of Dual Polarimetric Radar Vegetation Index in First Order Microwave Scattering Algorithm Using Sentinel-1A (C-Band) and ALOS 2 (L-Band) SAR Data. Geocarto Intern. 2022, 37, 6232–6250. [Google Scholar] [CrossRef]
- Park, S.-E. Variations of Microwave Scattering Properties by Seasonal Freeze/Thaw Transition in the Permafrost Active Layer Observed by ALOS PALSAR Polarimetric Data. Remote Sens. 2015, 7, 17135–17148. [Google Scholar] [CrossRef]
- Park, S.-E.; Jung, Y.K.; Kim, H.-C. Monitoring permafrost changes in central Yakutia using optical and polarimetric SAR data. Remote Sens. Environ. 2022, 274, 112989. [Google Scholar] [CrossRef]
- Dmitriev, A.V.; Chimitdorzhiev, T.N.; Dobrynin, S.I.; Khudaiberdieva, O.; Kirbizhekova, I. Optical-microwave diagnostics of agricultural land afforestation. Sovrem. Probl. Distantsionnogo Zondirovaniya Zemli Kosmosa 2022, 19, 168–180. [Google Scholar] [CrossRef]


Disclaimer/Publisher’s Note: The statements, opinions and data contained in all publications are solely those of the individual author(s) and contributor(s) and not of MDPI and/or the editor(s). MDPI and/or the editor(s) disclaim responsibility for any injury to people or property resulting from any ideas, methods, instructions or products referred to in the content. |
© 2024 by the authors. Licensee MDPI, Basel, Switzerland. This article is an open access article distributed under the terms and conditions of the Creative Commons Attribution (CC BY) license (https://creativecommons.org/licenses/by/4.0/).
Share and Cite
Bondur, V.; Chimitdorzhiev, T.; Kirbizhekova, I.; Dmitriev, A. A Novel Method of Boreal Zone Reforestation/Afforestation Estimation Using PALSAR-1,2 and Landsat-5,8 Data. Forests 2024, 15, 132. https://doi.org/10.3390/f15010132
Bondur V, Chimitdorzhiev T, Kirbizhekova I, Dmitriev A. A Novel Method of Boreal Zone Reforestation/Afforestation Estimation Using PALSAR-1,2 and Landsat-5,8 Data. Forests. 2024; 15(1):132. https://doi.org/10.3390/f15010132
Chicago/Turabian StyleBondur, Valery, Tumen Chimitdorzhiev, Irina Kirbizhekova, and Aleksey Dmitriev. 2024. "A Novel Method of Boreal Zone Reforestation/Afforestation Estimation Using PALSAR-1,2 and Landsat-5,8 Data" Forests 15, no. 1: 132. https://doi.org/10.3390/f15010132
APA StyleBondur, V., Chimitdorzhiev, T., Kirbizhekova, I., & Dmitriev, A. (2024). A Novel Method of Boreal Zone Reforestation/Afforestation Estimation Using PALSAR-1,2 and Landsat-5,8 Data. Forests, 15(1), 132. https://doi.org/10.3390/f15010132