Article

Soil Quality Evaluation of Typical Vegetation and Their Response to Precipitation in Loess Hilly and Gully Areas

1
College of Life Science, Yan’an University, Yan’an 716000, China
2
China Institute of Water Resources and Hydropower Research, Beijing 100038, China
3
Powerchina Northwest Engineering Corporation, Xi’an 710065, China
*
Authors to whom correspondence should be addressed.
Forests 2023, 14(9), 1909; https://doi.org/10.3390/f14091909
Submission received: 23 August 2023 / Revised: 14 September 2023 / Accepted: 18 September 2023 / Published: 19 September 2023

Abstract

:
The selection of suitable tree species and the reasonable allocation of planting areas are important measures for improving soil quality. This study aimed to investigate the characteristics of typical vegetation type soil quality differences and their dominant factors in loess hilly–gully areas after returning farmland to the forest (grassland). The soil quality status and dominant factors of arbors, shrubs and grasslands in the study area were comprehensively analyzed using the soil quality index (SQI) and structural equation modeling (SEM). The results showed the following: (1) In the study area, the shrub forest had a high capacity for air permeability, water retention and nitrogen fixation. (2) The soil quality of the three vegetation types improved with increasing precipitation, and the soil quality indicator of shrubs was the highest, indicating a better soil quality improvement. However, the soil quality of the arbors and grasslands showed a greater percentage increase. In the precipitation range of 400–410 mm, the soil quality of shrub forests was significantly higher than that of arbors and grasslands. (3) Structural equation modeling analysis indicated that precipitation, vegetation and soil factors are closely related to soil quality. Further analysis showed that soil bulk density, porosity, capillary water-holding capacity, soil organic carbon and total phosphorus were the dominant factors affecting the soil quality in the study area. The purpose of this study was to evaluate quantitatively the soil quality after different vegetation types under different precipitation gradients, to clarify the variation trend of soil quality at different vegetation types with different precipitation gradients and to provide a scientific basis and data support for the quantitative evaluation of vegetation restoration and selection of tree species and vegetation configuration within different precipitation gradients in loess hilly and gully regions in the future.

1. Introduction

Vegetation and soil have a direct and close relationship as soil and vegetation co-influence each other through time [1,2]. The restoration of vegetation communities can lead to the return of litter and change in root activity, thereby continuously improving the soil environment [3]. Improving the soil environment has impacts on plant growth and yield, soil texture and structure, soil fertility and nutrient cycling, soil microbial activity, as well as ecosystem functioning and biodiversity [4].
In the gullies and ridges of the Loess Plateau, the surface soil, soil erosion and loss are severe [5]. Reasonable vegetation management is an important step in ecological restoration [6,7] and an important measure for improving soil quality [8,9]. However, owing to the arid climate, water has become a critical factor constraining ecological restoration and reconstruction in the region. Relevant studies have shown that soil moisture plays an important linking role in the soil–vegetation–atmosphere system, and the spatiotemporal variability of soil moisture further affects the distribution, structure and ecological function of regional plant communities [10]. Meanwhile, how vegetation utilizes soil moisture can lead to changes in vegetation growth and distribution, altering the net primary productivity of vegetation [11], which also affects the restoration of soil quality [12]. Studies have shown that, in the Loess Plateau area, vegetation and soil moisture are positively correlated. As soil moisture increases, so does vegetation cover, with an overall increase in soil quality [13,14]. In addition, studies have shown that changes in precipitation patterns can affect soil moisture and temperature conditions, soil substrates, soil microbial communities and enzyme activities [15,16,17]. Precipitation is an important factor for vegetation growth and affects the distribution characteristics of vegetation through changes in precipitation distribution patterns [18], and the soil layer is a key factor for allocating precipitation moisture [19]. Therefore, studying the relationship between precipitation, vegetation and soil quality is important for understanding the long-term effects of ecological environmental changes and changes in vegetation distribution patterns.
At present, the research on soil quality is mainly on the influence of a single or a few vegetation types on soil quality [20,21] or concentrated on the changes in soil properties affected by vegetation, thereby affecting soil quality [22,23,24]. However, systematic studies on soil quality for the same vegetation type under different precipitation gradients and between different vegetation types under the same gradient are relatively rare. Therefore, in this study, three areas with significant differences in precipitation gradients in the loess hilly and gully region—Wuqi County Changcheng (400–410 mm), Jinfoping (440–445 mm) and Baibao (460–470 mm)—were selected as research areas. Three representative vegetation types, including arbors, shrubs and grasslands, were selected as the research objects. Through investigation and sampling, to study soil quality and its dominant factors, the main objectives of this study were (1) to elucidate the differences in soil quality evaluation indicators of typical vegetation under different precipitation gradients; (2) to comprehensively score the soil physical structure, soil water retention, soil salinity reduction, soil carbon sink, soil available nutrients and soil quality of the three typical vegetation types in the study area; and (3) to use structural equation modeling to study the relationships among precipitation, vegetation, soil factors and soil quality and to further explore the dominant factors affecting vegetation soil quality. This study aimed to determine the soil quality status of the same vegetation under different precipitation gradients and between different vegetation types under the same precipitation gradient in the loess hilly and gully regions, as well as the dominant factors that affect it.

2. Study Area Overview and Methods

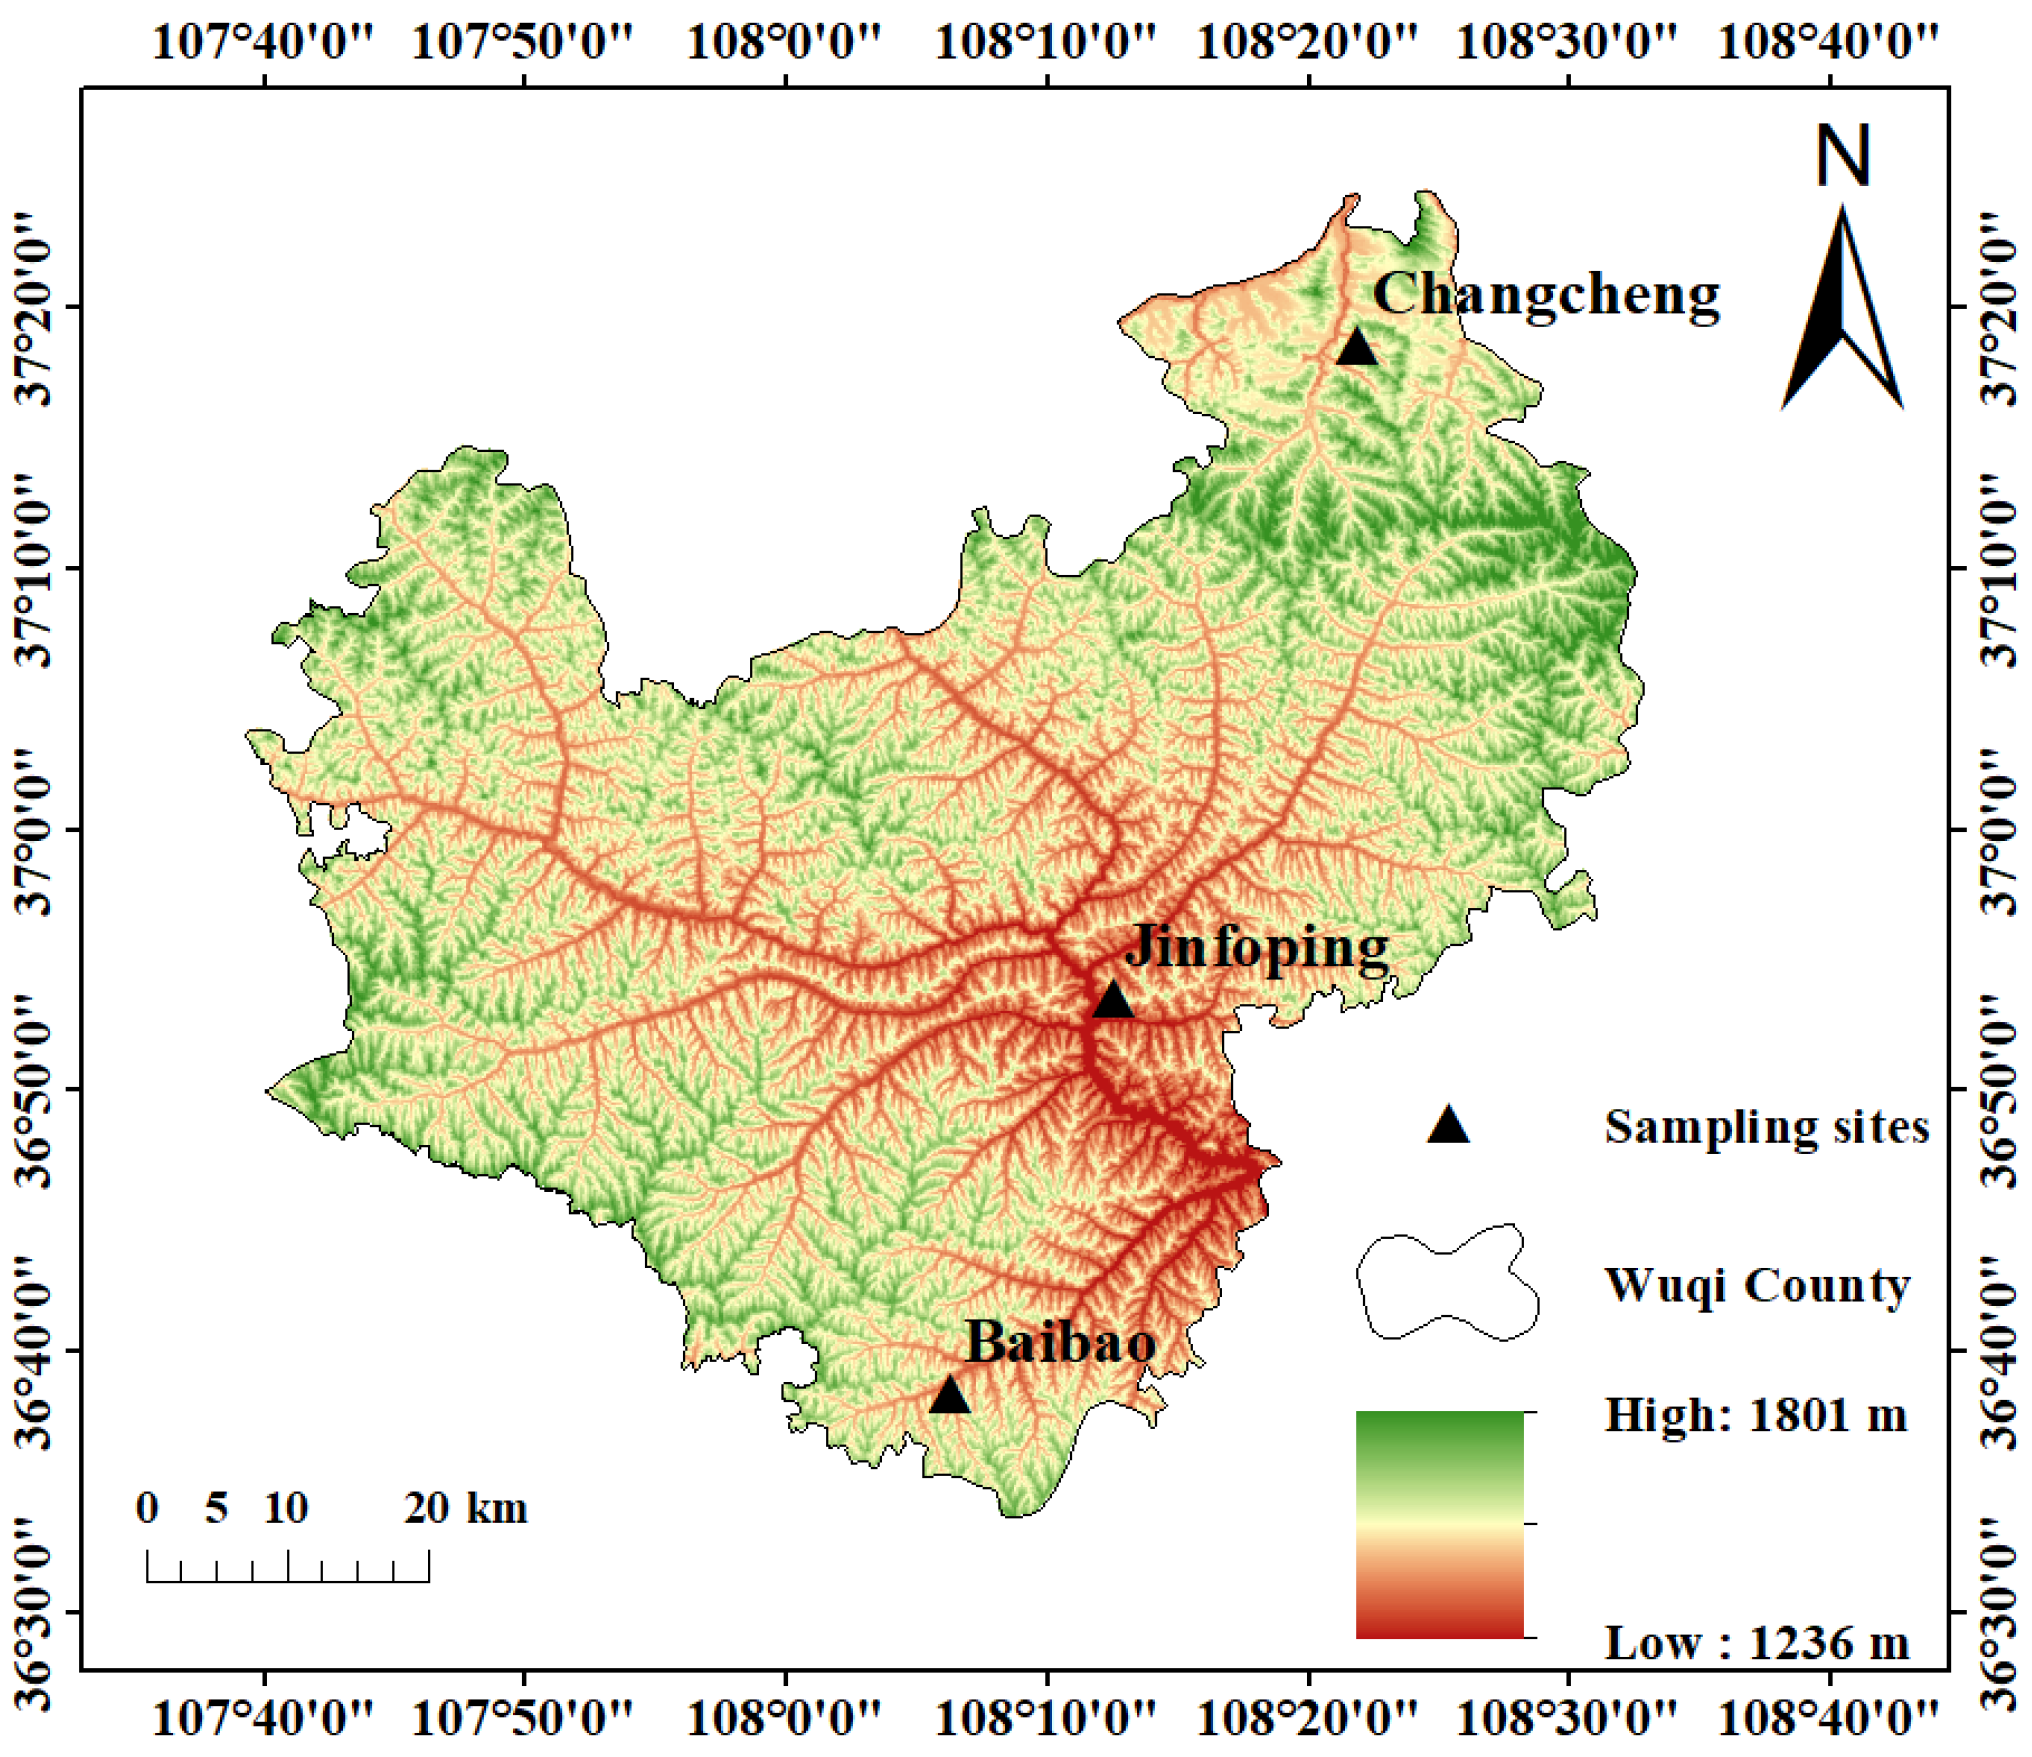
2.1. Overview of the Study Area

The study area is located in Wuqi County (Figure 1). It has a prevalent semi-arid temperate continental monsoon climate with an average annual temperature of 7.8 °C. The landform is mainly composed of Loess Plateau ridge-hill gullies with elevations between 1233 and 1809 m. The soil is loessal soil. The county has gradually formed a forest and grassland dominated by plant species such as Platycladus orientalis, Caragana korshinskii, Leymus secalinus, Lespedeza daurica, Thymus mongolicus, Artemisia gmelinii, Potentilla chinensis, Cirsium setosum, Ixeris polycephala and Delphinium grandiflorum.

2.2. Sample Plot Layout and Soil Sample Collection

The research team conducted a comprehensive survey of the entire Wuqi County and selected three different precipitation gradient zones within the county [24] as the study areas, Changcheng (400–410 mm), Jinfoping (440–445 mm) and Baibao (460–470 mm) (Figure 1). In each precipitation gradient area, three typical vegetation types, arbor, shrub and grassland, with representative and similar habitats, were selected as research objects. They are Populus X hopeiensis (P × H), Hippophae rhamnoides (HR) and grassland (GL). A total of 27 sample plots of 20 m × 20 m were set up in each vegetation type distribution area of each study area, and the sample plot information was recorded (Table 1). The vegetation in the plot was investigated using the method of each wood scale. A five-point sampling method was used for each plot, and the soil was sampled to a depth of 100 cm after removing surface litter. The soil was divided into five layers from top to bottom, with an interval of 20 cm between each layer, resulting in a total of 135 soil profiles. Three replicates were collected for each profile using an auger to measure the physical properties. A total of 2025 auger samples were collected. Simultaneously, soil samples from the same soil layer were collected for mixing and sieving to determine their chemical properties. A total of 135 bags of mixed soil samples were collected.

2.3. Soil Indicator Measurement

Soil indicators were determined by the soil physical properties determination method [25] as well as soil agrochemical analysis [26]. Details are shown in Table 2.

2.4. Soil Quality Indicator Evaluation Model

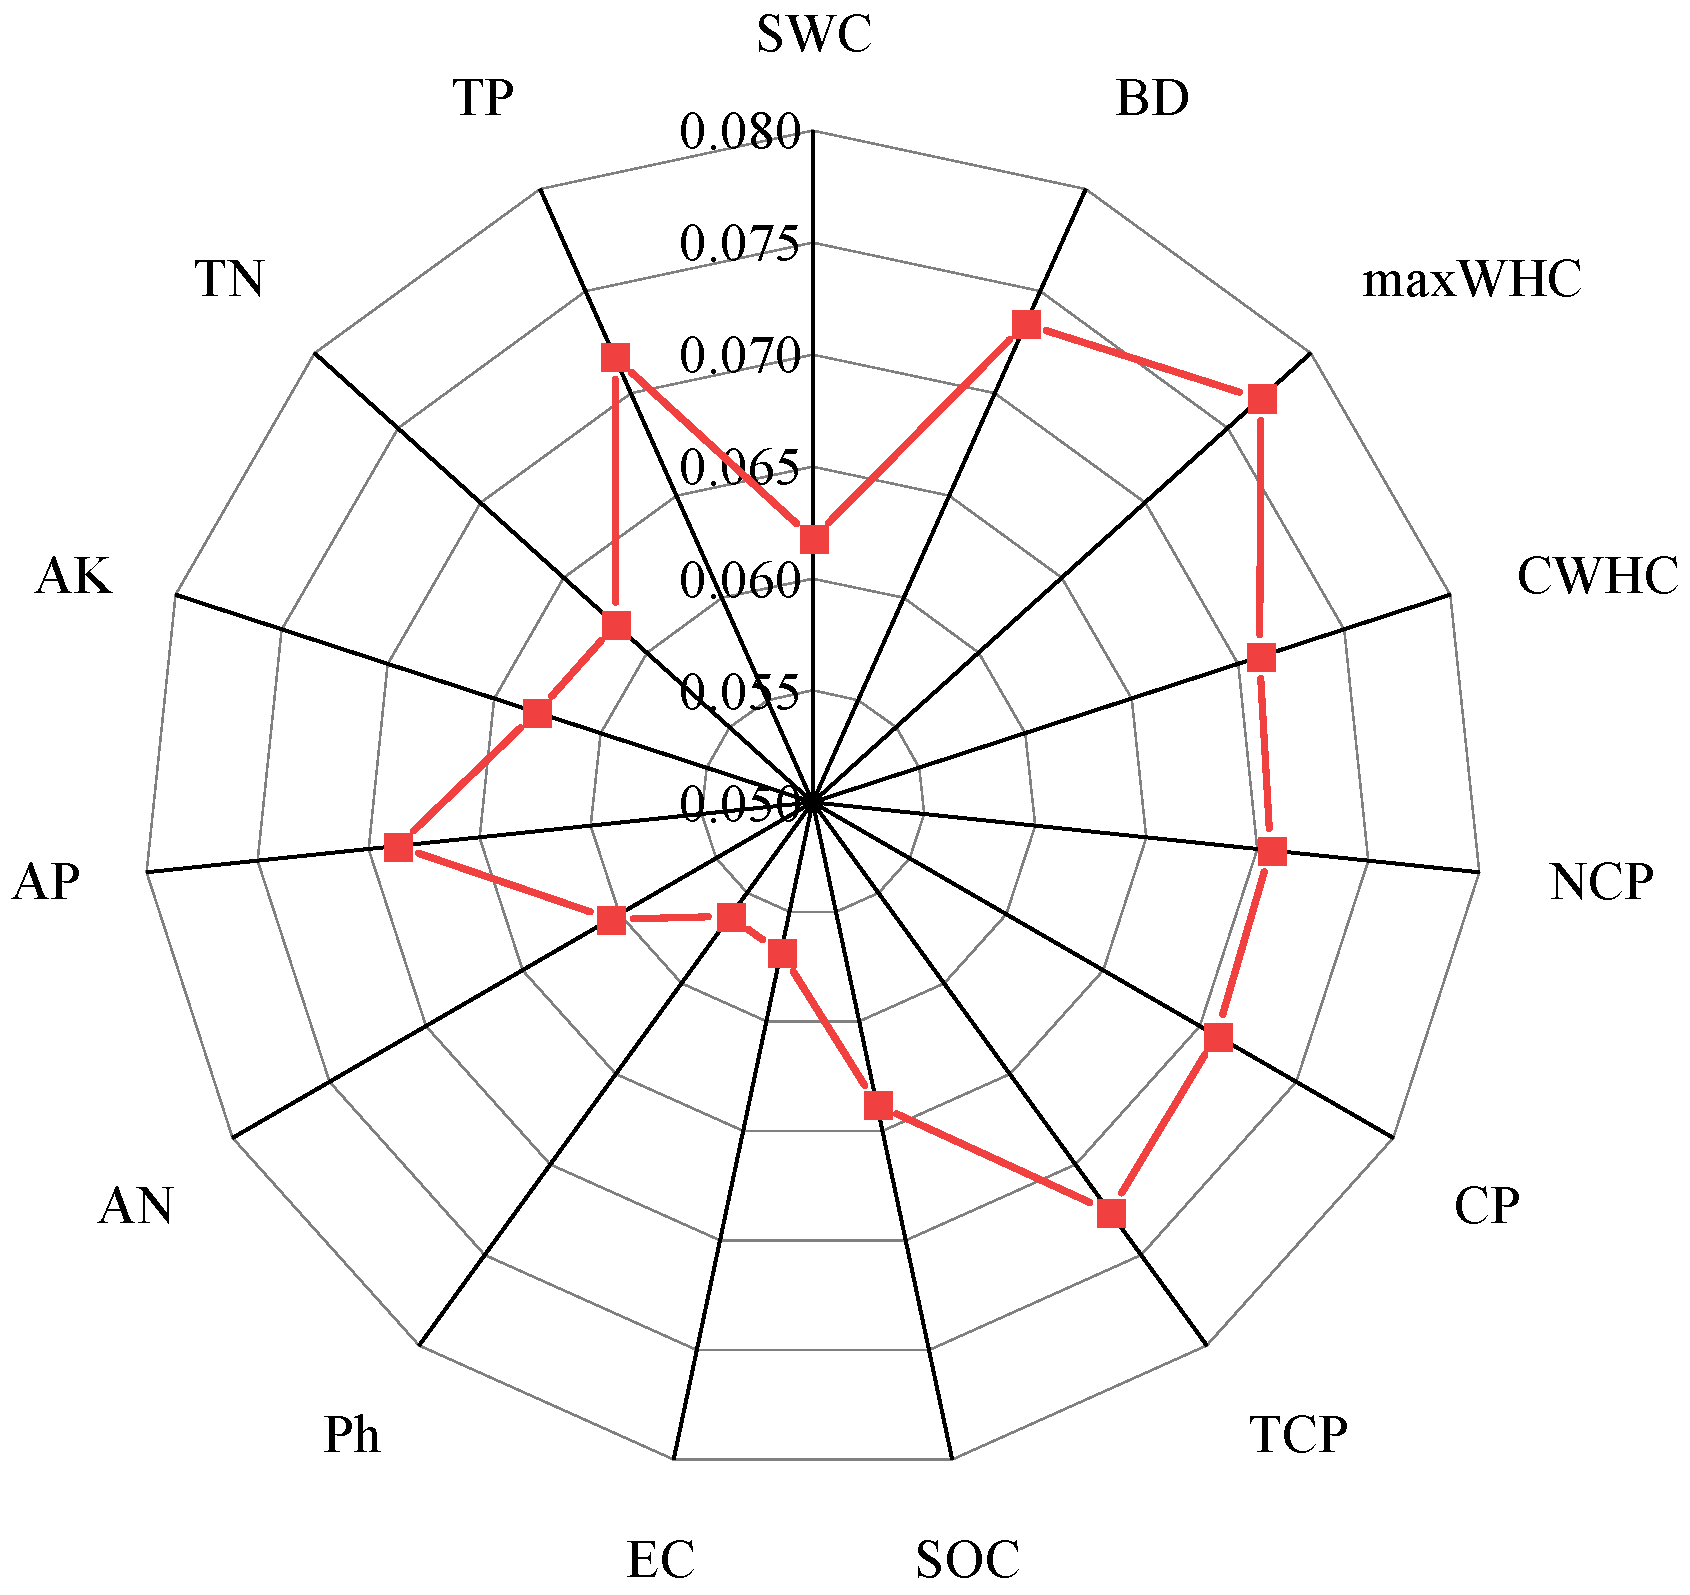
2.4.1. Indicator Selection

In this study, 15 soil physical and chemical indicators that have significant impacts on soil quality were selected, taking into account previous research findings [27,28,29] and experimental conditions. These indicators included BD, NCP, TCP, CP, SWC, maxWHC, CWHC, pH, EC, SOC, AP, AN, AK, TN and TP, which were used to comprehensively evaluate soil quality. Based on previous research results [29], BD, NCP, CP and TCP were classified as soil physical structure indicators; SWC, maxWHC and CWHC were classified as soil water retention indicators; pH and EC were classified as soil salinity and alkalinity indicators; SOC was classified as a soil carbon sink indicator; AP, AN, AK, TN and TP were classified as soil available nutrient indicators.

2.4.2. Calculation of Soil Indicator Weight and Membership Degree

The correlation coefficients between each indicator were determined using a correlation matrix, and the average correlation coefficient between each evaluation indicator was calculated. The weight of each evaluation indicator, Ri, was determined by dividing the average correlation coefficient by the sum of all average correlation coefficients [30]. Secondly, the membership degree of the evaluation indices in the fuzzy comprehensive evaluation was determined by their membership functions [31].

2.4.3. Soil Quality Indicator Calculation

The soil quality evaluation index is calculated by combining various indicators. The larger the soil quality evaluation index, the better the effect of vegetation on soil quality recovery, as shown in Equation [32].
S Q I = i = 1 n R i × F ( x i )
where SQI is the soil quality evaluation index, Ri is the weight of each indicator, n is the number of evaluation indicators and F(xi) represents the membership degree value of each evaluation indicator.

2.5. Data Processing

The weights, membership degrees and soil quality indices were calculated using Excel 2010. One-way analysis of variance (ANOVA) and reliability and validity tests were conducted using SPSS 22.0. Origin 2021 and ArcMap 10.2 were used for mapping. Based on the relationships among precipitation, vegetation, soil factors and soil quality, a structural equation model was constructed using the plspm package in R 4.3.1. On this basis, the maximum factors affecting soil quality were obtained, and then the indicators were selected through reliability and validity tests with a reliability test result greater than 0.6 and a validity test greater than 0.5 using SPSS 22.0. After selection, a structural equation model was constructed using AMOS 21.0.

3. Results

3.1. Statistical Analysis of the Typical Vegetation Soil Indicator

Under different precipitation gradients, the soil physical indicators of the different vegetation types showed significant differences in response to changes in precipitation (p < 0.05). In the 400–470 mm precipitation area, except for BD, physical indicators of arbors and shrubs generally showed an increasing trend with the increase in precipitation. Based on the comprehensive analysis of the differences in soil physical indicators, the soil physical indicators of shrubland were found to be higher, especially in terms of maxWHC, CWHC and TCP, indicating that shrubland had better air permeability and water retention (Table 3). The soil chemical indicators of the different vegetation types also differed significantly (p < 0.05). The EC, AN and TN of both arbors and shrubland soils showed an increasing trend with increasing precipitation. Based on the comprehensive analysis of the differences in soil chemical indicators, it was found that compared with arbors and grasslands, shrublands had advantages in most of the chemical indicators. The soil pH and SOC of shrubland were relatively stable and in the low-precipitation zone, the TN and AK contents were higher than those of arbors and grasslands (p < 0.05), indicating better nitrogen fixation ability (Table 3).

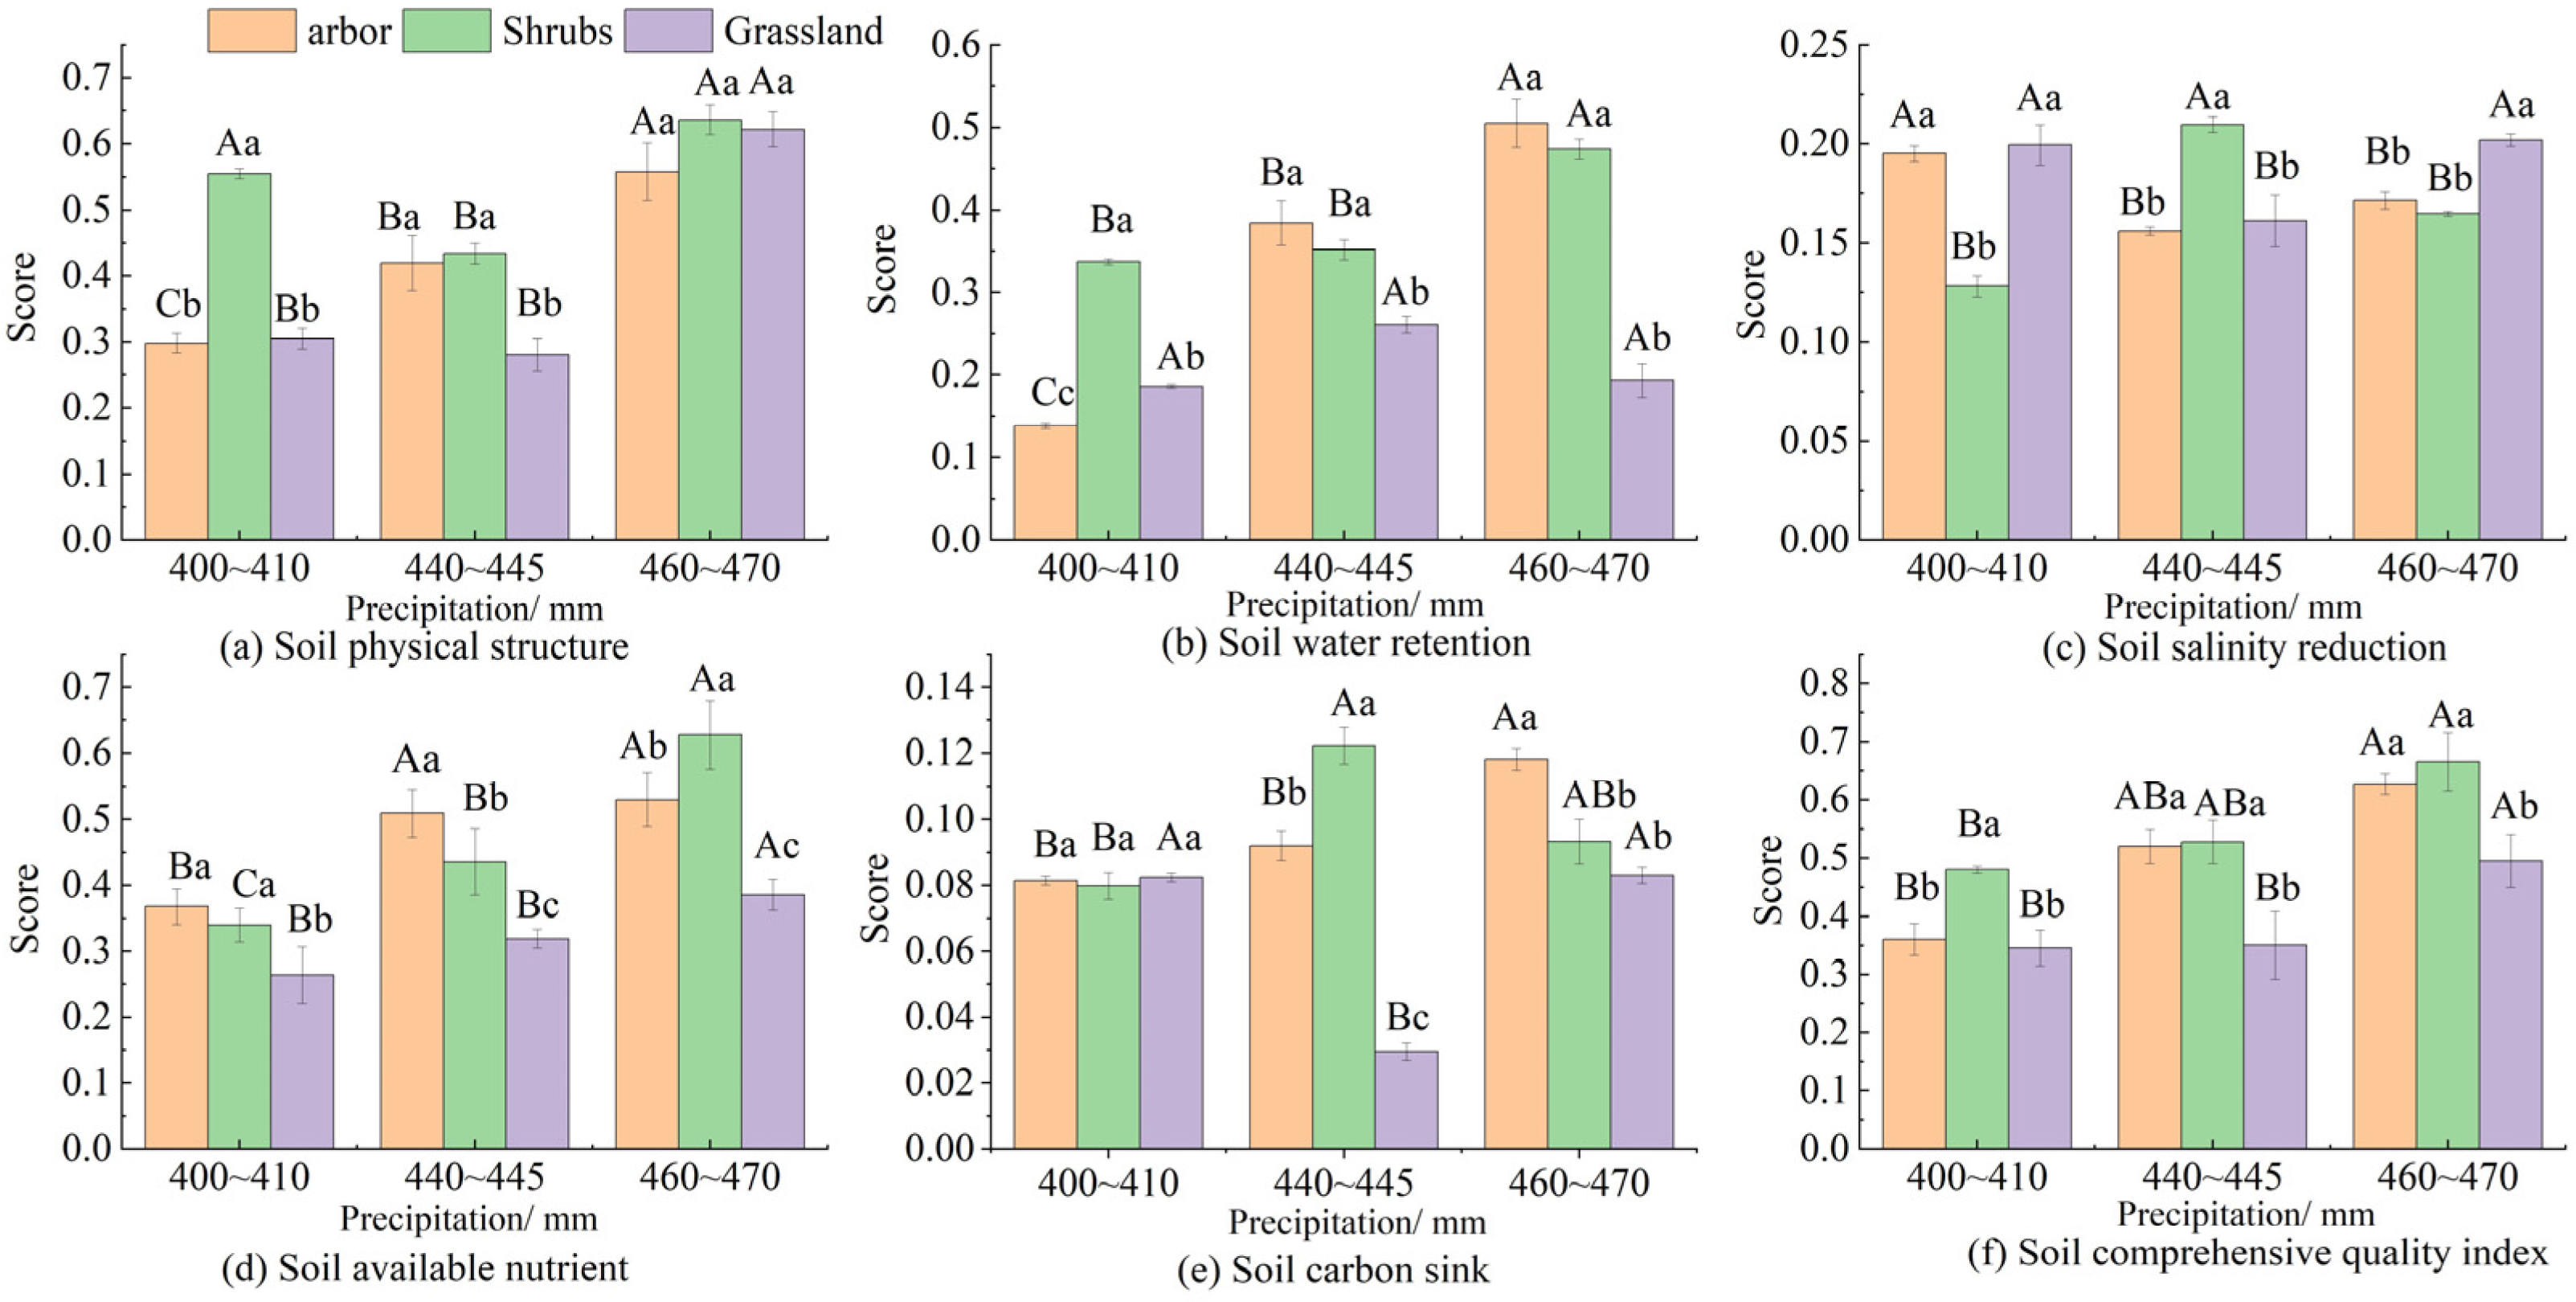
3.2. Variation Characteristics of Soil Quality of Typical Vegetation with Precipitation Gradient

The weight values of different soil indicators in the study area were different and the weight values of maxWHC and TCP were higher, which play an important role in the evaluation of soil quality in the study area (Figure 2). On the precipitation gradient of 400–470 mm, the scores of arbors, shrub and grassland physical structure indicator, soil water retention indicator, salinity indicator, carbon sink indicator and available nutrient indicator in the study area showed different trends with the decrease in precipitation (Figure 3). The indicator scores of arbors decreased overall with decreasing precipitation, and the scores for available nutrients did not differ significantly between the 400–10 mm and 440–445 mm precipitation zones (p > 0.05). The scores of each shrubland indicator fluctuated with the changes in precipitation. The scores of the salinity indicator and soil available nutrient indicator were the lowest in the 400–420 mm precipitation area, and the other indicators showed an increasing trend with increasing precipitation. In addition to soil water retention, the scores of each grassland indicator showed a decreasing trend with decreasing precipitation. A comprehensive analysis of various soil indicators showed that the comprehensive soil quality indicator of the three vegetation types decreased with decreasing precipitation, with arbors and grasslands showing more significant declines.
Under the same precipitation gradient, there were significant differences in the comprehensive soil quality indicator among the three vegetation types (p < 0.05) (Figure 3f). In the 400–470 mm precipitation zone, shrubland had the highest comprehensive soil quality indicator and was significantly higher than that of arbors and grasslands in the 400–410 mm precipitation zone, showing the best improvement in soil quality in the study area. In the 440–470 mm precipitation zone, arbors have higher soil quality than grasslands, but grassland soil quality improved by 42.86%, whereas arbors soil quality improved by 21.15%, with grassland soil quality improvement being higher than that of arbors.

3.3. Effects of Environmental Factors on Soil Quality under Different Precipitation Gradients

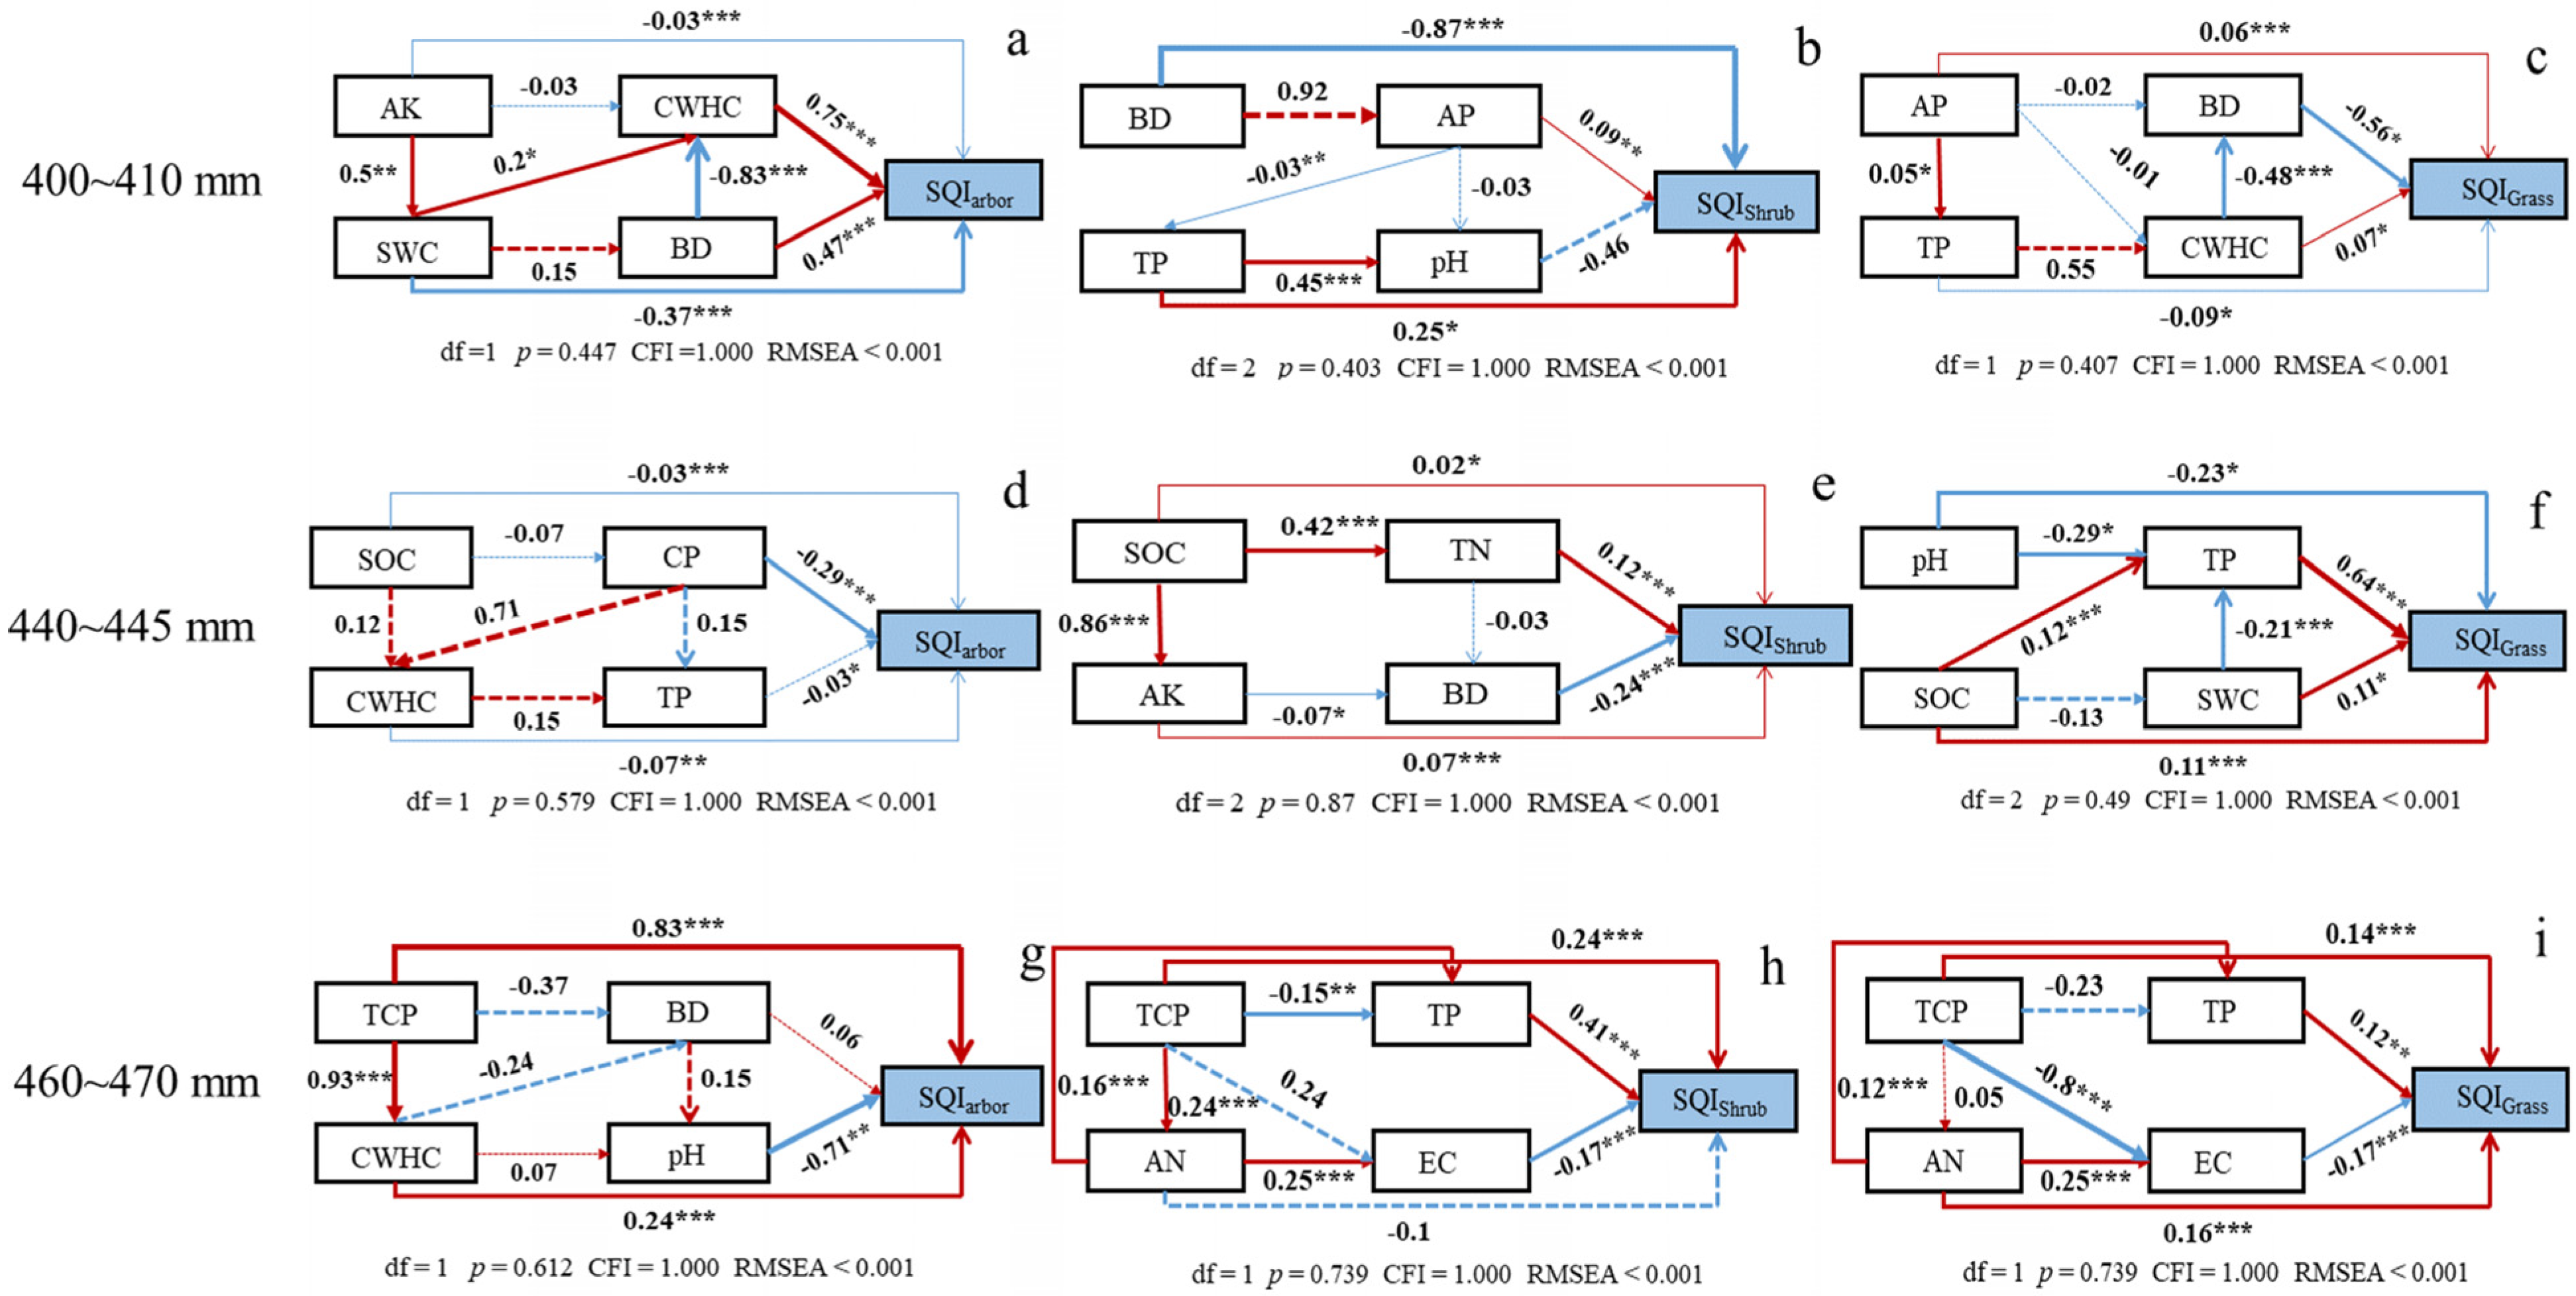
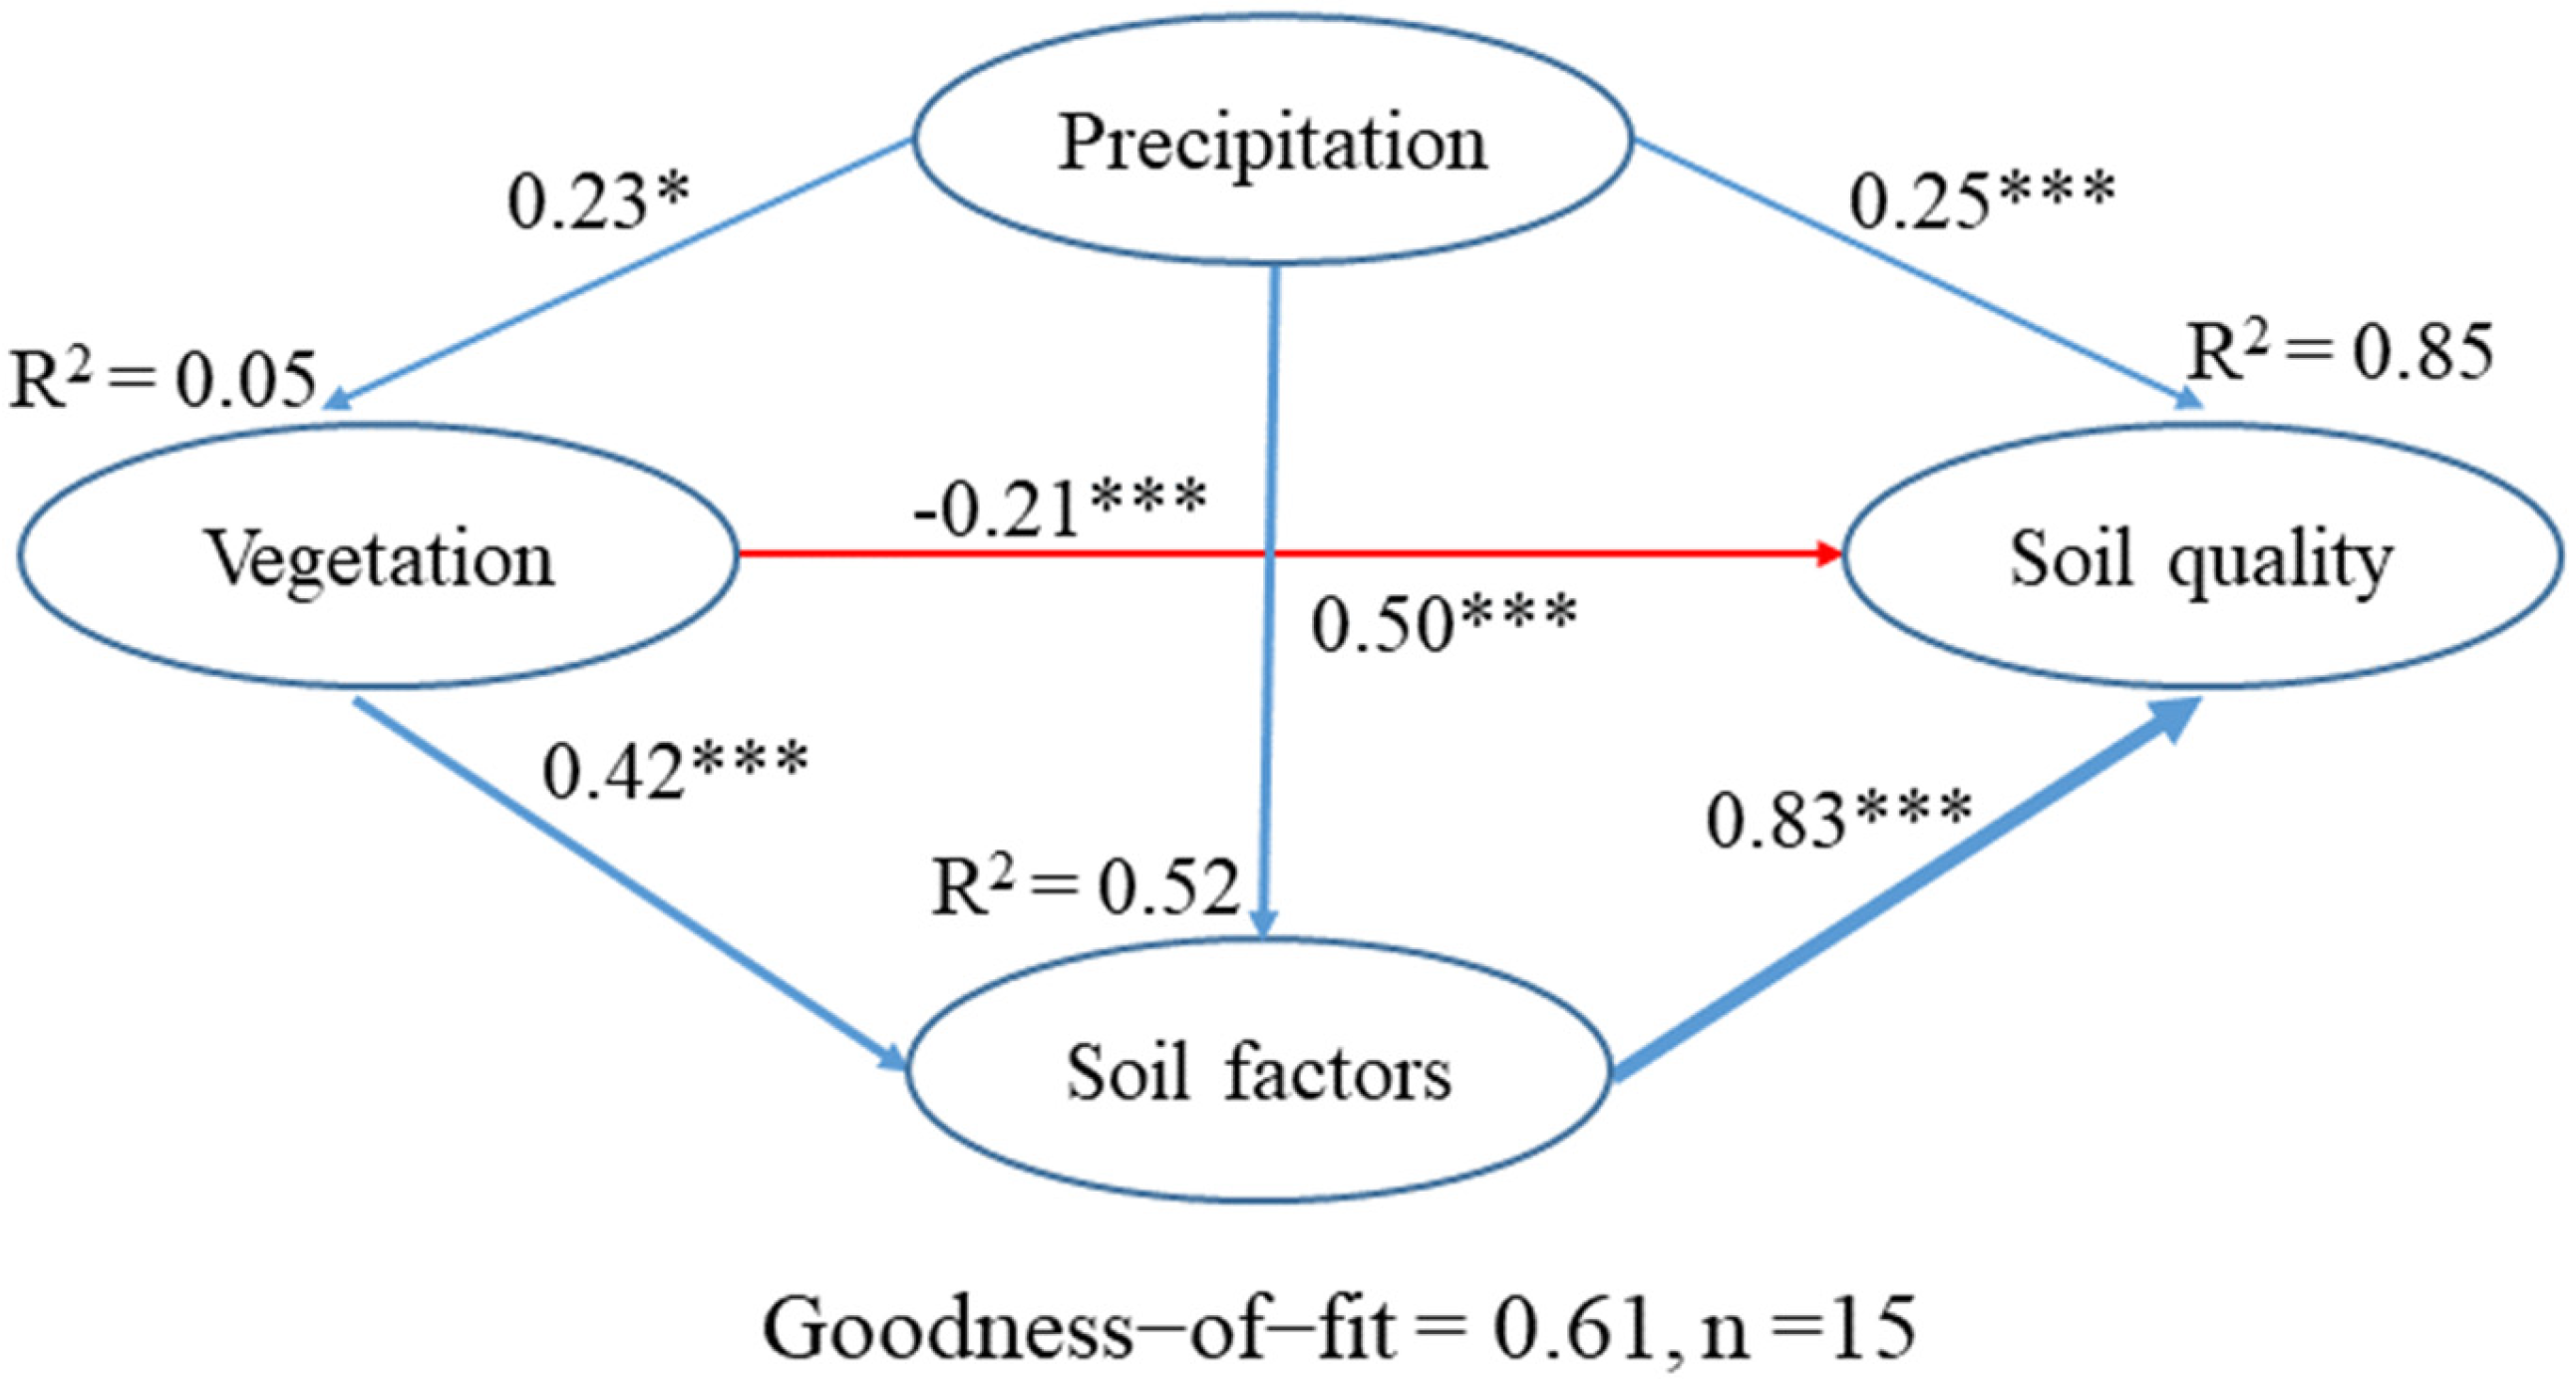
3.3.1. Relationship between Precipitation, Vegetation, Soil Factors and Soil Quality

To explore the interactive effects of precipitation, vegetation, soil factors and soil quality, we used the mean precipitation value for each gradient (402.5 mm for Changcheng, 442.5 mm for Jinfopingand and 465 mm for Baibao). The diameter at breast height, base diameter and tree height in the stand structure was used as indicators, and the soil factors were soil physical and chemical factors. These four were constructed using SEM, and the relationship diagram is shown in Figure 4. Precipitation, vegetation and soil factors jointly explained 85% of the structural variance in soil quality, with vegetation affecting soil quality, with a path coefficient of −0.21. Precipitation and soil factors had a positive impact on soil quality, with path coefficients of 0.25 and 0.83, respectively, indicating that soil factors significantly influenced soil quality. The indirect effects of precipitation and vegetation on soil quality were greater than their direct effects. Precipitation can directly or indirectly influence soil quality through vegetation and soil factors.

3.3.2. Dominant Factor Analysis of Soil Quality Based on Soil Factors

As shown in Figure 4, soil factors had a significant influence on soil quality. Furthermore, SEM was used to analyze the effects of soil factors on the SQI and the intensity of action, as shown in Figure 5. BD has a direct impact on SQI in the 400–410 mm precipitation area, where negative impacts are higher than positive impacts. BD had a direct negative impact on SQI in the 400–410 mm precipitation area. The indirect effects of AK and AP on SQI in this area were greater than their direct effects. In the 440–445 mm precipitation area, CP and BD had a direct negative impact on SQI, followed by SOC, AP and AN, which had an important impact on SQI, showing that the indirect impact was higher than the direct impact. In the 460–470 mm precipitation area, TCP and CWHC had a greater impact on SQI and a direct positive impact. TP and SOC also played important roles in the SQI impact. In different vegetation types, water-holding capacity and porosity are important factors affecting the SQI of arbors, and the influence of available nutrients is relatively small. The change in the physical structure of the soil is the main factor affecting the SQI of shrubs, but the available nutrients play an important role in affecting the SQI of shrubs, and the impact is higher than that of arbors. The SQI of the grasslands was mainly affected by EC and BD.

4. Discussion

4.1. Analysis of the Influence of Precipitation on Soil Quality

Precipitation affects the net primary yield of plants, and controlling detrital elements entering the soil can directly affect the soil nutrient status and indirectly affect microorganisms and enzyme activities [33], thus affecting soil quality. Relevant studies have pointed out [10] that below 370 mm of precipitation, the restriction of water on ecosystem services such as species diversity will become more intense, and it will also have a significant impact on soil quality, which can explain the results of this study. This study shows that the comprehensive indicator of soil quality of arbors, shrubs and grassland showed a decreasing trend with the decrease in precipitation, which may be due to the gradual decrease in precipitation from southeast to northwest in Wuqi County [24]. This hydrothermal distribution pattern controls the amount of vegetation biomass and litter decomposition processes, thus affecting soil quality. This study shows that the comprehensive indicator of soil quality of the three vegetation types showed an increasing trend with increasing precipitation. This may be because precipitation changes have an important impact on plant growth. Appropriate precipitation helps to promote biological activities in the soil and provides suitable living conditions for these organisms and promotes soil organic matter decomposition and nutrient release [34,35]. Secondly, precipitation can moisten soil particles, increase soil cohesion and stability, and reduce the possibility of wind erosion and water erosion [36]. Precipitation contains a certain amount of soluble nutrients, such as nitrogen, phosphorus, potassium, etc. These nutrients are essential for the growth and development of plants [37]. An increase in precipitation can effectively increase soil nutrients to a certain extent. In addition, studies have shown that when environmental conditions are dry, the impact of precipitation on soil quality is greater [38]. Therefore, with an increase in precipitation, the soil quality of the Loess Plateau significantly improved.

4.2. Analysis of the Influence of Vegetation on Soil Quality

Vegetation plays a key role in soil quality restoration, mainly acting on the soil through three processes: root growth [39], litter accumulation and decomposition [40] and biological activities [41]. This study found that the soil quality of different vegetation types was significantly different (p < 0.05). Compared with shrubs, the soil quality of arbors and grassland decreased with a decrease in precipitation, and the response to the precipitation gradient was stronger. This may be due to the differences in the demand for soil moisture by vegetation growth. This study showed that in the 440–445 mm precipitation area, the soil quality of arbors was higher than that of the other two gradients. This may be because the precipitation gradient area is close to the precipitation line suitable for tree growth [42], which meets the water demand of arbor growth and has a positive effect on the improvement of soil quality. However, an area with less precipitation does not meet its growing demand, resulting in poor soil quality, particularly in the 400–410 mm precipitation area. This study showed that the comprehensive indicator of soil quality in shrubland was the highest, the soil quality improvement effect in the study area was the best and the suitability was the strongest. This may be because shrub roots can secrete organic compounds, which have a positive effect on soil microorganisms and soil nutrients and also promote an increase in soil enzymes mainly derived from plant roots, soil microorganisms and animal and plant residues, which is conducive to the improvement of soil quality [43]. At the same time, some studies have shown that the soil aeration, water permeability and water conservation capacity of shrub forests are significantly higher than those of other land-use types [44], and the soil moisture consumption of shrubs is lower during the growing season [45], which is conducive to the maintenance of soil moisture. The roots of grasslands are mainly distributed in the 0–30 cm soil surface layer [46]. The roots are short, and the biomass is low, which has little effect on the soil, resulting in the improvement of soil quality under the three precipitation gradients that were lower than those of arbors and shrubs.

4.3. Analysis of Dominant Factors Affecting Soil Quality

Precipitation plays an important role in vegetation growth in arid and semi-arid regions. Vegetation is more sensitive to precipitation [47], and vegetation growth has a certain impact on soil properties [48], resulting in differences in soil quality. This study showed that precipitation can indirectly affect soil quality through its effects on vegetation. This may be due to vegetation, which primarily intercepts and redistributes precipitation through the canopy. This directly affects the amount of atmospheric precipitation that can reach the soil surface [49], and the effects of precipitation on vegetation growth stress are obvious [50,51]. At the same time, the results of this study also showed that vegetation has a direct negative impact on soil quality, which may be because tall trees consume more water and nutrients to maintain their growth and development [52]. However, in this study area, the overall precipitation was low, and evaporation was severe, resulting in a decline in vegetation growth, particularly in the precipitation area of 400–410 mm. As a result, the net primary productivity of vegetation is low [53], leading to a reduction in organic matter input into the soil and inhibition of soil nutrient cycling and microbial decomposition activities. Simultaneously, the surface microenvironment changes, vegetation coverage decreases and the soil surface is susceptible to erosion, which ultimately reduces soil quality. Furthermore, it is also possible that low precipitation has resulted in inadequate capacity to supply tall trees for growth, which in turn has led to a decline in soil quality.
This study showed that soil factors have a significant influence on soil quality. The soil bulk density, porosity and capillary water-holding capacity were important indices affecting soil quality in the study area. The soil bulk density is relatively low, the structure is relatively loose, the pores are numerous, the water storage and fertilizer retention capacity are strong and the soil quality is good. In contrast, the soil structure is compact, with few pores, poor water permeability, low water storage and fertilizer retention performance and poor soil quality [54]. It is concluded that under different precipitation gradients, how to effectively improve soil quality, the focus is on the improvement of soil structure and soil moisture supply, how to effectively hold water, prevent soil erosion caused by concentrated precipitation and prevent soil from being excessively dry. Soil moisture caused by soil caking cannot be replenished in time, affecting soil quality. Therefore, the selection of tree species is particularly important for vegetation restoration in arid and semi-arid regions. This study shows that soil organic carbon and total phosphorus are also important indices affecting soil quality, which are directly related to plant growth and nutrient supply [55], which is consistent with previous research results. This study showed that increased precipitation leads to increased soil water availability, which can accelerate solute transport, nutrient cycling and substrate diffusion to soil microorganisms [13] and can effectively increase soil nutrients to a certain extent. This study showed that the soil quality indicator of shrublands was the highest under the 400–470 mm rainfall gradient, and it was significantly higher than that of trees and grassland under the 400–410 mm rainfall gradient. This may be due to the hilly and gully regions of loess; compared with trees, shrubs have weaker water consumption capacity, better community structure, lush branches and leaves and high canopy density and can form dense forest canopies and litter layers and develop root layers, which is conducive to reducing the ineffective consumption of water [56,57]. This study also showed that shrublands have strong permeability, water retention and nitrogen fixation capacity. Therefore, it is suggested that under a rainfall gradient of 400–410 mm, vegetation planting mainly consists of shrubs. This study also showed that when the precipitation was greater than 440 mm, the improvement in grassland soil quality (42.86%) was much higher than that of arbors (21.15%) (Figure 3f). Related studies have also shown that the forest–grass composite model significantly improves soil physical and chemical properties, reduces soil density, increases soil porosity and water storage and increases soil organic matter and available nutrient content [57,58], which could effectively improve soil quality. Therefore, it is suggested that the rainfall range of 440–470 mm in the study area should be restored using the vegetation construction mode with shrubs and grasslands.

5. Conclusions

Studies have shown that soil physical and chemical indicators of different vegetation types vary with precipitation. The soil quality of the three vegetation types increased with increasing precipitation. The soil quality of the shrubland was the highest, and the soil quality was improved. The soil quality percentage of arbors and grasslands increased relatively higher, and the soil quality increased significantly with an increase in the precipitation gradient. There is a close relationship between precipitation, vegetation, soil factors and soil quality. Soil factors affected the soil quality directly. Precipitation and vegetation mainly affected soil quality indirectly through soil factors. Soil bulk density, porosity, capillary water-holding capacity, soil organic carbon and total phosphorus were the dominant factors affecting soil quality in the study area. Therefore, in the process of improving soil quality in the study area in the future, the improvement of soil structure and soil effective water-holding capacity should be considered. Under a precipitation gradient of 400–410 mm, the vegetation planting is mainly shrubs. When precipitation is 440–470 mm, the vegetation construction mode of shrubs and grasses is recommended for vegetation restoration.

Author Contributions

Conceptualization, T.X., N.A., Y.L. and F.Q.; methodology, T.X., N.A., H.M. and C.L.; software, T.X. and H.M.; validation, T.X., N.A. and G.L.; formal analysis, T.X.; investigation, T.X. and N.A.; data curation, T.X.; writing—original draft preparation, T.X.; writing—review and editing, T.X. and N.A.; visualization, T.X., H.M. and N.A.; supervision, F.Q., N.A., G.L.,Y.L. and C.L.; project administration, N.A. and H.M.; All authors have read and agreed to the published version of the manuscript.

Funding

This study was funded by the National Natural Science Foundation of China (U2243601), Shaanxi Natural Science Basic Research Project (2021JQ-982), Key projects of ecological space governance in Shaanxi Province (2022HZ1852), China Institute of Water Resources and Hydropower Research (IWHR) R&D Support Programs (SC0145C022023, SC0202A012018), Yan’an University Graduate Education Innovation Program Project (YCX2023083). And The APC was funded by U2243601.

Institutional Review Board Statement

Not applicable.

Informed Consent Statement

Not applicable.

Data Availability Statement

Data available on request from the corresponding authors.

Acknowledgments

The authors greatly appreciate the assistance of Rui Gao, Jiafeng Qin, Kaixuan Zang, Jiahao Shi, Zhengzheng Nan, Qianwen Ren, Jie Wang and Zeyang Wu.

Conflicts of Interest

The authors declare that they have no known competing financial interest or personal relationships that could have appeared to influence the work reported in this paper.

References

  1. Duan, C.; Li, X.; Chai, Y.; Xu, W.; Su, L.; Ma, P.; Yang, X. Effects of different restoration measures on plant communities and soil nutrients in degraded alpine meadow of the Yellow River source. Acta Ecol. Sin. 2022, 42, 7652–7662. [Google Scholar]
  2. Wu, G.L.; Liu, Y.F.; Cui, Z.; Liu, Y.; Shi, Z.H.; Yin, R.; Kardol, P. Trade-off between vegetation type, soil erosion control and surface water in global semi-arid regions: A meta-analysis. J. Appl. Ecol. 2020, 57, 875–885. [Google Scholar] [CrossRef]
  3. Gu, C.; Mu, X.; Gao, P.; Zhao, G.; Sun, W.; Tatarko, J.; Tan, X. Influence of vegetation restoration on soil physical properties in the Loess Plateau, China. J. Soils Sediments 2019, 19, 716–728. [Google Scholar] [CrossRef]
  4. Hartmann, M.; Six, J. Soil structure and microbiome functions in agroecosystems. Nat. Rev. Earth Environ. 2023, 4, 4–18. [Google Scholar] [CrossRef]
  5. Wang, B.; Guobin, L. Effect of topography on soil nutrient loss in slope land in loess hilly region. J. Soil Eros. Soil Water Conserv. 1999, 5, 19–23. [Google Scholar]
  6. He, J.; Shi, X.; Fu, Y. Identifying vegetation restoration effectiveness and driving factors on different micro-topographic types of hilly Loess Plateau: From the perspective of ecological resilience. J. Environ. Manag. 2021, 289, 112562. [Google Scholar] [CrossRef]
  7. Song, W.; Feng, Y.; Wang, Z. Ecological restoration programs dominate vegetation greening in China. Sci. Total Environ. 2022, 848, 157729. [Google Scholar] [CrossRef]
  8. Qasim, S.; Gul, S.; Shah, M.H.; Hussain, F.; Ahmad, S.; Islam, M.; Rehman, G.; Yaqoob, M.; Shah, S.Q. Influence of grazing exclosure on vegetation biomass and soil quality. Int. Soil Water Conserv. Res. 2017, 5, 62–68. [Google Scholar] [CrossRef]
  9. Dong, L.; Li, J.; Zhang, Y.; Bing, M.; Liu, Y.; Wu, J.; Hai, X.; Li, A.; Wang, K.; Wu, P. Effects of vegetation restoration types on soil nutrients and soil erodibility regulated by slope positions on the Loess Plateau. J. Environ. Manag. 2022, 302, 113985. [Google Scholar] [CrossRef]
  10. Zhang, Q.; Wei, W.; Chen, L.; Yang, L. Distribution pattern of soil moisture and species diversity along precipitation gradient in grassland of Loess Plateau. J. Nat. Resour. 2018, 33, 1351–1362. [Google Scholar]
  11. Chen, G.; Huang, Y.; Chen, J.; Wang, Y. Spatiotemporal variation of vegetation net primary productivity and its responses to climate change in the Huainan Coal Mining Area. J. Indian Soc. Remote Sens. 2019, 47, 1905–1916. [Google Scholar]
  12. McGuire, K.L.; Treseder, K.K. Microbial communities and their relevance for ecosystem models: Decomposition as a case study. Soil Biol. Biochem. 2010, 42, 529–535. [Google Scholar] [CrossRef]
  13. Wei, X.; Huang, Q.; Huang, S.; Leng, G.; Qu, Y.; Deng, M.; Han, Z.; Zhao, J.; Liu, D.; Bai, Q. Assessing the feedback relationship between vegetation and soil moisture over the Loess Plateau, China. Ecol. Indic. 2022, 134, 108493. [Google Scholar] [CrossRef]
  14. Camps, A.; Park, H.; Pablos, M.; Foti, G.; Gommenginger, C.P.; Liu, P.-W.; Judge, J. Sensitivity of GNSS-R spaceborne observations to soil moisture and vegetation. IEEE J. Sel. Top. Appl. Earth Obs. Remote Sens. 2016, 9, 4730–4742. [Google Scholar] [CrossRef]
  15. Ilstedt, U.; Nordgren, A.; Malmer, A. Optimum soil water for soil respiration before and after amendment with glucose in humid tropical acrisols and a boreal mor layer. Soil Biol. Biochem. 2000, 32, 1591–1599. [Google Scholar] [CrossRef]
  16. Yan, Z.; Qi, Y.; Li, S.; Dong, Y.; Peng, Q.; He, Y.; Li, Z. Research progress on the effects of increased precipitation and nitrogen deposition on grassland soil microorganisms and enzyme activities. Microbiology 2017, 44, 1481–1490. [Google Scholar]
  17. Luo, L.; Du, S. Research progress on the effect of rainfall gradient on temperature sensitivity of forest soil respiration. J. Northwest For. Univ. 2023, 38, 1–9. [Google Scholar]
  18. Peng, K.; Jiang, W.; Hou, P.; Sun, C.; Zhao, X.; Xiao, R. Spatial and temporal changes of vegetation and its influencing factors in Sanjiangyuan National Park. Chin. J. Ecol. 2020, 39, 3388–3396. [Google Scholar]
  19. Chen, H.; Shao, M.; Wang, K. Effects of initial soil water content on rainfall infiltration and soil water redistribution on slope. Agric. Eng. 2006, 22, 44–47. [Google Scholar]
  20. Yan, W.; Zhou, Q.; Peng, D.; Luo, Y.; Chen, M.; Lu, Y. Response of surface-soil quality to secondary succession in karst areas in Southwest China: Case study on a limestone slope. Ecol. Eng. 2022, 178, 106581. [Google Scholar] [CrossRef]
  21. Xu, M.; Gao, D.; Fu, S.; Lu, X.; Wu, S.; Han, X.; Yang, G.; Feng, Y. Long-term effects of vegetation and soil on the microbial communities following afforestation of farmland with Robinia pseudoacacia plantations. Geoderma 2020, 367, 114263. [Google Scholar] [CrossRef]
  22. Sun, L.; Zhang, G.; Luan, L.; Li, Z.; Geng, L. Distribution of surface soil organic carbon along precipitation gradient in loess hilly region. J. Appl. Ecol. 2016, 27, 532–538. [Google Scholar]
  23. Geng, L.; Zhang, G.; Hong, D.; Li, Z. Variation characteristics of soil aggregate stability along precipitation gradient in farmland grassland forest land of Loess Plateau. Agric. Eng. 2019, 35, 141–148. [Google Scholar]
  24. Puyang, X.; Wang, C.; Gou, Q.; Zhao, Z.; Huang, J. Study on the relationship between vegetation community characteristics and soil moisture in loess area of northern Shaanxi. Acta Pratacult. Sin. 2019, 28, 184–191. [Google Scholar]
  25. Institute of Soil Science, Chinese Academy of Sciences. Soil Physical Properties Determination Method; Science Press: Beijing, China, 1978; pp. 2, 4, 6. [Google Scholar]
  26. Bao, S. Soil Agrochemical Analysis; China Agriculture Press: Beijing, China, 2000; pp. 2–10. [Google Scholar]
  27. Li, P.; Zhang, X.; Hao, M.; Zhang, Y.; Chui, Y.; Zhu, S. Evaluation of reclaimed soil quality in mining area of Loess Plateau based on minimum data set. Agric. Eng. 2019, 35, 265–273. [Google Scholar]
  28. Yu, B.; Liu, G.; Liu, Q.; Feng, J.; Wang, X.; Chung, H.K.; Zhao, Z.; Yang, J. Soil nutrient effect of Robinia pseudoacacia forest with different years of returning farmland in loess hilly region of western Shanxi. J. Soil Water Conserv. 2016, 30, 188–193. [Google Scholar]
  29. Zhang, Z.; Ai, N.; Liu, G.; Liu, C.; Zong, Q.; Liu, J.; Hao, B. Soil quality characteristics of returning farmland to forest (grassland) and its response to precipitation in loess area of northern Shaanxi. Agric. Eng. 2020, 36, 73–80. [Google Scholar]
  30. Li, Q.; Xu, M.; Zhao, Y.; Gao, L.; Zhang, J.; Zhang, X. Soil quality evaluation of gully erosion on slope farmland in Loess Plateau. J. Nat. Resour. 2012, 27, 1001–1012. [Google Scholar]
  31. Shao, G.; Ai, J.; Sun, Q.; Hou, L.; Dong, Y. Soil quality assessment under different forest types in the Mount Tai, central Eastern China. Ecol. Indic. 2020, 115, 106439. [Google Scholar] [CrossRef]
  32. Jin, H.; Lou, D.; Zhang, Y.B.; Ye, J.; Na, Q. Evaluation of the quality of cultivated-layer soil based on different degrees of erosion in sloping farmland with purple soil in China. Catena 2021, 198, 105048. [Google Scholar] [CrossRef]
  33. Landesman, W.J.; Dighton, J. Response of soil microbial communities and the production of plant-available nitrogen to a two-year rainfall manipulation in the New Jersey Pinelands. Soil Biol. Biochem. 2010, 42, 1751–1758. [Google Scholar] [CrossRef]
  34. Tarafdar, J. Role of Soil Biology on Soil Health for Sustainable Agricultural Production, Structure and Functions of Pedosphere; Springer Nature: Singapore, 2022; pp. 67–81. [Google Scholar]
  35. Lakshmi, G.; Okafor, B.N.; Visconti, D. Soil microarthropods and nutrient cycling. In Environment, Climate, Plant and Vegetation Growth; Springer: Berlin/Heidelberg, Germany, 2020; pp. 453–472. [Google Scholar] [CrossRef]
  36. Tanner, S.; Ben-Hur, M.; Argaman, E.; Katra, I. The effects of soil properties and aggregation on sensitivity to erosion by water and wind in two Mediterranean soils. Catena 2023, 221, 106787. [Google Scholar] [CrossRef]
  37. Ren, C.; Chen, J.; Lu, X.; Doughty, R.; Zhao, F.; Zhong, Z.; Han, X.; Yang, G.; Feng, Y.; Ren, G. Responses of soil total microbial biomass and community compositions to rainfall reductions. Soil Biol. Biochem. 2018, 116, 4–10. [Google Scholar] [CrossRef]
  38. Guo, S.; Xu, Y.; He, C.; Wu, S.; Yang, G. Differential responses of soil quality in revegetation types to precipitation gradients on the Loess Plateau. Agric. For. Meteorol. 2019, 276–277, 107622. [Google Scholar] [CrossRef]
  39. Zheng, M.; Huang, G.; Peng, J. Pull-out resistance characteristics of Magnolia multiflora roots at different growth stages and stability of root slope. Agric. Eng. 2018, 34, 175–182. [Google Scholar]
  40. Giweta, M. Role of litter production and its decomposition, and factors affecting the processes in a tropical forest ecosystem: A review. J. Ecol. Environ. 2020, 44, 11. [Google Scholar] [CrossRef]
  41. Liu, G.; Chen, L.; Deng, Q.; Shi, X.; Lock, T.R.; Kallenbach, R.L.; Yuan, Z. Vertical changes in bacterial community composition down to a depth of 20 m on the degraded Loess Plateau in China. Land Degrad. Dev. 2020, 31, 1300–1313. [Google Scholar] [CrossRef]
  42. Xu, Z.; Zhang, N.; Wang, R.; Yang, X.; Sun, S.; Yan, T. Ecological Water Requirement of Different Vegetation Types in Bashang Area of Northwest Hebei Province. J. Resour. Ecol. 2022, 13, 113–119. [Google Scholar]
  43. Li, L.; Liang, X.; Ye, Y.; Zhao, Y.; Zhang, Y.; Jin, Y.; Yuan, J.; Chen, Y. Effects of repeated swine manure applications on legacy phosphorus and phosphomonoesterase activities in a paddy soil. Biol. Fertil. Soils 2015, 51, 167–181. [Google Scholar] [CrossRef]
  44. Huang, X.; Zhao, Y.; Xin, Z.; Qin, Y.; Yi, Y. Effects of typical land use patterns on soil physical and chemical properties and erodibility in Beijing mountainous area. Soil Water Conserv. 2015, 22, 5–10. [Google Scholar]
  45. Li, X.; Duan, Z.; Tan, M.; Chen, X. Study on the relationship between vegetation distribution and soil moisture under different precipitation conditions in the western hilly area of the Loess Plateau. Chin. J. Soil Sci. 2014, 45, 364–369. [Google Scholar]
  46. Bai, Y.; Su, J.; Cheng, J. Root biomass distribution of natural grassland in different enclosure periods in loess area. Sci. Grass Ind. 2013, 30, 1824–1830. [Google Scholar]
  47. Zhu, Y.; Du, L.; Xie, Y.; Liu, K.; Gong, F.; Yan, D.; Wang, L.; Zheng, Q. Spatial-temporal characteristics and climate response of grassland net primary productivity in Ningxia from 2000 to 2015. Acta Ecol. Sin. 2019, 39, 518–529. [Google Scholar]
  48. Xiong, Y.; Feng, T.; Wang, P.; Wu, X. Effects of long-term artificial forest restoration on soil moisture and nutrient properties in loess area of western Shanxi Province. J. Soil Water Conserv. 2022, 36, 228–237+246. [Google Scholar]
  49. Zhang, D.; Li, X.; Zhang, P. The significance of eco-hydrological threshold in the management of artificial vegetation ecosystem in sandy areas of China. Chin. Desert 2017, 37, 678–688. [Google Scholar]
  50. Liu, X.; Zhou, W.; Bai, Z. Vegetation coverage change and stability in large open-pit coal mine dumps in China during 1990–2015. Ecol. Eng. 2016, 95, 447–451. [Google Scholar] [CrossRef]
  51. Li, F.; Song, G.; Liujun, Z.; Yanan, Z.; Di, L. Urban vegetation phenology analysis using high spatio-temporal NDVI time series. Urban For. Urban Green 2017, 25, 43–57. [Google Scholar] [CrossRef]
  52. Len, X. Analysis of tree maintenance management in forestry engineering. New Agric. 2022, 16, 50–51. [Google Scholar]
  53. Li, Z.; Pan, J. Spatiotemporal changes in vegetation net primary productivity in the arid region of Northwest China, 2001 to 2012. Front. Earth Sci. 2018, 12, 108–124. [Google Scholar] [CrossRef]
  54. Liu, Q.; Mu, X.; Gao, P.; Zhao, G.; Sun, W.; Zhang, W.; Gao, Y.; Yang, S.; Qiu, T. A review of the effects of soil hydraulic erosion on and chemical indexes of soil quality. Soil Water Conserv. 2020, 27, 386–392. [Google Scholar]
  55. Chen, A.; Wang, G.; Chen, C.; Li, S.; Li, W. Stoichiometric characteristics of nitrogen and phosphorus in leaf-root-soil of Chinese fir forest at different ages in subtropical zone. Acta Ecol. Sin. 2018, 38, 4027–4036. [Google Scholar]
  56. Cai, Y.; Wang, H. Soil moisture dynamics of different vegetation types in hilly and gully region of Loess Plateau. Soil Water Conserv. 2006, 13, 79–81. [Google Scholar]
  57. Xia, J.; Ren, J.; Zhang, S.; Wang, Y.; Fang, Y. Forest and grass composite patterns improve the soil quality in the coastal saline-alkali land of the Yellow River Delta, China. Geoderma 2019, 349, 25–35. [Google Scholar] [CrossRef]
  58. Sun, J.; Xia, J.B.; Su, L.; Zhao, X.M.; Li, C.R. Soil amelioration of different vegetation types in saline-alkali land of the Yellow River Delta, China. Ying Yong Sheng Tai Xue Bao = J. Appl. Ecol. 2020, 31, 1323–1332. [Google Scholar]
Figure 1. Basic information on the sampling points.
Forests 14 01909 g001
Figure 2. Weight of each indicator.
Forests 14 01909 g002
Figure 3. Changes in the soil quality indicator of different vegetation types with precipitation gradient. Note: Different lowercase letters indicate significant differences between different vegetation types of soil quality under the same precipitation gradient (p < 0.05). Different capital letters indicate significant differences between different precipitation gradients for the same vegetation type of soil quality (p < 0.05).
Forests 14 01909 g003
Figure 4. Relationship between precipitation, vegetation, soil factors and soil quality. The blue arrow indicates a positive impact, the red arrow indicates a negative impact, the solid arrows indicate significant impacts and the thickness indicates the size of the path coefficient. *** represents a significant correlation at the 0.001 level and * represents a significant correlation at the 0.05 level.
Forests 14 01909 g004
Figure 5. Influence of different dominant factors on the SQI. (ac) represent arbors, shrubs and grassland in the 400–410 mm precipitation area, respectively. (df) are the arbors, shrubs and grassland in the 440–445 mm precipitation areas, respectively. (gi) represent arbors, shrubs and grasslands in the 460–470 mm precipitation area, respectively. The red arrow indicates a significant positive impact, the blue arrow indicates a significant negative impact, the solid arrows indicate significant impacts, the dotted arrow indicates no significant impact and the thickness indicates the size of the path coefficient. *** represents a significant correlation at the 0.001 level, ** represents a significant correlation at the 0.01 level, and * represents a significant correlation at the 0.05 level.
Forests 14 01909 g005
Table 1. Basic information on the sample sites.
Precipitation GradientAnnual Mean Precipitation/mmVegetationAspectRestoration
Years/a
Altitude/mSlope/°Crown Density/%Diameter at
Breast
Height/cm
Base
Diameter
/cm
Tree Height/m
Changcheng400~410P × HShady slope301505.7233013.75/13.5
HRShady slope81534.93140/2.461.5
GLShady slope/1520.72660///
Jinfoping440~445P × HShady slope301331.6207519.48/15
HRShady slope814302570/3.532
GLShady slope/1400.32885///
Baibao460~470P × HShady slope301484.1258530.25/20
HRShady slope815453075/4.053
GLShady slope/1580.92590///
Note: P × H, HR and GL represent Populus X hopeiensis, Hippophae rhamnoides and grassland, respectively.
Table 2. Soil indicator measurement.
Soil IndicatorsMeasurement MethodsMembership Functions
Soil water content (SWC)Drying method.Ascending membership function
Soil bulk density (BD)Ring knife method.Descending membership function.
Non-capillary porosity (NCP), total capillary porosity (TCP), capillary porosity (CP), maximum water-holding capacity (maxWHC), capillary water-holding capacity (CWHC)Ring knife method.Ascending membership function
Soil organic carbon content (SOC)Potassium dichromate oxidation method.Ascending membership function
Soil available potassium (AK)NH4 OAc-flame photometry.Ascending membership function
Soil alkali nitrogen (AN)Alkaline hydrolysis-diffusion absorption method.Ascending membership function
Soil available phosphorus (AP)Extraction with 0.5 mol·L−1 NaHCO3 and silica-molybdenum blue colorimetry.Ascending membership function
Soil total nitrogen (TN)Sulfuric acid digestion-sodium salicylate and adjust with NaOH method.Ascending membership function
Soil total phosphorus (TP)NaOH melting-molybdenum
antimony colorimetric method.
Ascending membership function
Soil pH1:2.5 soil-to-water ratio using a pH-320 m.Descending membership function.
Electrical conductivity (EC)Conductivity method.Descending membership function.
Table 3. Statistics of soil quality indices for different vegetation types under different precipitation gradients.
Sample Plot400~410 mm440~445 mm460~470 mm
P × HHRGLP × HHRGLP × HHRGL
SWC (%)8.07 ± 0.499.01 ± 0.31 9.55 ± 0.318.43 ± 0.3317.32 ± 0.3823.42 ± 1.2320.02 ± 0.6814.75 ± 1.3519.04 ± 0.67
CbCaCaBaAbAaAbBcBa
BD (g/cm3)1.38 ± 0.041.29 ± 0.02 1.38 ± 0.031.29 ± 0.09 1.31 ± 0.071.44 ± 0.091.16 ± 0.091.18 ± 0.041.15 ± 0.05
AaAbAaABaAaAaBbBbBb
maxWHC (%)33.63 ± 1.3439.8 ± 1.2 33.47 ± 0.4237.65 ± 3.9937.98 ± 2.430.46 ± 1.1143.31 ± 5.1743.37 ± 2.0227.98 ± 3.8
BbABaAbABaBaBbAaAaBa
CWHC (%)28.4 ± 0.435.25 ± 0.7830.34 ± 0.5834.01 ± 2.3232.64 ± 0.928.75 ± 1.3736.52 ± 2.3937.59 ± 1 28.81 ± 1.53
BcBaBbAabCbBbAaAaBa
NCP (%)7.51 ± 1.966.54 ± 1.734.91 ± 1.323.66 ± 1.96.72 ± 1.933.48 ± 0.448.48 ± 3.38 8.02 ± 2.6610.52 ± 2.63
AaAaBaAaAabBaAaAaAa
CP (%)39.23 ± 144.93 ± 0.8241.4 ± 0.4344.09 ± 1.2742.26 ± 1.4842.7 ± 1.1842.12 ± 1.0844.5 ± 0.9141.86 ± 1.94
BcAaAbAaAaAaAaAaAa
TCP (%)46.74 ± 1.6451.48 ± 1.0446.31 ± 1.6547.75 ± 2.648.97 ± 1.1646.18 ± 1.0350.6 ± 3.0352.52 ± 1.9452.38 ± 2.38
AbABaBbAaBaBbAabAaAa
SOC (g/kg)7.42 ± 0.497.28 ± 1.17.5 ± 3.478.32 ± 1.1810.9 ± 4.032.99 ± 0.6910.55 ± 0.968.42 ± 1.7214.24 ± 1.33
BaAaBaBaAaBbAaAaAa
EC (μs/cm)75.64 ± 2.2690.63 ± 8.7378.09 ± 7.1489.4 ± 3.2390.32 ± 5.4882.15 ± 6.9691.43 ± 4.5291.75 ± 5.3992.6 ± 6.05
BaAaAaAaAaAaAaAaAa
pH8.43 ± 0.058.43 ± 0.148.38 ± 0.078.35 ± 0.06 8.17 ± 0.078.44 ± 0.138.27 ± 0.098.29 ± 0.098.14 ± 0.08
AaAaAaBaBbAaCbABbBb
AN (mg/kg)0.75 ± 0.451.17 ± 0.52 1.79 ± 0.860.88 ± 0.58 5.79 ± 2.490.89 ± 0.14.83 ± 0.510.43 ± 0.966.13 ± 1.32
BaCaBaBbBaBcAbAaAa
AP (mg/kg)5.84 ± 1.334.99 ± 0.376.25 ± 2.3 6.12 ± 0.49 7.79 ± 1.2 7.09 ± 0.217.37 ± 1.28 7.73 ± 2.17 8.27 ± 0.75
AaAaAaAbAabAaAaAaAa
AK (mg/kg)57.89 ± 4.5164.33 ± 7.4233.11 ± 8.9696.56 ± 6.4338 ± 11.51 53.78 ± 8.16105.67 ± 8.2173.22 ± 5.9242 ± 6.72
BaBaBbAaAbAcAaAbABb
TN (g/kg)0.1 ± 0.030.28 ± 0.13 0.22 ± 0.060.42 ± 0.14 0.46 ± 0.2 0.23 ± 0.060.37 ± 0.170.6 ± 0.22 0.2 ± 0.07
AaAaAaAaAaAaAaAaAa
TP (g/kg)0.27 ± 0.060.18 ± 0.040.09 ± 0.020.25 ± 0.08 0.09 ± 0.030.08 ± 0.040.11 ± 0.05 0.14 ± 0.030.08 ± 0.03
AaAaAbABaBbAaBaABaAb
Note: Different lowercase letters indicate significant differences between different vegetation types under the same precipitation gradient (p < 0.05). Different capital letters indicate significant differences between different precipitation gradients for the same vegetation type (p < 0.05).
Disclaimer/Publisher’s Note: The statements, opinions and data contained in all publications are solely those of the individual author(s) and contributor(s) and not of MDPI and/or the editor(s). MDPI and/or the editor(s) disclaim responsibility for any injury to people or property resulting from any ideas, methods, instructions or products referred to in the content.

