Article

Ultra-High-Density Genetic Maps of Jatropha curcas × Jatropha integerrima and Anchoring Jatropha curcas Genome Assembly Scaffolds

1
TERI School of Advanced Studies, 10 Institutional Area, Vasant Kunj, New Delhi 110070, India
2
The Energy and Resources Institute, IHC Complex, Lodhi Road, New Delhi 110003, India
3
Faculty of Forestry and Environmental Management, University of New Brunswick, P.O. Box 44000, 28 Dineen Drive, Fredericton, NB E3B 5A3, Canada
*
Authors to whom correspondence should be addressed.
Forests 2023, 14(9), 1907; https://doi.org/10.3390/f14091907
Submission received: 31 July 2023 / Revised: 10 September 2023 / Accepted: 13 September 2023 / Published: 19 September 2023
(This article belongs to the Section Genetics and Molecular Biology)

Abstract

:
Genetic maps facilitate an understanding of genome organization and the mapping of genes and QTLs for traits of interest. Our objective was to develop a high-density genetic map of Jatropha and anchoring scaffolds from genome assemblies. We developed two ultra-high-density genetic linkage maps of Jatropha curcas × Jatropha intergerrima using a backcross (BC1) population using SNP, AFLP and SSR markers. First, SNPs were identified through genotyping-by-sequencing (GBS). The polymorphic SNPs were mapped to 3267 Jat_r4.5 scaffolds and 484 Wu_JatCur_1.0 scaffolds, and then these genomic scaffolds were mapped/anchored to the genetic linkage groups along with the AFLP and SSR markers for each genome assembly separately. We successfully mapped 7284 polymorphic SNPs, and 54 AFLP and SSR markers on 11 linkage groups using the Jat_r4.5 genomic scaffolds, resulting in a genome length of 1088 cM and an average marker interval of 0.71 cM. We mapped 7698 polymorphic SNPs, and 99 AFLP and SSR markers on 11 linkage groups using the Wu_JatCur_1.0 genomic scaffolds, resulting in a genome length of 870 cM and an average marker interval of 1.67 cM. The mapped SNPs were annotated to various regions of the genome, including exon, intron and intergenic regions. We developed two ultra-high-density linkage maps anchoring a high number of genome scaffolds to linkage groups, which provide an important resource for the structural and functional genomics as well as for molecular breeding of Jatropha while also serving as a framework for assembling and ordering whole genome scaffolds.

1. Introduction

Genetic maps provide an important genomic resource for understanding genome organization, evolution, comparative genomics, and for mapping genes and quantitative trait loci (QTLs) for phenotypic traits [1]. Marker-assisted selection (MAS) is a widely used strategy to improve the selection and breeding efficiency for the genetic improvement of various economically and ecologically important traits in plants. However, the use of MAS requires the knowledge of genetic markers tightly linked to the target trait QTLs. The availability of a high-density linkage map is essential for identifying markers linked to a particular trait or quantitative trait loci (QTLs) controlling a trait [2]. Besides QTL mapping, linkage maps are important for the positional cloning of genes [3]. Therefore, the development of high-density genetic maps in biofuel-producing plants can facilitate MAS for biofuel-related traits and can also provide important genomic resources for basic and applied research.
Biofuels have received significant attention from researchers and policy makers in the past 20 years. Besides being an alternative source of energy, they have additional environmental benefits, such as being carbon-neutral or having lower greenhouse gas emissions in comparison with petroleum fuels [4]. Consequently, several plant species have been recognized as potential sources of biofuels (both biodiesel and bioethanol). The physic nut, Jatropha curcas L., (hereafter Jatropha), has been the most widely proclaimed source of biodiesel due to its highly adaptive features, such as low-cost biodiesel feedstock, high cetane rating and low sulfur content, which provide clear advantages under resource-limiting environments [5]. Furthermore, as a nonedible shrub, Jatropha’s adaptive capabilities may keep it out of the food vs. fuel debate.
The biodiesel research on Jatropha began at the start of the current century, mainly in South Asia and Africa. Studies on genetic diversity using various molecular markers revealed that the African and South Asian collections of Jatropha had a very narrow genetic base [6,7,8,9,10]. On the other hand, the germplasm collections from Mexico and Central America were found to harbor a much higher genetic diversity, leading to these regions being proposed as the centers of origin for Jatropha [11,12]. As a biodiesel crop, oil content and seed yield are the major traits of interest in Jatropha. Developing high-yielding varieties with high oil content remains the major goal in Jatropha breeding. Other traits of economic importance in Jatropha that could be targeted for genetic improvement are low phorbol ester content, high oleic acid content, increased cold tolerance and resistance to pests and diseases. Considering that it is a yet-to-be-domesticated crop, there is high scope for genetic improvement of Jatropha.
Most of the populations of J. curcas have been shown to harbor very low genetic diversity [8,13,14]. This has been a major hindrance for linkage and QTL mapping studies and genetic improvement programs [15]. Interspecific hybridization is a useful method for increasing genetic diversity and generating material for crop improvement [16,17]. Further, mapping populations generated through interspecific hybridization are more efficient for the development of linkage maps due to high polymorphism between the parental genotypes.
Among different species of Jatropha found in India, J. integerrima has been found to be the most compatible with J. curcas, presumably due to its high genetic similarity with the latter [18,19]. Therefore, these two species have been widely used to increase genetic diversity through interspecific hybridization and for genetic linkage mapping [20]. J. integerrima has several desirable agronomic traits such as hard stems, increased cold tolerance, continuous flowering and reduced sap secretion. As the frequency of fruit set and maturation in J. integerrima is very low, J. curcas has been selected as the female parent and J. integerrima as the male parent in many studies. This was also necessary to retain the organelle genomes (chloroplast and mitochondrial) of J. curcas in the hybrid progeny due to its vigorous growth and other agroeconomic traits.
Based on the available genetic variability, both interspecific as well as intraspecific mapping populations have been used in Jatropha for linkage mapping [20,21,22,23,24,25]. The interspecific mapping populations are expected to have a higher proportion of segregating marker loci and are therefore preferred over intraspecific mapping populations. This is especially important when the genetic diversity within the available germplasm collections is low. The first linkage map in Jatropha was developed using a BC1 population derived from an interspecific cross between J. curcas and J. integerrima [20]. The map contained 216 EST-SSR and 290 SNP markers distributed on 11 linkage groups with an average marker-to-marker spacing of 2.8 cM and a total map length of 1440 cM. In a later study, King et al. [21] used intraspecific F2 populations for linkage mapping and identification of QTLs regulating phorbol ester (PE) content in seeds. The integrated map contained 502 SSR loci spanning a total distance of 717 cM. In Jatropha curcas, using an F1 population, Xia et al. [22] mapped 3422 amplified fragment single-nucleotide polymorphism and methylation (AFSM) markers on 11 linkage groups covering a length of 1380.6 cM, with a marker interval of 2.48 cM. Most recently, after we completed our current study, Yepuri and coworkers mapped 411 SNPs derived from genotyping-by-sequencing (GBS) on 11 linkage groups using a F2 population of J. curcas [23]. However, the total map length was extremely large, 4092.3 cM, which is quite inconsistent with other reported linkage map lengths in Jatropha. genotyping-by-sequencing (GBS) approach [26] provides a large number of genome-wide SNP markers, even in the species for which a reference genome is not available. Further, the GBS-SNP markers can be used to anchor genomic scaffolds to appropriate linkage groups and map positions within a linkage group [27].
Five genome sequencing projects have been reported for Jatropha so far in the NCBI database. The first Jatropha genome, published by Sato et al. [28], was 285.9 Mbp in size and contained 21,225 unigenes. This genome sequence was upgraded further with additional data in 2012 [29]. This upgraded genome sequence contains 39,277 scaffolds with a total span of about 298 Mb and is hosted at Kazusa DNA Research Institute Database (hereafter referred to as Jat_r4.5). The second reference genome, published by Wu et al. [24], is 318.4 Mb and contains 6024 scaffolds (and is hereafter referred to as Wu_JatCur_1.0). Efforts have been made to anchor these scaffolds on the Jatropha linkage map using different mapping populations. A linkage map described by King et al. [21] using intraspecific F2 populations could anchor 407 out of 39,277 scaffolds of the Jat_r4.5 genome. These mapped scaffolds corresponded to only 17 Mbp (6%) of the genome. Another linkage map was reported using an interspecific BC1 population [24] which contained 802 unique loci representing 480 scaffolds and about 81.7% of the assembled genome. However, the genomic positions of a good proportion of scaffolds from both the genome assemblies are still unknown and the scaffolds from these two genome assemblies have not been mapped in the same mapping population.
The aim of the present work was to develop a high-density linkage map of a Jatropha curcas and J. integerrima interspecific hybrid using SNPs from genotyping-by-sequencing and available AFLP and SSR markers and to anchor the scaffolds of the two publicly available highest-size genome assemblies (Wu_JatCur_1.0 and Jat_r4.5) on the genetic linkage maps. Our motivation was to develop this important genomic resource that can help with identifying genes and genetic factors underlying traits of importance and understanding the genomic relationships between the two parental species. This can facilitate selection and breeding of biofuel-related traits. Here, we report two ultra-high-density genetic linkage maps of J. curcas × J. integerrima.

2. Materials and Methods

2.1. Mapping Population and Plant Material Sampling

An interspecific backcross 1 (BC1) population of 91 individuals was used in this study. The BC1 population was derived from a cross between the J. curcas accession, Jc33, and the J. integerrima accession, JMP16, grown in Gurugram, Haryana, India (28.428171° N, 77.148150° E) [30]. One of the resultant interspecific hybrids, F1–01, was used as the pollen donor to cross-pollinate J. curcas (Jc33) flowers and to generate a backcross population of about 120 individuals (prefixed as BC1-). The BC1 plants were transplanted in the field at a spacing of 3 m × 2 m at TERI’s Jatropha Research Station in Eluru, Andhra Pradesh. At the time of leaf sample collection, the plants were fruiting. For all genotyping experiments, a set of 91 BC1 plants along with their parents was used. In total, 120 seeds were sown in the nursery, but only 91 plants survived after transplantation in the field at the time of leaf sample collection for DNA isolation.

2.2. DNA Extraction and Genotyping

DNA was isolated from the parents and the BC1 individuals using a CTAB-based method [31]. The parents and the BC1 progeny were genotyped using AFLP, microsatellite and SNP markers. The SNP markers were derived from genotyping-by-sequencing (GBS).

2.2.1. AFLP Genotyping

AFLP genotyping was performed according to Vos and coworkers [32], with minor modifications from Sharma et al. [33]. EcoRI primers labeled with IRDye700 or IRDye800 were procured commercially (Jena Bioscience GmbH, Jena, Germany) and used for selective amplification in combination with unlabeled MseI primers (Table 1). Gel electrophoresis and fragment detection were performed using a LICOR 4300 DNA analyzer (LICOR Biosciences, Lincoln, NA, USA).

2.2.2. SSR Genotyping

A set of 17 polymorphic microsatellite markers were used for genotyping the mapping population (Table 2). Twelve of these (W_Jatr series) were mapped earlier by Wang et al. [20], whereas the remaining five markers (TERI series) were developed by our group [34]. PCR conditions and fragment detection were carried out as described in [35].

2.2.3. Genotyping-by-Sequencing and SNPs

GBS Library Preparation

The restriction enzyme ApeKI was used for the GBS library preparation. This enzyme has been used extensively and reported to produce a smaller number of repeated amplicons in the majority of plant species [26]. The 96-plex GBS library included DNA samples from 91 BC1 individuals and both parents and a negative control. Briefly, individual DNA samples were digested with ApeKI, following which the adapters were ligated. The adapters used for ligation comprised a set of 96 different barcode-containing adapters and a “common” adapter (Supplementary Table S1).
Pooling of individual ligation reactions and purification of the pooled library were carried out using QIAquick PCR Purification Kit (Qiagen, Valencia, CA, USA). The overall library (96-plex) was then amplified in 50 µL reaction volumes using 5 µL of the pooled and purified library as template DNA, 1× PCR Mix (New England Biolabs) and 12.5 pmol of each of the following primers:
5′-3′
AATGATACGGCGACCACCGAGATCTACACTCTTTCCCTACACGACGCTCTTCCGATCT and
5′-3′
CAAGCAGAAGACGGCATACGAGATCGGTCTCGGCATTCCTGCTGAACCGCTCTTCCGATCT.
Thermal cycling parameters consisted of 72 °C for 5 min, 95 °C for 30 s followed by 18 cycles of 95 °C for 30 s, 65 °C for 10 s, and 72 °C for 30 s, with a final extension step at 72 °C for 5 min. The ApeKI GBS library was purified again as above, and an aliquot of 5 µL was evaluated on an Agilent BioAnalyzer 2100 for fragment sizes and the presence of adapter dimers. The 96-plex library was sequenced on a single lane of Illumina NextSeq 500. Genotyping-by-sequencing, including library preparation, was carried out using the services of a commercial genotyping facility located at Cornell University, Ithaca, NY, USA.

Processing of Raw Data Files, SNP Calling

The raw Illumina DNA sequence data (100 nucleotide FastQ files) were processed through the GBS analysis pipeline as implemented in TASSEL v5.0 [36] and are available at www.maizegenetics.net/tassel (access date: 30 March 2021). To determine the depth and genome coordinates, sequence tags were aligned to the available reference genome assemblies, namely Jat_r4.5 [29], accessed from Kazusa Genome Database at http://www.kazusa.or.jp/e/resources/database.html (access date: 18 July 2022), and GCF_000696525.1_JatCur_1.0 [24], accessed from the NCBI database and henceforth referred to as Wu_JatCur_1.0 reference for the sake of simplicity. The Bowtie 2 [37] tool available on the web-based platform Galaxy [38] was used for aligning the tags with the reference genome assemblies.
SNP calls were converted to HapMap files. As two reference genomes were used for SNP calling, two HapMap files containing GBS-SNP genotype data were obtained. Further, filtering of GBS-SNPs was performed using the program TASSEL v5.0 [36]. For each GBS-SNP dataset, SNPs were filtered by applying the following criteria sequentially. In the first step, the GBS-SNPs were filtered to retain only one SNP per read as all the SNPs within the 64 bases of a particular read were expected to provide the same information due to their extremely tight linkage. Further, all GBS-SNP sites with more than 10% missing data (missing in more than 9 BC1 individuals) were removed. Further, all GBS-SNP sites heterozygous in any of the parents were also removed as these would lead to expectedly complex segregation patterns. All of the selected GBS-SNPs used for final linkage analysis were thus homozygous in both the parents and, therefore, were expected to segregate in 1:1 ratio in the BC1 progeny.

2.3. SNP Annotation

Annotation of the identified SNPs was performed using snpEff v4.3t [39], available on the Galaxy platform. For this, first, J. curcas genome annotation information in GFF3 format containing predicted exon–intron gene structure was retrieved from NCBI for both the reference genomes (GCF_000696525.1_JatCur_1.0_genomic.gff and JAT_r4.5.models.gff). The snpEff was used with default parameters to perform the variant effect analysis. SNPs were annotated on the basis of their occurrence in the intergenic or genic (exonic, intronic or splice site) regions. SNPs located in the exonic region were further categorized as synonymous or nonsynonymous mutations based on changes in the coding of an amino acid. Neither of the two genomes used in this study have been annotated so far.

2.4. Linkage Mapping

In the case of AFLP, the genotype data on BC1 individuals was scored for the presence/absence of amplicons. As J. curcas was used as the recurrent parent, scoring was performed only for the amplicons present in J. integerrima and absent in the J. curcas parent. The AFLP binary data was converted to “a” (amplicon absent, i.e., homozygous for the J. curcas parent) and “h” (amplicon present, i.e., heterozygous). In the case of the microsatellite markers, scoring was performed for both the codominant alleles. The microsatellite data was also converted into “a” (only J. curcas allele present) and “h” (both alleles present).
In the case of GBS-SNPs, the genotypes A, C, G and T were converted to “a” (i.e., homozygous for the J. curcas parent) and genotypes R(A/G), Y(C/T), S(G/C), W(A/T), K(G/T) and M(A/C) were converted to “h” (i.e., heterozygous). Filtering of GBS-SNPs was carried out sequentially based on different criteria, as described below. The coded genotype data from AFLP, microsatellites and GBS-SNP was imported into JoinMap v.4.0 software developed by Kyazma®, Netherlands for linkage analysis [40].
In the first step of linkage analysis, locus genotype frequencies were calculated from each scaffold marker locus. All the loci which did not segregate in the expected 1:1 ratio based on the chi-square test were removed. Further, loci which had similarity over 95% were removed and considered to be co-segregating and, therefore, potentially sharing the same locus. Linkage groups (LGs) were created at a LOD value of 5 or above. Loci were placed on the LGs applying regression mapping using the Haldane’s mapping function with a maximum frequency of recombination of 0.4. Three rounds of regressions were carried out for each LG. The map distances were used to draw linkage maps using MapChart V2.0 [41]. The linkage group numbers were manually assigned based on microsatellite markers and scaffolds, manually in accordance with previously published linkage maps [24]. Two sets of linkage maps were obtained for the scaffolds of the two reference assemblies. The 11 pseudochromosomes thus obtained were numbered according to the linkage group nomenclature used previously [20,21,22,24].
When the unique GBS-SNP genotypes were used for linkage mapping to construct 11 linkage groups, the individual linkage groups obtained were extraordinarily large (in the range of 2000–3000 cM). This was presumably due to random genotyping errors which are inherent in GBS-SNP genotyping on account of its low coverage of the sequencing depth, which can inflate the marker-to-marker distances, thus leading to an overall increase in the size of individual linkage groups [42]. As a solution, we considered each scaffold as one single linked unit and calculated the average SNP genotype for each scaffold based on the observed genotypes for all the SNPs aligned on that scaffold. We assumed that the two available genome assemblies for Jatropha were error-free and there was no recombination between the SNPs of a particular scaffold due to the scaffold’s relatively smaller size at the chromosomal level. As there are only two possible genotypes in backcross populations, namely “a” (homozygous for the recurrent parent allele) and “h” (heterozygous), we recoded each SNP as “0” for homozygotes and “1” for heterozygotes before calculating the average genotypes for different scaffolds. We reasoned that in GBS-SNP calls, where the depth of sequences could be as low as 3, a heterozygous locus may occasionally be displayed as homozygous due to a missing sequence containing the alternate allele. On the other hand, a homozygous locus is very unlikely to be displayed as heterozygous. All scaffolds with an average of 0.5 were considered as missing data. An average less than 0.5 was considered “a” and an average greater than 0.5 was considered “h”. This process was carried out for GBS-SNPs from both the reference genomes. The final genotype data used for linkage mapping analysis thus consisted of 484 scaffold genotypes in the case of the Wu_JatCur_1.0 reference assembly and 3267 scaffold genotypes in the case of the Jat_r4.5 reference assembly. The scaffold genotypes derived from the Wu_JatCur_1.0 reference assembly were named in the format S1_Wu, S2_Wu, S3_Wu and so on, where 1, 2 and 3 represent the scaffolds 1, 2 and 3, respectively, of the reference genome. The scaffold genotypes derived from the Jat_r4.5 reference assembly were renamed simply in the format S1, S2, S3 and so on, where 1, 2 and 3 represent the scaffolds 1, 2 and 3, respectively, of the original reference assembly. In both the linkage mapping analyses, the AFLP and microsatellite marker data were also added to identify specific linkage groups. Ten SSR markers that we mapped here were also mapped in previous studies [20,21], which helped us to name the linkage groups corresponding to those previously reported.

3. Results

3.1. Molecular Genetic Markers

3.1.1. AFLP

Using 11 AFLP primer combinations, a total of 124 AFLP loci polymorphic between the parents and segregating in the BC1 plants were scored (Table 1). As expected, only the amplicons of J. integerrima origin segregated in the population. On average, 11.2 polymorphic amplicons per AFLP primer combination were scored.

3.1.2. Microsatellite Markers

The parents and 91 BC1 progeny of the mapping population were genotyped with 17 SSRs. As expected, only one allele at each of the 17 SSR loci segregated in the mapping population.

3.1.3. SNP Markers

GBS-SNP data generated by sequencing the 96-plex GBS library produced a total of 340,029 unique reads. Figure 1 shows the distribution of good-quality reads across the BC1 individuals. The total number of good, barcoded reads ranged from 470,628 (in the case of BC1-44) to 65,28074 (in the case of BC1-28). The good GBS reads were aligned to both reference genome assemblies, Wu_JatCur_1.0 and Jat_r4.5 [37], using the Bowtie 2 tool. On the Wu_JatCur_1.0 reference sequence, 140,455 (41.31%) reads aligned at single locations whereas 25,716 (7.56%) reads aligned at multiple locations in the genome assembly. The remaining 173,858 (51.13%) reads did not align at all. These reads might be specific to J. integerrima and may not be present in the J. curcas genome assemblies. On the Jat_r4.5 reference sequence, 134,402 (39.53%) reads aligned at single locations whereas 36114 (10.62%) reads aligned at multiple locations. The remaining 169,513 (49.85%) reads did not align at all. Finally, two sets of GBS-SNP genotype data, one derived from each of the two reference genomes, were obtained. The Jat_r4.5-derived genotype data had a total of 53,038 GBS-SNPs whereas the Wu_JatCur_1.0-derived genotype data contained 52,862 GBS-SNPs (Table 3).

3.2. SNP Annotation

About 33% of the SNPs in our dataset came from exon regions when mapped to the Jat_r4.5 reference sequence. In the case of Wu_JatCur_1.0 reference, however, only 12% of the SNPs were from exons (Supplementary Figure S1). As the currently available reference gene annotation of Jat_r4.5 assembly is not in-depth, there is no clear demarcation of introns and transcribed regions. Many of these were with unknown functions.

3.3. Linkage Mapping

3.3.1. Jat_r4.5-Based Linkage Map

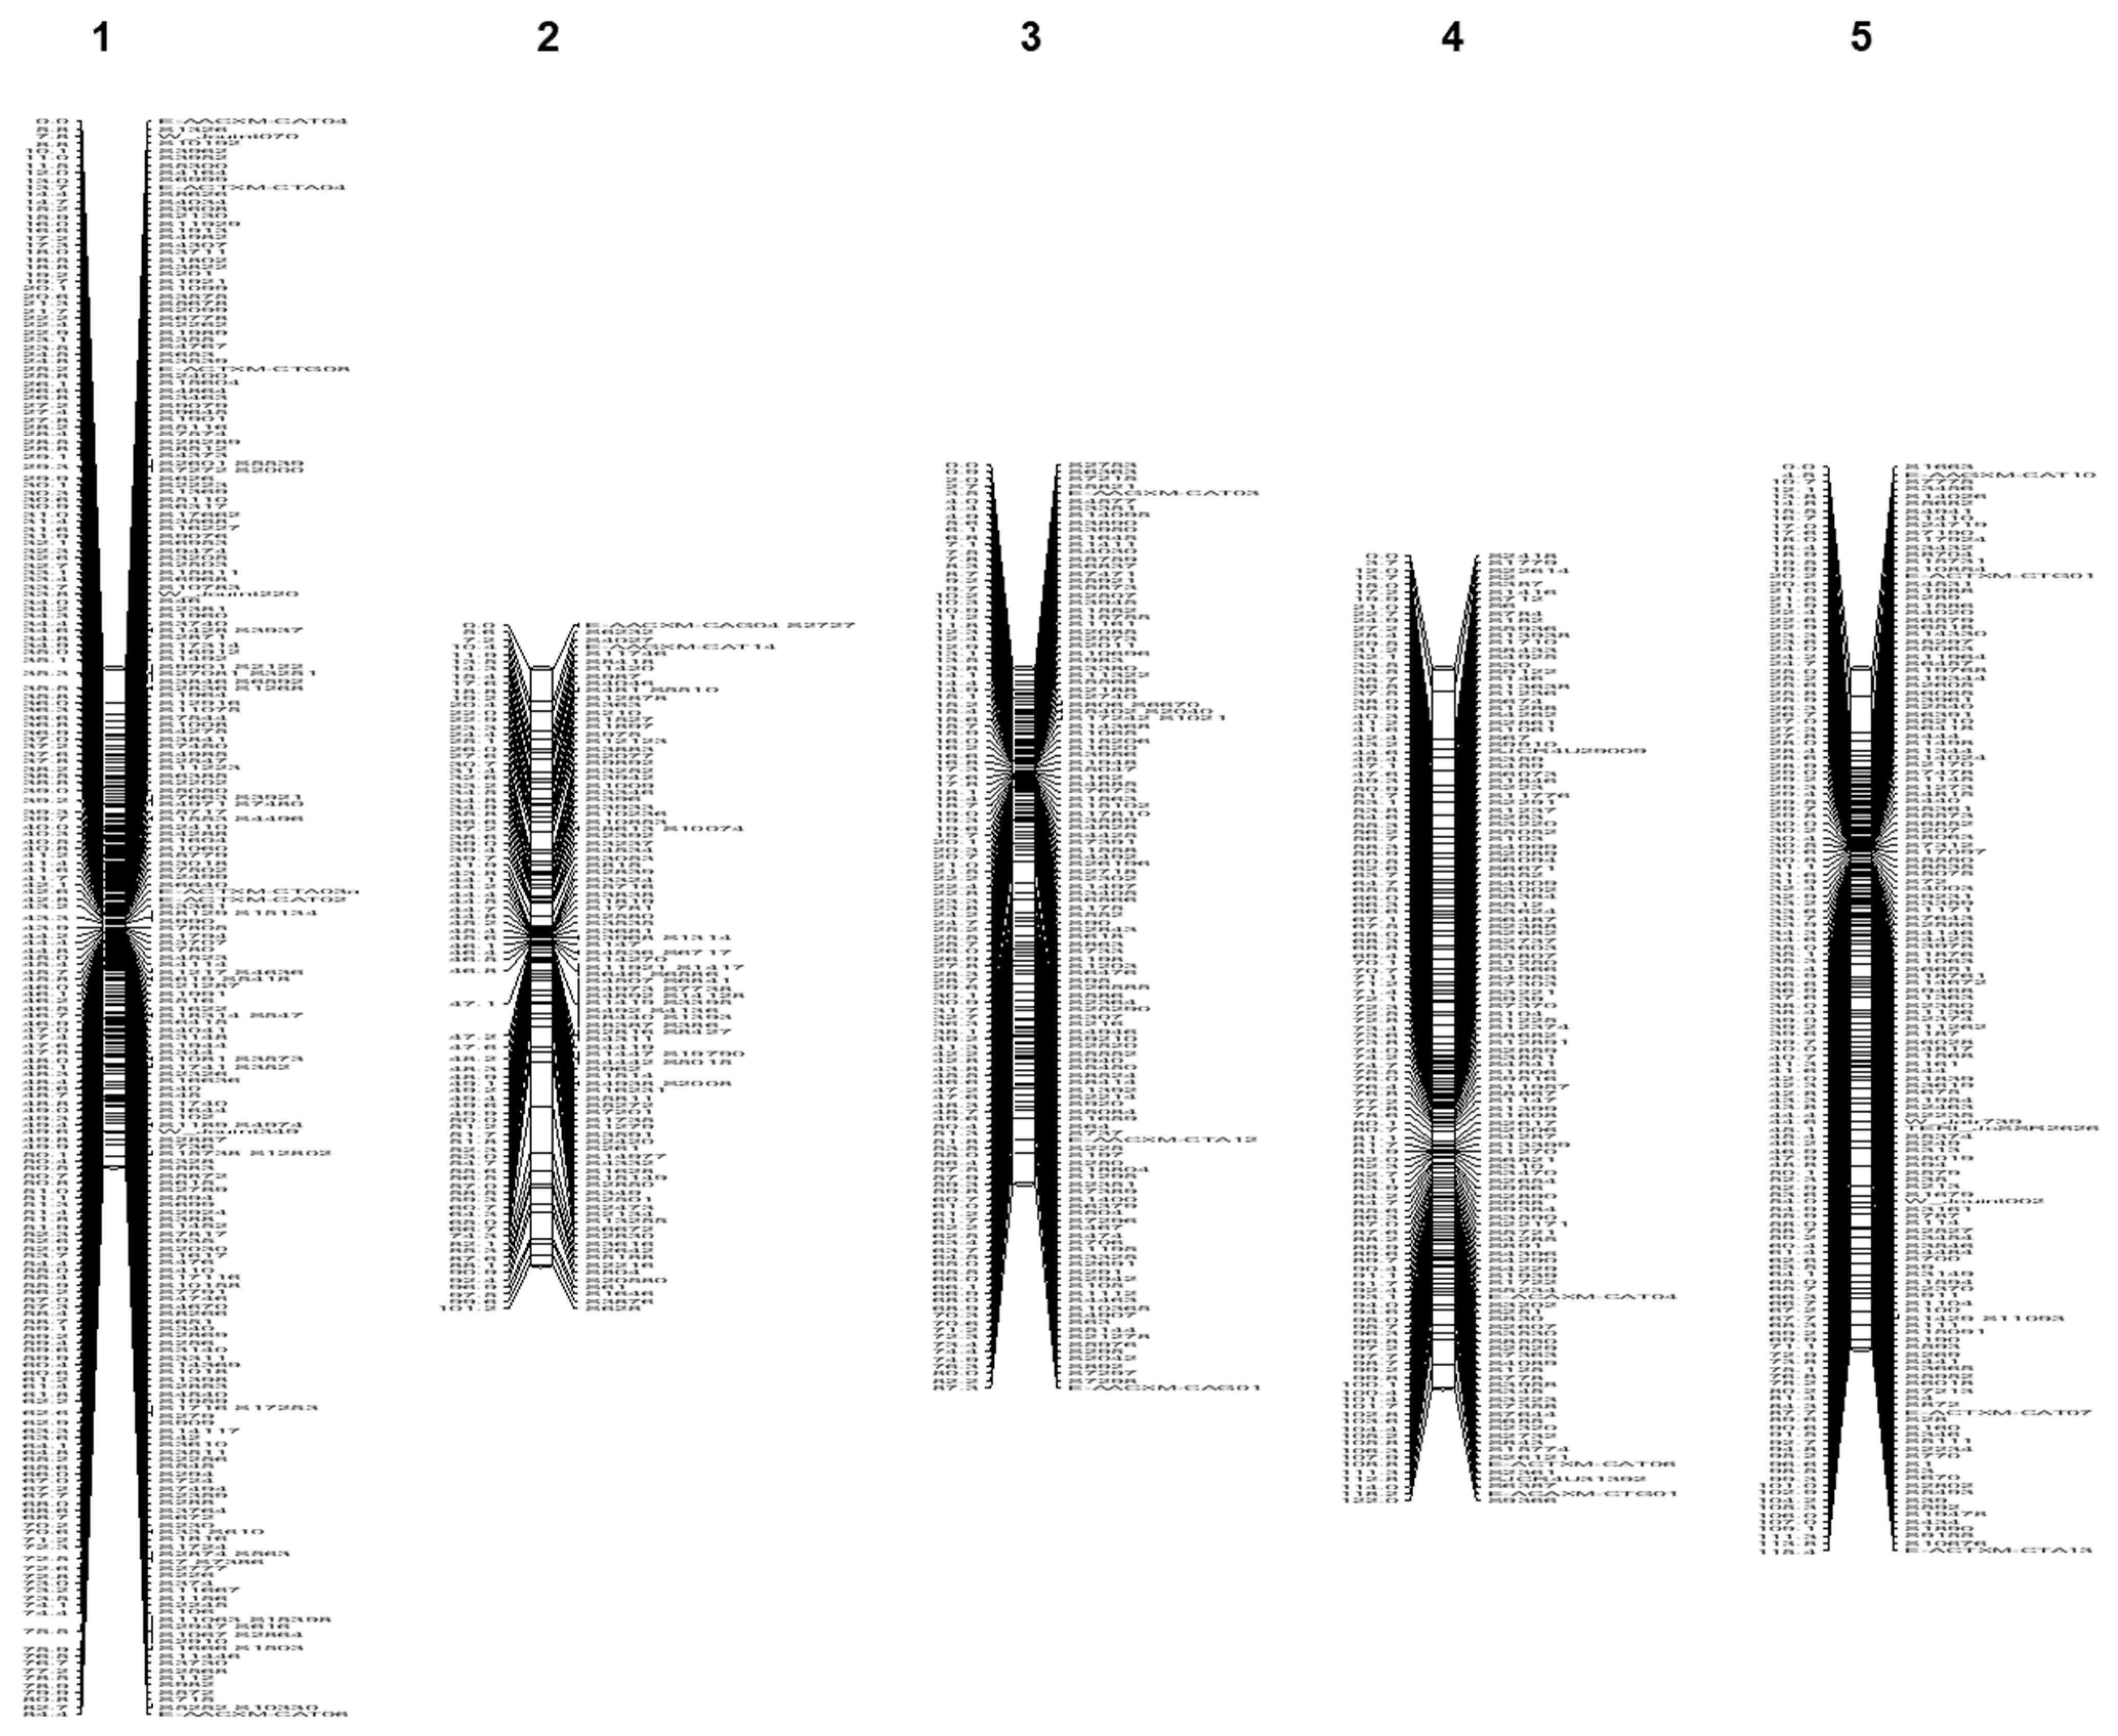
The average SNP genotype scores of the Jat_r4.5 scaffolds are in Supplementary Table S2, whereas the scaffold SNP genotypes obtained from TASSEL pipeline are presented in Supplementary Table S3. Out of the 3408 loci (representing 124 AFLPs, 17 SSRs and 3267 scaffolds) used for linkage mapping from the Jat_r4.5 reference-derived data, 1411 loci displayed significant segregation distortion based on the chi-square test and, therefore, were removed from the analysis. Further 853 loci had locus genotype similarities greater than 95% with other loci in the dataset, indicating their tight linkage with other loci. These loci were removed from the analysis to increase computing efficiency. Eleven linkage groups (LGs) were obtained at LODs 10-14 in the case of linkage map 1 (Figure 2; Supplementary Table S4). Indeed, LGs 1 and 2 showed as a single linkage group below LOD 13 and could only be resolved only at LOD 14 and above. The length of the linkage groups ranged from 79.8 cM to 122 cM, with a total of 1088 cM for 11 linkage groups (Table 4). A total of 7284 SNPs, located on 1428 scaffolds and 54 SSR and AFLP markers, with a total of 7338 markers, were mapped on 11 linkage groups at LOD 14 (Table 4; Supplementary Table S4). Linkage group (pseudochromosome) 10 had the lowest and LG 7 the highest number of total mapped markers (Table 4; Figure 2). The marker density ranged from an average of 0.6 markers/cM (LG 9) to 2.9 markers/cM (LG 1) with an overall mean of 1.4 markers per cM, corresponding to a marker interval of 0.71 cM.

3.3.2. Wu_JatCur_1.0-Based Linkage Map

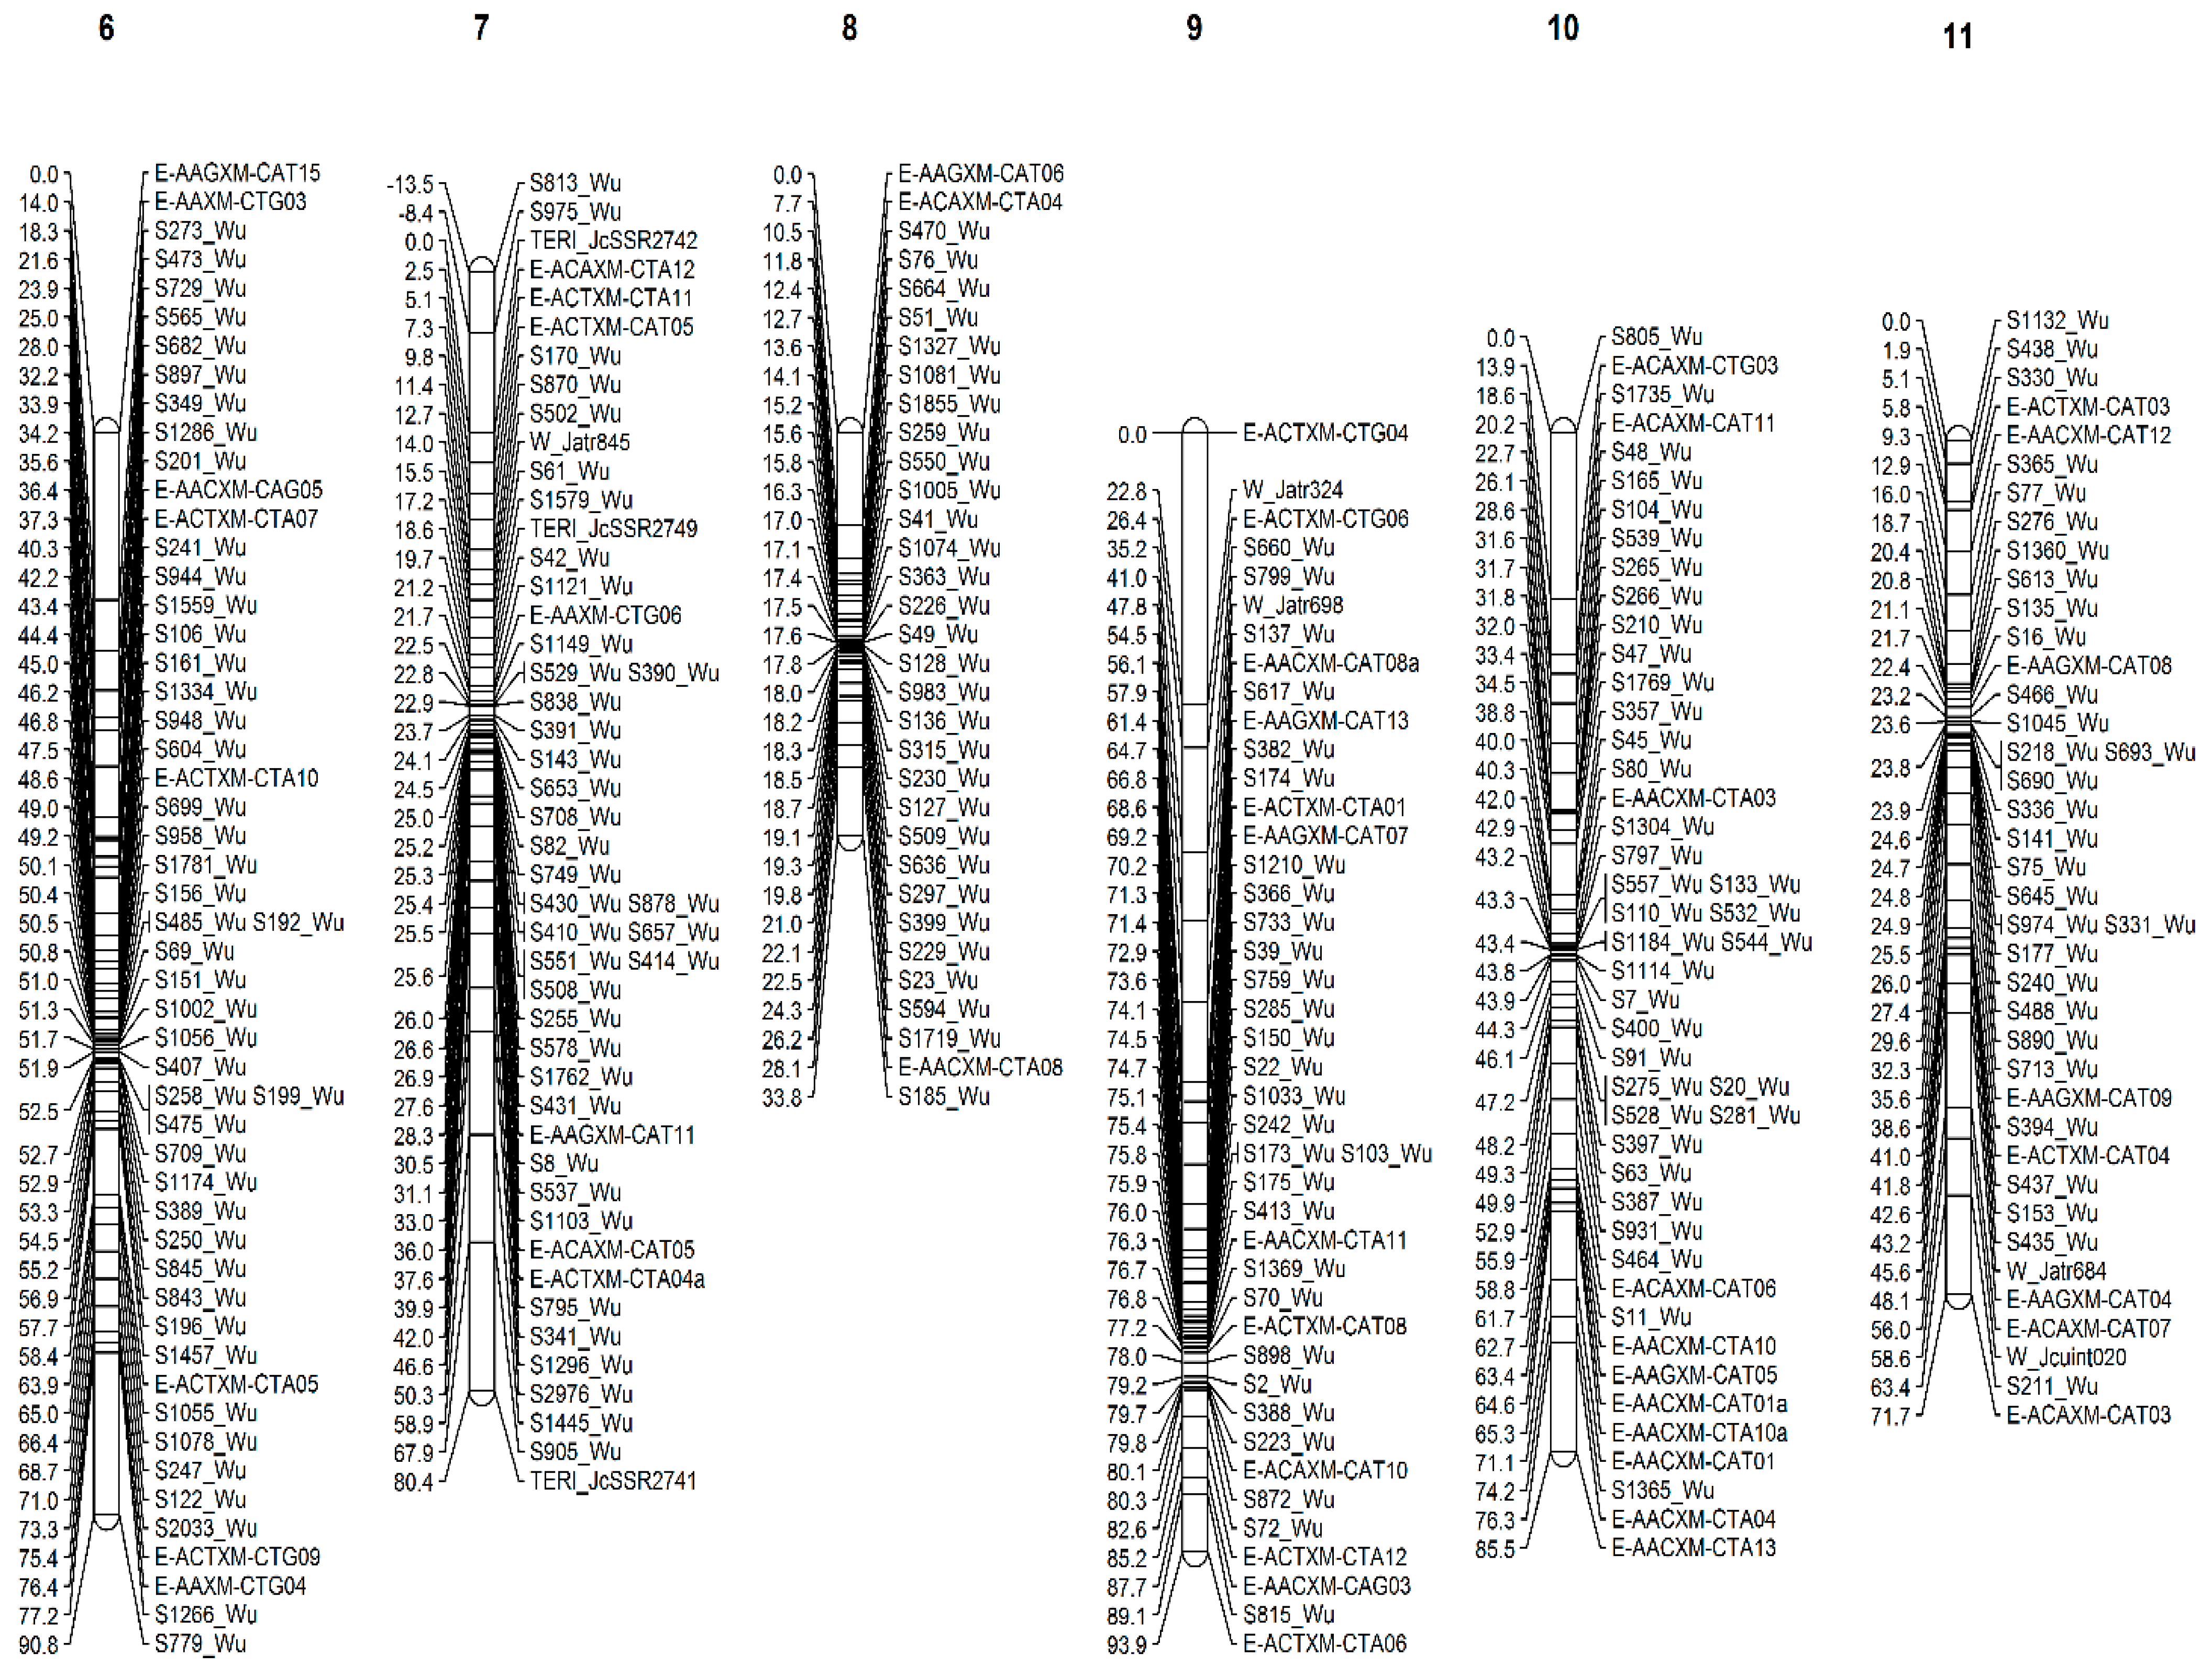
The average SNP genotype scores of the JatCur_1.0 scaffolds are in Supplementary Table S5, whereas the JatCur_1.0 scaffold SNP genotypes obtained from the TASSEL pipeline are presented in Supplementary Table S6. Out of 625 loci (representing 124 AFLPs, 17 SSRs and 484 scaffolds) used for linkage mapping from Wu_JatCur_1.0 reference-derived data, 195 loci displayed significant segregation distortion based on the chi-square test. Further, 58 loci had locus genotype similarities greater than 95% with other loci in the dataset. These loci were removed. Eleven linkage groups were obtained at LODs 5–10 for linkage map 2 (Figure 3; Supplementary Table S4).
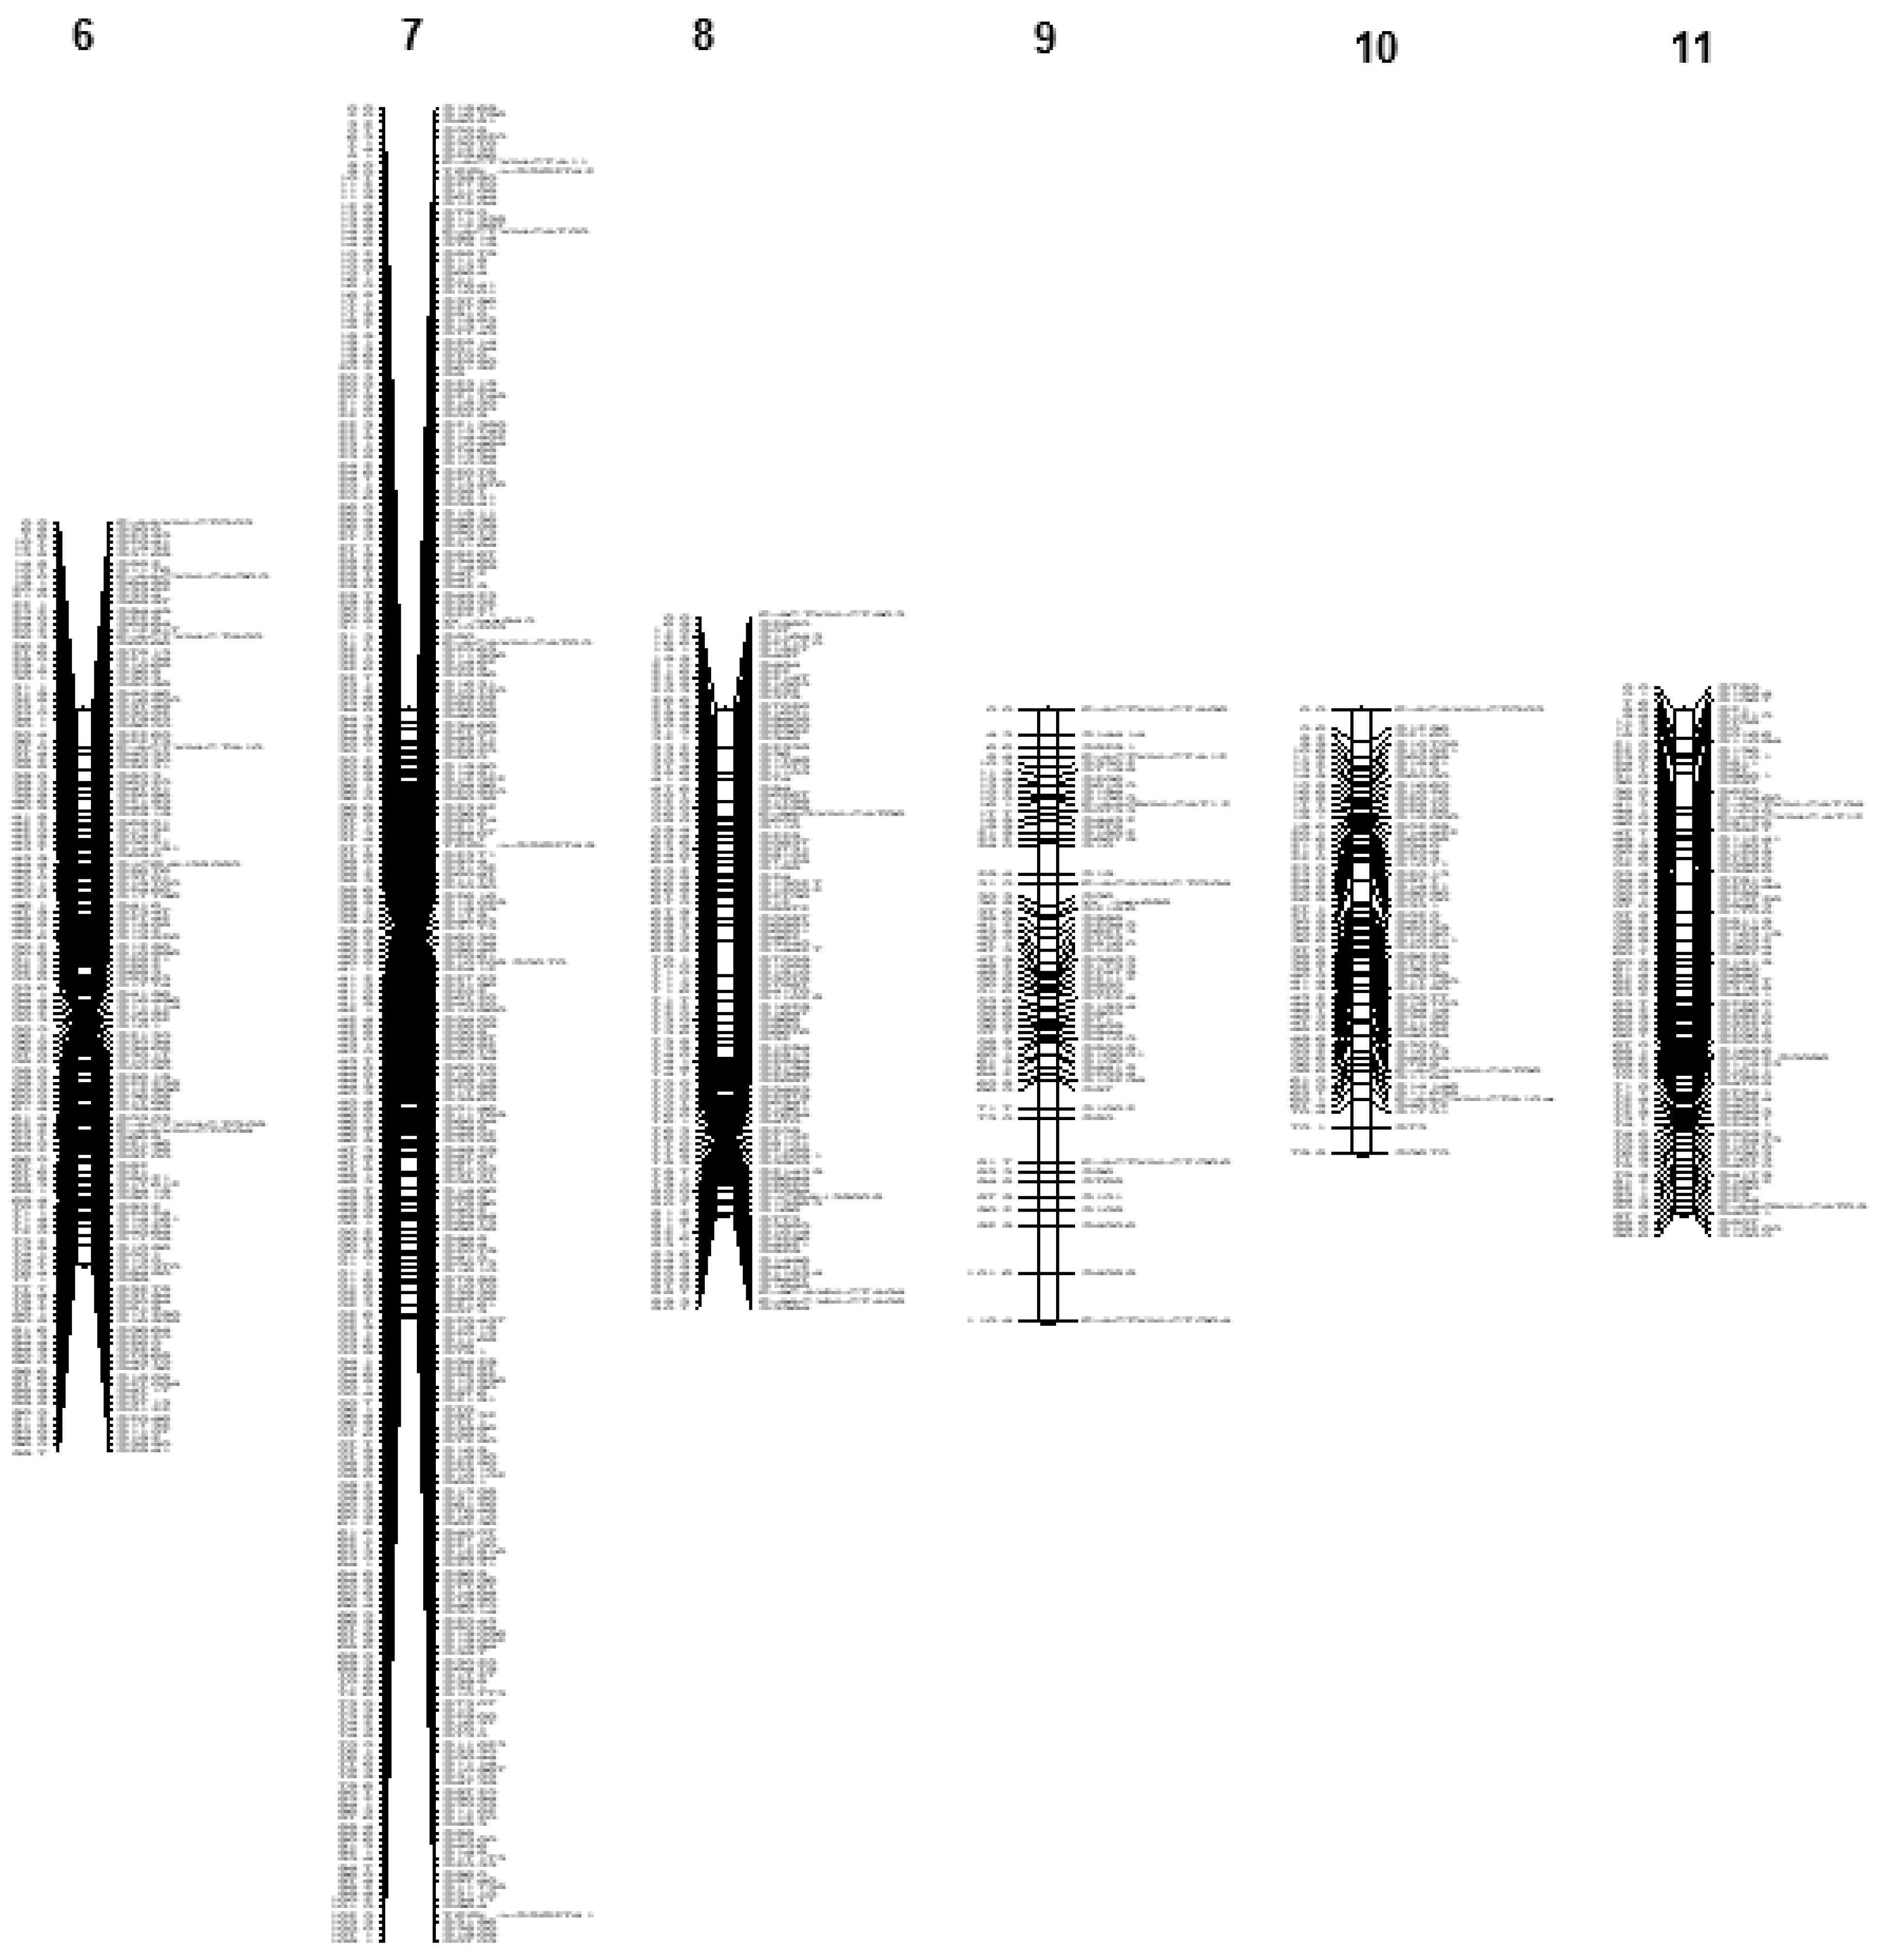
The length of the linkage groups ranged from 33.8 cM to 101.4 cM, with a total of 870.388 cM for 11 linkage groups (Table 4). A total of 7698 SNPs, located on 387 scaffolds and 99 SSR and AFLP markers with a total of 7787 markers, were mapped on 11 linkage groups (Table 4). Linkage group (pseudochromosome) 8 had the lowest and LG 7 the highest number of total mapped markers (Table 4; Figure 3). The marker density ranged from an average of 0.4 markers/cM (LG 4) to 1.0 markers/cM (LG 8) with an overall mean of 0.6 markers per cM, corresponding to a marker interval of 1.67 cM.

3.3.3. Consistency with Published Linkage Groups and between Our Two Linkage Maps

SSR markers in our study mapped to the same linkage groups, 1–11, as reported by Wang et al. [20], King et al. [21] and Amul et al. [43], showing consistency with the previously published genetic maps for SSR markers. Wu et al. [24] compared the consistency of markers and scaffolds from their study with those reported in King et al. (2013) and Wang et al. (2012). We took this information from the supplementary file of Wang et al. (2015) and added corresponding information for our two genetic maps (Supplementary Table S7). Although the names of the markers we used were different, but we found that the JatCur_1.0 scaffolds which we mapped were identical in their linkage map positions to those reported in Wu et al. [24] with the exception of a few markers. As a result, our markers and their linkage group assignments are consistent with those reported by Wu et al. [24]. There was also consistency between our two genetic maps for the mapping of some of the same AFLP and microsatellite markers on the same linkage groups (Supplementary Table S7). Because the scaffolds from the Jat_r4.5 and JatCur_1.0 assemblies did not have the same sequences, it was not possible to determine the consistency between scaffolds and their map locations.

4. Discussion

We developed two ultra-high-density linkage maps for the interspecific J. curcas × J. intergerrima hybrid. To our best knowledge, these maps have a highest number of markers and shortest marker intervals compared with published linkage maps in Jatropha (Table 5). Marker densities of 0.10 to 2.48 markers per cM (marker intervals of 0.40 cM to 10.0 cM) have been reported in the linkage maps of Jatropha curcas and the J. curcas × J. intergerrima interspecific hybrid (Table 5), whereas we obtained marker densities of 1.4 and 0.6 and corresponding marker intervals of 0.71 and 1.67. Therefore, the marker density in our study is 2.7 to 90 times higher and the marker interval is 2.7 to 90 times lower than in the published studies (Table 5). We mapped 7338 and 7797 total markers, which are more than two times the 3422 reported previously for an ultra-high-density linkage map of J. curcas [22]. Also, our genetic maps have the highest number of mapped SNPs, over 30% of which are from exonic or transcriptomic regions (Supplementary Figure S1). Thus, the genetic linkage maps reported in this study have high numbers of SNPs in functional genes mapped, which could be of great significance in understanding the genetic basis of quantitative traits of interest, such as through QTL mapping using a much larger mapping progeny size because a progeny size of 91 is inadequate for sound QTL detection and mapping.
The genetic linkage map length in Jatropha reported so far ranges from 643.80 to 1440.90 cM except in one report of an exceptionally high map length of 4092.30 cM (Table 5; Supplementary Figure S2). The differences in the total map lengths reported may be due to the differences in marker types and numbers, mapping populations and statistical methods. The size of the mapping population does not appear to have any effect on map length or the density of the mapped markers (Table 5). Also, there is no consistency in the length of individual linkage groups among all studies, including between our two linkage groups (Table 6, Supplementary Figure S3). The map lengths of the two linkage groups in our study are in the range of the reported map lengths with the exception of Yepuri et al. [23]. The extraordinarily long map length reported by Yepuri and coworkers is based on 411 SNP markers obtained through GBS. Genotyping errors from GBS technology can inflate marker-to-marker distances, thus resulting in an overall increase in the size of individual linkage groups [42]. As we pointed out earlier, by using individual SNP genotype data we obtained linkage groups of very long lengths.
The total length of genetic linkage maps is normally estimated from the framework map constructed using hypervariable codominant markers, such as microsatellites, and map lengths for a species and its interspecific hybrid with a closely related species are not normally far apart (e.g., [1,44]). We are not aware of any estimate of the total map length reported in Jatropha. However, the first genetic map of J. curcas × J. intergerrima used 216 microsatellites and obtained a total map length of 1440.9 cM [20]. If we consider this genome length close to the total estimated linkage map length in Jatropha, our linkage maps covered about 60–75% of the total genome length. However, it was not possible to construct a sound composite map in our current study by integrating two genetic maps. First, we did not have sufficient microsatellite markers spanning over all linkage groups. Second, the genome scaffolds mapped on two linkage maps were not the same in size and number and there was no correspondence for GBS-SNPs mapped on scaffolds from two genome assemblies. The same SNPs could have been mapped at different places. Nevertheless, our results show that the marker and scaffold assignments in our genetic map based on the JatCur_1.0 genome are consistent with those reported by Wu et al. [24] (Supplementary Table S7), who also genetically mapped the genome assembly scaffolds they produced. Furthermore, both genetic maps we developed have consistency for AFLP and microsatellite markers mapped to the same linkage groups (Supplementary Table S7). All of this suggests that the linkage maps and linkage groups we have developed are sound and consistent with the published studies.
We integrated the linkage map and Jatropha genome sequences by anchoring scaffolds from each of the two genome assemblies: Jat_r4.5 and Wu_JatCur 1.0. Although 480 genome scaffolds from the Wu_JatCur 1.0 assembly were anchored by the authors of the genome sequence [24], we anchored 134 additional scaffolds (Supplementary Table S8) which were not mapped by Wu and coworkers. We have for the first time anchored the scaffolds from the Jat_r4.5 genome assembly [29] on a genetic linkage map of J. curcas × J. intergerrima. Thus, our study opens the possibility of combining the two available sets of genomic scaffolds based on their shared linkage information.
It is now well known that GBS technology is prone to genotyping errors, such as allele dropout or under-calling heterozygotes resulting from low and unequal coverage of sequencing depth, polymorphisms in enzyme restriction sites, amplification bias and less efficient shearing [45,46]. These errors affect the accuracy of results and conclusions, such as by creating inflated map lengths [42]. We observed a highly inflated size of individual linkage groups when we used the individual SNP genotypes for mapping, and this is likely the case for the highly inflated genetic map length of 4092.4 cM reported by Yepuri and coworkers using 411 GBS-derived SNPs [23]. First mapping the SNPs to genome scaffolds and then anchoring scaffolds on to the linkage map not only integrates genetic map and genome sequences, but can also provide an approach to mapping a large number of GBS-SNPs on linkage groups, as we demonstrate in our present study.
The integrated genetic and genome sequence maps developed in our study contribute to the understanding of the genome organization of Jatropha, and provide an important genomic resource for the structural, functional, population and conservation genomics studies and applications and molecular breeding of Jatropha. The genetic maps also provide a framework for assembling and ordering whole genome scaffolds and comparative genomics. The linkage maps developed in our study will facilitate mapping QTLs for biofuel production, adaptability, disease resistance and other traits of interest as well as understanding the genomic relationships between J. curcas and J. integerrima. The SNP markers developed and mapped in our study provide an important repertoire of genetic markers for various population, evolutionary, conservation and landscape genomics and genetics studies because genetically or physically mapped markers provide many benefits over unmapped markers [47,48].

5. Conclusions

We have developed two ultra-high-density linkage maps of Jatropha curcas × Jatropha intergerrima by first mapping SNPs derived from GBS on to genome scaffolds developed in two Jatropha genome sequence studies and then anchoring scaffolds on the genetic linkage maps. The linkage maps produced are of the highest marker density so far. We have for the first time anchored genome scaffolds from the Jat_4.5 genome assembly and anchored additional scaffolds from the Wu_Jat_1.0 genome assembly. We also found a solution for mapping SNPs from genotyping error-prone GBS technology without creating inflated linkage map lengths. The integrated genetic and genome sequence maps developed in our study provide an important genomic resource for the structural and functional genomics and molecular breeding of Jatropha and a framework for assembling and ordering whole genome scaffolds.

Supplementary Materials

The following are available online at https://www.mdpi.com/article/10.3390/f14091907/s1. Supplementary Figure S1. A donut graph showing the distribution of SNPs in different regions of the Jat_r4.5 (inner circle) and Wu_JatCur_1.0 (outer circle) genomes. Supplementary Figure S2. A comparative histogram showing the total size of linkage maps from previously published studies and the present study. Supplementary Figure S3. A comparative histogram showing the size of individual linkage groups in cM from previously published studies and this study. Supplementary Table S1. List of the oligonucleotide sequences of the barcode adapters used for genotyping-by-sequencing. Supplementary Table S2. The average Jat_r4.5 scaffold SNP genotype value calculation. While constructing linkage map, scaffolds with an average below 0.5 were categorized as “a”, indicating a lower value, while those with an average above 0.5 were labeled as “h”, representing a higher value. Any scaffolds with an average of exactly 0.5 were treated as missing data. Supplementary Table S3. Jat_r4.5 scaffold SNP genotypes of the mapping population obtained from TASSEL pipeline. Supplementary Table S4. (a) Linkage map positions of AFLP and microsatellite markers and Jat_r4.5 scaffolds, and the number of SNPs per scaffold. (b) Linkage map positions of AFLP and microsatellite markers and JatCur_1.0 scaffolds, and the number of SNPs per scaffold. Supplementary Table S5. The average JatCur_1.0 scaffold SNP genotype value calculation. While constructing linkage map, scaffolds with an average below 0.5 were categorized as “a”, indicating a lower value, while those with an average above 0.5 were labeled as “h”, representing a higher value. Any scaffolds with an average of exactly 0.5 were treated as missing data. Supplementary Table S6. JatCur_1.0 scaffold SNP genotypes of the mapping population obtained from TASSEL pipeline. Supplementary Table S7. Consistency of markers and linkage groups in our study with previous studies. Supplementary Table S8. List of 134 scaffolds of Wu_JatCur_1.0 mapped/anchored for the first time on linkage groups.

Author Contributions

A.A.M. performed all the wet lab experimentation, bioinformatic analysis and analytical computations and wrote and revised the manuscript. P.S. generated the experimental population. M.S.N. assisted in all wet lab experiments. O.P.R. conceptualized the study, provided overall direction and wrote and revised the manuscript. S.B.T. conceptualized the idea, planned the experiments, supervised the project and wrote the manuscript. All authors provided critical feedback and helped shape the research, analysis and manuscript. All authors have read and agreed to the published version of the manuscript.

Funding

This research was funded by the Department of Biotechnology, Government of India for three years (2013–2016) via the grant number (BT/PR6220/PBD/26/309/2012) to Shashi Bhushan Tripathi as a principal investigator.

Data Availability Statement

The raw FastQ files are available in the Sequence Read Archive (SRA) of NCBI under accession number PRJNA487990.

Acknowledgments

The authors would like to thank The Energy and Resources Institute (TERI), New Delhi, TERI School of Advanced Studies, New Delhi for their kind support and the Department of Biotechnology, Government of India for funding this study. The study was conceived in 2014 when Om P. Rajora was on sabbatical at TERI University (now TERI School of Advanced Studies). He would like to thank TERI University for hosting his sabbatical and the Indira Foundation for awarding the Indira Foundation Distinguished Visiting Fellowship to him.

Conflicts of Interest

The authors declare no conflict of interest. The funders had no role in the design of the study; in the collection, analyses or interpretation of data; in the writing of the manuscript; or in the decision to publish the results.

References

  1. Kang, B.-Y.; Mann, I.K.; Major, J.E.; Rajora, O.P. Near-saturated and complete genetic linkage map of black spruce (Picea mariana). BMC Genom. 2010, 11, 515. [Google Scholar] [CrossRef]
  2. Collard, B.C.; Mackill, D.J. Marker-assisted selection: An approach for precision plant breeding in the twenty-first century. Philos. Trans. R. Soc. B Biol. Sci. 2008, 363, 557–572. [Google Scholar] [CrossRef]
  3. Martin, G.B.; Brommonshenkel, S.; Chunwongse, J.; Frary, A.; Ganal, M.W.; Spivey, R.; Wu, T.; Earle, E.D.; Tanksley, S.D. Map-based cloning of a protein kinase gene conferring disease resistance in tomato. Science 1993, 262, 1432–1435. [Google Scholar] [CrossRef]
  4. Subramanian, K.A.; Singal, S.K.; Saxena, M.; Singhal, S. Utilization of liquid biofuels in automobile diesel engines: An Indian perspective. Biomass Bioenergy 2005, 29, 65–72. [Google Scholar] [CrossRef]
  5. Riayatsyah, T.; Sebayang, A.; Silitonga, A.; Padli, Y.; Fattah, I.; Kusumo, F.; Ong, H.; Mahlia, T. Current Progress of Jatropha curcas Commoditisation as Biodiesel Feedstock: A Comprehensive Review. Front. Energy Res. 2022, 9, 815416. [Google Scholar] [CrossRef]
  6. Zhang, Z.; Guo, X.; Liu, B.; Tang, L.; Chen, F. Genetic diversity and genetic relationship of Jatropha curcas between China and Southeast Asian revealed by amplified fragment length polymorphism. Afr. J. Biotechnol. 2011, 10, 2825–2832. [Google Scholar]
  7. He, W.; King, A.J.; Khan, M.A.; Cuevas, J.A.; Ramiaramanana, D.; Graham, I.A. Analysis of seed phorbol-ester and curcin content together with genetic diversity in multiple provenances of Jatropha curcas L. from Madagascar and Mexico. Plant Physiol. Biochem. 2011, 49, 1183–1190. [Google Scholar] [CrossRef]
  8. Basha, S.D.; George, F.; Makkar, H.P.S.; Becker, K.; Sujatha, M. A comparative study of biochemical traits and molecular markers for assessment of genetic relationships between J. curcas (L.) germplasm from different countries. Plant Sci. 2009, 176, 812–823. [Google Scholar] [CrossRef]
  9. Biabani, A.; Rafii, M.Y.; Saleh, G.B.; Abdul, L.M. Inter- and intra-population genetic variations in Jatropha curcas populations revealed by inter-simple sequence repeat molecular markers. Maydica 2013, 58, 111–118. [Google Scholar]
  10. Sinha, P.; Md Islam, A.; Negi, M.S.; Tripathi, S.B. First identification of core accessions of Jatropha curcas from India based on molecular genetic diversity. Plant Genet. Resour. 2015, 14, 77–80. [Google Scholar] [CrossRef]
  11. Trebbi, D.; Papazoglou, E.G.; Saadaoui, E.; Vischi, M.; Baldini, M.; Stevanato, P.; Cettul, E.; Sanzone, A.P.; Gualdi, L.; Fabbri, A. Assessment of genetic diversity in different accessions of Jatropha curcas. Ind. Crop. Prod. 2015, 75, 35–39. [Google Scholar] [CrossRef]
  12. Shen, J.; Pinyopusarerk, K.; Bush, D.; Chen, X. AFLP-based molecular characterization of 63 populations of Jatropha curcas L. grown in provenance trials in China and Vietnam. Biomass Bioenerg. 2012, 37, 265–274. [Google Scholar] [CrossRef]
  13. Basha, S.; Sujatha, M. Inter and intra-population variability of Jatropha curcas (L.) characterized by RAPD and ISSR markers and development of population-specific SCAR markers. Euphytica 2007, 156, 375–386. [Google Scholar] [CrossRef]
  14. Pamidimarri, D.V.; Mastan, S.G.; Rahman, H.; Reddy, M.P. Molecular characterization and genetic diversity analysis of Jatropha curcas L. in India using RAPD and AFLP analysis. Mol. Biol. Rep. 2010, 37, 2249–2257. [Google Scholar] [CrossRef]
  15. Bhandari, H.; Bhanu, A.; Srivastava, K.; Singh, M.; Shreya, H.A. Assessment of genetic diversity in crop plants—An overview. Adv. Plants Agric. Res. 2017, 7, 279–286. [Google Scholar]
  16. Blum, E.; Liu, K.; Mazourek, M.; Yoo, E.Y.; Jahn, M.; Paran, I. Molecular mapping of the C locus for presence of pungency in Capsicum. Genome 2002, 45, 702–705. [Google Scholar] [CrossRef]
  17. Yi, G.; Lee, J.M.; Lee, S.; Choi, D.; Kim, B.D. Exploitation of pepper EST-SSRs and an SSR-based linkage map. Theor. Appl. Genet. 2006, 114, 113–130. [Google Scholar] [CrossRef]
  18. Parthiban, K.T.; Kumar, R.S.; Thiyagarajan, P.; Subbulakshmi, V.; Vennila, S.; Rao, M.G. Hybrid progenies in Jatropha—A new development. Curr. Sci. 2009, 96, 815–823. [Google Scholar]
  19. Sinha, P.; Dwivedi, N.; Negi, M.S.; Tripathi, S.B. Genetic variability among Jatropha species as revealed by amplified fragment length polymorphism (AFLP) markers. Indian J. Biotechnol. 2014, 13, 496–501. [Google Scholar]
  20. Wang, C.M.; Liu, P.; Yi, C.; Gu, K.; Sun, F.; Li, L.; Lo, L.C.; Liu, X.; Feng, F.; Lin, G.; et al. A first generation microsatellite- and SNP-based linkage map of Jatropha. PLoS ONE 2011, 6, e23632. [Google Scholar] [CrossRef]
  21. King, A.J.; Montes, L.R.; Clarke, J.G.; Affleck, J.; Li, Y.; Witsenboer, H.; van der Vossen, E.; van der Linde, P.; Tripathi, Y.; Tavares, E.; et al. Linkage mapping in the oilseed crop Jatropha curcas L. reveals a locus controlling the biosynthesis of phorbol esters which cause seed toxicity. Plant Biotechnol. J. 2013, 11, 986–996. [Google Scholar] [CrossRef] [PubMed]
  22. Xia, Z.; Zhang, S.; Wen, M.; Lu, C.; Sun, Y.; Zou, M.; Wang, W. Construction of an ultrahigh-density genetic linkage map for Jatropha curcas L. and identification of QTL for fruit yield. Biotechnol. Biofuels 2018, 11, 3. [Google Scholar] [CrossRef] [PubMed]
  23. Yepuri, V.; Jalali, S.; Mudunuri, V.; Pothakani, S.; Kancharla, N.; Arockiasamy, S. Genotyping by sequencing-based linkage map construction and identification of quantitative trait loci for yield-related traits and oil content in Jatropha (Jatropha curcas L.). Mol. Biol. Rep. 2022, 49, 4293–4306. [Google Scholar] [CrossRef] [PubMed]
  24. Wu, P.; Zhou, C.; Cheng, S.; Wu, Z.; Lu, W.; Han, J.; Chen, Y.; Chen, Y.; Ni, P.; Wang, Y.; et al. Integrated genome sequence and linkage map of physic nut (Jatropha curcas L.), a biodiesel plant. Plant J. 2015, 81, 810–821. [Google Scholar] [CrossRef]
  25. Ha, J.; Shim, S.; Lee, T.; Kang, Y.J.; Hwang, W.J.; Jeong, H.; Laosatit, K.; Lee, J.; Kim, S.K.; Satyawan, D.; et al. Genome sequence of Jatropha curcas L., a non-edible biodiesel plant, provides a resource to improve seed-related traits. Plant Biotechnol. J. 2019, 17, 517–530. [Google Scholar] [CrossRef]
  26. Elshire, R.J.; Glaubitz, J.C.; Sun, Q.; Poland, J.A.; Kawamoto, K.; Buckler, E.S.; Mitchell, S.E. A robust, simple genotyping-by-sequencing (GBS) approach for high diversity species. PLoS ONE 2011, 6, e19379. [Google Scholar] [CrossRef]
  27. Fierst, J.L. Using linkage maps to correct and scaffold de novo genome assemblies: Methods, challenges, and computational tools. Front. Genet. 2015, 6, 220. [Google Scholar] [CrossRef]
  28. Sato, S.; Hirakawa, H.; Isobe, S.; Fukai, E.; Watanabe, A.; Kato, M.; Kawashima, K.; Minami, C.; Muraki, A.; Nakazaki, N.; et al. Sequence analysis of the genome of an oil-bearing tree, Jatropha curcas L. DNA Res. 2010, 18, 65–76. [Google Scholar] [CrossRef]
  29. Hirakawa, H.; Tsuchimoto, S.; Sakai, H.; Nakayama, S.; Fujishiro, T.; Kishida, Y.; Kohara, M.; Watanabe, A.; Aizu, T.; Toyoda, A.; et al. Upgraded genomic information of Jatropha curcas L. Plant Biotechnol. J. 2012, 29, 123–130. [Google Scholar] [CrossRef]
  30. Sinha, P.; Md Islam, A.; Negi, M.S.; Tripathi, S.B. Analysis of genetic diversity and fatty acid composition in a prebreeding material of Jatropha. J. Plant Biochem. Biotech. 2015, 25, 111–116. [Google Scholar] [CrossRef]
  31. Singh, A.; Negi, M.S.; Rajagopal, J.; Bhatia, S.; Tomar, U.K.; Srivastava, P.S.; Lakshmikumaran, M. Assessment of genetic diversity in Azadirachta indica using AFLP markers. Theor. Appl. Genet. 1999, 99, 272–279. [Google Scholar] [CrossRef]
  32. Vos, P.; Hogers, R.; Bleeker, M.; Reijans, M.; van de Lee, T.; Hornes, M.; Friters, A.; Pot, J.; Paleman, J.; Kuiper, M.; et al. AFLP: A new technique for DNA fingerprinting. Nucleic Acids Res. 1995, 23, 4407–4414. [Google Scholar] [CrossRef] [PubMed]
  33. Sharma, S.S.; Negi, M.S.; Sinha, P.; Kumar, K.; Tripathi, S.B. Assessment of genetic diversity of biodiesel species Pongamia pinnata accessions using AFLP and three endonuclease -AFLP. Plant Mol. Biol. Rep. 2011, 29, 12–18. [Google Scholar] [CrossRef]
  34. Sinha, P.; Md Islam, A.; Negi, M.S.; Tripathi, S.B. Development of novel microsatellite markers in Jatropha curcas and evaluation of their cross-species transferability. Proc. Natl. Acad. Sci. India Biol. Sci. 2015, 85, 1011–1016. [Google Scholar] [CrossRef]
  35. Sinha, P.; Md Islam, A.; Negi, M.S.; Tripathi, S.B. Estimation of outcrossing rates in interspecific backcross plants of Jatropha curcas (L.) using AFLP and SSR markers. Physiol. Mol. Biol. Plants 2015, 21, 605–609. [Google Scholar] [CrossRef]
  36. Glaubitz, J.C.; Casstevens, T.M.; Lu, F.; Harriman, J.; Elshire, R.J.; Sun, Q.; Buckler, E.S. TASSEL-GBS: A High Capacity Genotyping by Sequencing Analysis Pipeline. PLoS ONE 2014, 9, e90346. [Google Scholar] [CrossRef]
  37. Langmead, B.; Salzberg, S.L. Fast gapped-read alignment with Bowtie 2. Nat. Methods 2012, 9, 357–359. [Google Scholar] [CrossRef]
  38. Afgan, E.; Baker, D.; Van den Beek, M.; Blankenberg, D.; Bouvier, D.; Čech, M.; Chilton, J.; Clements, D.; Coraor, N.; Eberhard, C.; et al. The Galaxy platform for accessible, reproducible and collaborative biomedical analyses. Nucl. Acids Res. 2016, 44, W3–W10. [Google Scholar] [CrossRef]
  39. Cingolani, P.; Platts, A.; Wang, L.L.; Coon, M.; Nguyen, T.; Wang, L.; Land, S.J.; Lu, X.; Ruden, D.M. A program for annotating and predicting the effects of single nucleotide polymorphisms, SnpEff: SNPs in the genome of Drosophila melanogaster strain w1118; iso-2; iso-3. Fly 2012, 6, 80–92. [Google Scholar] [CrossRef]
  40. van Ooijen, J.W.; Voorrips, R.E. JoinMap 4.0: Software for the Calculation of Genetic Maps in Experimental Populations; Kyazma, B.V., Ed.; Plant Research International: Wageningen, The Netherlands, 2006. [Google Scholar]
  41. Voorrips, R.E. MapChart: Software for the graphical presentation of linkage maps and QTLs. J. Hered. 2002, 93, 77–78. [Google Scholar] [CrossRef]
  42. Cartwright, D.A.; Troggio, M.; Velasco, R.; Gutin, A. Genetic mapping in the presence of genotyping errors. Genetics 2007, 176, 2521–2527. [Google Scholar] [CrossRef] [PubMed]
  43. Amkul, K.; Laosatit, K.; Somta, P.; Shim, S.; Lee, S.-H.; Tanya, P.; Srinives, P. Mapping of QTLs for Seed Phorbol Esters, a Toxic Chemical in Jatropha curcas (L.). Genes 2017, 8, 205. [Google Scholar] [CrossRef]
  44. Kang, B.-Y.; Major, J.E.; Rajora, O.P. A high-density genetic linkage map of a black spruce (Picea mariana) × red spruce (Picea rubens) interspecific hybrid. Genome 2011, 54, 128–143. [Google Scholar] [CrossRef] [PubMed]
  45. Bresadola, L.; Link, V.; Buerkle, C.A.; Lexer, C.; Wegmann, D. Estimating and accounting for genotyping errors in RAD-seq experiments. Mol. Ecol. Resour. 2020, 20, 856–870. [Google Scholar] [CrossRef] [PubMed]
  46. Furuta, T.; Yamamoto, T.; Ashikari, M. GBScleanR: Robust genotyping error correction using hidden Markov model with error pattern recognition. bioRxiv 2022. [Google Scholar] [CrossRef] [PubMed]
  47. Luikart, G.; Kardos, M.; Hand, B.; Rajora, O.P.; Aitkin, S.; Hohenlohe, P.A. Population genomics: Advancing understanding of nature. In Population Genomics: Concepts, Approaches and Applications; Rajora, O.P., Ed.; Springer International Publishing AG: Berlin/Heidelberg, Germany, 2019; pp. 3–79. [Google Scholar] [CrossRef]
  48. Rajora, O.P. Population Genomics: Concepts, Approaches and Applications; Springer Nature Switzerland AG: Cham, Switzerland, 2019. [Google Scholar] [CrossRef]
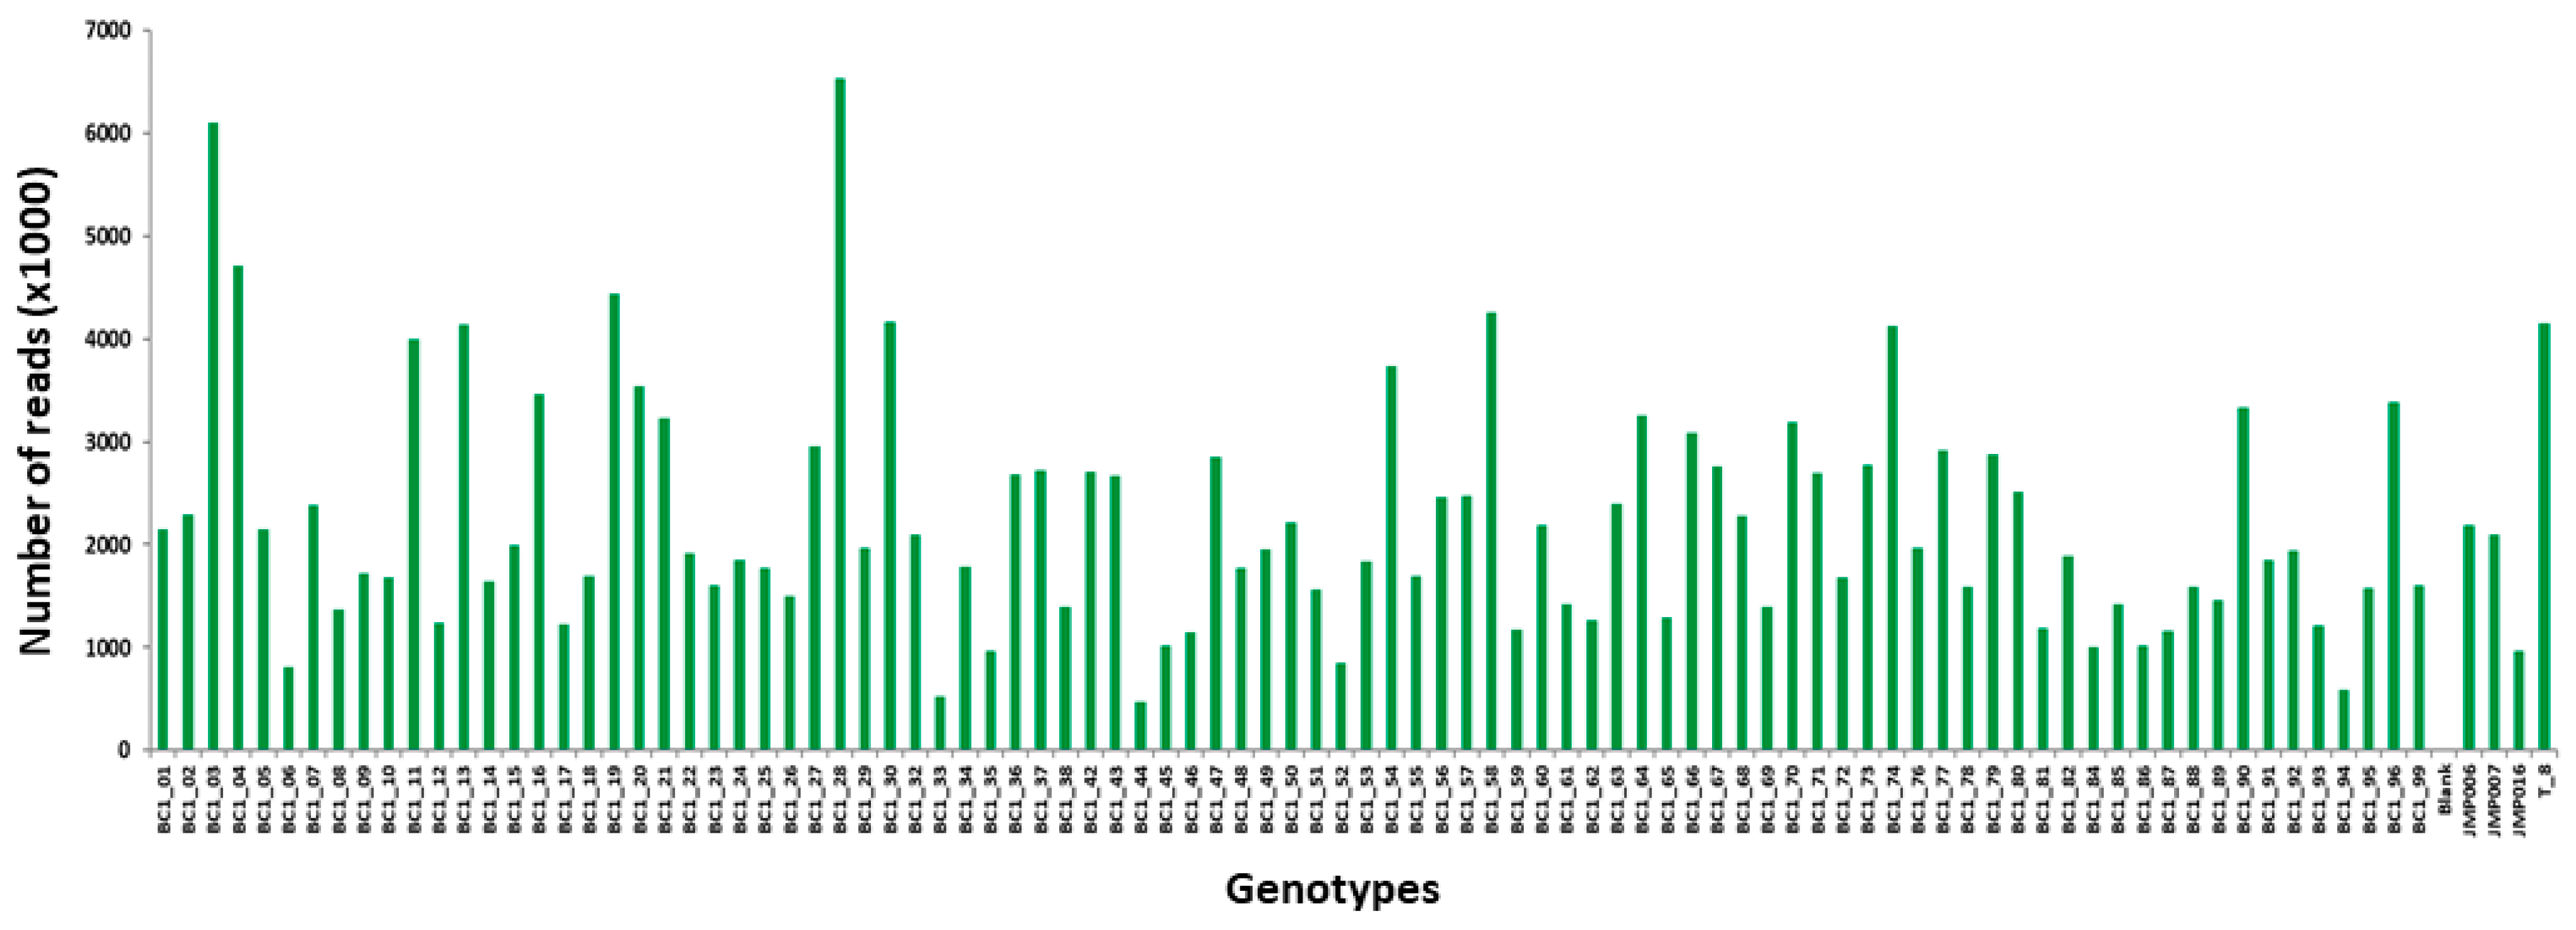
Figure 1. Distribution (number) of good barcoded reads from different 91 BC1 individuals obtained from the analysis of raw data using TASSEL-GBS pipeline where x-axis shows the genotypes and y-axis shows the number of good barcoded reads.
Forests 14 01907 g001
Figure 2. Linkage groups (111) constructed using scaffolds derived from the Jat_r4.5 reference genome and AFLP and microsatellite markers. The order of the markers with their corresponding map position has been provided in Supplementary Table S4.
Forests 14 01907 g002aForests 14 01907 g002b
Figure 3. Linkage groups (111) were constructed using scaffolds derived from the Wu_JatCur_1.0 reference genome and AFLP and microsatellite markers. The order of the markers with their corresponding map position has been provided in Supplementary Table S4.
Forests 14 01907 g003aForests 14 01907 g003b
Table 1. Number of segregating AFLP markers obtained through different primer combinations and the number of mapped markers, where × represents the combination of the two restriction enzymes, Eco-R1 and Mse-I primers used in the amplification reaction.
Primer CombinationTotalMapped on Jat_r4.5Mapped on Wu_JatCur_1.0
E-AAC × M-CAG835
E-AAC × M-CAT1433
E-AAC × M-CTA1433
E-AAG × M-CAT1566
E-AA × M-CTG823
E-ACA × M-CAT1134
E-ACA × M-CTA1313
E-ACA × M-CTG833
E-ACT × M-CAT854
E-ACT × M-CTA1588
E-ACT × M-CTG1056
Total1244248
Table 2. Microsatellite markers used for genotyping and mapping. Markers with prefix “W_” were reported earlier by Wang et al. [20]. Markers with prefix “TERI_JcSSR” were developed by our group [34].
Marker NameForward Sequence (5′-3′)Reverse Sequence (5′-3′)Mapped
W_Jatr698AGCAAGTCTAAGAGAGGGAGACTCAAGACTCCACACAACTTCYes
W_Jcuint220CATAAAGGCTAAAGCATCTCAATTTAGCTTTCCTGCCTAAAAYes
W_Jatr324TGTAGGCTGAATAAGAACAGCGTCCTTGATCTCTGGCTTTACNo
W_Jatr845CTCCTTCCATAGAAGAAAACCGAGACATGCTTATTCATCCACYes
W_Jcuint020ATATGGACAGATTAGCCGATTCACGCAATACCTAACTTGTGTNo
W_Jcuint070CCTTTCTAGCAAAATAGGAAGAGTAACAGTTGGAACCACATTCNo
W_Jatr739TTTTAAGCAAATGAGAAGGTGCTAGGGCCACCCCACTTTAGYes
W_Jcuint282CCGCATTTCTAACATAATCAGAGAATTTGAGATGGTTGTTGANo
W_Jcuint152CATGCGATCTCTCTCTTTCTCAAGAAGCTGGTGAGAATAAANo
W_Jcuint002AGGAGAAACTACAACACATGCAAGCACCAAAAACCAATTACTYes
W_Jcuint349CAACAGGTATCTAGTGGTGGTCAACATTTTATTGAAGTAAGCYes
W_Jatr684TCAACTTCGTATGCTAATGGTCCTCATGCTCTATTATTGGTGNo
TERI_JcSSR2626CGCAGCCATCTTGAAGGTTAGCAAAATTTCAAGCCATGCTCYes
TERI_JcSSR2741CATCAGGAATTGTTTGATGGTCGGAATTTTCTATGGGACTGAGYes
TERI_JcSSR2742TTGAAACAGACCAAAGGTGTGATCGTATGAAGCAGCACACTCYes
TERI_JcSSR2749TGCGATTACCTGGTTTAGGGATCGGAAGCCTTGGAGATTTAGYes
TERI_JcSSR2785GAGGTAGCTGAAAAAAACAGCGTTGAGAAGAATGGTGGCTGCNo
Table 3. Summary of GBS-SNPs obtained from alignment of reads to the reference genome assemblies Jat_r4.5 and Wu_JatCur_1.0.
StepsJat_r4.5Wu_JatCur_1.0
Total raw reads296 million
Good-quality barcoded reads212 million
Unique barcoded reads340,029
Reads aligned to single location134,402140,455
Reads aligned to multiple locations36,11425,716
Nonaligned reads169,513173,858
Number of GBS-SNPs53,03852,862
Unique GBS-SNPs (after taking one SNP per read)22,43921,680
SNPs obtained after removal of missing data (>10%)12,99614,768
SNPs obtained after removal of heterozygous sites from parents997511,263
Number of scaffolds finally represented in the genotype data3267484
Table 4. Number of SNPs from two Jatropha reference genomes mapped in this study. The number of SNPs indicates only the unique SNPs (1 SNP/read).
Linkage GroupsScaffolds from the Reference Genome Jat_r4.5Scaffolds from the Reference Genome WU_JatCur_1.0
Size (cM)Number of
Scaffolds Anchored
Number of SNPsAFLPs and SSRsTotal
(SNPs + AFLPs + SSRs)
Markers (Scaffolds + AFLPs + SSRs) /cMSize (cM)Number of Scaffolds AnchoredNumber of SNPsAFLPs and SSRsTotal
(SNPs + AFLPs + SSRs)
Markers (Scaffolds + AFLPs + SSRs) /cM
LG184.42381228912372.976.440641106510.7
LG2101.211149324951.177.543911109210.7
LG384.712866536681.568.22774777540.5
LG4122.012862136241.190.72873357380.4
LG5115.414484778541.3101.437810108200.5
LG699.713162466301.490.84690689140.6
LG7109.12631456714632.580.43910961111070.6
LG890.79849244961.133.83028032831.0
LG9110.45133073370.693.929569145830.5
LG1079.85718231850.885.537458114690.6
LG1190.67934633490.971.731547105570.6
Total1088142872845473381.4870.338776989977970.6
Table 5. Information on the published linkage maps in Jatropha.
Type of PopulationTypes of CrossesNo. of IndividualsNo. of MarkersType of MarkersTotal Length of Map (cM)Average Marker Density (Markers per cM)Reference
BC1F1Interspecific93506Microsatellite and SNP1440.900.35[20]
F2Intraspecific974502SSR and SNP717.001.50[21]
BC1F1Interspecific1901208SSR, InDel and SNP1655.800.73[24]
F1Intraspecific1533422SNP and InDel1380.582.48[22]
F2Intraspecific1081186SNP738.101.60[25]
F2Intraspecific136411SNP4092.3010.04[23]
BC1F1Interspecific911482SNP, SSR and AFLP1088.001.38This study (Jat_r4.5 reference genome)
BC1F1Interspecific91486SNP, SSR and AFLP870.300.59This study (GCF_000696525.1_JatCur_1.0 reference genome)
Table 6. Comparison of spans of different Jatropha linkage groups (in cM) obtained in different studies with those obtained in the current study. Two linkage maps in the current study were obtained based on two reference genomes (Jat_r4.5 and Wu_JatCur_1.0).
This Study Other Studies
Linkage GroupJat_r4.5 ScaffoldsWu_JatCur_1.0 ScaffoldsWu et al., 2015 [24]King et al., 2013 [21]Wang et al., 2011 [20]Xia et al., 2018 [22]Ha et al., 2019 [25]Yepuri et al., 2022 [23]
LG184.476.4160.451.1187.5122.5173.3427.1
LG2101.277.586.267.3164.8109.1060.3397.3
LG384.768.210369.2151.768.6762.8298.5
LG4122.090.7148.262.7171.9170.3162.1449.3
LG5115.4101.4114.764.4116.776.2068.8451.1
LG699.790.8154.682.1127.7115.3558.8453.9
LG7109.180.4131.476.882.9153.4063.2280.8
LG890.733.8193.967.1163.5258.6077.3129.9
LG9110.493.9207.766.387.987.8681.3482.3
LG1079.885.5221.653.6101.492.1372.4241.1
LG1190.671.7107.154.984.9126.4557.8481.1
Total1088.0870.31628.8715.51440.91380.6738.14092.4
Disclaimer/Publisher’s Note: The statements, opinions and data contained in all publications are solely those of the individual author(s) and contributor(s) and not of MDPI and/or the editor(s). MDPI and/or the editor(s) disclaim responsibility for any injury to people or property resulting from any ideas, methods, instructions or products referred to in the content.