Article

Transcriptomic Analysis Revealed That Low-Density Aphid Infestation Temporarily Changes Photosynthesis and Disease Resistance but Persistently Promotes Insect Resistance in Poplar Leaves

1
State Key Laboratory of Tree Genetics and Breeding, Institute of Ecological Conservation and Restoration, Chinese Academy of Forestry, Beijing 100091, China
2
State Key Laboratory of Tree Genetics and Breeding, Research Institute of Forestry, Chinese Academy of Forestry, Beijing 100091, China
3
Research Institute of Forest Ecology, Environment and Protection, Chinese Academy of Forestry, Beijing 100091, China
4
Shandong Research Center for Forestry Harmful Biological Control Engineering and Technology, College of Plant Protection, Shandong Agricultural University, Taian 271002, China
*
Author to whom correspondence should be addressed.
These authors contributed equally to this work.
Forests 2023, 14(9), 1866; https://doi.org/10.3390/f14091866
Submission received: 4 August 2023 / Revised: 8 September 2023 / Accepted: 11 September 2023 / Published: 13 September 2023
(This article belongs to the Section Genetics and Molecular Biology)

Abstract

:
Insect infestations cause substantial changes in the leaves they attack, but the effects of insect infestation on photosynthesis and gene expression in the whole infestation period are rarely reported. In this study, the effects of poplar aphid (Chaitophorus populialbae Boyer de Fonscoloube) on photosynthetic rate and gene expression of Populus alba var. pyramidalis were studied, from 2 to 36 days after low-density aphid inoculation (DAI). The results revealed a dynamic change of photosynthesis in poplar after aphid infestation: compensatory increased at 8 DAI, was inhibited at 17 DAI, but repaired after 21 DAI. Aphid infestation promoted the expression of the majority of differentially expressed genes (DEGs) at 4, 6, 8, and 21 DAI. The DEGs were enriched into a plant–pathogen interaction, plant hormone signal transduction, and MAPK signaling pathway, suggesting a significant but transient resistance to disease or other stresses. Photosynthesis-related DEGs were downregulated at 8 DAI, which might result in photosynthetic inhibition at 17 DAI. The expression of flavonoid biosynthesis-related DEGs dynamic changed from all downregulated at 2 DAI to almost all upregulated at 21 DAI, suggesting a persistent resistance to insect infestation. This study reveals dynamic changes in photosynthesis, resistance to pathogens, and insects in poplar leaves after aphid infestation.

1. Introduction

Poplar is an important economic tree in the Northern Hemisphere and plays important roles in environmental management and wood shortages [1]. With global climate change, poplar is encountering an increasing number of environmental stresses, including abiotic stresses (drought, high temperature, radiation, etc.) and biotic stresses (bacteria, fungi, viruses, etc.) [2,3,4,5]. Moreover, poplar is damaged by infestation of pests, such as beetles and aphids [6].
Aphids (superfamily Aphididae), the common name for some sap-sucking and soft-bodied insects, are also called plant louse, greenflies, or ant cows within the order Homoptera. Aphids are serious plant pests and may stunt plant growth, cause plant gall production, transmit plant virus diseases, and cause deformation of leaves, buds, and flowers. Aphid species infest many plants, such as vegetables, grasses, and some deciduous tree species (at the beginning and end of a season), such as poplar trees. In China, the dominant aphid species of poplar trees are Chaitophorus populialbae Boyer de Fonscoloube and C. populeti (Panzer); the former is dominant in spring and the latter in summer–autumn [7,8]. These aphids feed on some native poplar species, such as Populus tomentosa, P. hopeiensis Hu et Chow, P. alba var. pyramidalis Bge., and Populus × beijingensis W. Y. Hsu. Aphids produce two different types of saliva: the first type can prevent plant reactions at the site of feeding [9], and the second type contains digestive/lytic enzymes that can destroy neighboring host tissues. Aphid saliva injected can be extremely toxic, leading to localized chlorosis near the feeding site and around the stylet tracks caused by chloroplast disruption [10].
Photosynthesis is a complex physiological and biochemical process, and the photosynthesis rate and efficiency are affected by the plant growth status, developmental stage and abiotic or biotic environmental factors. Insect herbivores can substantially and directly reduce photosynthesis by removing plant tissue, e.g., green leaves. Insect infestation can also impair the meristem and apical dominance of hosts, damage the photosynthetic apparatus, and decrease the usage of light energy [11]. As mentioned above, the saliva of aphids may cause chloroplast disruption, decreasing photosynthesis [10,12]. Aphids also impede the photosynthesis and respiration of plants through their well-known excreted honeydew, which can cover the surface of host green leaves [13]. Insect-induced changes in chemistry and metabolism further alter the photosynthetic capacity of the remaining leaf tissue as an indirect effect of herbivory [14,15,16]. Large reductions in photosynthesis in leaves attacked by mesophyll feeders such as spider mites and stink bugs have also been measured [17,18,19]. Low aphid densities (fewer than 50 aphids/leaf) can significantly reduce the photosynthesis of soybean hosts; however, the conventional view of aphid injury acting through reductions in photosynthetic electron transport, chlorophyll content, and light-harvesting reactions of photosynthesis is not supported by the findings in this system [20]. Studies have also illustrated the dynamic change in photosynthesis in plant–insect interactions; for example, the photosynthesis rate increases and then decreases for a short time after infestation in cotton/Tetranychus urticae Koch [21] and tea plant/Ectropis obliqua [22]. In other cases, the photosynthesis rate was found to increase for a relatively long period (at 3, 7, 11, and 16 weeks after aphid infestation) in field-grown Pinus radiata trees [23]. Such an increase in photosynthesis and respiration characteristics (including photosynthetic rates, leaf chlorophyll content, water use efficiency, photosynthetic enzyme activity, respiration rate, etc.) was considered compensatory growth of the host plant after biotic or mechanical damage of the leaf, which is an important regulatory mechanism for plants to adapt to stress and survive by regulating physiological characteristics [24,25,26]. Photosynthetic compensation (increasing photosynthesis) and photosynthetic inhibition are both basic physiological responses to insect herbivory. Nonetheless, whether and how long the effect of insect herbivory persistently acts on host plants still needs more investigation.
Extensive studies have shown that insect infestation significantly changes gene expression in host plants. Inhibition of the expression of photosynthesis-related genes has been investigated in many plant hosts [27,28,29]. For example, the expression of rubisco and rubisco activase, which are two key enzymes in photosynthesis-related to plant resistance to pathogens, was shown to be downregulated in tobacco [30,31]. In addition, insects or pathogens decrease the expression of genes encoding antenna proteins involved in photosynthesis [27,32,33,34,35]. Gene coding for proteins in photosystem I (PSI) and photosystem II (PSII) reaction centers, ATP synthase, and several elements of the light-harvesting complex (LHCII) associated with PSII is downregulated by diverse biotic damages [29]. Expression of the many genes of photosystem I/II protein and chlorophyll a/b binding protein is inhibited by forest tent caterpillars (Malacosoma disstria) in P. trichocarpa × P. deltoids [36]. In contrast to the downregulated expression of genes involved in photosynthesis, it is reported that insect infestation significantly increases the expression of genes related to stress resistance [27,28]. Transcript levels of genes involved in jasmonic acid (JA) synthesis and those involved in responses to salicylic acid (SA) and ethylene (ET) suggest that the downregulation of photosynthesis-related genes is part of a defense response [29]. Such upregulation of defense-related genes and downregulation of photosynthesis-related genes are believed to be basic and common responses of hosts to leaf damage, regardless of the type of biotic attack [29]. Wool. et al. (1996) found that previous infestation reduced population growth of subsequently colonizing aphids by 30% compared with uninfected controls in cotton plants/Aphis gossypii, which demonstrated the induction of aphid resistance in the plant [37]. However, one study proposed that the defensive behavior against herbivory is the tolerance of plants [38]. Züst et al. (2016) reviewed the response patterns in aphid–plant interactions, and identified general patterns of resistance, in particular, the study focused on recognition, phytohormonal signaling, secondary metabolites, and induction of plant resistance [39]. In addition, research has also illustrated that insect herbivory increases the accumulation of flavonoids, a chemical defense substance for insects in different plants [40,41,42]. The contents of flavonoids and anthocyanins were significantly increased in both sexes but were higher in females [43]. Therefore, in this study, this defensive behavior was described as plant resistance but not plant tolerance, with regard to aphids. However, the dynamic change in resistance induced by insect herbivory should be further investigated.
Poplar can be infected by various fungal pathogens, viruses, and pests and be taken as a model species for research on plant pathology [44,45,46] and plant pests. In northern China, some aphid species always infest and are located on immature poplar leaves in April and May in 1- and 2-year-old poplar plantations. However, little is known about whether and how aphid infestation changes poplar physiology and defense.
In this study, using a manipulative experiment, we investigated gas exchange parameters and genome-wide gene expression patterns over a relatively long period (2 to 36 days after inoculation, DAI) in aphid-infested poplar. Specifically, we addressed to uncover the following questions: What is the dynamic change and shift in photosynthesis after aphid infestation in host poplar leaves? Can aphids induce tentative or long-term pathogen resistance? Can aphid infestation induce the expression of genes involved in the chemical defense pathway in poplar leaves?

2. Materials and Methods

2.1. Plant Materials and Insects

This study was conducted from May to June 2021 in the experimental field of the Chinese Academy of Forestry (Beijing, China). The 1-month-old P. alba var. pyramidalis saplings used were cultivated in pots containing a growing substrate of peat and perlite (v:v = 4:1). The height of the poplar saplings was 18.5 ± 1.5 cm, with 8–12 young leaves and 2–3 leaf buds. No pests or diseases were observed in the saplings. Moreover, to remove hidden larvae or eggs of insects, the whole poplar saplings and the growth substrate were sprayed two times with 5000 diluents of 10% imidacloprid at 6 and 3 days before aphid infestation. All saplings used in this study were well-watered during the experiments.
The aphid species (Chaitophorus populialbae Boyer de Fonscoloube) used in this study belongs to the family Chaitophoridae, genus Chaitophorus Koch, and was collected from 2-year-old P. alba var. pyramidalis saplings. At the beginning of the growing season (from April to May), aphid (C. populialbae) adults and larvae inhabited the abaxial surface of the newly sprouted leaves, youth stems, or axillary buds of P. alba var. pyramidalis. Before inoculation, third ~ fourth instar larvae of C. populialbae were carefully collected from poplar leaves using a soft brush and then immediately transferred to young P. alba var. pyramidalis saplings.

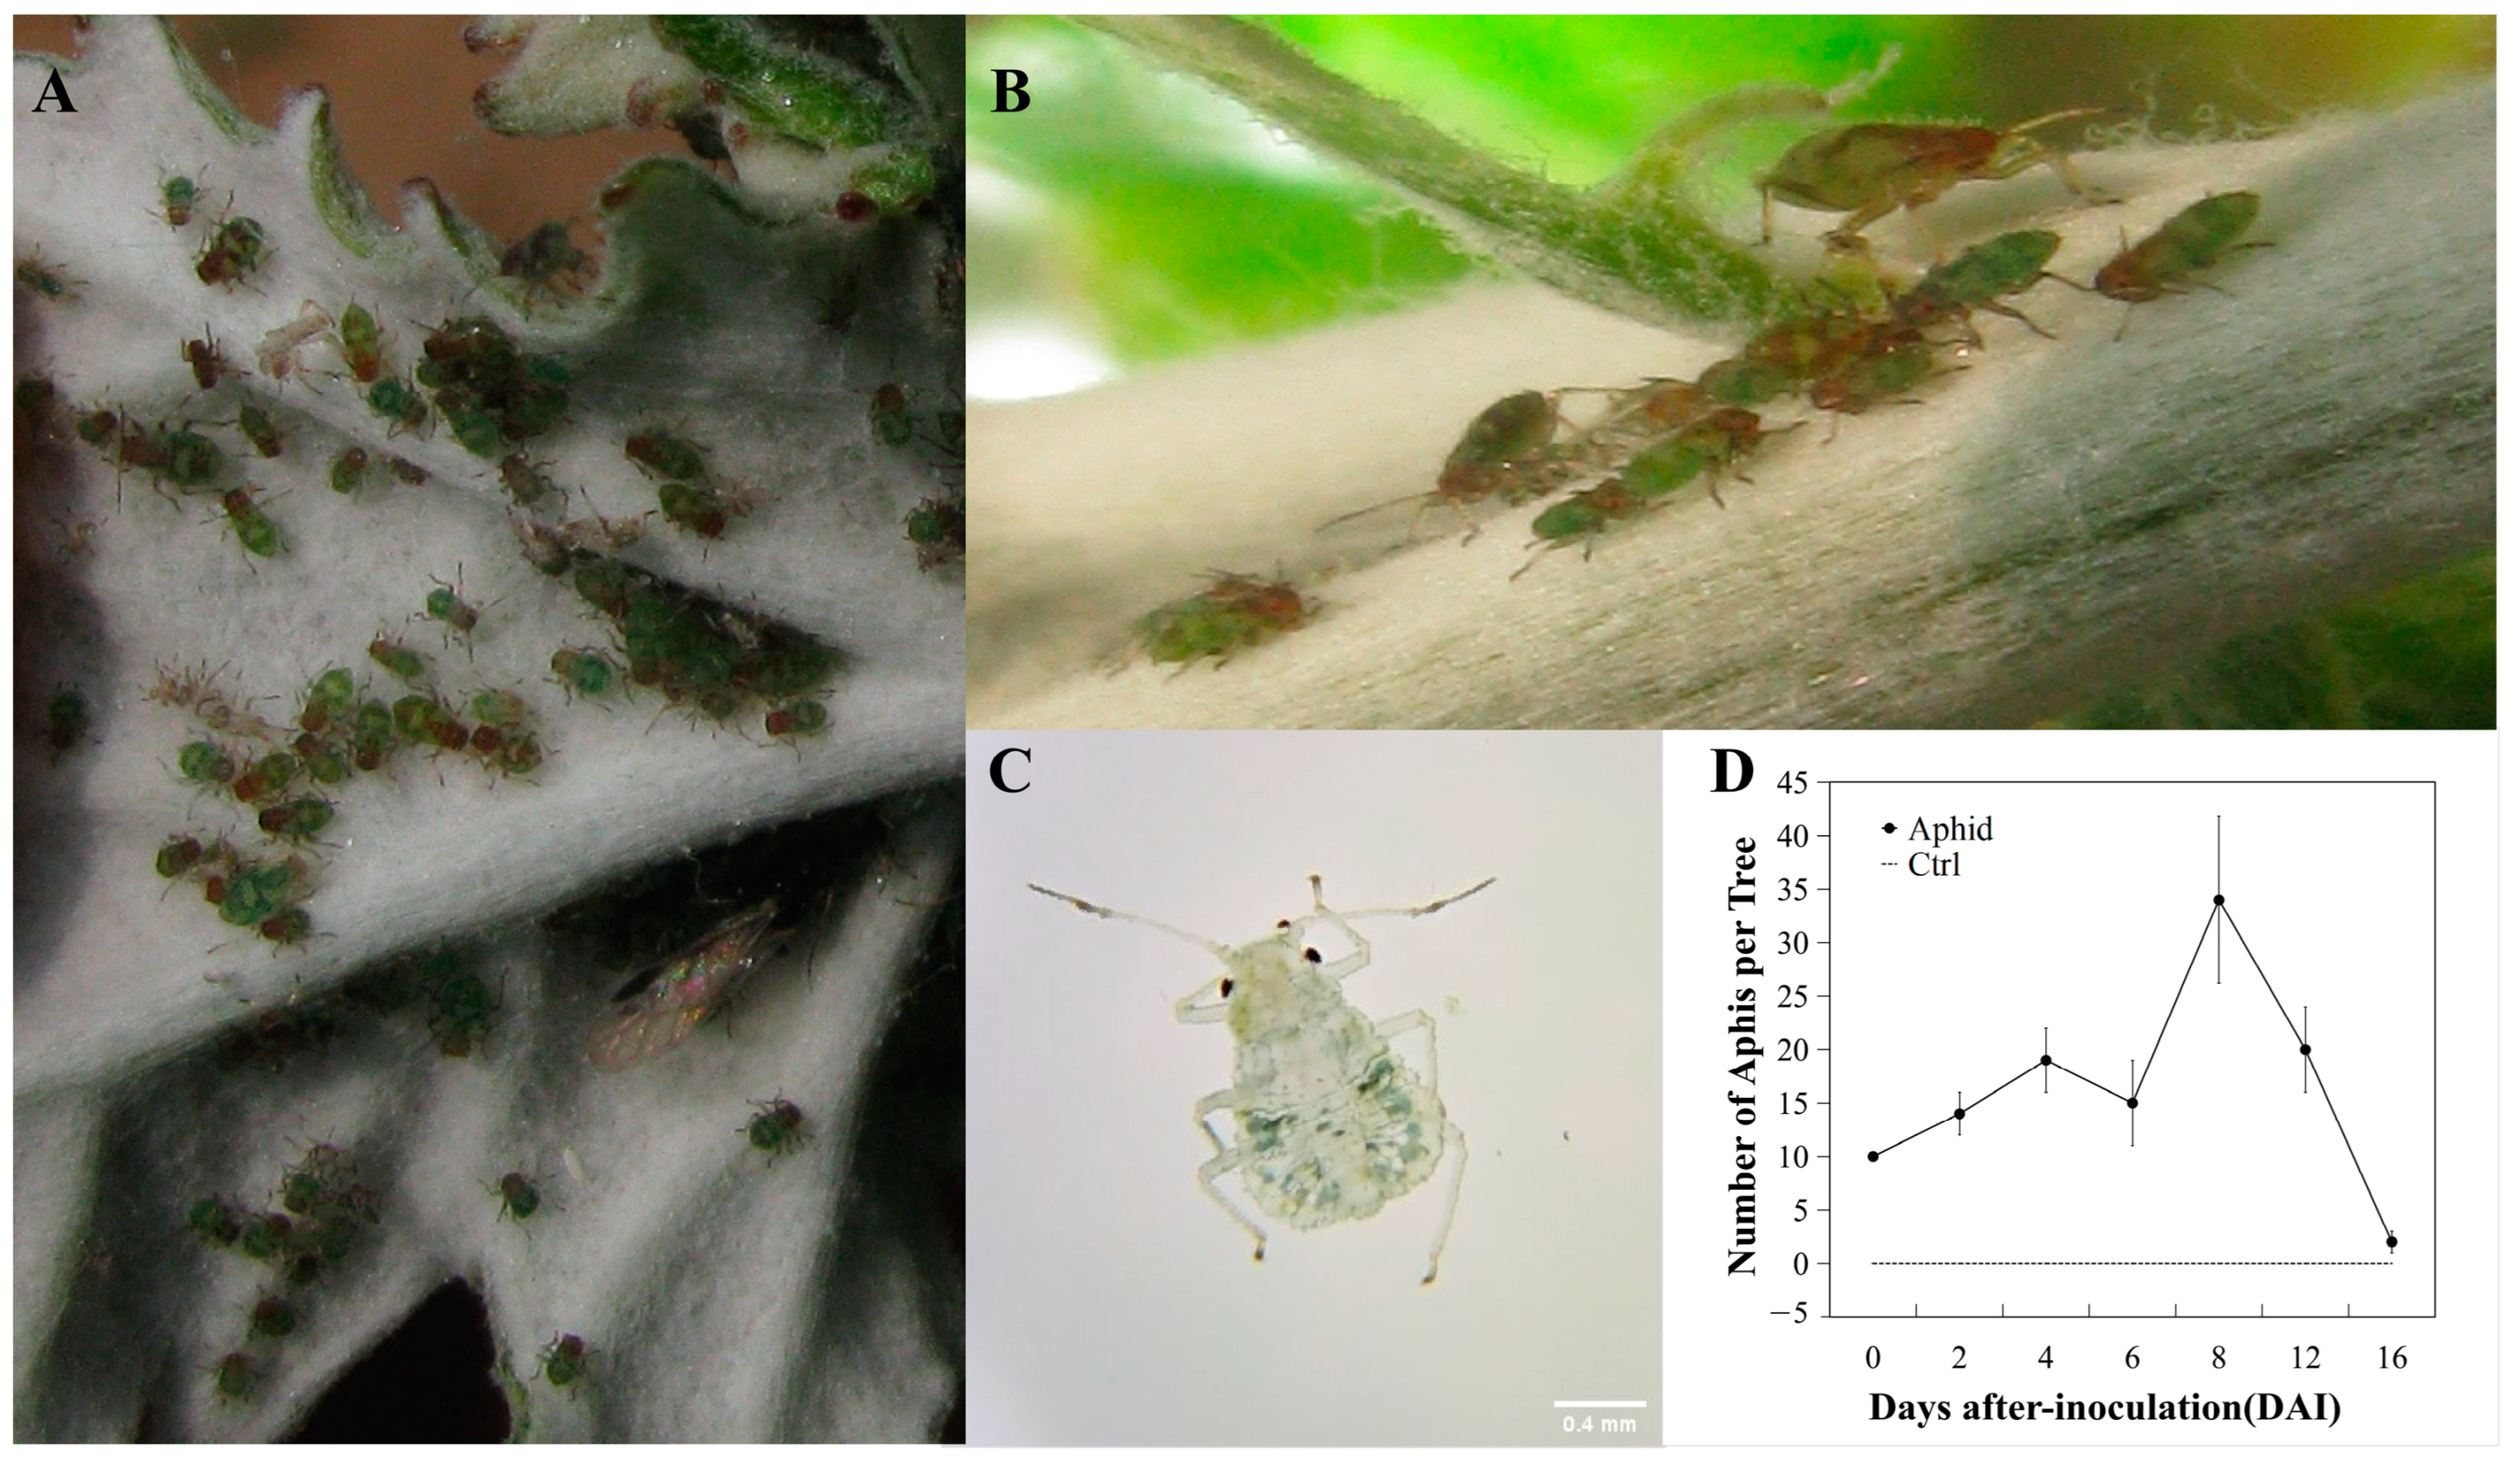
2.2. Aphid Inoculation

In total, 72 P. alba var. pyramidalis saplings were randomly divided into 2 groups, with 36 saplings in each group. In the aphid inoculation group, 10 aphids were carefully transferred to the poplar abaxis using a soft brush. In this study, from the top to the bottom, the 4th or 5th leaves of the poplar saplings were marked, and half of them were inoculated by aphids. The other half of the poplar saplings were taken as the control. To prevent natural infestation of other aphids/insects on the saplings or predation from aphid predators, the saplings in the groups were located at different sites in the experimental fields (far more than 50 m), and every 9 saplings were covered with nylon nets (18 mesh) after inoculation or mock inoculation.

2.3. Determination of Gas Exchange and Photosynthesis

In this study, gas exchange was measured on aphid-infested mature leaves with a Li-6400 portable gas-exchange system (LI-COR, Lincoln, NE, USA) in two independent experiments [45,46], in May 2022 and April to May 2023. The same leaflet of each sapling was measured in the gas-exchange assays during all experiments unless the leaflet was damaged. All gas-exchange measurements were conducted between 9:00 and 11:00 a.m. Photosynthesis was induced under saturating light (1500 μmol m−2 s−1) and ambient CO2. Nine control or inoculation saplings were measured in this study.

2.4. Transcriptomic Assays

In this study, poplar leaves at six time points (2, 4, 6, 8, 12, and 21 DAI) were collected for total RNA extraction. However, the poplar samples at 12 DAI were missed due to a technical failure. Then, only the samples at 2, 4, 6, 8, and 21 DAI were used to investigate the influence of aphid inoculation on gene expression patterns of poplar. Leaf samples were collected from the top 4–5 leaves. Three control and aphid-inoculated saplings were used. cDNA library construction, RNA sequencing, and bioinformatic analysis were conducted using BioMarker Technology Corporation (Beijing, China). Total RNA extraction and transcriptomic assays referred to Li et al. [44]. Only RNA samples with a 260/280 ratio of 1.9–2.1 and RIN value (RNA integrity number) > 7.0 were analyzed. Sequencing libraries were generated using 1 μg of RNA per sample and an NEBNext Ultra RNA Library Prep Kit (NEB, Ipswich, MA, USA) for Illumina following the manufacturer’s recommendations. Briefly, oligo (dT) primers were used in the synthesis of the first strand of cDNA; RNA sequencing was conducted using the Illumina platform and paired-end reads were generated. StringTie [47] was applied to assemble the mapped reads and count. After removing low-quality and adapter reads, clean reads were mapped to the Populus genome database (Phytozome12, Populus trichocarpa v.3.0) using Hisat v2.1.0 [48]. The assembled genes were functionally annotated based on NCBI nonredundant protein (Nr) and nonredundant nucleotide (Nt) (http://www.ncbi.nlm.nih.gov/, accessed on 11 October 2021), Swiss-Prot (http://web.expasy.org/docs/swiss-prot_guideline.html, accessed on 11 October 2021), and Kyoto Encyclopedia of Genes and Genomes (KEGG) (http://www.genome.jp/kegg/kegg2.html, accessed on 11 October 2021) databases. DEseq2 [49] was applied to identify differentially expressed genes (DEGs) between two groups. Gene expression was measured in fragments per kilobase of transcript and per million fragments mapped (FPKM). Pearson correlation analysis and hierarchical clustering analysis based on all RPKM data were performed to evaluate the consistency of the samples in one group. DEGs were identified using the following criteria: log2FC (fold change in expression) ≥1 or ≤−1 and false discovery rate (FDR) ≤ 0.01; or, for unique genes, FDR < 0.01 was used as the threshold for DEGs. The enrichment analysis of DEGs was conducted using package clusterProfiler in R 3.10.1.

2.5. RT-qPCR Validation of Differentially Expressed Genes (DEGs)

To validate the accuracy of the gene expression results, 26 candidate DEGs identified with transcriptomic analysis were validated with RT-qPCR using an rTaqMix Kit from Takara Bio (Dalian) Co. (Dalian, China). The PCR primers used were designed using the National Center for Biotechnology Information Primer BLAST tools (available online: http://www.ncbi.nlm.nih.gov/tools/primer-blast/, accessed on 1 January 2022). The primer sequences and their annealing temperatures are listed in Supplementary Table S1. In this study, EF1β was selected as the best reference gene for RT-PCR. Relative transcript levels of target genes were calculated using the 2−ΔΔCt formula. The delta Ct method was used as outlined by the Zhao et al. method [50]. All RT-PCR analyses were performed with four biological and technical replications.

3. Results

3.1. Morphology of Aphid Infestations of Poplar Saplings

In this study, a poplar aphid species (C. populialbae) was used to infest 1-month-old P. alba var. pyramidalis saplings (Figure 1A–C). At the beginning of the infestation experiment, ten aphids were transferred to the abaxis of youth leaves (the third or fourth leaves from top to base) of each poplar sapling using a soft brush. During this experiment, the infestation of aphids on the poplar saplings did not result in leaf deformation. As shown in Figure 1D, the aphid density value peaked at 8 DAI, with approximately 34 aphids/saplings (including the adult and larval insects), but decreased quickly in the following days, with approximately 20 aphids/saplings at 12 DAI. However, no living aphids were observed on the infested saplings at and after 16 DAI. Moreover, no aphids were observed in the control poplar saplings during the experiments. This result was also validated in another independent infestation experiment carried out in May 2022. The increase in aphid density was due to the location and reproduction of aphids after infestation; however, the reason for the decrease in aphids is unclear. In our field observations in Beijing, a peak population of C. populialbae was always observed on the young leaves, stems, and buds of P. alba var. pyramidalis from May to June. Therefore, mature leaflets, conditions (weather factors), or feeding by unknown aphid predators are speculated as the reason for the decrease in aphid density. Compared to the large number of aphids observed in the naturally occurring aphid infestation (Figure 1A,B), the peak value of aphids was relatively small, and the results derived from this study illustrate the physiological and gene expression characteristics of low-density aphid infestation of poplar.

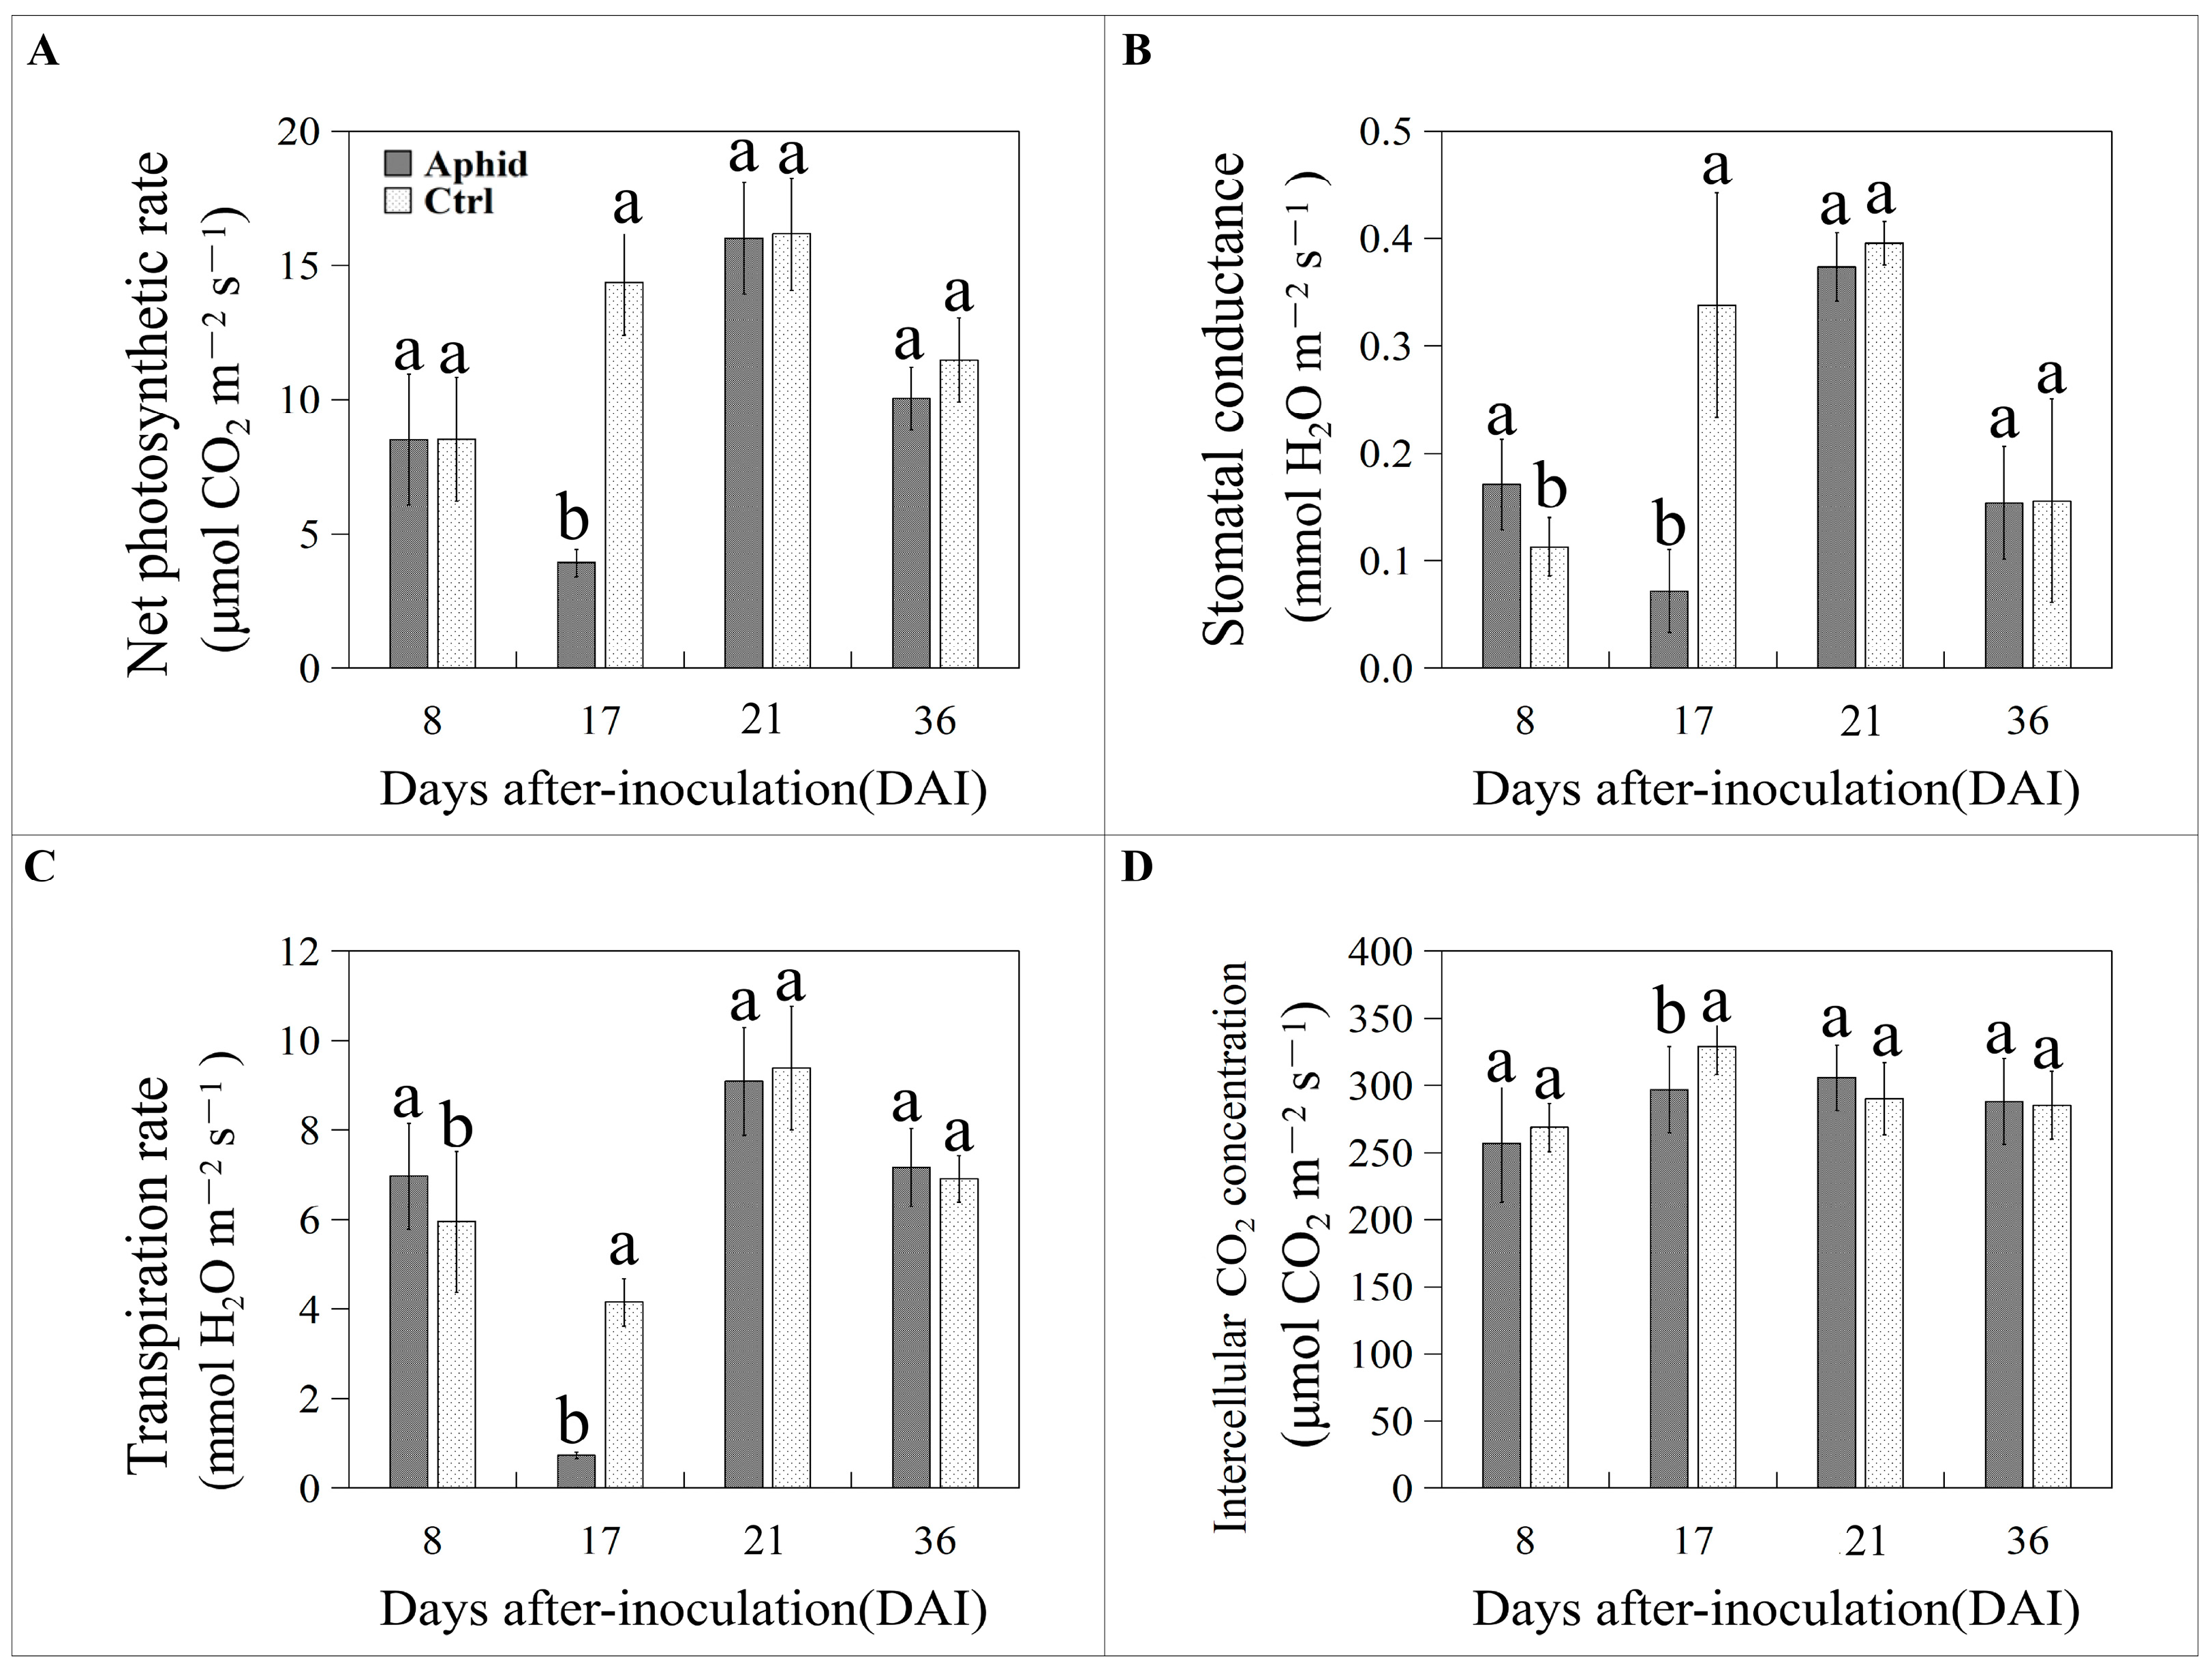
3.2. Aphid Inoculation Temporarily Changes Gas Exchange Parameters in Poplar Leaves

Two independent experiments were performed to determine the gas exchange in this study. The first experiment was conducted at 8, 17, 21, and 28 DAI in May 2022. As shown in Figure 2, aphid inoculation did not alter the net photosynthetic rate (Pn) or intercellular CO2 concentration (Ci) of poplar but promoted the stomatal conductance (Gs, +51.51%) and transpiration rate (Tr, +17.02%) at 8 DAI. The high values of Gs and Tr at 8 DAI suggested that aphids induced compensatory photosynthesis in poplar leaves. Aphid inoculation significantly inhibited Pn (−72.70%), Gs (−78.82%), Tr (−82.45%), and Ci (−9.79%) at 17 DAI (independent samples t test, p < 0.05). However, aphid inoculation did not alter gas exchange characteristics at 21 and 36 DAI (Figure 2A–D). We did not collect gas exchange data until 8 DAI for tiny and small poplar leaves, which are not suitable for measurement. According to existing gas exchange data, the whole process of aphid inoculation can be assumed to occur in 3 stages: the early stage (0–7 DAI, photosynthesis may be maintained); medium stage (8–16 DAI, photosynthesis compensation); and late stage (17–36 DAI, photosynthesis inhibition). In summary, aphid infestation temporarily changed host photosynthesis, first promoting and then inhibiting photosynthesis, and more importantly, the photosynthesis inhibition induced by aphids was not maintained for 3–4 weeks in poplar. The second experiment was conducted at 8, 17, 21, and 28 DAI in April to May 2023, the plant materials and inoculation method were the same as those in the first experiment. Nine biological replicates in each aphid-inoculation treatment and control were used. Aside from the changing of Tr at 21 DAI, the changing of gas exchange of poplar is similar with the results in the first experiment (Supplementary Figure S1).

3.3. Influence of Aphid Inoculation on Gene Expression in Poplar Leaves

In this study, gene expression in poplar leaves at 2, 4, 6, 8, and 21 DAI was assayed using transcriptome sequencing. Each sequencing dataset (in all 30 transcriptomic datasets: 15 aphid inoculation and 15 control groups) produced at least 6.28 G clean reads; this number is 12.87 times the whole genome sequence of P. trichocarpa (~500 MB), sufficient for subsequent gene expression analysis. Pearson correlation analysis of gene expression showed that the UC-02-R2 sample had low similarity with the other sample in the control group (0.71 and 0.74, respectively), lower than the recommended value (0.80). To acquire accurate results, expression data for one control sample (UC-02-R2) were omitted from this study. In addition to the control group at 2 DAI, 3 replicates in other inoculation or control groups were used in this study.

3.3.1. Aphid Inoculation Induces a Transient Significant Change in Gene Expression at the Genome-Wide Level in Poplar Leaves

The results showed that different numbers of DEGs were identified in poplar samples at 2, 4, 6, 8, and 21 DAI; however, only 19 and 111 DEGs were identified at 2 and 21 DAI, respectively, which accounted for 0.04% and 0.24% of all annotated poplar genes (45,555 genes, Populus trichocarpa genome v3.0). In fact, the numbers of DEGs identified at 4, 6, and 8 DAI were far more than those identified at 2 and 21 DAI. The number of DEGs identified at 4, 6, and 8 DAI (2691, 1595, and 1938, respectively) was at least 84.0 times the number of DEGs identified at 2 DAI and at least 14.4 times the number of DEGs identified at 21 DAI. The reason for the limited DEGs at 2 DAI might be that aphid inoculation cannot induce a response of sufficient intensity in a relatively short period (48 h) in poplar leaves. Due to far more DEGs identified at 4, 6, and 8 DAI, the limited DEGs identified at 21 DAI suggest that aphid inoculation cannot persistently impact gene expression in poplar leaves. Therefore, this result indicates that aphid inoculation induces a transient but significant change in gene expression at the genome-wide level in poplar leaves. In addition to the DEGs identified at 2 DAI, the results illustrated that the majority of DEGs were upregulated in the aphid-inoculated poplar leaves at 4, 6, 8, and 21 DAI (chi-square test, p < 0.01) (Table 1). Hence, aphid infestation might increase the expression of genes involved in specific metabolic pathways, cellular components, etc. but this influence does not endure for a long period of time.

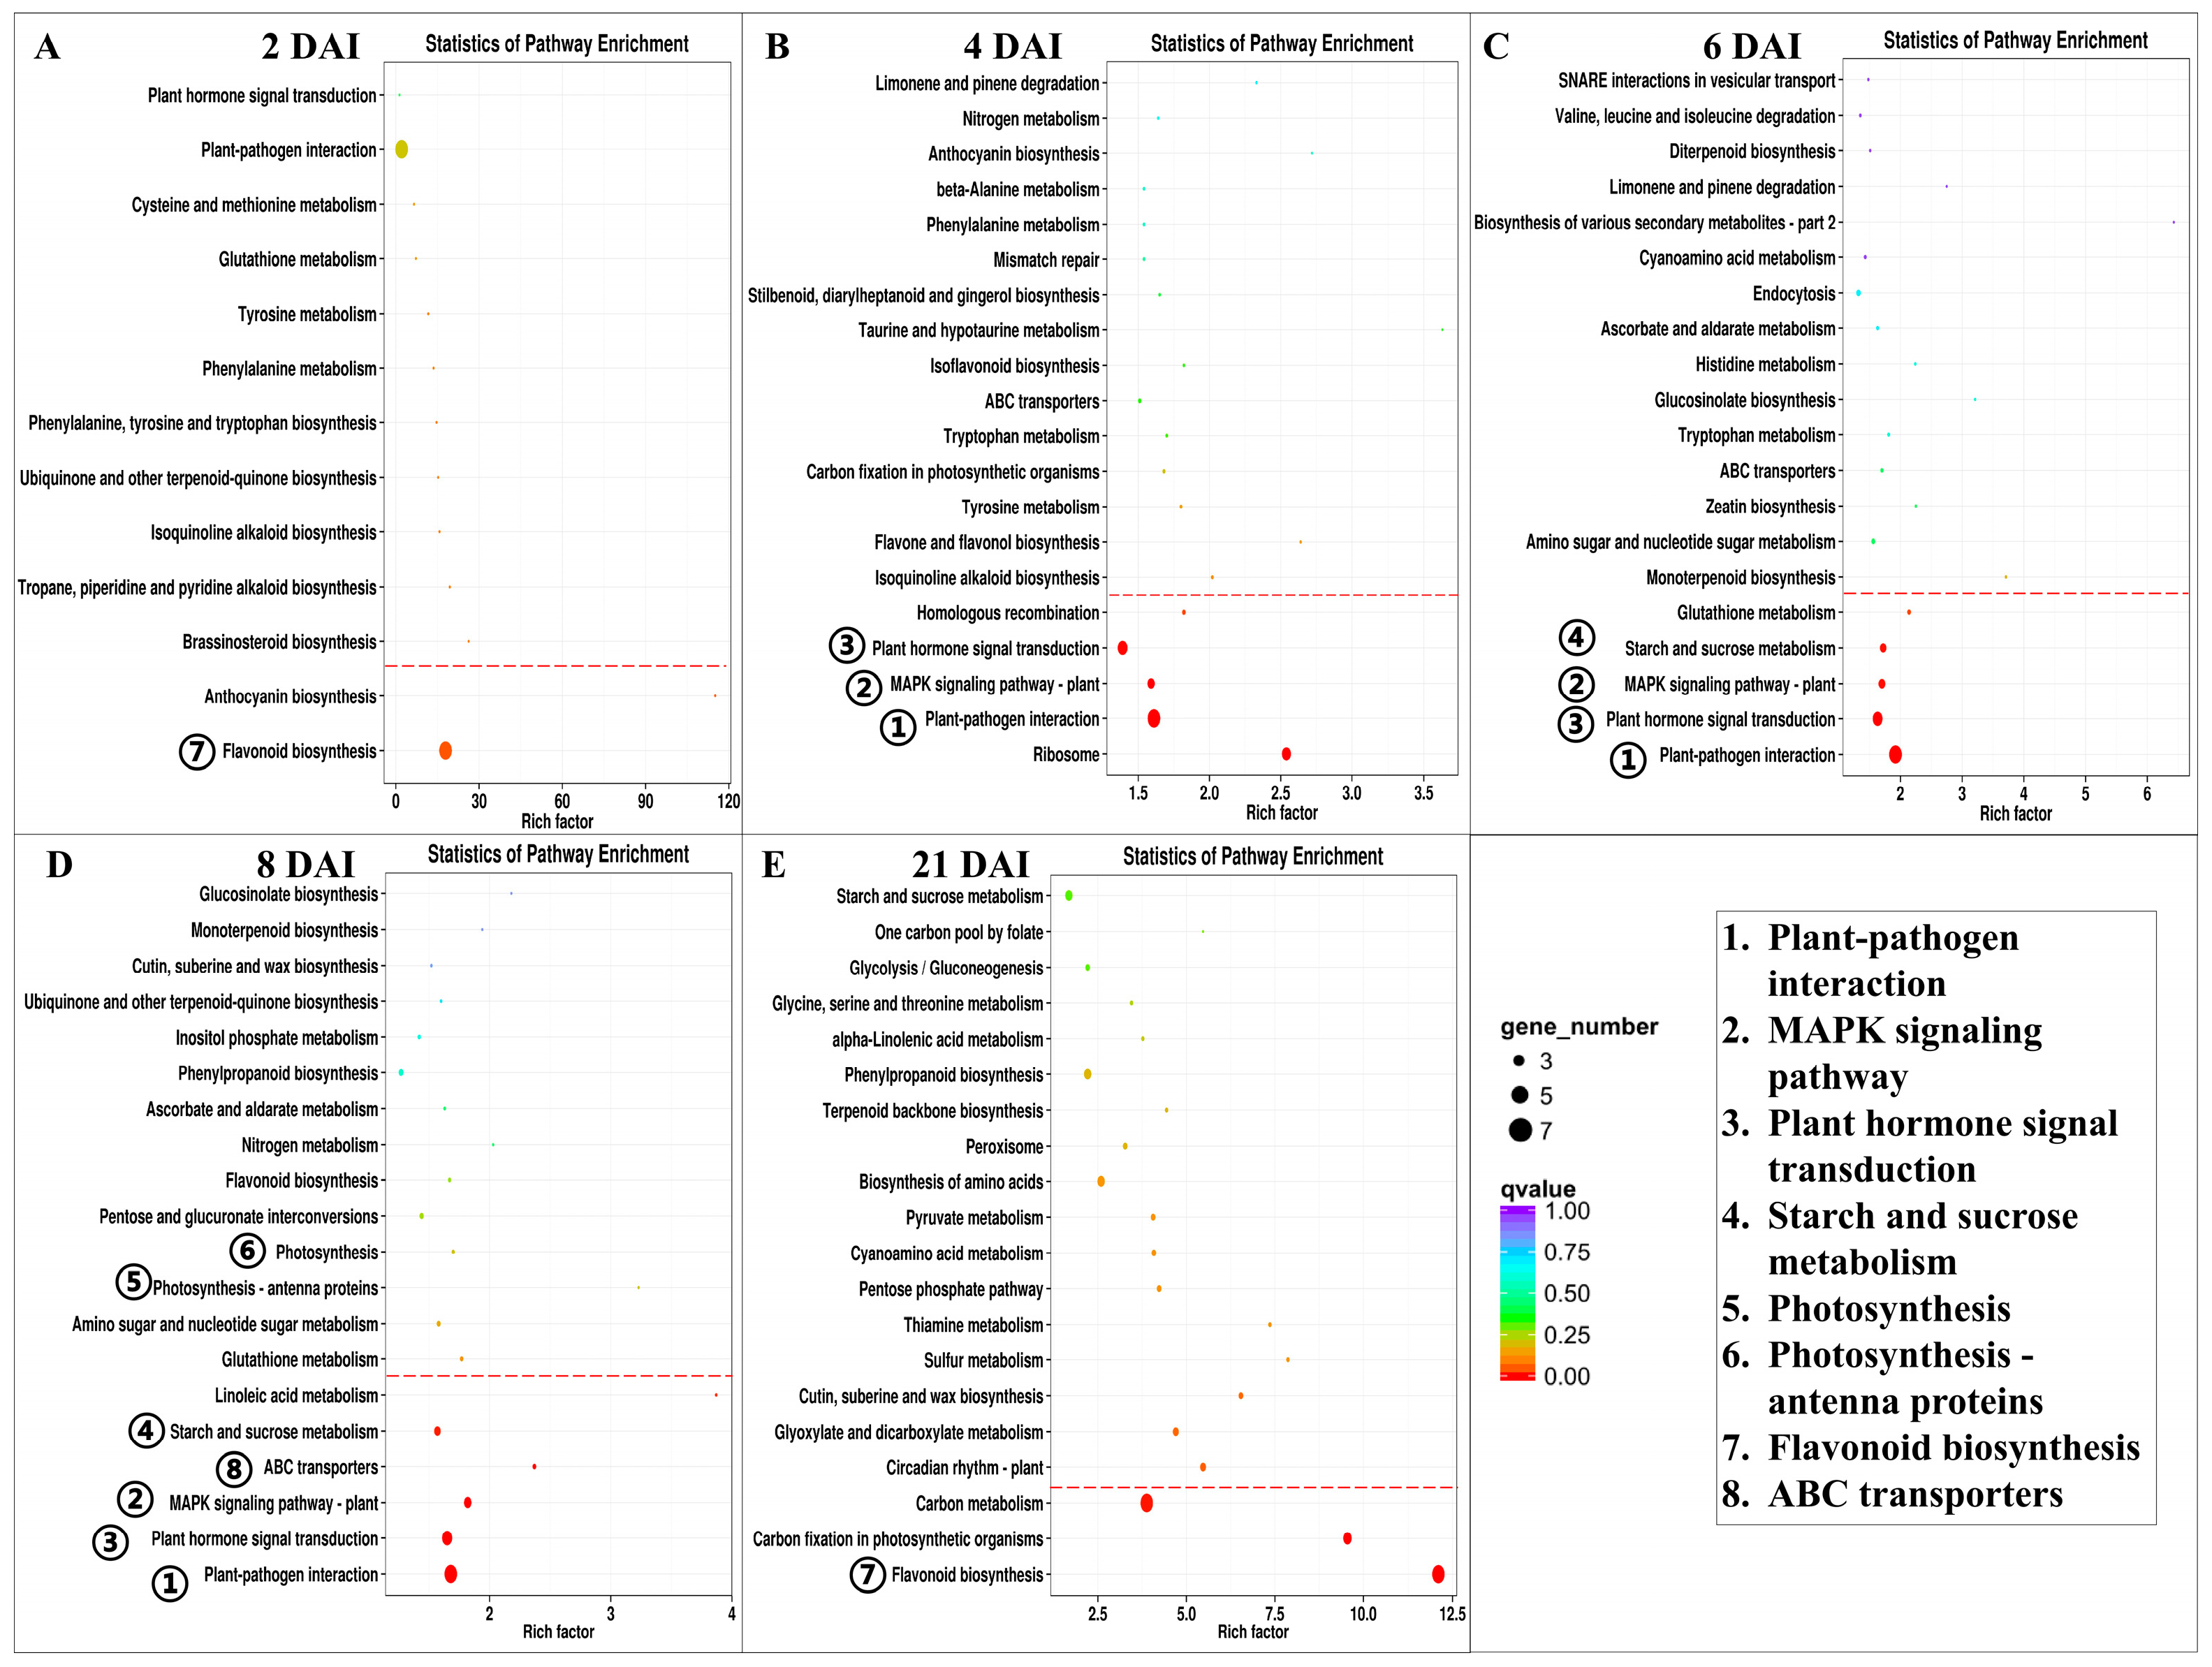
3.3.2. Functional Analysis of DEGs in Poplar Leaves

As mentioned above, aphid inoculation significantly changed genome-wide gene expression in poplar at 4, 6, and 8 DAI, and the function analysis of DEGs at these three time periods was conducted. As shown in Figure 3, aphid inoculation induced similar response patterns, and the DEGs identified were enriched in three common metabolic pathways: plant–pathogen interaction, plant hormone signal transduction, and MAPK signaling pathway at 4, 6, and 8 DAI (q value < 0.05). Starch and sucrose metabolism pathways were also enriched at 6 and 8 DAI (q value < 0.05).

3.3.3. Aphid Inoculation Promotes Expression of Genes Involved in Plant–Pathogen Interactions, Plant Hormone Signal Transduction, MAPK Signaling Pathway, and ABC Transporters

In this study, poplar saplings were infested by aphids and not bacteria, fungi, or viral pathogens. However, the most abundant DEGs were enriched in the plant–pathogen interaction pathway at three time points: 170 DEGs, accounting for 6.3% of all DEGs at 4 DAI; 115 DEGs, accounting for 7.2% of all DEGs at 6 DAI; and 137 DEGs, accounting for 7.0% of all DEGs at 8 DAI. However, the plant–pathogen interaction pathway was not enriched at 2 and 21 DAI. Moreover, the results showed that aphid inoculation significantly promoted expression of genes in this pathway (chi-square test, p < 0.01); 58 DEGs were upregulated at 4, 6, and 8 DAI; and only 8, 7, and 3 DEGs were downregulated at 4, 6, and 8 DAI, respectively (Figure 4).
There are two kinds of plant immune systems: PAMP-triggered immunity (PTI) and effector-triggered immunity (ETI). In this study, not only genes involved in PTI but also those involved in ETI were upregulated. For example, two genes encoding receptor protein FLS2, which recognizes bacterial flagellin (flg22) (Potri.003G150100 and Potri.003G150000); genes encoding receptor-like protein kinase BAK1 (Potri.004G231600, encoding leucine-rich repeat receptor protein kinase); and a calmodulin gene (CaMs, Potri.004G122900) were all upregulated at 4, 6, and 8 DAI in aphid-inoculated poplar. In addition, MKK4/5 genes (Potri.002G037500, Potri.005G225600, Potri.008G167700, Potri.013G046500, Potri.019G018600) and the respiratory burst oxidase gene Rboh (Potri.003G133300, Potri.003G159800, Potri.006G137300) were upregulated at 8 DAI. In ETI, the RPS2 family gene (Potri.016G137900, encoding a resistance protein by promoting plant hypersensitivity) was also upregulated at 4, 6, and 8 DAI (Table S2). Therefore, the increase in gene expression of DEGs in the plant–pathogen interaction pathway suggests that aphid inoculation (through aphid salivary manipulation, perhaps) increases plant resistance or immunity to pathogens after a short period (4–8 DAI).
The second most abundant enriched pathway was the signal transduction pathway of plant hormones. As depicted in Figure 4B, a total of 127, 84, and 107 DEGs were enriched in this pathway at 4, 6, and 8 DAI, respectively. Moreover, aphid inoculation promoted expression of the majority of all DEGs (chi-square test, p < 0.01). In this study, aphid inoculation significantly changed gene expression in different hormone transduction pathways. In the SA signaling pathway, for example, the SA receptor protein NPR1 gene (Potri.002G056500); transcript factor TGA gene (interact with NPR1, Potri.009G164300); and PR1 resist protein genes (Potri.009G083100, Potri.009G083300) were upregulated at 4, 6, and 8 DAI, suggesting that aphid inoculation activates resistance to disease. Furthermore, aphid inoculation promotes the expression of genes involved in the JA pathway. Examples include the transcript factor MYC2 gene (Potri.018G141800) and SnRK2 protein gene (Potri. T011000, which is associated with ABA signal transduction), which were also upregulated at 4, 6, and 8 DAI; the former is considered to be related to plant senescence and the stress response, and the latter might be the reason for stomatal closure in aphid inoculation samples. This result suggests that aphid infestation increases poplar resistance through hormone signal transduction. Expression of the auxin transport vector AUX1 gene (Potri.008G066400) was upregulated at 4, 6, and 8 DAI, and that of two other AUX1 genes (Potri.009G149900 and Potri.005G174000) was upregulated at 4 and 8 DAI, respectively; the auxin receptor TIR1 gene (Potri.011G066700) was upregulated at 4 DAI. Moreover, expression of the ARF transcription factor gene (Potri.006G077800, which regulates expression of auxin response genes) was upregulated at 4 and 8 DAI (Table S2), further promoting transcription of the auxin early-responsive genes after aphid inoculation.
Most genes involved in the MAPK signal transduction pathway were also upregulated after aphid inoculation at 4, 6, and 8 DAI (75/11, 47/5, and 62/5 up-/downregulation patterns, respectively). Moreover, 18 DEGs were co-upregulated in all three time points (Figure 4C). The results illustrate that DEGs involved in the MAPK signal transduction pathway were mainly activated with jasmonic acid (JA) and ethylene. Indeed, a total of 2 JA related transcript factor MYC2 genes (Potri.006G074900, Potri.018G141800) were induced in poplar leaves at 4, 6, and 8 DAI and might play roles in regulation of the root growth response to injury. For example, the expression of the vegetative storage protein 2 gene (VSP2, Potri.016G139700, regulated with JA signal) varied from 4 to 8 DAI: inhibited at 4 DAI, with no difference at 6 DAI, and upregulated at 8 DAI. This result suggests that poplars are able to acquire some resistance to insects, pathogens, and environmental stresses. In the ethylene pathway, aphid inoculation induced expression of the RNA1 gene (Potri.003G075700, a copper ion transporter involved in the binding process of ethylene with ethylene receptor proteins (ETRs)) at 4 DAI. Then, the ethylene signal activated the MKK9-MPK3/6 cascade reaction: The Potri.012G043200 and Potri.009G066100 genes were activated at 4 DAI. The Potri.012G043200 and Potri.015G030700 genes were activated at 6 DAI. The Potri.009G066 gene was upregulated at 8 DAI. Furthermore, the protein kinase MPK3/6 plays key roles in every MAPK signal transduction pathway, and upregulation of the MPK3/6 gene (Potri.009G066100) indicates that every MAPK pathway is activated with aphid inoculation. Activation of MKK9-MPK3/6 might induce expression of ethylene-insensitive 3 transcript factor gene (EIN3), Potri.004G197400, Potri.008G011300, and Potri.009G159200 at 4 DAI. Finally, expression of the downstream ethylene response gene ERF1 (Potri.008G166200) was upregulated at 8 DAI, and that of the chitinase gene ChiB (Potri.010G141600) increased at 4, 6, and 8 DAI (Table S2).
The plant–pathogen interaction, MAPK signaling, and plant hormone signal transduction are three highly interrelated metabolic processes. As illustrated in Figure 4D–F, almost all DEGs appear to play roles in two or three different metabolic pathways; specifically, a total of 31, 17, and 38 DEGs were involved in all three pathways at 4, 6, and 8 DAI, respectively. Moreover, some DEGs were identified at these three timepoints, such as PR1 resist protein genes (Potri.009G083100, Potri.009G083300) and receptor-like protein kinase BAK1 gene (Potri.004G231600) (Figure 4D–F).
In this study, a total of 25 DEGs were enriched in ABC transporters pathway, and most of these genes were upregulated in aphid inoculation samples (23 up- vs. 2 downregulated, p < 0.01). These DEGs mainly coded the ABCB subfamily (5 up- vs. 0 downregulated); ABCC subfamily (4 up- vs. 0 downregulated); and ABCG subfamily (14 up- vs. 2 downregulated). Considering the functions of ABC transporters in the transport of auxins, secondary metabolites, and xenobiotics [51,52] as well as plant development and response to various stresses (including fungal pathogens and drug resistance [53]), the upregulation of DEGs implied an increasing of plant resistance or immunity to pathogens which can reduce the damage after aphid inoculation using ABC transporters pathway.

3.3.4. Aphid Inoculation Triggers Expression of Genes Involved in Starch and Sucrose Metabolism

In this study, KEGG analysis showed that the starch and sucrose metabolism pathways were enriched at 6 and 8 DAI in poplar leaves. In total, 48 and 60 DEGs were identified, with the majority being upregulated at these two time points (34 upregulated vs. 14 downregulated at 6 DAI, 55 upregulated vs. 5 downregulated at 8 DAI, chi-square test, p < 0.01). Among these genes, a total of 8 of 14 genes encoding the glucan endo-1,3-beta-glucosidase gene family and 13 of 13 genes encoding the disease resistance protein RPV1 gene family were upregulated at 6 DAI. A total of 5 of 5 genes in the sucrose synthase gene family, 2 of 20 genes in the alphamylase gene family, and 10 of 14 genes in the glucan endo-1,3-beta-glucosidase gene family were upregulated at 8 DAI. Considering the roles of these genes, this result suggests that aphid inoculation increases resistance to pathogen and environmental stresses at DAI in poplar (Figure 3C,D; Table S2).

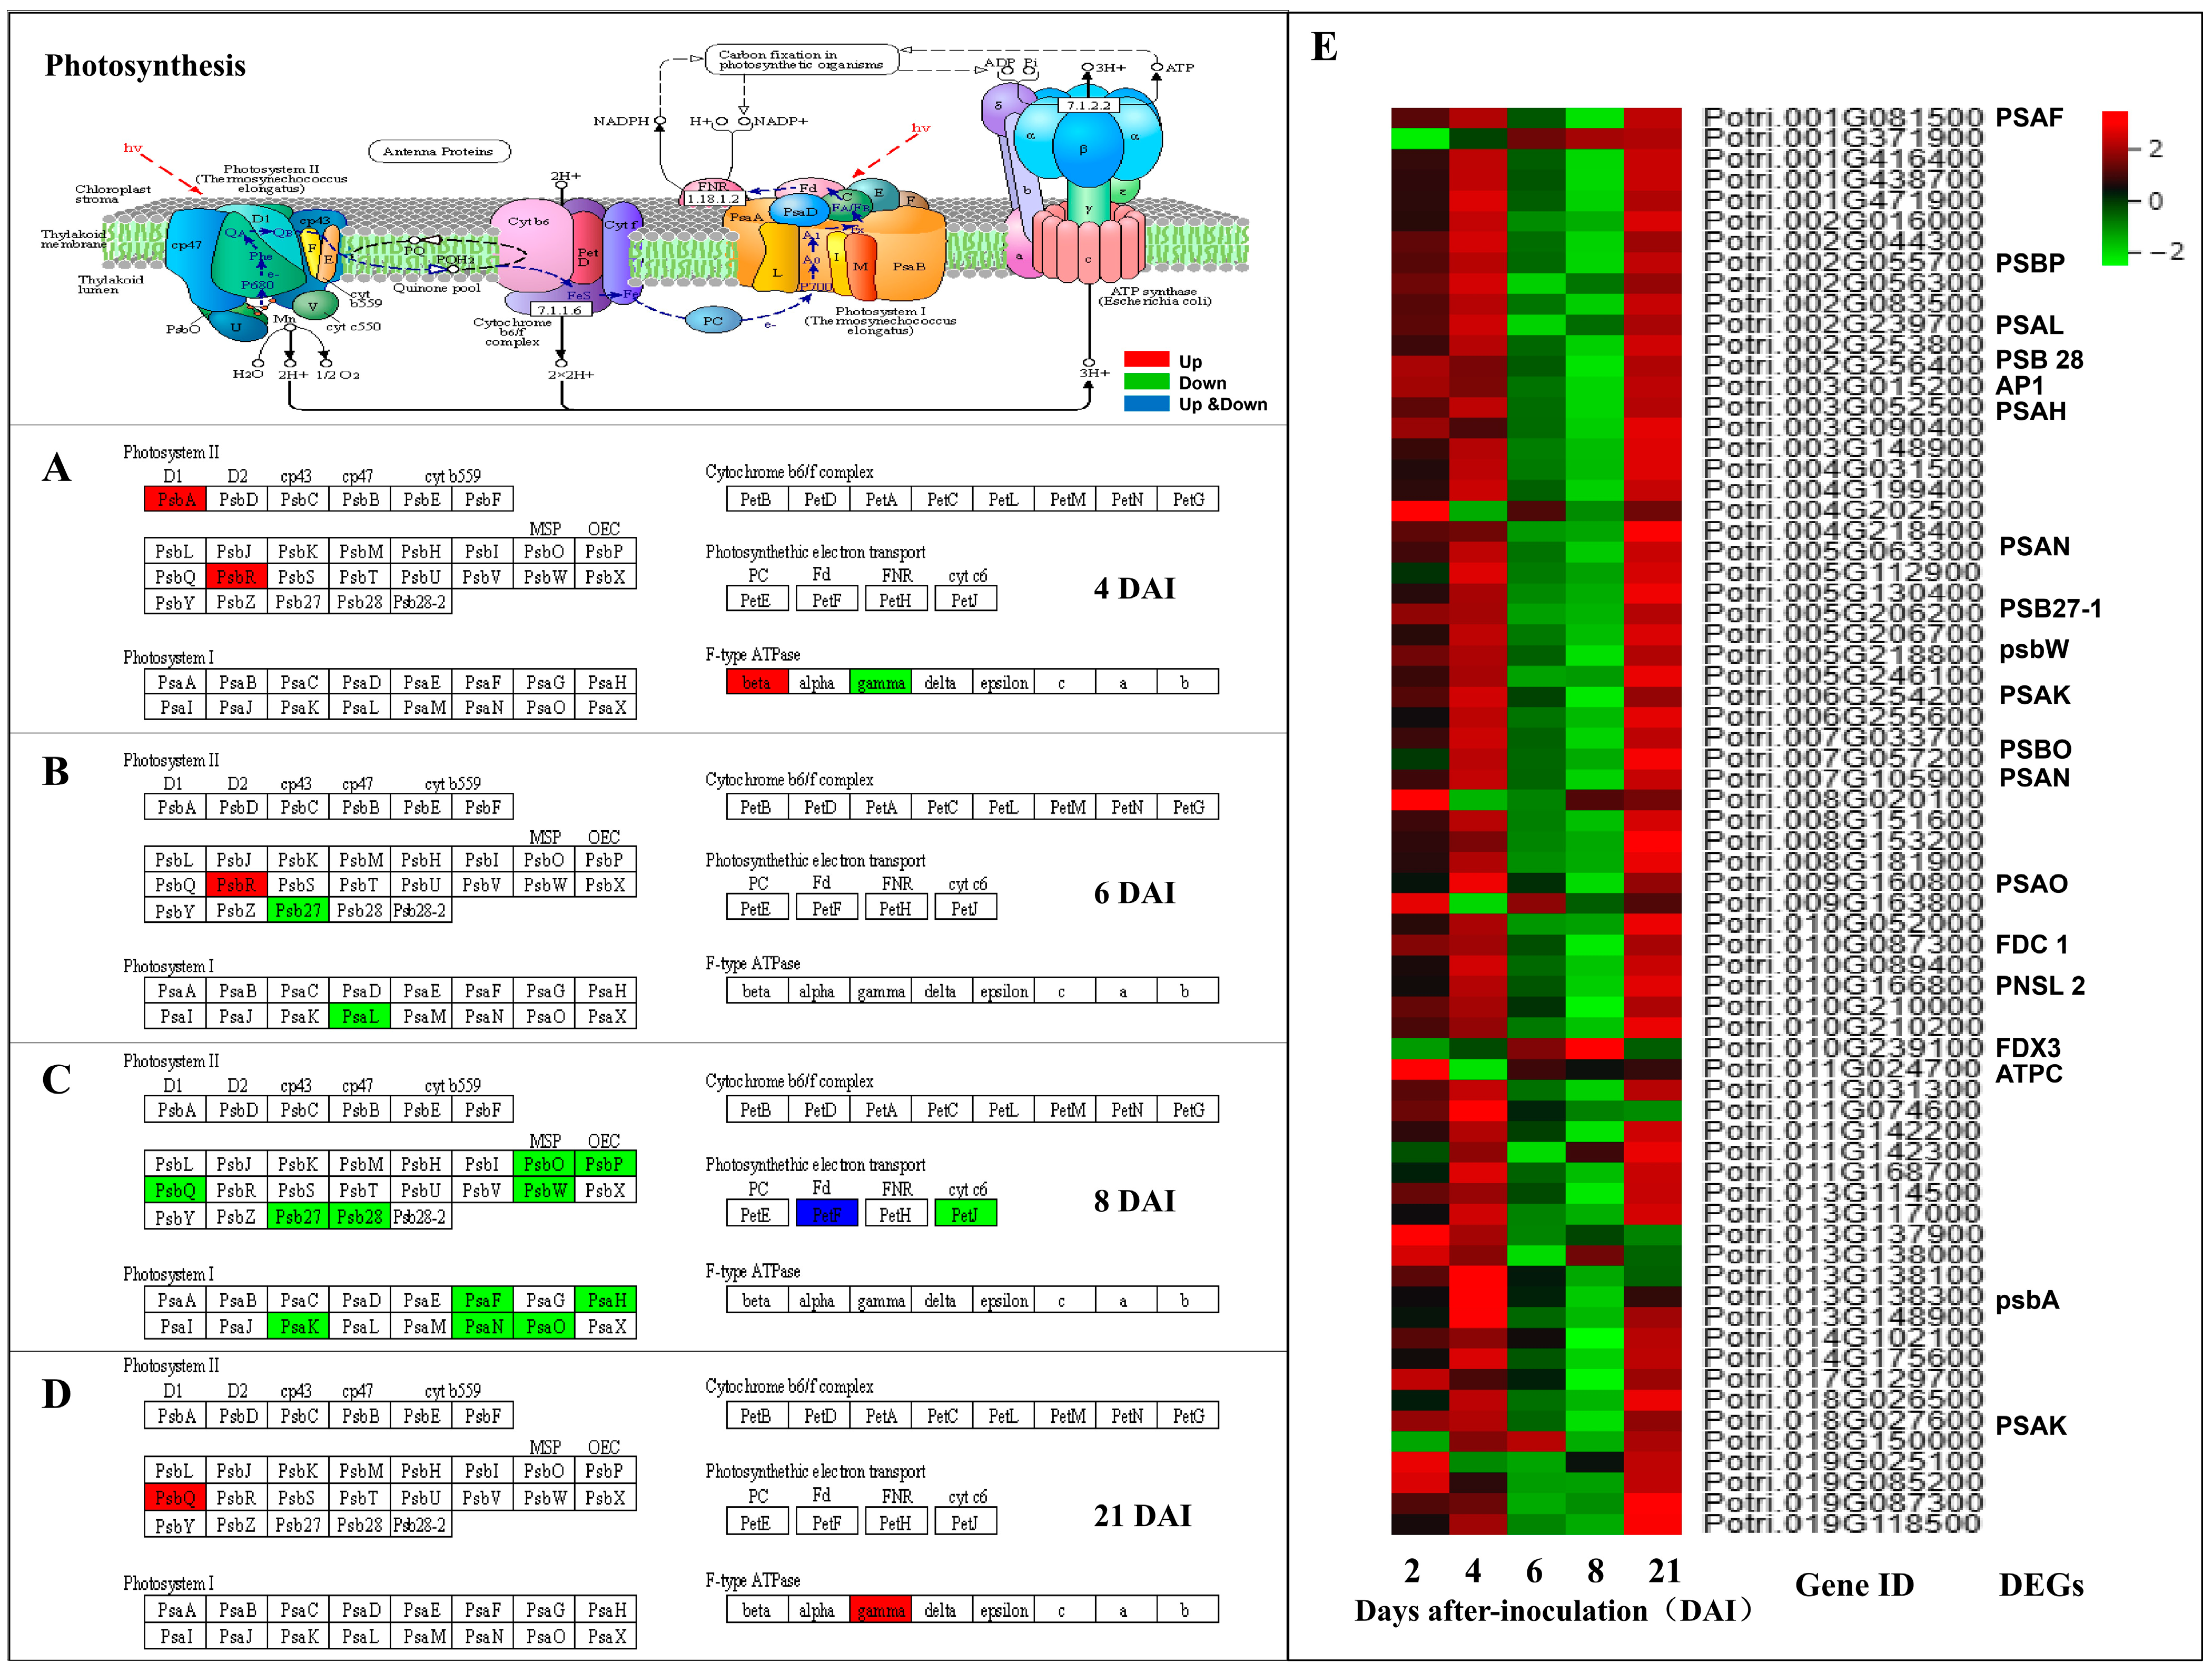
3.3.5. Aphid Inoculation Inhibits Expression of Genes Related to Photosynthesis at 8 DAI

To reveal the mechanism by which aphid infestation changes gas exchange in poplar leaves, the expression of DEGs involved in photosynthesis and the photosynthesis antenna protein pathway was investigated during this experimental period. As shown in Figure 5 and Table S2, a total of 0, 4 (3 up- and 1 downregulated), 3 (1 up- and 2 downregulated), and 2 upregulated DEGs were identified at 2, 4, 6, and 21 DAI, respectively; a total of 23 DEGs (1 up-, 22 downregulated) were identified at 8 DAI. For example, expression of five genes encoding antenna proteins (Potri.003G171500, Potri.006G139600, etc.) was inhibited with aphid inoculation, suggesting that light absorption and transduction are impeded with aphid inoculation. Moreover, 17 of 18 DEGs in the photosynthesis pathway were downregulated in poplar leaves, e.g., genes encoding PSII subunit proteins (Psb28, Psb27, PsbO, PsbP, and PsbQ genes), those encoding PSI subunit proteins (PsaF, PsaH, PsaK, PsaN, and PsaO), and those encoding 2Fe-2S protein-ferredoxin (Fd) of the photosynthetic electron transport chain. These results suggest that aphid inoculation decreases biosynthesis of proteins in PSI, PSII, and the electron transport chain at 8 DAI in poplar leaves, and this preceding inhibition of gene expression might explain the photosynthesis inhibition occurring at 17 DAI (Figure 3. However, only 2 upregulated DEGs were identified at 21 DAI, and no photosynthesis inhibition or compensation was detected at 21 and 36 DAI. These results demonstrate that aphid inoculation temporarily changes photosynthesis in poplar: first photosynthesis compensation, followed by photosynthesis inhibition, and finally photosynthesis recovery at the late stage of aphid inoculation.

3.3.6. Aphid Inoculation Exerts a Lasting Influence on Gene Expression in the Flavonoid Biosynthesis Pathway

Although a relatively small number of DEGs were identified at 2 and 21 DAI, KEGG enrichment analysis showed that aphid inoculation exerted some influence on the flavonoid biosynthesis pathway (Figure 6A,E). In particular, the expression of 2 DEGs encoding 3 flavonoid biosynthesis enzymes was inhibited at 2 DAI, whereas expression of 9 flavonoid biosynthesis-related DEGs was increased at 21 DAI, including the gene Potri.005G229500, which was identified at 2 DAI. Considering the important roles of flavonoids in pest resistance in plants, the dynamic change in genes involved in the flavonoid biosynthesis pathway was carefully investigated throughout the whole process of aphid inoculation, though this metabolic pathway was not enriched according to KEGG analysis at 4, 6, and 8 DAI.
Overall, expression of genes involved in the flavonoid biosynthesis pathway was dynamically regulated, from a downregulatory pattern (2 DAI) to an upregulatory pattern, in poplar leaves during our study (Figure 6A–E). In particular, genes encoding dihydroflavonol 4-reductase (DFR, enzyme 1.1.1.219 and 1.1.1.234; Potri.002G033600, Potri.005G229500) were downregulated at 2, 4, and 8 DAI and then upregulated at 21 DAI, and genes encoding leucoanthocyanidin reductase (LAR, enzyme 1.117.1.3, Potri.008G116500, Potri.015G050200) were downregulated at 6 DAI and upregulated at 21 DAI (Figure 6F). The dynamic change in flavonoid biosynthesis-related genes was similar to the observed changes in gas exchange (Figure 2A–D) and whole-genome gene expression from 2 to 21 DAI (Figure 5). These results suggest that aphid inoculation increases accumulation of flavonoids or anthocyanins in poplar leaves. Considering the roles of flavonoids in plant resistance, these results suggest that aphid inoculation induces chemical defense in poplar saplings. Moreover, with regard to the increasing expression of the flavonoid biosynthesis pathway that occurred at 21 DAI (the time at which photosynthesis inhibition had been repaired), the production of flavonoid metabolites would continue for a period of time, for example, one week or perhaps more. This result suggests that aphid inoculation induces long-term resistance to insects in poplar leaves; however, more in-depth investigations are needed.

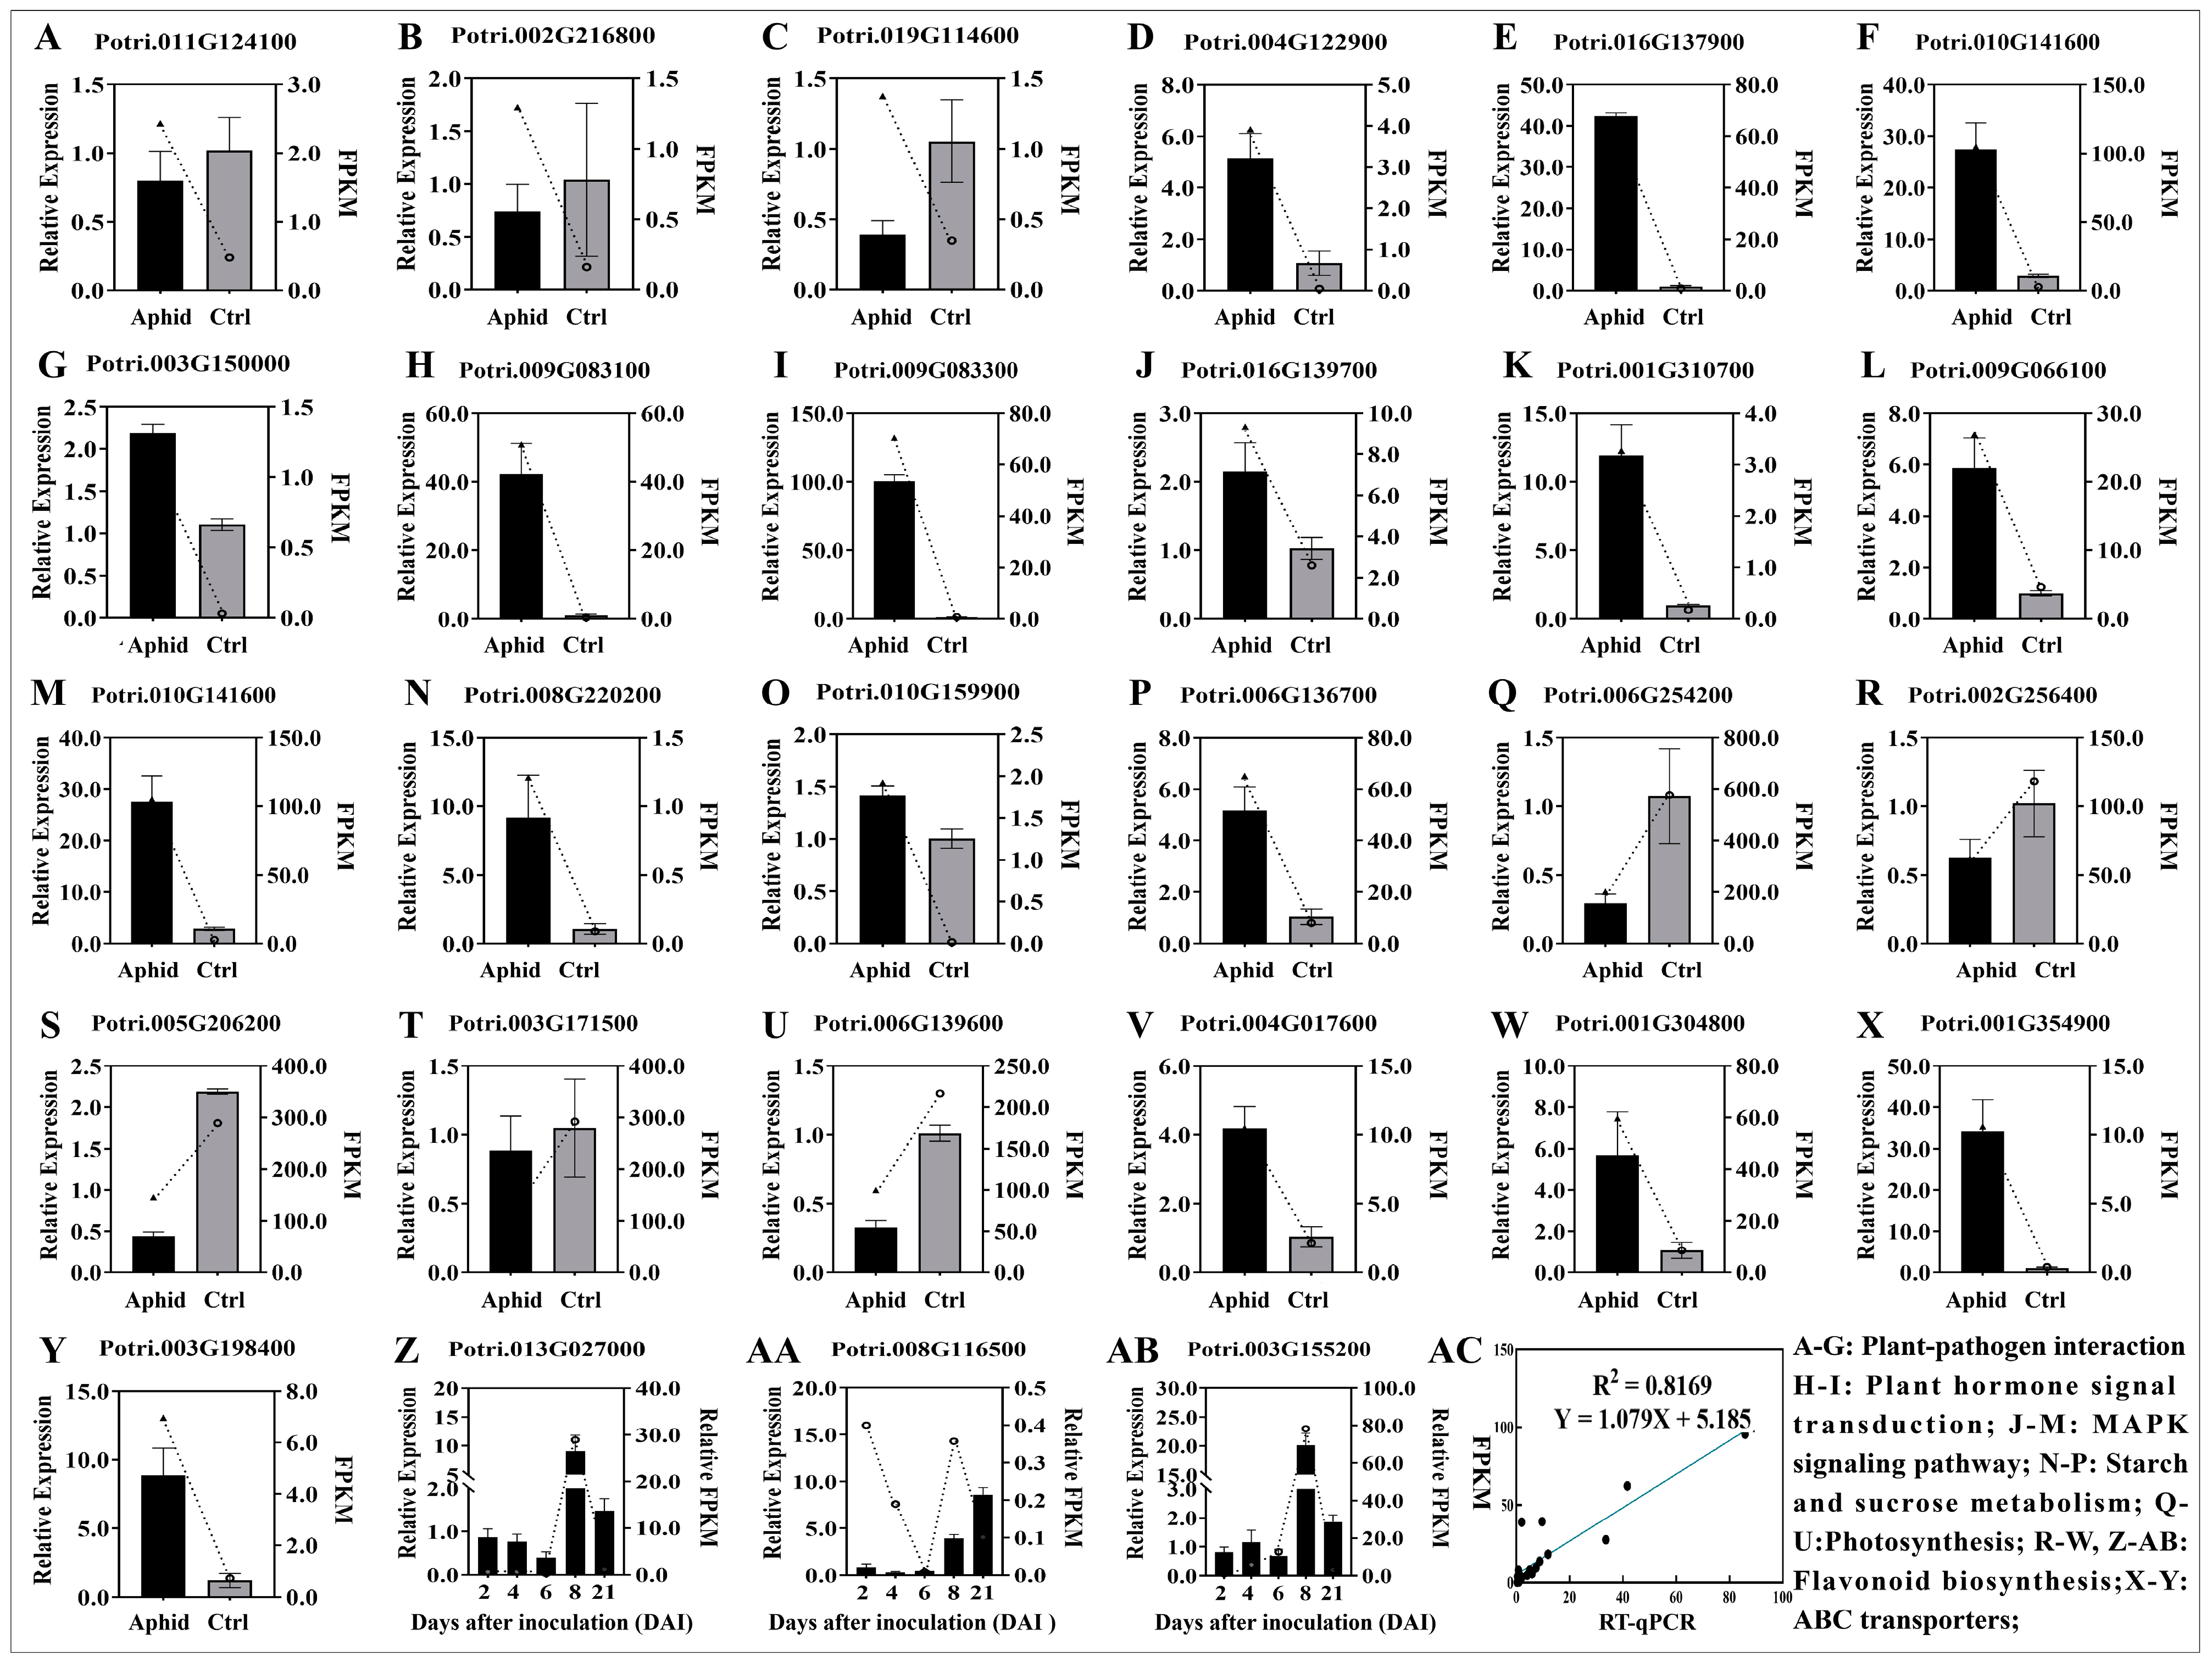
3.4. RT-qPCR Validation

In this study, the expression of a total of 26 DEGs at 8 DAI was validated with RT-qPCR. The validated DEGs included seven genes involved in plant–pathogen interactions; two genes involved in hormone signal transduction; five genes associated with the MAPK signaling pathway; three genes in starch and sucrose metabolism; two genes in ABC transporters; five genes associated with photosynthesis; and two genes involved in flavonoid biosynthesis. As shown in Figure 7, a total of 21 of 26 genes were validated in RT-qPCR experiments. Furthermore, the expression of 3 DEGs associated with flavonoid biosynthesis (Potri.008G116500, Potri.013G027000, and Potri.003G155200) was validated with RT-qPCR using RNA samples at 2, 4, 6, 8 and 21 DAI. In addition to the expression of Potri.011G124100, Potri.002G216800, Potri.003G150000, and Potri.019G114600 at 8 DAI and Potri.003G155200 in flavonoid biosynthesis at 2 DAI, other expression levels based on RT-qPCR were consistent with those in the transcript analysis (Figure 6).

4. Discussion

Insect herbivory is the most common type of biotic stress on trees, and increasing the frequency and severity of insect outbreaks can lead to a huge loss of photosynthesis products and even a large number of forest areas [54]. Insect herbivory can also induce changes in the primary metabolism of plants. Extensive studies have highlighted that insect infestations can significantly change the host’s photosynthesis in different pathways. Although there are some examples of compensatory photosynthetic mechanisms in response to insect herbivore feeding at the beginning of host–insect interactions [25,55,56], a reduction in photosynthetic efficiency occurs in most cases [14,16,19,29,42,57,58]. However, as mentioned above, these two reverse patterns of photosynthetic shifts induced with insect herbivory have always been observed in different studies. This study showed that photosynthetic compensation and inhibition sequentially occur in poplar leaves after aphid infestation. Moreover, this study also illustrates that photosynthetic repair occurs in poplar following inhibition of photosynthesis. This study also provided some details of photosynthetic shifts in poplar.
Obviously, the most significant feature of photosynthetic compensation is the increase in the net photosynthesis rate (Pn). However, in some water stress-related studies, the value of Pn increases in plants, though the stomatal conductance (Gs) and transpiration rate (Tr) are not affected [59,60,61]. High Gs. can increase the mobility of the intercellular CO2 concentration (Ci), which is conducive to an increase in the photosynthetic rate [62], and high Gs suggests compensatory photosynthesis in plants. In this study, photosynthetic compensation was deduced in poplar leaves after aphid infestation based on the high Gs, high Tr, and unchanged Pn at 8 DAI. Additionally, photosynthetic inhibition was identified at 17 DAI, owing to the significantly decreased values of Pn, Gs, and Tr (at least a 70% reduction when compared to the control poplars) (Figure 2A–D). The results show that the first photosynthetic shift occurred between 8 and 17 DAI.
Based on 22 microarray datasets from 8 different plant species, Bilgin et al. (2010) found that biotic stress (including arthropods, fungal, bacterial, and viral pathogens) globally downregulates the expression of genes involved in photosynthesis [29]. This study reveals the dynamic change in the expression of photosynthesis-related genes from 2 to 21 DAI after aphid infestation. Few DEGs from the photosynthesis pathway were identified at 2, 4, and 6 DAI (0, 4, and 3, respectively), but many more downregulated DEGs (a total of 23 and 22 down- and 1 upregulated) were identified at 8 DAI, and this result concurred with the results of photosynthetic inhibition at 17 DAI. Finally, both the gas exchange parameters and gene expression regulation detected suggest that a second photosynthesis shift (from photosynthetic inhibition to repair) occurred between 17 and 21 DAI. In summary, aphid infestation only temporarily changes photosynthesis in P. alba var. pyramidalis, and the inhibitory impact of aphid infestation on host photosynthesis is alleviated or even eliminated in three or more weeks. The response of poplar trees after aphid infestation can be divided into three stages according to changes in gas parameters: photosynthetic compensation, photosynthetic inhibition. and photosynthetic inhibition recovery. Research has shown that aphid infestation significantly reduces photosynthetic capacity, chlorophyll fluorescence, and carbon isotope rate, even with low aphid densities (fewer than 50 aphids/leaf) on soybeans [20]. Compared to the large number of aphids (always hundreds of aphids/leaf) observed in naturally occurring aphid infestations in poplar, both the number of aphid inoculation and the largest aphid number per sapling observed in this experiment were at a low density (Figure 1D). Therefore, the results of this study show the poplar’s physiological and defense response to low-density aphid infection. To our knowledge, this is the first study to illustrate that aphid infestation temporarily changes photosynthetic characteristics and photosynthetic inhibition repair in poplar.
The whole-genome gene expression pattern is an important feature of host plants, and combining enrichment analysis of DEGs in metabolic pathways and Gene Ontology analysis can reveal the responsiveness of plants to pathogens, insects, and other abiotic stresses. However, few studies have investigated plant–insect interactions. In our previous studies, infestation of the canker pathogens B. dothidea and V. sordida inhibited the expression of the majority of DEGs identified at the genome-wide level [44]; however, upregulated expression of the majority of DEGs was also observed in some poplar–pathogen interactions [1,44,63,64]. Leaf damage caused by biotic factors or mechanical damage often increases the expression of defense-related genes and reduces that of genes related to photosynthesis [27,28,29]. In this study, transcriptomic analysis illustrated that aphid infestation globally induced gene expression in poplar leaves from 4 to 21 DAI, particularly at 4, 6, and 8 DAI (Table 1). KEGG analysis revealed enrichment of the upregulated DEGs in three common metabolic pathways: the plant–pathogen interaction, hormone signal transduction pathway, and MAPK signal transduction pathway. In total, 58, 18, and 31 DEGs involved in these 3 pathways were upregulated in poplar at 4, 6, and 8 DAI, respectively (Figure 4). Plant hormones mediate signal transduction of different plant–pathogen interactions and regulate the host response to different trophic pathogens. JA and ethylene primarily mediate the response to infection using necrotrophic pathogens, and SA mainly regulates plant resistance to infection using biotrophic pathogens. Thus, corresponding upregulation of genes coding for the synthesis of JA and those involved in the responses to SA and ethylene has been suggested to be part of a defense response [29]. In this study, combined analysis showed that the most abundant genes associated with ethylene signal transduction (16, 13, and 11 DEGs); the second most abundant genes associated with SA (9, 7, and 9 DEGs); and the third most abundant genes associated with JA (10, 5, and 6) were upregulated at 4, 6, and 8 DAI, respectively. Therefore, this study shows that aphid infestation not only increases resistance to necrotrophic pathogens but also to biotic pathogens. Aphids are the most common vector of plant viral pathogens, accounting for the transmission of 50% of the insect-vectored viruses [65,66]. Then, did the viruses that were transmitted with C. populialbae induce pathogen resistance in poplar leaves in this study? To address this issue, the virus genome sequences were assembled using the poplar transcriptomic data from this study. However, the near-complete genome sequences of two plant viruses (apple stem grooving virus and citrus yellow vein clearing virus) were assembled from almost all transcriptomic datasets, not only the aphid infested, but also the control poplar leaves (unpublished data). Therefore, rather than the plant viruses transmitted with aphids, this result illustrates that aphid infestation triggered the pathogen resistance and changed the photosynthesis in poplar leaves. However, our transcriptomic data at 21 DAI suggest that pathogen resistance cannot be sustained in poplar for a long time period (Figure 3). Gas exchange traits (Figure 2) also suggested no differences between the aphid-infested and controlled poplar leaves. In summary, the induced pathogen resistance and photosynthetic inhibition fade. Nonetheless, further analysis of the flavonoid biosynthesis pathway showed that aphid infestation still exerts important roles on poplar leaves by providing chemical substances involved in insect defense.
Flavonoids are polyphenol secondary metabolites produced during plant responses to diverse environmental conditions. Flavonoids, including cholcones, flavones, flavonols, anthocyanins, isoflavonols, flavanonols, and flavanones polyphenols, not only contribute to the color, flavor, odor, astringency, oxidative stability, and bitterness of different plant parts but also play a critical role as a plant’s chemical defenses against pathogens and insects [40,41,67]. Flavonoids have been used as indicators of chemical defense. For example, insect herbivory (foliar feeding insect Lymantria dispar) increases flavonoid and lignin concentrations in deciduous oak, suggesting an increase in chemical defense in this tree [42]. In this study, although transcriptomic results illustrated that pathogen-related resistance decreased after 8 DAI, the observed increasing expression of flavonoid biosynthesis genes at 21 DAI suggested upcoming accumulation of flavonoid metabolites in poplar leaves, which would provide some further chemical defense for a long time period. Similar to photosynthetic compensation, photosynthetic inhibition contributes to the new physiological balance established with a host plant after adapting to environmental stress, which is helpful for improving plant yield and resistance.
Aphids secrete and inject saliva into the plant tissue with their piercing mouthparts (stylets). The saliva can prevent sieve tube plugging using molecular interactions between salivary proteins and calcium. This provides aphids with access to a continuous flow of phloem sap [68]. Aphid saliva, containing enzymes including phenoloxidases and peroxidase, potentially interfered with host defenses, biotic stress signaling, and plant metabolism [69,70,71]. For example, one of the effector proteins which is present in aphid saliva-activated pathways is associated with plant–pathogen interactions, MAPK, and salicylic acid (SA) in Nicotiana benthamiana/Acyrthosiphon pisum and Medicago truncatula/Myzus persicae [72]. WKRY28, PR-2, and disease resistance protein were upregulated in Arabidopsis using both Myzus persicae (green peach aphid) feeding and saliva infiltration [73]. It was thought that aphid infestation temporarily changes photosynthesis and expression of disease-resistance genes in poplar leaves through aphid salivary manipulation.

5. Conclusions

Based on photosynthetic profiling and transcriptomic analysis, this study illustrates that low-density aphid infestation temporarily changes photosynthesis (increasing and then decreasing), induces transient disease resistance, and provides a long-term chemical defense to insects in poplar leaves. These findings provide valuable insight into aphid herbivory-induced regulatory and metabolic processes in poplar, which might help improve knowledge of the coevolution of aphids and poplar.

Supplementary Materials

The following supporting information can be downloaded at: https://www.mdpi.com/article/10.3390/f14091866/s1, Supplementary Figure S1. The gas exchange characteristics of poplar infested with aphids: the net photosynthetic rate (A), stomatal conductance (B), transpiration rate (C), and intercellular CO2 concentration (D). Bars show means ± s.e.s (n = 9); different letters indicated at the same time points indicate significant comparisons, p < 0.05, ANOVA; Table S1. The primer sequences used in this study; Table S2. The expression of all identified differential expressed genes in this study.

Author Contributions

Software, W.S., Y.F. and L.W.; validation, W.S. and M.L.; formal analysis, W.S., Y.F. and Y.Z.; investigation, W.S. and Y.F.; resources, Y.Y., H.L. and X.S.; data curation, Y.F., M.L. and H.L.; writing—original draft, W.S.; writing—review and editing, J.Z.; visualization, L.W. and Y.Z.; supervision, X.S. and J.Z.; project administration, J.Z.; funding acquisition, J.Z. All authors have read and agreed to the published version of the manuscript.

Funding

This research was funded by Jiaping Zhao from the Central Public-interest Scientific Institution Basal Research Fund of State Key Laboratory of Tree Genetics and Breeding, Grant No. CAFYBB2020ZY001-2 and the National Natural Science Foundation of China, Grant No. 32171776.

Data Availability Statement

Transcriptomic resources described in this paper are available in NCBI as raw RNA-Seq under the BioProject Accession PRJNA776116.

Conflicts of Interest

The authors declare no conflict of interest.

References

  1. Foster, A.J.; Pelletier, G.; Tanguay, P.; Seguin, A. Transcriptome analysis of Poplar during leaf spot infection with Sphaerulina spp. PLoS ONE 2015, 10, e0138162. [Google Scholar] [CrossRef] [PubMed]
  2. Smith, C.M.; Rodriguez-Buey, M.; Karlsson, J.; Campbell, M.M. The response of the poplar transcriptome to wounding and subsequent infection by a viral pathogen. New Phytol. 2004, 164, 123–136. [Google Scholar] [CrossRef] [PubMed]
  3. Duplessis, S.; Major, I.; Martin, F.; Séguin, A. Poplar and pathogen interactions: Insights from Populus genome-wide analyses of resistance and defense gene families and gene expression profiling. Crit. Rev. Plant Sci. 2009, 28, 309–334. [Google Scholar] [CrossRef]
  4. Veselá, B.; Holub, P.; Urban, O.; Surá, K.; Hodaňová, P.; Oravec, M.; Divinová, R.; Jansen, M.; Klem, K. UV radiation and drought interact differently in grass and forb species of a mountain grassland. Plant Sci. 2022, 325, 111488. [Google Scholar] [CrossRef]
  5. Zlatkovic, M.; Tenorio-Baigorria, I.; Lakatos, T.; Tóth, T.; Koltay, A.; Pap, P.; Marković, M.; Orlović, S. Bacterial canker disease on Populus× euramericana caused by Lonsdalea populi in Serbia. Forests 2020, 11, 1080. [Google Scholar] [CrossRef]
  6. Philippe, R.N.; Bohlmann, J. Poplar defense against insect herbivores. Botany 2007, 85, 1111–1126. [Google Scholar]
  7. Fischer, M.K.; Shingleton, A.W. Host plant and ants influence the honeydew sugar composition of aphids. Funct. Ecol. 2001, 15, 544–550. [Google Scholar] [CrossRef]
  8. Ni, T. Experiment on aphid control of Populus tomentosa. North. Hortic. 2007, 10, 203–204. (In Chinese) [Google Scholar]
  9. Felton, G.W.; Eichenseer, H. Herbivore saliva and its effects on plant defense against herbivores and pathogens. In Induced Plant Defenses against Pathogens and Herbivores. Biochemistry, Ecology, and Agriculture; Agrawal, A.A., Tuzun, S., Bent, E., Eds.; APS Press: St. Paul, MN, USA, 1999; pp. 19–36. [Google Scholar]
  10. Miles, P.W. Specific responses and damage caused by Aphidoidea: Principles. In Aphids: Their Biology, Natural Enemies and Control; Minks, A.K., Harrewijn, P., Eds.; Elsevier: New York, NY, USA, 1989; pp. 23–47. [Google Scholar]
  11. Cobb, N.S.; Trotter, R.T.; Whitham, T.G. Long-term sexual allocation in herbivore resistant and susceptible pinyon pine (Pinus edulis). Oecologia 2002, 130, 78–87. [Google Scholar] [CrossRef]
  12. Guerrieri, E.; Digilio, M.C. Aphid-plant interactions: A review. J. Plant Interact. 2008, 3, 223–232. [Google Scholar] [CrossRef]
  13. Yin, W.D.; Qiu, G.S.; Yan, W.T.; Sun, L.N.; Zhang, H.J. Host preference and fitness of Aphis citricola (Hemiptera: Aphididae) to mature and young apple leaves. J. Appl. Ecol. 2013, 24, 2000–2006. [Google Scholar]
  14. Zangerl, A.R.; Hamilton, J.G.; Miller, T.J.; Crofts, A.R.; Oxborough, K.; Berenbaum, M.R.; De Lucia, E.H. Impact of folivory on photosynthesis is greater than the sum of its holes. Proc. Natl. Acad. Sci. USA 2002, 99, 1088–1091. [Google Scholar] [CrossRef] [PubMed]
  15. Nykänen, H.; Koricheva, J. Damage-induced changes in woody plants and their effects on insect herbivore performance: A meta-analysis. Oikos 2004, 104, 247–268. [Google Scholar] [CrossRef]
  16. Nabity, P.D.; Zavala, J.A.; DeLucia, E.H. Indirect suppression of photosynthesis on individual leaves by arthropod herbivory. Ann. Bot. 2009, 103, 655–663. [Google Scholar] [CrossRef]
  17. Haile, F.J.; Higley, L.G. Changes in soybean gas-exchange after moisture stress and spider mite injury. Environ. Entomol. 2003, 32, 433–440. [Google Scholar] [CrossRef]
  18. Velikova, V.; Salerno, G.; Frati, F.; Peri, E.; Conti, E.; Colazza, S.; Loreto, F. Influence of feeding and oviposition by phytophagous on photosynthesis of herbaceous plants. J. Chem. Ecol. 2010, 36, 629–641. [Google Scholar] [CrossRef]
  19. Welter, S.C. Arthropod impact on plant gas exchange. In Insect-Plant Interactions; Bernays, E.A., Ed.; CRC Press: Boca Raton, FL, USA, 2019; pp. 135–164. [Google Scholar]
  20. Macedo, T.B.; Bastos, C.S.; Higley, L.G.; Ostlie, K.R.; Madhavan, S. Photosynthetic responses of soybean to soybean aphid (Homoptera: Aphididae) injury. J. Econ. Entomol. 2003, 96, 188–193. [Google Scholar] [CrossRef]
  21. Reddall, A.; Sadras, V.O.; Wilson, L.J.; Gregg, P.C. Physiological responses of cotton to two-spotted spider mite damage. Crop Sci. 2004, 44, 835–846. [Google Scholar]
  22. Wei, C.; Tong, X.; Gao, X.; Jiang, C. Compensatory photosynthesis physiology of tea plant for herbivory by Ectropis oblique. J. Anhui Agric. Univ. 2007, 34, 355–359. [Google Scholar]
  23. Alieta, E.; David, S.; Pinkard, E.A.; Ian, S.; Ross, C.; Stephen, E.; Chris, B.; Caroline, M. Photosynthetic responses of field-grown Pinus radiata trees to artificial and aphid-induced defoliation. Tree Physiol. 2011, 6, 592–603. [Google Scholar]
  24. Nowak, R.S.; Caldwell, M.M. A test of compensatory photosynthesis in the field: Implications for herbivory tolerance. Oecologia 1984, 61, 311–318. [Google Scholar] [CrossRef] [PubMed]
  25. Trumble, J.T.; Kolondy-Hirsch, D.M.; Ting, I.P. Plant compensation for arthropod herbivory. Annu. Rev. Entomol. 1993, 38, 93–119. [Google Scholar] [CrossRef]
  26. Doescher, P.S.; Svejcar, T.J.; Jaindl, R.G. Gas exchange of Idaho Fescue in response to defoliation and grazing history. J. Range Manag. 1997, 50, 285–289. [Google Scholar] [CrossRef]
  27. Zou, J.; Rodriguez-Zas, S.; Aldea, M.; Zhu, J.; Gonzalez, D.; Vodkin, L.; DeLucia, E.; Clough, S.J. Expression profiling soybean response to Pseudomonas syringae reveals new defense-related genes and rapid HR-specific downregulation of photosynthesis. Mol. Plant-Microbe Interact. 2005, 18, 1161–1174. [Google Scholar] [CrossRef]
  28. Berger, S.; Benediktyova, Z.; Matous, K.; Bonfig, K.; Mueller, M.; Nedbal, L.; Roitsch, T. Visualization of dynamics of plant-pathogen interaction by novel combination of chlorophyll fluorescence imaging and statistical analysis: Differential effects of virulent and avirulent strains of P. syringae and of oxylipins on A. thaliana. J. Exp. Bot. 2007, 58, 797–806. [Google Scholar] [CrossRef]
  29. Bilgin, D.D.; Zavala, J.A.; Zhu, J.; Clough, S.J.; Ort, D.R.; Delucia, E.H. Biotic stress globally downregulates photosynthesis genes. Plant Cell Environ. 2010, 33, 1597–1613. [Google Scholar] [CrossRef] [PubMed]
  30. Giri, A.P.; Wunsche, H.; Mitra, S.; Zavala, J.A.; Muck, A.; Svatoš, A.; Baldwin, I.T. Molecular interactions between the specialist herbivore Manduca sexta (Lepidoptera, sphingidae) and its natural host Nicotiana attenuata. VII. Changes in the plant’s proteome. Plant Physiol. 2006, 142, 1621–1641. [Google Scholar] [CrossRef]
  31. Mitra, S.; Baldwin, I.T. Independently silencing two photosynthetic proteins in Nicotiana attenuata has different effects on herbivore resistance. Plant Physiol. 2008, 148, 1128–1138. [Google Scholar] [CrossRef]
  32. Logemann, E.; Wu, S.C.; Schröder, J.; Schmelzer, E.; Somssich, I.E.; Hahlbrock, K. Gene activation by UV light, fungal elicitor or fungal infection in Petroselinum crispum is correlated with repression of cell cycle-related genes. Plant J. 1995, 8, 865–876. [Google Scholar] [CrossRef]
  33. Ehness, R.; Ecker, M.; Godt, D.E.; Roitsch, T. Glucose and stress independently regulate source and sink metabolism and defense mechanisms via signal transduction pathways involving protein phosphorylation. Plant Cell 1997, 9, 1825–1841. [Google Scholar] [CrossRef]
  34. Hermsmeier, D.; Schittko, U.; Baldwin, I.T. Molecular interactions between the specialist herbivore Manduca sexta (Lepidoptera, Sphingidae) and its natural host Nicotiana attenuata. I. Large-scale changes in the accumulation of growth- and defense-related plant mRNAs. Plant Physiol. 2001, 125, 683–700. [Google Scholar] [CrossRef] [PubMed]
  35. Montesano, M.; Scheller, H.V.; Wettstein, R.; Palva, E.T. Down-regulation of photosystem I by Erwinia carotovora-derived elicitors correlates with H2O2 accumulation in chloroplasts of potato. Mol. Plant Pathol. 2004, 5, 115–123. [Google Scholar] [CrossRef] [PubMed]
  36. Major, I.T.; Constabel, C.P. Molecular analysis of poplar defense against herbivory: Comparison of wound-and insect elicitor-induced gene expression. New Phytol. 2006, 172, 617–635. [Google Scholar] [CrossRef] [PubMed]
  37. Wool, D.; Hales, D.F. Previous infestation affects recolonization of cotton by Aphis gossypii: Induced resistance or plant damage? Phytoparasitica 1996, 24, 39–48. [Google Scholar] [CrossRef]
  38. Strauss, S.Y.; Agrawal, A.A. The ecology and evolution of plant tolerance to herbivory. Trends Ecol. Evol. 1999, 14, 179–185. [Google Scholar] [CrossRef]
  39. Züst, T.; Agrawal, A.A. Mechanisms and evolution of plant resistance to aphids. Nat. Plants 2016, 2, 15206. [Google Scholar] [CrossRef]
  40. Pandey, K.B.; Rizvi, S.I. Plant polyphenols as dietary antioxidants in human health and disease. Oxidative Med. Cell. Longev. 2009, 2, 270–278. [Google Scholar] [CrossRef]
  41. Li, A.N.; Li, S.; Zhang, Y.J.; Xu, X.R.; Chen, Y.M.; Li, H.B. Resources and biological activities of natural polyphenols. Nutrients 2014, 6, 6020–6047. [Google Scholar] [CrossRef]
  42. Fyllas, N.M.; Chrysafi, D.; Avtzis, D.N.; Moreira, X. Photosynthetic and defensive responses of two Mediterranean oaks to insect leaf herbivory. Tree Physiol. 2022, 42, 2282–2293. [Google Scholar] [CrossRef]
  43. Liu, X.; Zeng, Y.; Yang, L.; Li, M.; Fu, M.; Zhang, S. Plagiodera versicolora feeding induces systemic and sexually differential defense responses in poplars. Physiol. Plant. 2022, 174, e13804. [Google Scholar] [CrossRef]
  44. Li, P.; Liu, W.; Zhang, Y.; Xing, J.; Li, J.; Feng, J.; Su, X.; Zhao, J. Fungal canker pathogens trigger carbon starvation by inhibiting carbon metabolism in poplar stems. Sci. Rep. 2019, 9, 10111. [Google Scholar] [CrossRef] [PubMed]
  45. Xing, J.; Li, P.; Zhang, Y.; Li, J.; Liu, Y.; Lachenbruch, B.; Su, X.; Zhao, J. Fungal pathogens of canker disease trigger canopy dieback in poplar saplings by inducing functional failure of the phloem and cambium and carbon starvation in the xylem. Physiol. Mol. Plant Pathol. 2020, 112, 101523. [Google Scholar] [CrossRef]
  46. Xing, J.; Li, M.; Li, J.; Shen, W.; Li, P.; Zhao, J.; Zhang, Y. Stem canker pathogen Botryosphaeria dothidea inhibits poplar leaf photosynthesis in the early stage of inoculation. Front. Plant Sci. 2022, 2022, 13. [Google Scholar] [CrossRef] [PubMed]
  47. Pertea, M.; Pertea, G.M.; Antonescu, C.M.; Chang, T.C.; Mendell, J.T.; Salzberg, S.L. StringTie enables improved reconstruction of a transcriptome from RNA-seq reads. Nat. Biotechnol. 2015, 33, 290–295. [Google Scholar] [CrossRef]
  48. Kim, D.; Langmead, B.; Salzberg, S.L. HISAT: A fast spliced aligner with low memory requirements. Nat. Methods 2015, 12, 357–360. [Google Scholar] [CrossRef]
  49. Love, M.I.; Huber, W.; Anders, S. Moderated estimation of fold change and dispersion for RNA-seq data with DESeq2. Genome Biol. 2014, 15, 550. [Google Scholar] [CrossRef]
  50. Zhao, J.P.; Jiang, X.L.; Zhang, B.Y.; Su, X.H. Involvement of microRNA-mediated gene expression regulation in the pathological development of stem canker disease in Populus trichocarpa. PLoS ONE 2012, 7, e44968. [Google Scholar] [CrossRef]
  51. Guo, Z.; Yuan, X.; Li, L.; Zeng, M.; Yang, J.; Tang, H.; Duan, C. Genome-wide analysis of the ATP-binding cassette (ABC) transporter family in Zea mays L. and its response to heavy metal stresses. Int. J. Mol. Sci. 2022, 23, 2109. [Google Scholar] [CrossRef]
  52. Kang, J.; Park, J.; Choi, H. Plant ABC Transporters. Arab. Book 2011, 9, e0153. [Google Scholar] [CrossRef]
  53. Yuan, Q.; Zhang, J.; Zhang, W.; Nie, J. Genome-wide characterization, phylogenetic and expression analysis of ABCG gene subfamily in cucumber (Cucumis sativus L.). Front. Plant Sci. 2023, 14, 1178710. [Google Scholar] [CrossRef]
  54. Roy, B.A.; Alexander, H.M.; Davidson, J.; Campbell, F.T.; Burdon, J.J.; Sniezko, R.; Brasier, C. Increasing forest loss worldwide frominvasive pests requires new trade regulations. Front. Ecol. Environ. 2014, 12, 457–465. [Google Scholar] [CrossRef]
  55. Retuerto, R.; Fernanez-Lema, B.; Rodrjguez-Roiloa; Obeso, J.R. Increased photosynthetic performance in holly trees infested by scale insects. Funct. Ecol. 2004, 18, 664–669. [Google Scholar] [CrossRef]
  56. Moustaka, J.; Meyling, N.V.; Hauser, T.P. Induction of a compensatory photosynthetic response mechanism in tomato leaves upon short time feeding by the chewing insect Spodoptera exigua. Insects 2021, 12, 562. [Google Scholar] [CrossRef]
  57. Aldea, M.; Hamilton, J.; Resti, J.; Zangerl, A.; Berenbaum, M.; Frank, T.; DeLucia, E. Comparison of photosynthetic damage from arthropod herbivory and pathoge-n infection in understory hardwood saplings. Oecologia 2006, 149, 221–232. [Google Scholar] [CrossRef]
  58. Kerchev, P.I.; Fenton, B.; Foyer, C.H.; Hancock, R.D. Plant responses to insect herbivory: Interactions between photosynthesis, reactive oxygen species and hormonal signaling pathways. Plant Cell Environ. 2012, 35, 441–453. [Google Scholar] [CrossRef]
  59. Paez, A.; Gonzalez, M.E.O. Water stress and clipping management effects on guineagrass: II. photosynthesis and water relations. Agron. J. 1995, 87, 706–711. [Google Scholar] [CrossRef]
  60. Damascos, M.A.; Ronquim, C.C.; Prado, C.H.B.A. Gas exchange and plant growth after defoliation on Leandra lacunosa, a cerrado woody species with continuous leaf production. Braz. Arch. Biol. Technol. 2005, 48, 967–974. [Google Scholar] [CrossRef]
  61. Fernando, S.; Marina, F.; Sonia, M.; Alfonso, E. Effects of simulated herbivory on photosynthesis and N resorption efficiency in Quercus pyrenaica Willd. saplings. Trees 2008, 22, 785–793. [Google Scholar] [CrossRef]
  62. Kolb, T.E.; Dodds, K.A.; Clancy, K.M. Effect of western spruce budworm defoliation on the physiology and growth of potted Douglas-fir seedlings. For. Sci. 1999, 45, 280–291. [Google Scholar]
  63. Zhang, Y.; Tian, L.; Yan, D.H.; He, W. Genome-wide transcriptome analysis reveals the comprehensive response of two susceptible poplar sections to Marssonina brunnea infection. Genes 2018, 9, 154. [Google Scholar] [CrossRef]
  64. Muchero, W.; Sondreli, K.L.; Chen, J.G.; Urbanowicz, B.; Zhang, J.; Singan, V.; Yang, Y.; Brueggeman, R.; Franco-Coronado, J.; Abraham, N.; et al. Association mapping, transcriptomics and transient expression identify candidate genes mediating plant-pathogen interactions in a tree. Proc. Natl. Acad. Sci. USA 2018, 115, 11573–11578. [Google Scholar] [CrossRef]
  65. Brunt, A.A.; Crabtree, K.; Dallwitz, M.J.; Gibbs, A.J.; Watson, L.; Zurcher, E.J. (Eds.) Plant Viruses Online: Descriptions and Lists from the VIDE Database. Version: 20. 1996. Available online: http://www.agls.uidaho.edu/ebi/vdie/ (accessed on 1 September 2023).
  66. Nault, L.R. Arthropod transmission of plant viruses: A new synthesis. Ann. Entomol. Soc. Am. 1997, 90, 521–541. [Google Scholar] [CrossRef]
  67. Calla, B. Diverse defenses: O-methylated flavonoids contribute to the maize arsenal against fungal pathogens. Plant Physiol. 2022, 188, 24–25. [Google Scholar] [CrossRef]
  68. Will, T.; Tjallingii, W.F.; Thönnessen, A.; van Bel, A.J. Molecular sabotage of plant defense by aphid saliva. Proc. Natl. Acad. Sci. USA 2007, 104, 10536–10541. [Google Scholar] [CrossRef]
  69. Miles, P.W. Aphid saliva. Biol. Rev. 1999, 74, 41–85. [Google Scholar] [CrossRef]
  70. Cherqui, A.; Tjallingii, W.F. Salivary proteins of aphids, a pilot study on identification, separation, and immunolocalisation. J. Insect Physiol. 2000, 46, 1177–1186. [Google Scholar] [CrossRef]
  71. Mondal, H.A. Aphid saliva: A powerful recipe for modulating host resistance towards aphid clonal propagation. Arthropod-Plant Interact. 2020, 14, 547–558. [Google Scholar] [CrossRef]
  72. Cui, N.; Lu, H.; Wang, T.; Zhang, W.; Kang, L.; Cui, F. Armet, an aphid effector protein, induces pathogen resistance in plants by promoting the accumulation of salicylic acid. Philos. Trans. R. Soc. B Biol. Sci. 2019, 374, 20180314. [Google Scholar] [CrossRef] [PubMed]
  73. Vos, M.D.; Oosten, V.R.V.; Poecke, R.M.P.V.; Pelt, J.A.Z.; Pozo, M.J.; Mueller, M.J.; Buchala, A.J.; Métraux, J.P.; Loon, L.C.V.; Dicke, M.; et al. Signal signature and transcriptome changes of Arabidopsis during pathogen and insect attack. Mol. Plant Microbe Interact. 2005, 18, 923–937. [Google Scholar] [CrossRef]
Figure 1. The morphology of aphids, the dynamic change in aphid number, and gas-exchange characteristics during this experiment. The morphology of aphids that naturally occurred on poplar leaves (A) and stems (B) and the aphids observed under a microscope (C). The dynamic change in aphid number located on poplar leaves during this experiment and (D) number of aphids/saplings.
Forests 14 01866 g001
Figure 2. The gas exchange characteristics of poplar infested by aphids: the net photosynthetic rate (A), stomatal conductance (B), transpiration rate (C), and intercellular CO2 concentration (D). Bars show means ± s.e.s (n = 9); different letters indicated at the same time points indicate significant comparisons, p < 0.05, ANOVA.
Forests 14 01866 g002
Figure 3. KEGG enrichment analysis of differentially expressed genes (DEGs) in aphid-infested poplar leaves. Panels (AE) represent results at 2, 4, 6, 8, and 21 days after inoculation, respectively. The red dotted line is the q-value’s cut-off according to q-value < 0.05.
Forests 14 01866 g003
Figure 4. The identified differentially expressed genes (DEGs) involved in plant–pathogen interactions, plant hormone signal transduction, and the MAPK signaling pathway in poplar leaves infected by aphids. Venn diagram of DEGs identified at 4, 6, and 8 DAI: plant–pathogen interaction (A), plant hormone transduction pathway (B), and MAPK signaling pathway (C). Interactions of DEGs involved in plant–pathogen interaction, MAPK signaling pathway, and plant hormone transduction pathway: 4 DAI (D), 6 DAI (E), and 8 DAI (F). In the Venn diagram, digits represent the total number of upregulated DEGs. Digits in parentheses represent the number of downregulated DEGs in aphid-infected poplar leaves. Parts (DF) were drawn using Cyctoscape_v3.9.1 software.
Forests 14 01866 g004
Figure 5. KEGG enrichment and heatmap of genes involved in the photosynthesis pathway. KEGG enrichment analysis of the photosynthesis pathway revealed that more differentially expressed genes (DEGs) were downregulated in poplar leaves at 8 days after aphid inoculation. Enrichment analysis results are shown at 4 DAI (A), 6 DAI (B), 8 DAI (C), and 21 DAI (D). The diagram at 2 DAI is not presented because no DEGs were identified at this time point. With regard to the control group, the nodes colored in red represent the enzymes related to upregulated genes and the green ones represent the enzymes of downregulated genes. Blue ones represent enzymes related to both up and downregulated genes. Heatmap of expression of genes involved in the photosynthesis pathway (E). The heatmap was drawn based on the value of gene regulation (the logarithmic value of the fold change of expression of each gene (FPKM)) and the gene ID of every gene involved in this pathway was presented, while only the enzyme/protein name of DEGs was presented on the heatmap chart. AP1, Ferredoxin; ATPC, ATP synthase gamma chain; FDC1, Ferredoxin C 1; FDX3, Ferredoxin-3; LHCA5, light-harvesting complex I chlorophyll a/b binding protein 5; lhcA-P4, Chlorophyll a-b binding protein P4; PNSL2, photosystem II oxygen-evolving enhancer protein 3; PSAF, photosystem I subunit III; PSAH, photosystem I subunit VI; PSAK, photosystem I subunit X; PSAL, photosystem I subunit XI; PSAN, photosystem I subunit PsaN; PSAO, photosystem I subunit PsaO; PSB27-1, photosystem II 13 kDa protein; PSB28, photosystem II 13 kDa protein; psbA, photosystem II P680 reaction center D1 protein; PSBO, photosystem II oxygen-evolving enhancer protein 1; PSBP, photosystem II oxygen-evolving enhancer protein 2; psbW, photosystem II PsbW protein.
Forests 14 01866 g005
Figure 6. KEGG enrichment and heatmap of genes involved in the flavonoid biosynthesis pathway. KEGG analysis illustrated that more DEGs involved in the flavonoid biosynthesis pathway were downregulated at the early stages of aphid infestation but that more DEGs were upregulated at the late stages. Enrichment analysis results at 2 DAI (A), 4 DAI (B), 4 DAI (C), 8 DAI (D), and 21 DAI (E). Dynamic expression of nine flavonoid biosynthesis-related DEGs during this experiment. Gene expression is shown as the logarithm value of the fold-change of FPKM of every gene (log2FC) (F). In relation to the control group, the nodes colored in red represent the enzymes related to upregulated genes and the green ones represent the enzymes of downregulated genes. Blue ones represent enzymes related to both up and downregulated genes. Heatmap of expression of genes involved in the flavonoid biosynthesis pathway (G). The heatmap was drawn based on the value of gene regulation (the logarithmic value of the fold change of expression of each gene (FPKM)) and the gene ID of every gene involved in this pathway was presented, while only the enzyme/protein name of DEGs was presented on the heatmap chart. CHS1, Chalcone synthase 1; VSR6, Vacuolar-sorting receptor 6; ANS, Leucoanthocyanidin dioxygenase; CCOAOMT2, Caffeoyl-CoA O-methyltransferase 2; BEAT, Acetyl-CoA-benzylalcohol acetyltransferase; ANR, Anthocyanidin reductase; HST, shikimate O-hydroxycinnamoyltransferase; DFR, Dihydroflavonol 4-reductase; CYP98A2, Cytochrome P450 98A2; SAT, Stemmadenine O-acetyltransferase; LAR, Leucoanthocyanidin reductase; TKPR2, Tetraketide alpha-pyrone reductase 2; TAX 10, 3′-N-debenzoyl-2′-deoxytaxol N-benzoyltransferase; UGT88B1, UDP-glycosyltransferase 88B1.
Forests 14 01866 g006
Figure 7. Validation of expression of differentially expressed genes (DEGs) in this study. “Relative expression” represents the results of RT-qPCR validation; FPKM represents expression of transcriptomic analysis. Expression of 25 DEGs identified at 8 DAI was validated with RT-qPCR (AY). Expression of 3 flavonoid biosynthesis-related DEGs was validated at 2, 4, 6, 8, and 21 DAI in poplar leaves (Z,AA,AB). Regression analysis showed the reliability of the transcriptomic expression results (R2 = 0.8169; (AC)).
Forests 14 01866 g007
Table 1. Number of differentially expressed genes (DEGs) identified in poplar leaves after aphid inoculation.
Days after Inoculation (DAI)Number of Total
DEGs
Number of Upregulated GenesNumber of Downregulated GenesDifferential Regulation of DEGs
219514−2.80
426911719972+1.76 *
615951100495+2.22 *
819381519419+3.63 **
211111074+26.75 **
Note: Positive values indicate that the differentially expressed genes (DEGs) are mainly upregulated in poplar-aphid interactions. Negative values indicate that the DEGs are mainly downregulated. Asterisks indicate significantly different differential regulation of DEGs (chi-square test; * p < 0.05; ** p < 0.01).
Disclaimer/Publisher’s Note: The statements, opinions and data contained in all publications are solely those of the individual author(s) and contributor(s) and not of MDPI and/or the editor(s). MDPI and/or the editor(s) disclaim responsibility for any injury to people or property resulting from any ideas, methods, instructions or products referred to in the content.

