Article

The Impact of Natural Regeneration of Phoebe bournei in Anfu County, Jiangxi Province, on Community Diversity and Soil Nutrient Characteristics

1
College of Life Science and Technology, Central South University of Forestry and Technology, Changsha 410004, China
2
National Engineering Laboratory for Applied Forest Ecological Technology, Changsha 410004, China
*
Author to whom correspondence should be addressed.
Forests 2023, 14(9), 1783; https://doi.org/10.3390/f14091783
Submission received: 6 June 2023 / Revised: 22 August 2023 / Accepted: 29 August 2023 / Published: 1 September 2023
(This article belongs to the Section Forest Ecology and Management)

Abstract

:
The ecological process of natural regeneration in forests is achieved by altering the relationship between community diversity and abiotic factors, thereby influencing the structure and functioning of ecosystems. Phoebe bournei is a unique and endangered tree species in China, and due to the rarity of P. bournei (Phoebe bournei) populations, there is limited research on the interaction between plant community diversity and soil environment during its natural regeneration process. Jiangxi Mingyue Mountain Forest Farm is one of the few locations where the natural regeneration of P. bournei communities occurs. From 2018 to 2021, the DBH (diameter at breast height) method was employed to define the stages of P. bournei regeneration. Community tree diversity, productivity, soil nutrients, and microbial diversity were investigated. The results showed the following: (1) P. bournei exhibits a competitive advantage compared to other tree species during natural regeneration, and it becomes the main contributor to community biomass and productivity in the later stages of regeneration. (2) The regeneration process of P. bournei has significant effects on community tree diversity and soil environment. Community diversity and biomass show a trend of initial increase followed by a decrease. Soil moisture content, available phosphorus, and bacterial diversity significantly increase. P. bournei’s competitive advantage is likely derived from its regulation of soil nutrients and microorganisms. (3) Correlation analysis reveals a significant positive correlation between soil microbial diversity and community productivity. Therefore, it is necessary to consider the composition and diversity of underground soil microorganisms in studies aimed at improving the quality of P. bournei forests. In summary, the natural regeneration of P. bournei involves the gradual removal of the original dominant evergreen species in the community by increasing its own competitive advantage and productivity, while continuously regulating community diversity, soil nutrients, and microbial diversity to facilitate the growth and development of P. bournei, ultimately establishing it as the dominant species in the forest community.

1. Introduction

Natural forests worldwide are formed through natural regeneration following disturbances caused by human activities or extreme natural events [1,2]. These forests are a major source of terrestrial carbon globally. Naturally regenerated stands generally exhibit superior nutrient cycling and soil quality compared to plantation forests [3], and they play a crucial role in promoting ecosystem stability, enhancing forest community structure, and improving species diversity.
Forest regeneration and succession alter the composition of community tree species, forest structure, and density, leading to subsequent changes in soil microhabitats [4,5]. Research has shown that the fundamental drivers shaping forest community structure are the interactions between environmental and biological factors [6]. The relationships between tree species, soil microorganisms, and physicochemical properties of forest soils have been extensively studied. For example, soil phosphorus (P) is one of the most crucial nutrients for plant growth [7] and a primary limiting factor for productivity in tropical and subtropical forests [8,9,10]. The interactions between soil nutrients and the biotic community in forest ecosystems are complex and governed by multiple factors.
Productivity and biodiversity are key indicators for achieving ecosystem services and functions. Research has found that forest community types, stages of regeneration and succession, tree species composition, environmental variations, and study scales significantly influence variations in stand productivity [11,12,13]. Moreover, the complexity of stand structure and tree growth characteristics increase the uncertainty of the relationship between diversity and productivity [14,15]. Additionally, a growing body of research has elucidated the role of belowground biodiversity in maintaining ecosystem functionality [16]. Soil microorganisms are able to regulate soil–plant nutrient cycling and plants’ utilization efficiency of available resources through extracellular enzyme secretion [17,18]. Conversely, changes in tree species diversity also influence litter quality and root exudates, thus regulating soil microbial activity and diversity. The interactions between aboveground and belowground processes [19] and between plants and soil microorganisms [20] have been recognized as important factors affecting productivity. Such studies are beneficial for managers to scientifically develop forest management measures that uphold high forest productivity.
P. Bournei (Phoebe bournei), belonging to the Lauraceae family, is an evergreen arbor tree species. It is distributed in Hunan, Jiangxi, Fujian, Guizhou, Hubei, and Zhejiang provinces of China and is one of the important tree species in subtropical evergreen broadleaf forests [21]. It was a very valuable timber species that was widely used in construction, high-quality furniture, and carvings. The P. bournei trees were cut down devastatingly for a long time in China, and its seeds have dormancy properties, causing some difficulties in germination and natural regeneration [22]. As a result, wild populations of P. bournei are extremely rare, making it challenging to observe the natural regeneration process of this species. The Nanmuchong P. bournei community in Mingyue Mountain Forest Farm, Jiangxi Province, is one of the few ecosystems within the suitable habitat where natural regeneration of P. bournei can be observed. Therefore, this study focuses on the natural P. bournei forests in the Nanmuchong Forest of Mingyue Mountain, Jiangxi Province. By analyzing observation data from 2018 to 2021, we aim to explore the characteristics and interrelationships of community productivity, diversity, and soil nutrient changes during the natural regeneration process of P. bournei. This research is of significance for promoting studies on the natural regeneration of P. bournei and enhancing its timber production. The research questions addressed are as follows: (1) What are the impacts of the natural regeneration process of P. bournei on aboveground and belowground biotic communities and soil nutrient dynamics? (2) What is the relationship between changes in community productivity and soil environment, as well as community diversity?

2. Materials and Methods

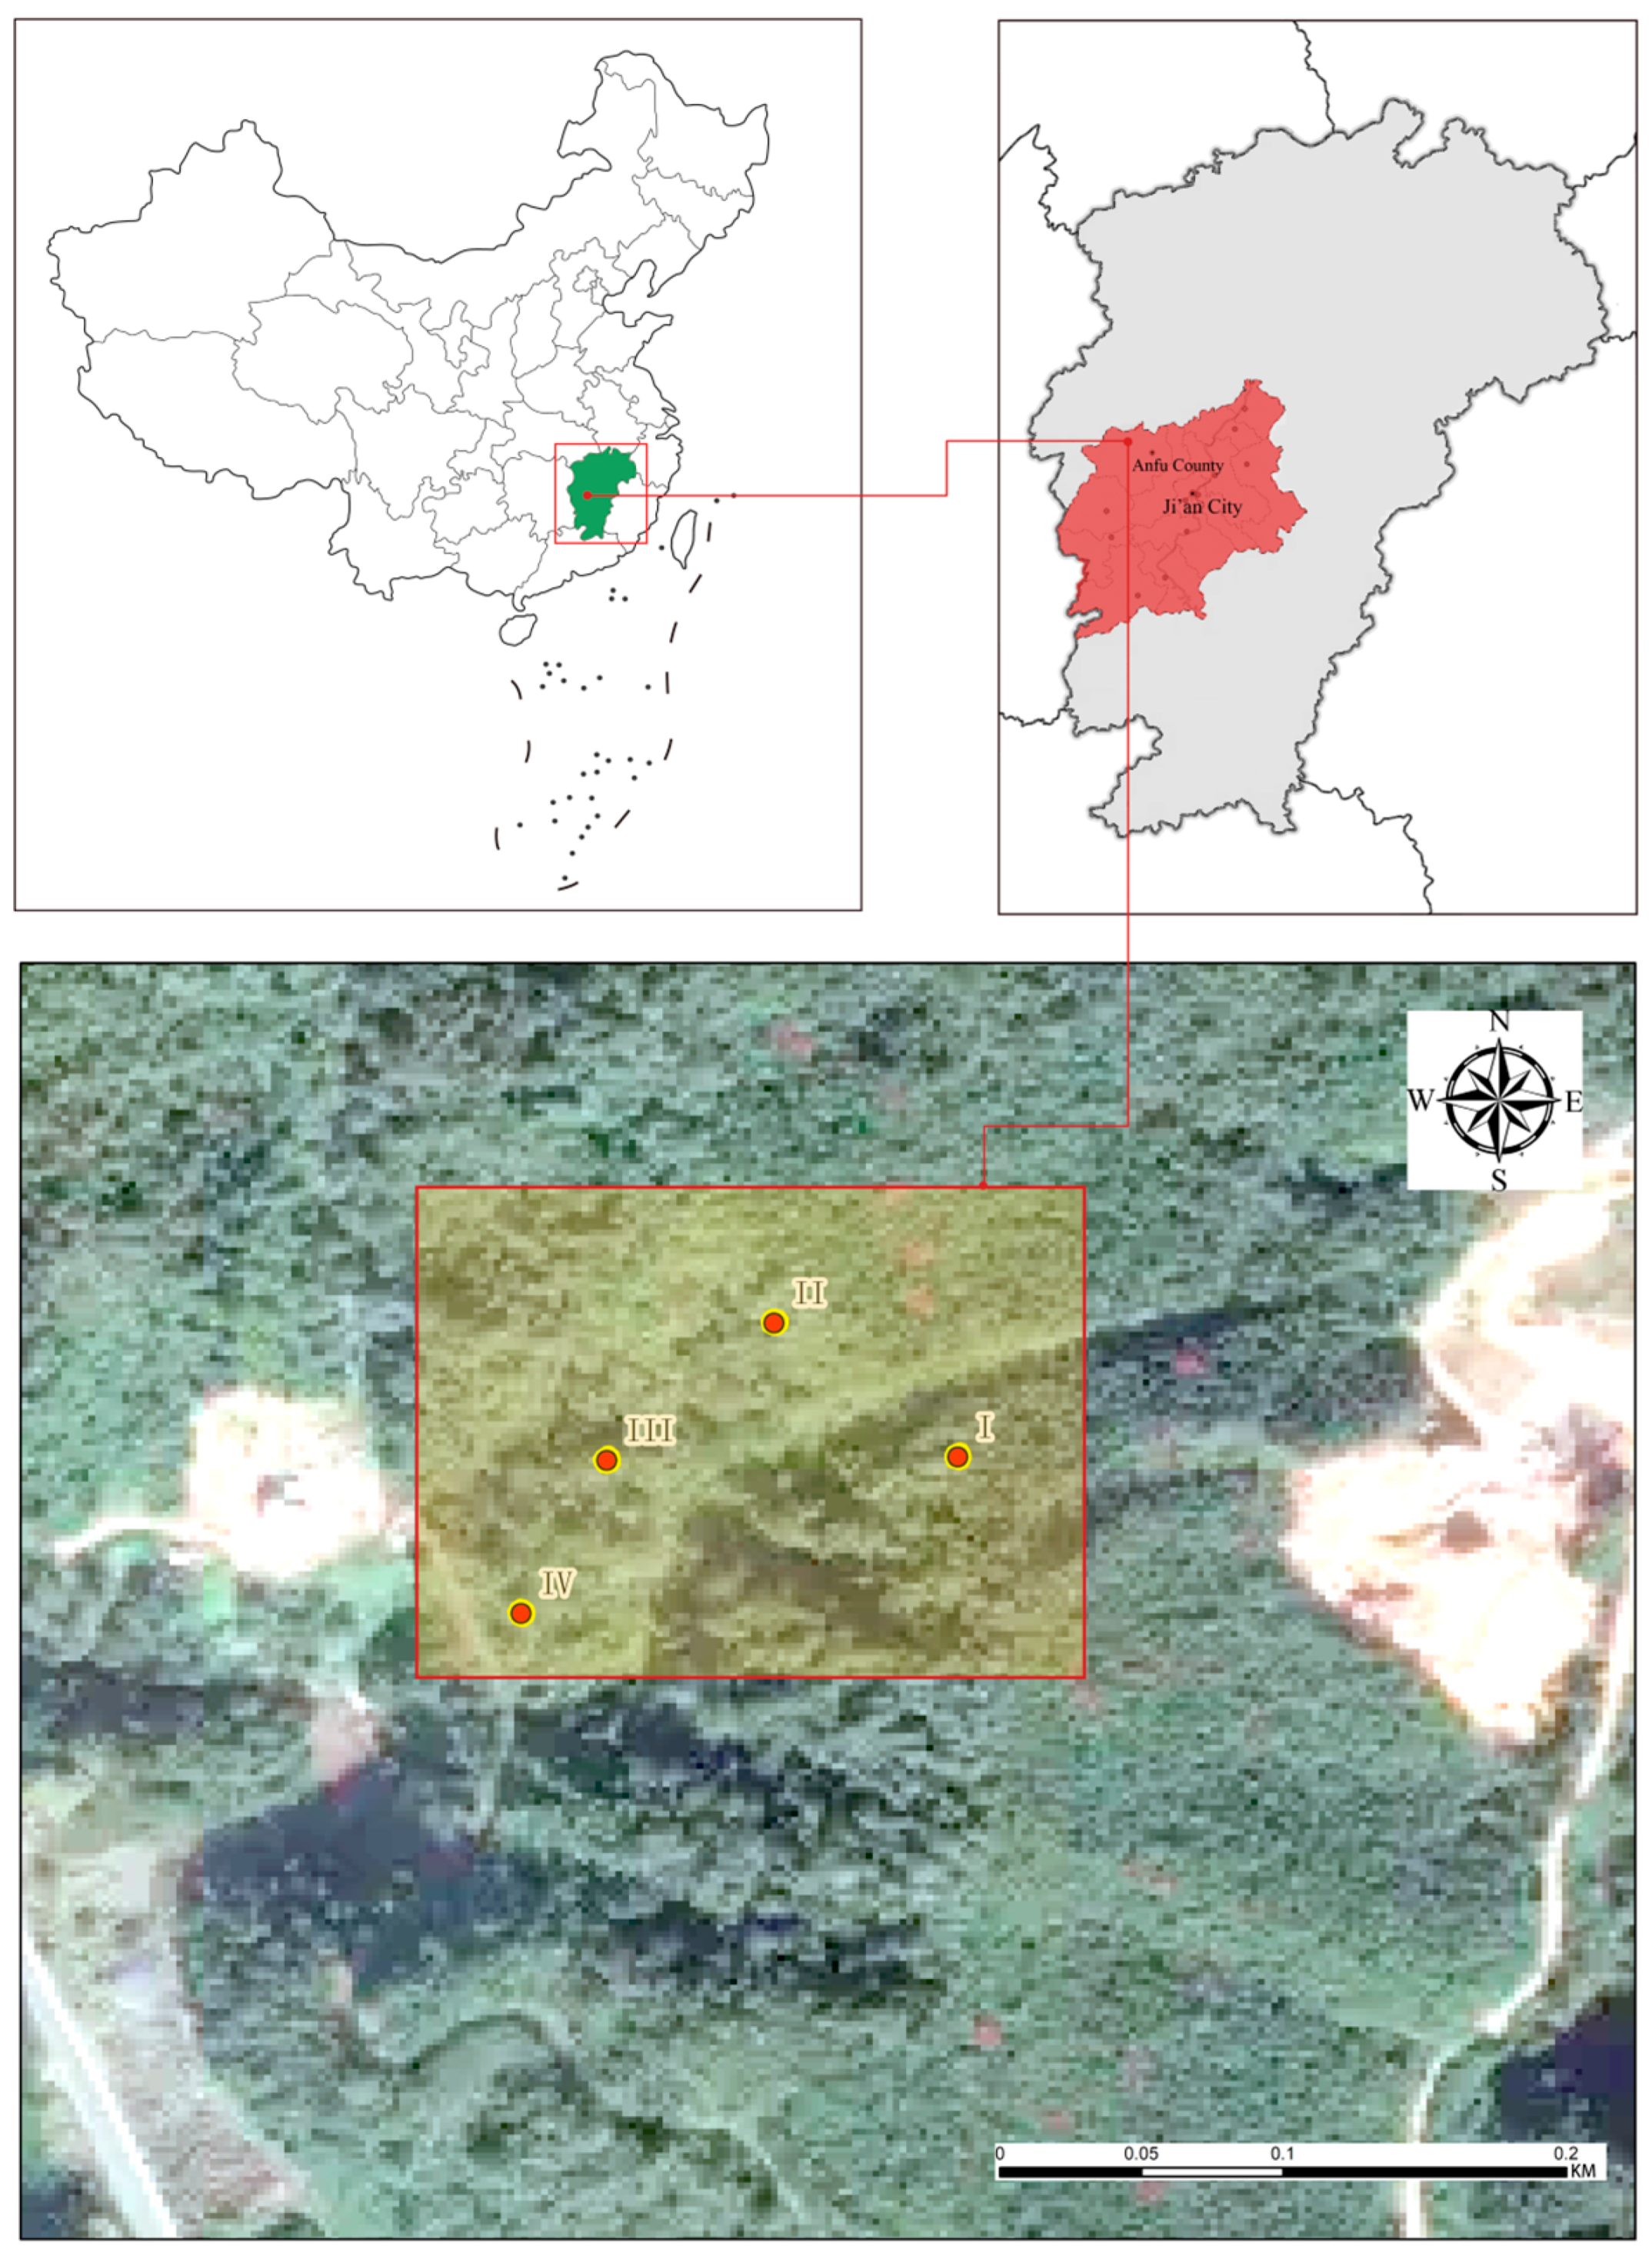
2.1. Study Site and Sample Plot Setting

The experimental site of this study is located in the Nanmuchong area of Mingyue Mountain Forest Farm, Anfu County, Ji’an City, Jiangxi Province, China (27°4′–27°36′ N, 114°–114°47′ E). The region has a subtropical, moist monsoon climate, with an average annual temperature of approximately 17.7 °C and an average annual precipitation of about 1553 mm. The soil parent material primarily consists of carbonaceous shale, shale, and sandstone, with fertile soil and high organic matter content. The soil type in this study area is acrisol. The main vegetation type in the region is subtropical evergreen broad-leaved forest, dominated by species such as P. bournei, Castanopsis fargesii, Quercus glauca, and Taxus chinensis. An overview map of the study area is shown in Figure 1.
The chosen study site is a relatively undisturbed natural P. bournei forest with the widest remaining area in the region, located in the western part of the forest farm at an elevation of approximately 1000 m, covering an area of about 2800 m2. The distribution trend of the P. bournei population in the community from seedlings to mature trees is evident. Based on their growth and distribution patterns, four plots with an area of 20 m × 20 m each were established. To ensure the independence of the plots and minimize overlap and interference among them, a minimum distance of 3 m was maintained between the plots, and all plots were oriented towards the southwest direction. Due to the lower biomass of tree individuals with a DBH of less than 3 cm, measurements are based on a DBH threshold of 3 cm. Using a caliper, measure the DBH of all woody plants in the sample plot at a height of 1.2 m, and the species, DBH, height, and growth status of woody plants with DBH ≥ 3 cm were recorded. Each individual plant was tagged with a unique number for subsequent tracking and measurements. The age class of P. bournei individuals in each plot was estimated using the stand-level structure instead of the age structure method [23]. Based on the maximum age of P. bournei trees in each plot, the four plots were divided into different regeneration stages, named Regeneration Stage I, II, III, and IV, respectively. A community survey was conducted annually from 2018 to 2021, and the basic condition of trees within the plots is shown in Table 1 and Table 2.

2.2. Soil Sampling and Testing

Soil nutrients: Soil sampling was conducted during each growing season (July) from 2018 to 2021. The diagonal method was employed to determine five sampling points within each plot. At each sampling point, 3 soil samples were collected from the 0–20 cm depth, resulting in a total of 60 soil samples (4 plots × 5 points × 3 repetitions). These samples were placed in labeled self-sealing bags and transported to the laboratory. After removing impurities and air-drying, the samples were sieved through a 0.15 mm mesh and reserved for soil nutrient analysis. Soil moisture content (SMC) was determined using the drying method. Soil pH was measured using an automatic acid–alkali meter with a water-to-soil ratio of 2.5:1. Soil organic carbon (C) was determined using the potassium dichromate heating method. Total nitrogen (N) was measured using the Kjeldahl method. Total phosphorus (P) was determined using the molybdenum–antimony anti-colorimetric method. Soil enzyme activities were assessed using colorimetric methods with specific enzyme activity assay kits.
Soil microorganisms: Three random sampling points were selected within each plot using the five-point sampling method. After removing the surface litter, the soil samples were mixed to form a composite sample. Each composite sample was sieved through a 2 mm sterile sieve and divided into 3 labeled sterile tubes, resulting in a total of 36 microbial soil samples (4 plots × 3 points × 3 repetitions). These samples were stored in liquid nitrogen and transported to the laboratory, where they were kept in a −80 °C freezer. Sequencing analysis was outsourced to Shanghai Meiji Biomedical Technology Co., Ltd., located in Shanghai, China, using the Illumina Miseq PE300 platform. For bacterial analysis, the 16S rRNA gene was amplified using the bacterial primer set 338F (5′-ACTCCTACGGGAGGCAGCAG-3′) and 806R (5′-GGACTACHVGGGTWTCTAAT-3′). For fungal analysis, the ITS region was amplified using the fungal primer set ITS1F (5′-CTTGGTCATTTAGAGGAAGTAA-3′) and ITS2 (5′-GCTGCGTTCTTCATCGATGC-3′). After sample demultiplexing, quality control, and filtering of the OTU (Operational Taxonomic Units) sequences, the relative abundance of the species and their proportions at different taxonomic levels were compared based on the taxonomic information and clustering results.

2.3. Diversity Measure

2.3.1. Species Diversity

The species diversity of each plot is calculated using four indices: species richness (R), Shannon–Weiner diversity index (H′), Simpson diversity index (D), and Pielou’s evenness index (E). The calculation formulas are derived from Whittaker (1972) [24] and Pielou (1975) [25] and are listed as follows:
R = S
H = i = 1 S ( P i l n P i )
D = 1 i = 1 S P i 2
E = H l n S
where S is the total number of species in the plot, and Pi is the relative abundance of the i-th species in the plot.

2.3.2. Structural Diversity

The diversity of forest stand structure was mainly quantified by the diversity of diameter at breast height (DBH) and tree height. The DBH standard deviation (SDD) and height standard deviation (SDh) were calculated for each sample plot to measure the diversity of the forest stand structure [26]. In addition, the stand density (StaD) was used to describe the distribution of trees in each sample plot, expressed as the basal area per hectare (m2/ha). These indices were calculated as follows:
  S D D = σ D
  S D h = σ h
where σ D is the standard deviation of DBH, and σ h is the standard deviation of tree height.

2.4. Importance Value Calculation

Compute the importance value of tree species in the natural forests of P. bournei in 2021. Use IV ≥ 5 as the dominant species and calculate the importance value using woody plants with DBH ≥ 3 cm in the sample plots, with the formula:
Importance Value (IV) = (Relative Density + Relative Dominance)/2
where relative density refers to the percentage of individuals of a specific tree species in the sample plot relative to the total number of tree individuals. Relative dominance represents the percentage of the sum of the basal area of a specific tree species in the sample plot relative to the total basal area of all tree species.

2.5. Biomass Calculation

According to the allometric growth equation model, the best-fit parameters, denoted as ‘a’ and ‘b’, were obtained through model testing. The specific calculation formula for the biomass of each tree species can be referred to by Luo (2016) [27]. The calculation formula for productivity [28] is as follows:
Biomass (B): B = a × (DBH2H)b
Productivity (P): P = (Biomassn+1Biomassn)/t
where DBH represents the diameter at breast height (cm) of individual trees, while a and b are regression coefficients. In this study, community biomass refers to the total aboveground biomass of the tree community. Since the biomass calculations are based on four years of consecutive observational data, the interannual variation in biomass is used as an indicator of community primary productivity (referred to as “productivity” in the study). To ensure the normality of the data, the biomass and productivity data were log-transformed. Biomassn represents the sum of the biomass of all individuals within the plot during the nth year, where n ranges from 2018 to 2020, and t represents the time interval.

2.6. Data Analysis

The preliminary data sorting and calculations were carried out in Excel 2016. One-way analysis of variance (ANOVA) was used in IBM SPSS Statistics 19.0 software to analyze the variations of the different variables during the P. bournei regeneration process. The assumption of homogeneity of variances was tested using the Duncan, Tukey, and LSD methods. Pearson correlation analysis was used to investigate the relationship between soil nutrients and soil microbial communities, plant community diversity, and productivity. Origin 2022 was used for graphing.

3. Results

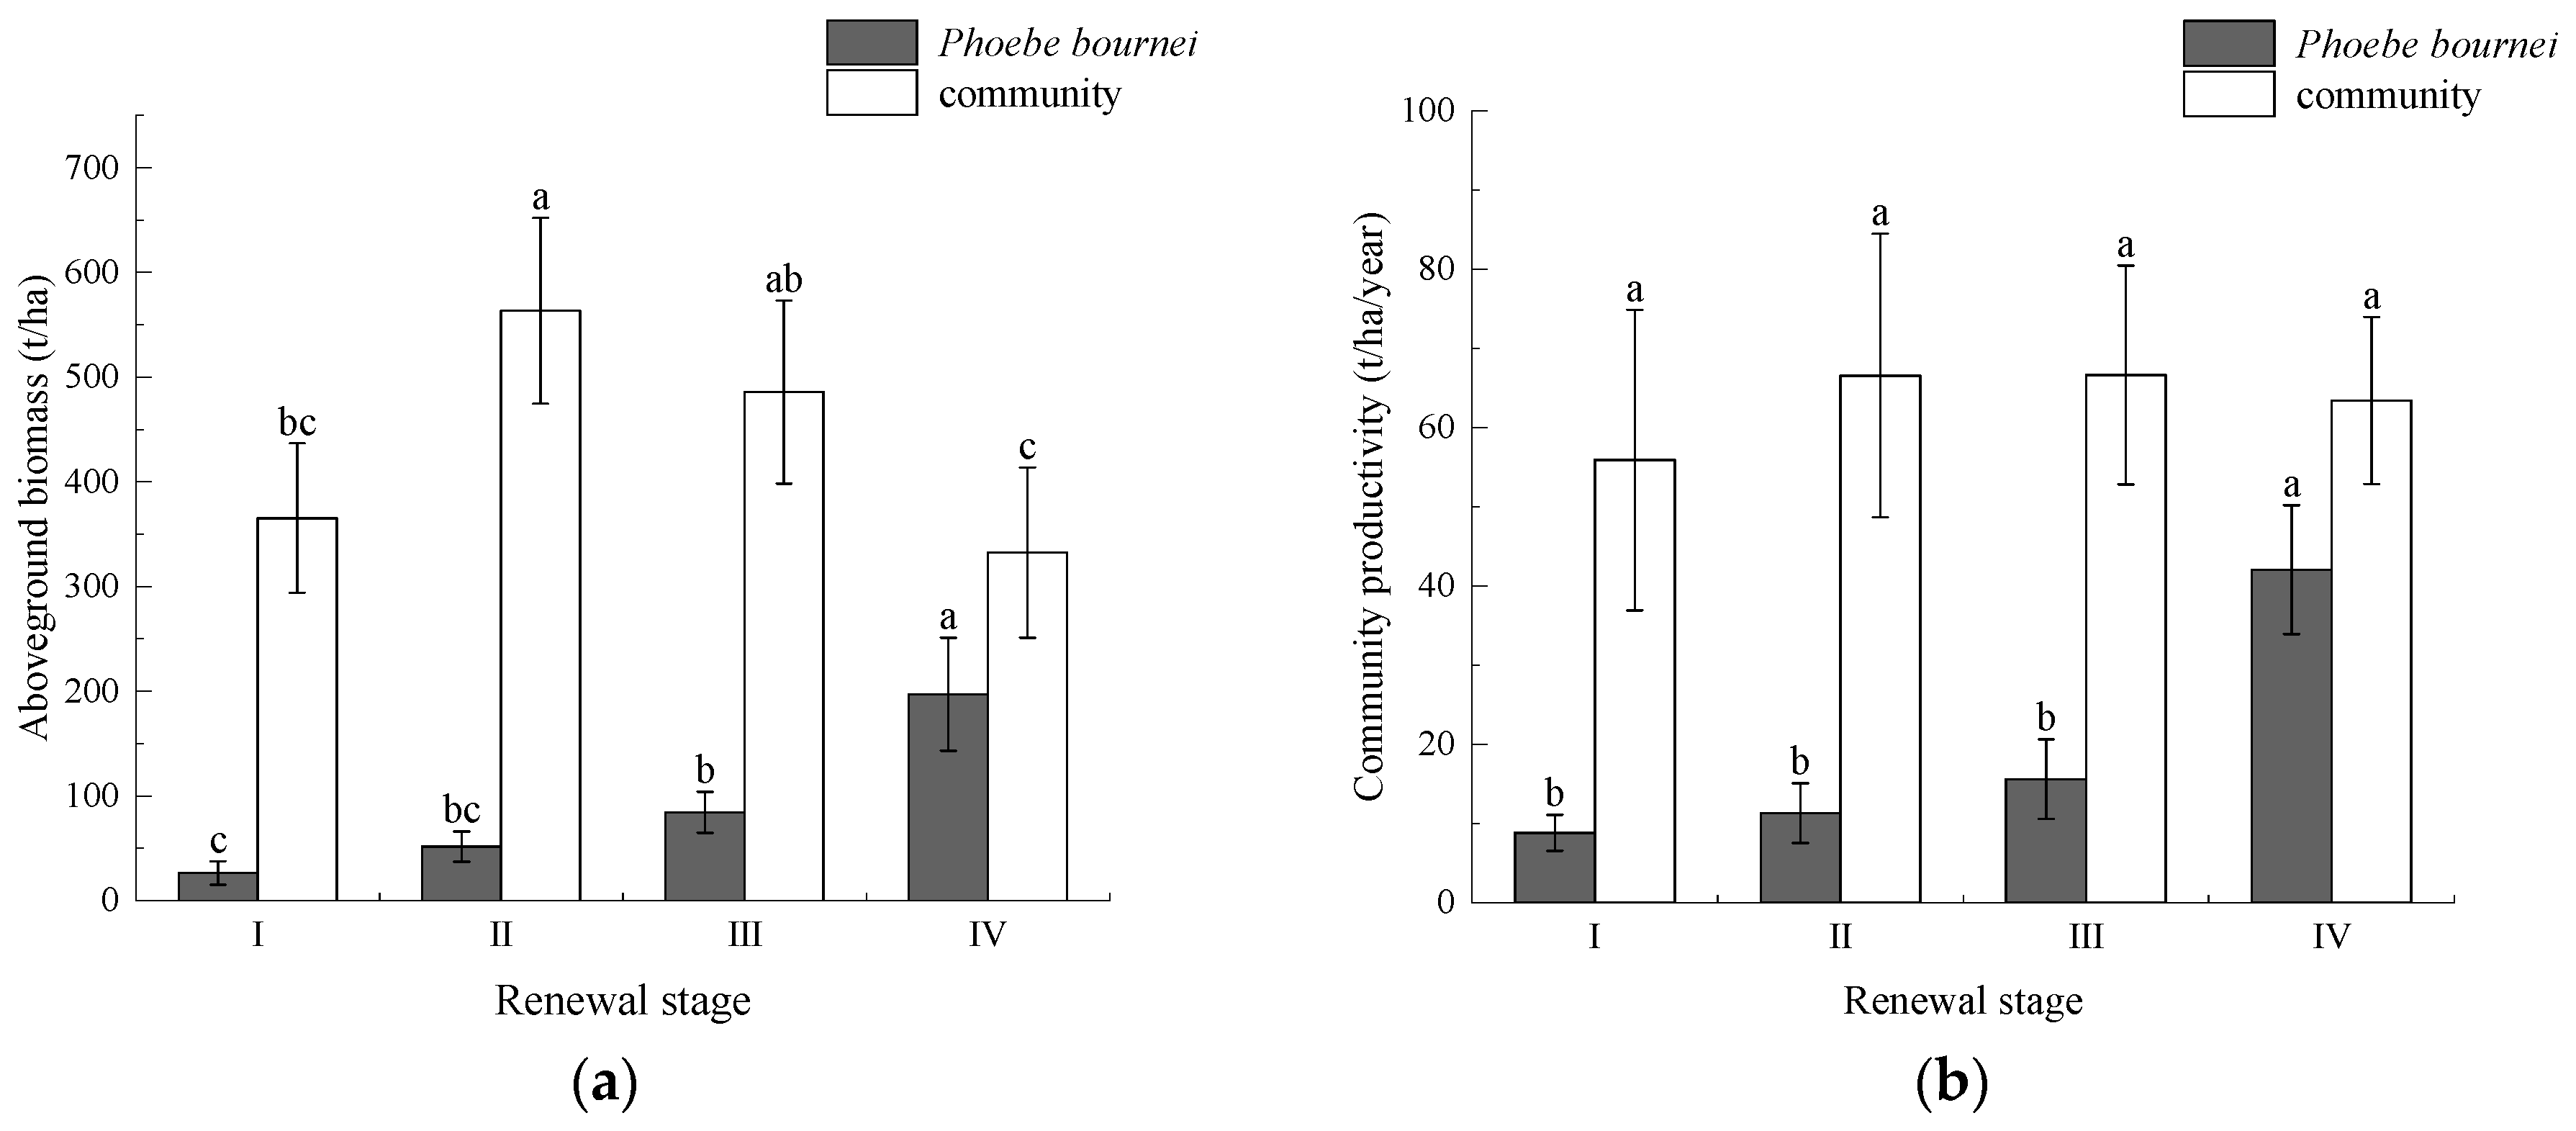
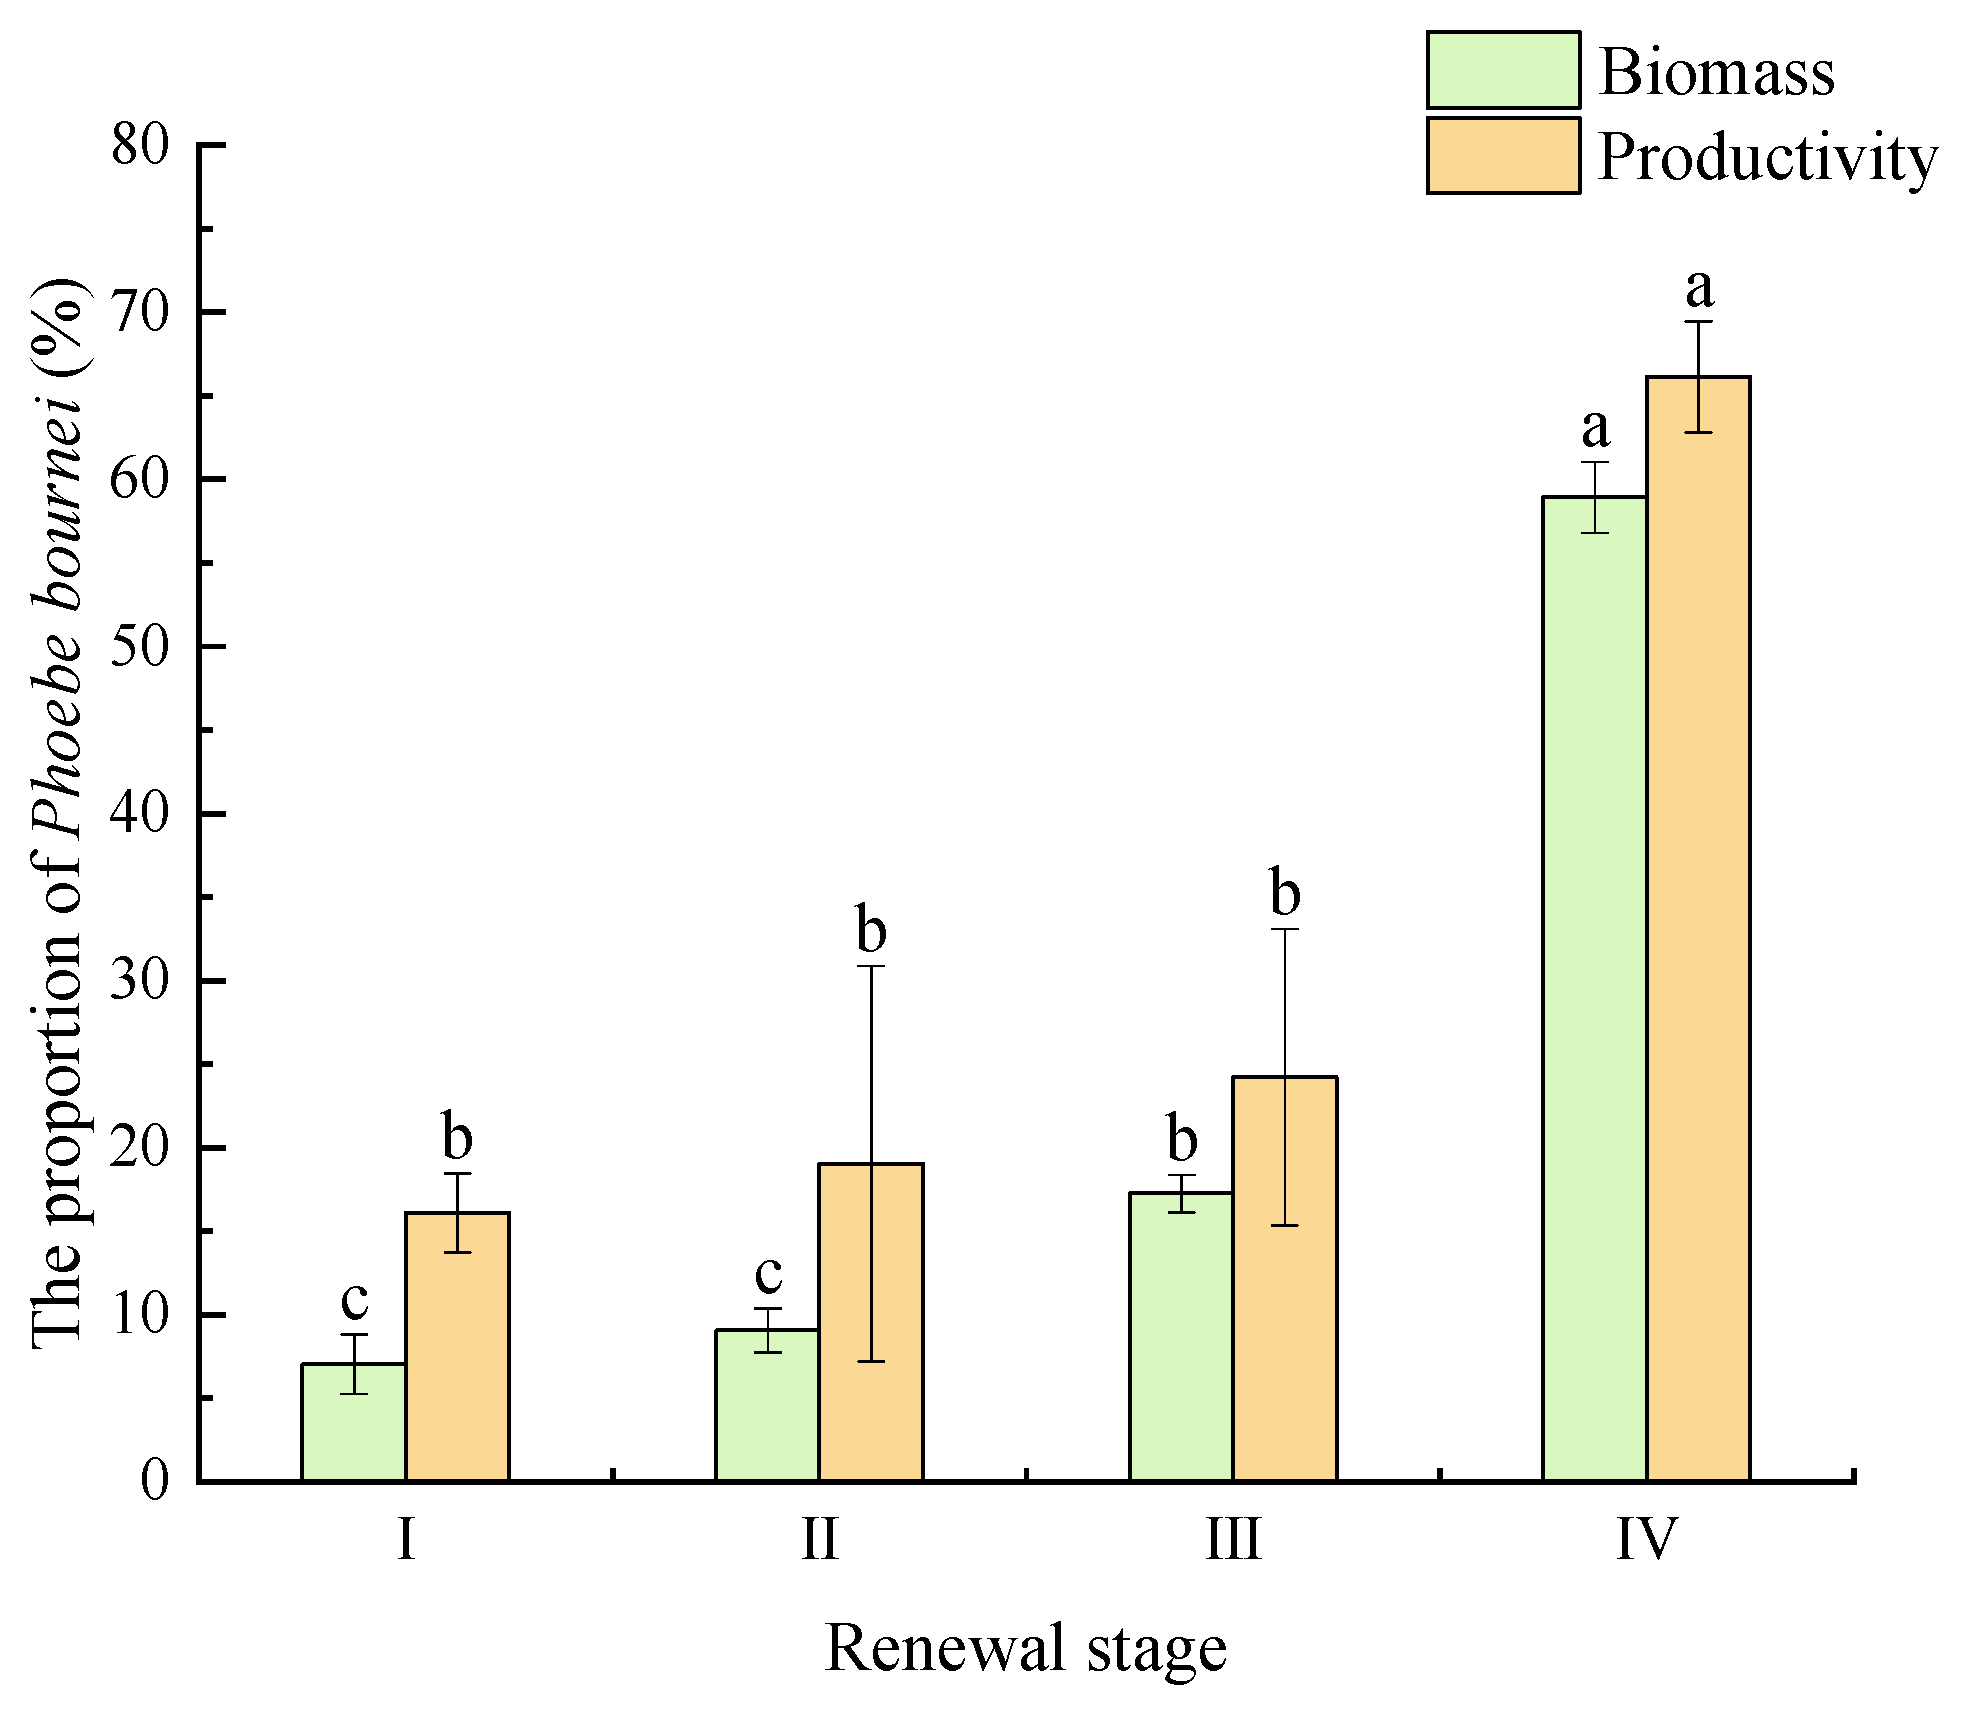
3.1. Community Diversity and Productivity Characteristics

During the natural regeneration process of the P. bournei forest, there were highly significant differences in community species and structural diversity (p < 0.001), showing a trend of initial increase followed by a decrease (Table 3). Moreover, the total aboveground biomass of the tree community also exhibited a significant pattern of increase followed by a decrease (Figure 2a, p < 0.01). The overall community productivity did not significantly differ among different regeneration stages (Figure 2b, p > 0.05), but the biomass and productivity of P. bournei population significantly increased with the progress of regeneration (Figure 2a,b, p < 0.01), with their proportion in the community continuously rising (Figure 3, p < 0.001). In Stage IV of regeneration, P. bournei biomass accounted for 58.92% of the community biomass, and P. bournei productivity accounted for 66.15% of the community productivity. As the regeneration process advanced, the growth rate of P. bournei biomass and productivity gradually increased, making P. bournei the key contributor to the community biomass and productivity.

3.2. Characteristics of Soil Nutrient and Microbial Diversity

During the natural regeneration process of P. bournei, soil moisture content and total phosphorus significantly increased (p < 0.001), while soil total carbon and total nitrogen significantly decreased (p < 0.01) (Table 4). The soil C:P and N:P ratio decreased significantly (p < 0.01, p < 0.001), while soil pH and C:N ratio showed no significant differences among different regeneration stages (p > 0.05). Soil urease (URH), acid phosphatase (AcP), β-glucosaminidase (BG), leucine aminopeptidase (LAP), and β-N-acetyl-glucosaminidase (NAG) activities showed a significant decreasing trend with the progress of regeneration stages.
The Shannon diversity index of the soil bacterial community increased as the regeneration stages developed (Figure 4). The Shannon diversity index, ACE (Abundance-based Coverage Estimator) richness index, and Chao 1 richness index of the soil bacterial community were significantly higher than those of the soil fungal community at each regeneration stage. Overall, the alpha diversity index of the soil bacterial community was higher than that of the soil fungal community in different regeneration stages.

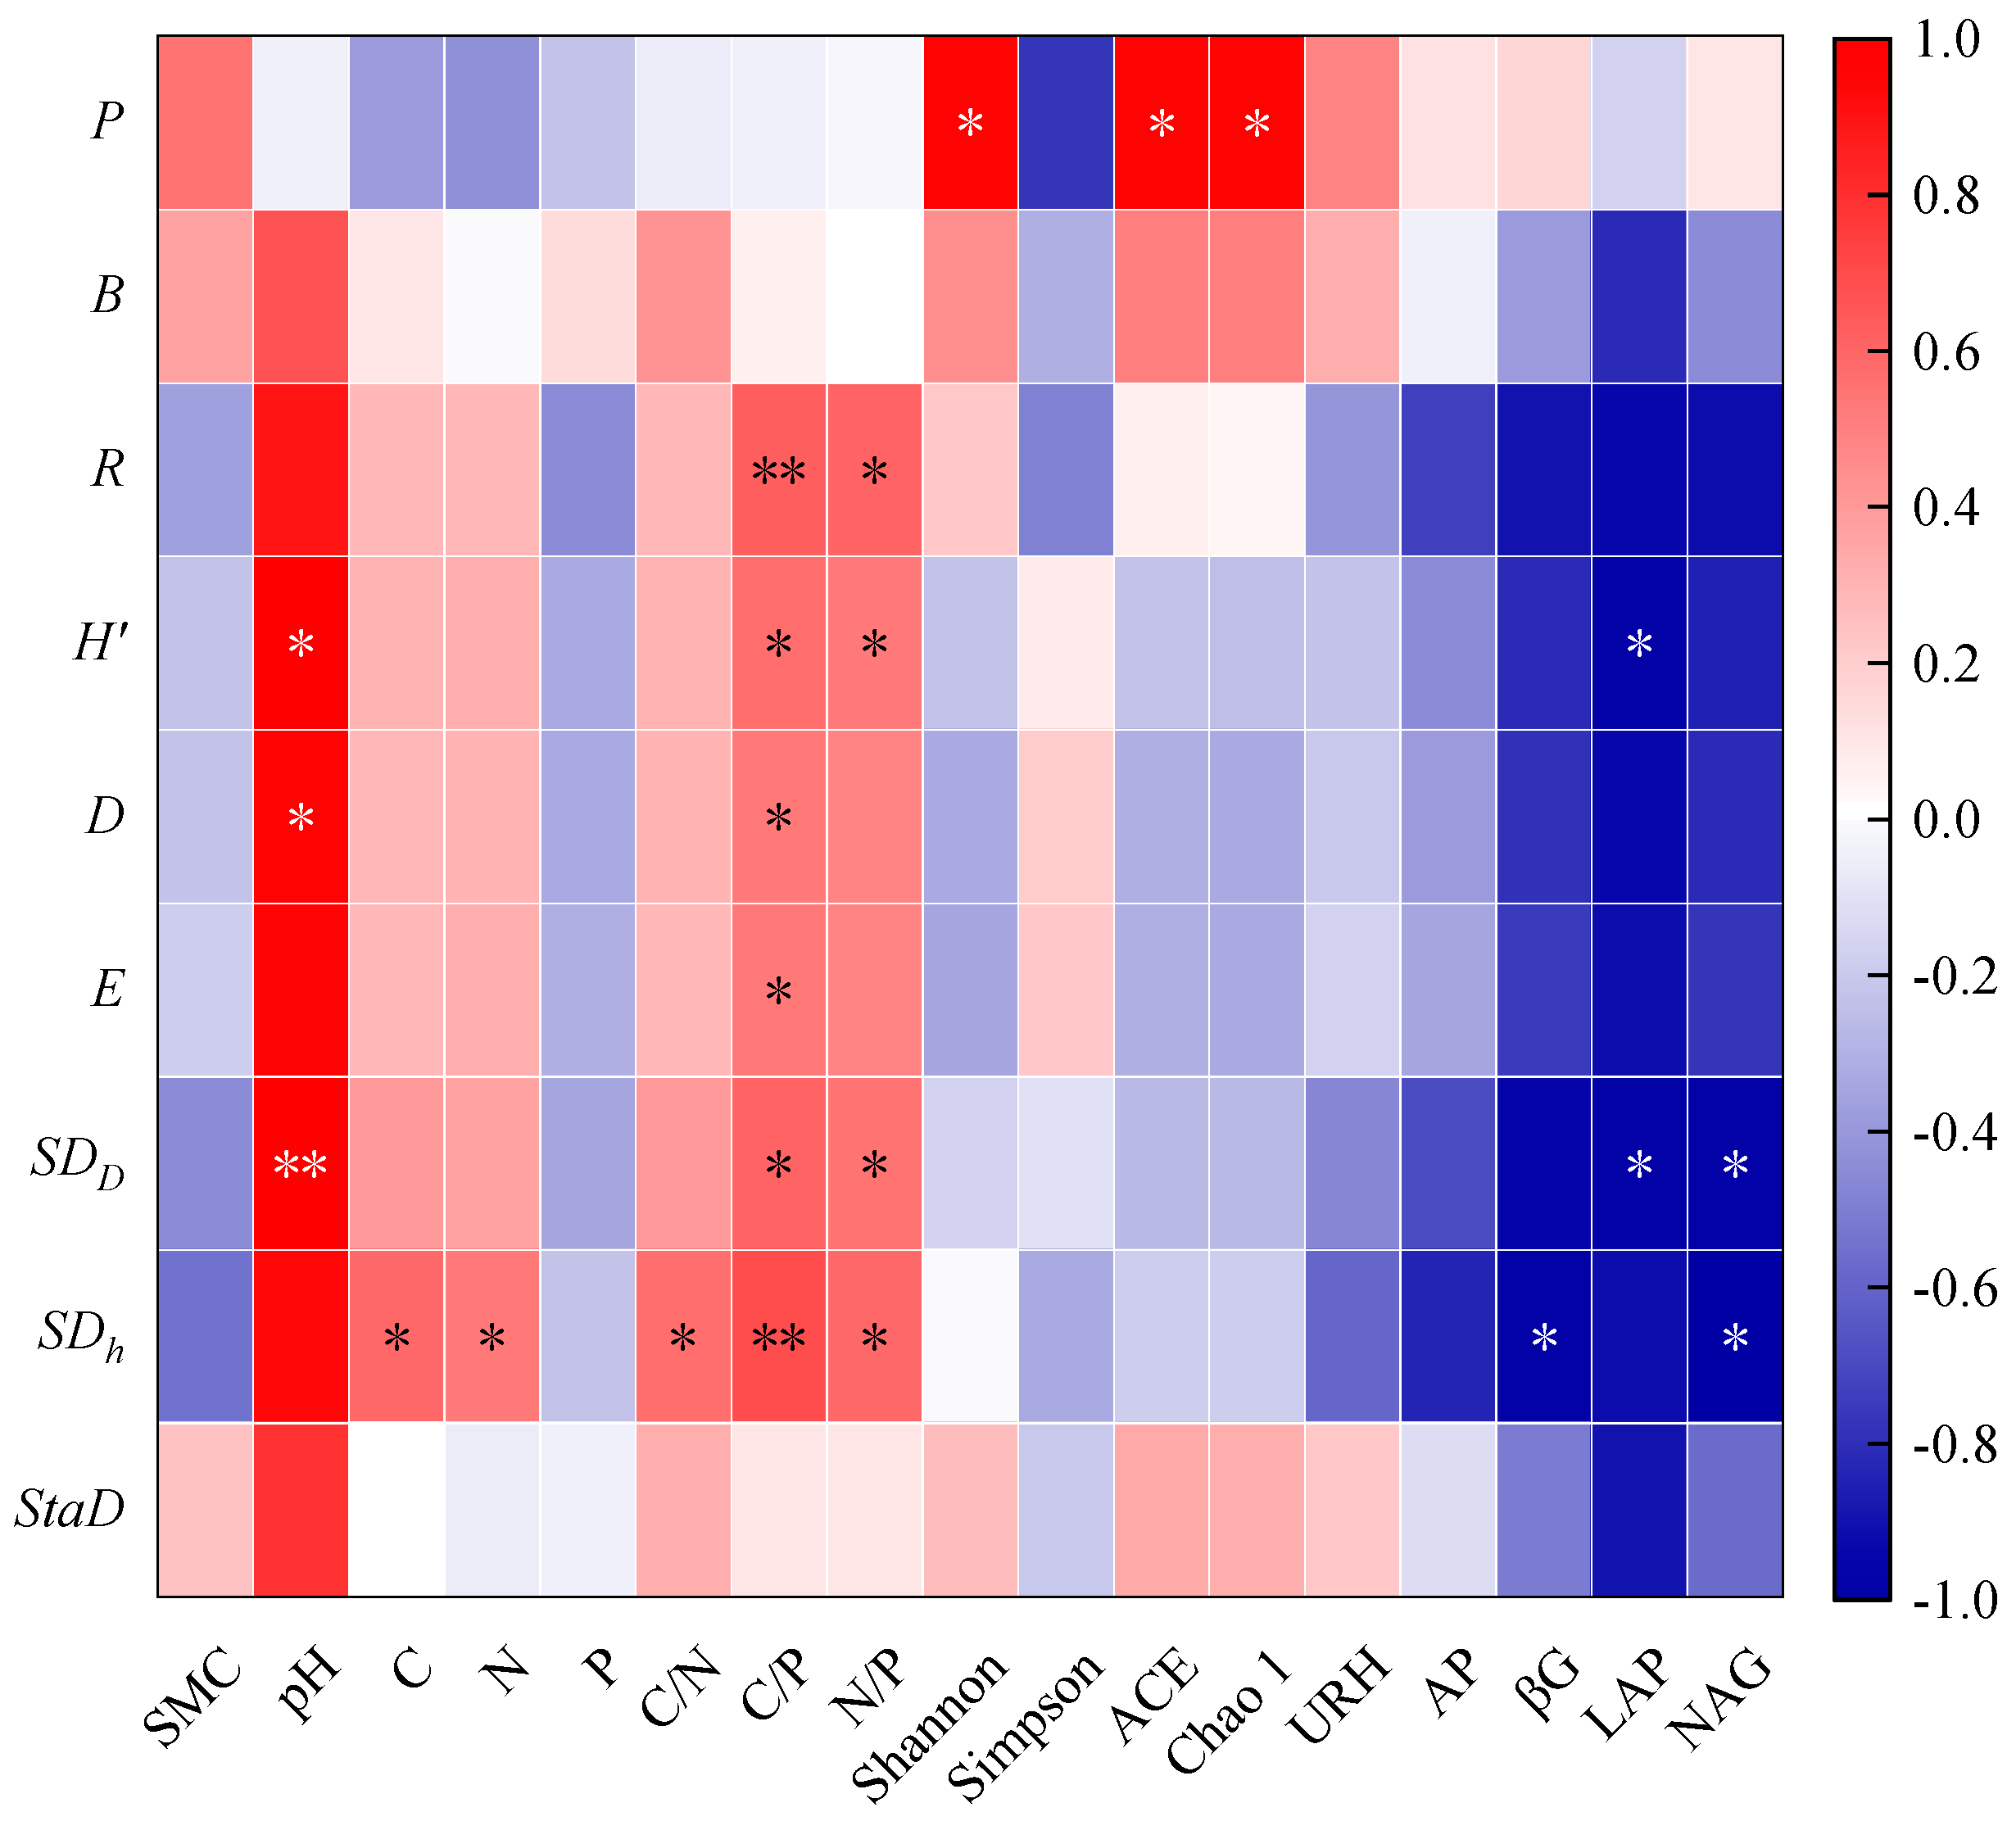
3.3. The Relationship between Community Productivity, Diversity, and Soil Nutrients

The results of Pearson correlation analysis (Figure 5) in the natural regeneration process of P. bournei was significantly positively correlated with soil microbial Shannon diversity, ACE, and Chao 1 indices (p < 0.05). The indicators of community species and structural diversity were significantly positively correlated with soil C:P and N:P ratio (p < 0.05). Specifically, species richness and standard deviation of tree diameter were significantly positively correlated with C:P ratio (p < 0.01), which represents community structural diversity. The standard deviation of tree diameter and tree height were significantly negatively correlated with the activities of βG, LAP, and NAG (p < 0.05). Additionally, species Shannon–Weiner and Simpson diversity indices, as well as the standard deviation of tree diameter, were significantly positively correlated with soil pH (p < 0.05).
To better illustrate the impact of the P. bournei regeneration process on community diversity and soil nutrients, we conducted a principal component clustering analysis on species diversity, structural diversity, soil nutrients, and microbial diversity (Table 5). The first principal component explained over 75% of the variance for all variables, indicating that it represents the changes in species diversity, structural diversity, soil nutrients, and microbial diversity. The results of Pearson correlation analysis showed that biomass was significantly positively correlated with species diversity (Table 6, p < 0.05) and highly positively correlated with structural diversity (p < 0.01). Productivity showed a significant positive correlation with microbial diversity (p < 0.05). Species diversity and structural diversity were significantly positively correlated with soil nutrients (p < 0.01).

4. Discussion

4.1. Changes in Community Diversity and Productivity during P. bournei Regeneration Process

Plant diversity represents the degree of species richness and compositional diversity within a given spatial area, and it can reflect species’ responses to environmental changes. Forest structural diversity, often manifested as the spatial distribution of communities and variations in tree size (such as diameter at breast height and tree height), can reflect community dynamics [29]. The results of this study indicate that during the natural regeneration process of P. bournei, both species diversity and structural diversity of the community exhibited an initial increase followed by a decline. This trend may be attributed to intense competition among different tree species in the early and intermediate stages of regeneration, leading to the eventual dominance of P. bournei and a subsequent decrease in species diversity within the community as it gradually transitions towards a pure P. bournei forest.
Community aboveground biomass is an important indicator for measuring plant productivity and carbon sequestration capacity. A complex community structure can effectively enhance plant light interception and utilization efficiency, as well as optimize soil water and nutrient uptake, thereby promoting biomass accumulation [30,31]. Similar to diversity, the aboveground biomass of the natural P. bournei forest exhibited an initial increase followed by a decline. In this study, the biomass, productivity, and proportion of P. bournei within the community significantly increased during the regeneration process, gradually becoming the dominant species in the community; however, there was no significant change in community productivity. This may be attributed to P. bournei continuously expanding its dominance from juvenile to mature stages, occupying the habitat and soil nutrient resources of other competing species, and resulting in the exclusion of certain high-carbon storage species from the community. The primary source of community productivity shifted from other mature trees to the P. bournei population during the regeneration process, thus maintaining overall productivity without significant change. Interactions between trees can be either positive or negative, depending on species composition and environmental factors [32,33]. The size of trees and the intensity of competition with neighboring trees greatly affect the diversity effects on individual tree productivity [34,35].

4.2. Changes in Soil Nutrients and Microbial Diversity during the Regeneration Process of P. bournei

Plant growth is reliant on soil nutrients, and forest regeneration not only alters aboveground plant communities but also influences plant–soil nutrient cycling and microbial activity. Studies have shown that natural P. bournei forests are limited by phosphorus under human disturbances [36]. In our study, during the P. bournei regeneration process, soil moisture content and total phosphorus levels significantly increased, while soil organic carbon and total nitrogen content showed a decreasing trend. This may be due to the increasing nutrient demand of the P. bournei population as the regeneration stage progresses, accompanied by a decrease in community species diversity and a reduction in litterfall, resulting in a decrease in soil nutrient accumulation and an increase in nutrient output, thereby leading to a decrease in soil carbon and nitrogen nutrients. Additionally, the death of mature competing trees during the regeneration process leads to the release of a large amount of phosphorus into the soil, resulting in higher phosphorus content in the later stages of regeneration compared to the initial stages. Soil C:N ratio can reflect the balance of carbon and nitrogen nutrition and carbon-nitrogen nutrient cycling in the soil, and thus can reflect soil fertility and ecological processes well [37]. The C:P ratio can reflect the effectiveness of soil phosphorus, and the N:P ratio can be used as an indicator to determine the type of soil nutrient limitation [38]. In this study, there was no significant difference in soil carbon–nitrogen ratio during the updating process, but there was a significant decrease in soil C:P and N:P ratio with the development of the updating stage. It indicated that the absorption and accumulation of soil carbon–nitrogen nutrients by different updating stage forest plants maintained a total balance, while the effectiveness of soil phosphorus nutrients increased continuously during the updating process. The N:P ratio of soil in different updating stages was less than 14, indicating that the growth of P. bournei hedyosmoides natural forest plants was limited by soil nitrogen nutrients, and the limiting effect became more significant with the updating process.
Soil enzymes are biocatalysts and are the driving force behind the decomposition of soil organic matter. The activity of soil enzymes reflects the efficiency of soil organic matter transformation [39] and can also serve as an early warning and sensitive indicator of ecosystem changes [40]. In this study, the activities of various enzymes showed a decreasing trend with the development of the regeneration stages, indicating a decreased demand of soil microbial communities for the decomposition of soil carbon, nitrogen, and phosphorous nutrients. During the regeneration process of P. bournei, the Shannon diversity index of soil bacteria significantly increased, and both the ACE and Chao 1 indices of soil microorganisms showed a significant negative correlation with soil total nitrogen content, indicating that the changes in soil microbial activity were limited by soil nitrogen nutrients. Additionally, throughout the regeneration process, the Shannon diversity index of soil bacteria, ACE diversity index, and Chao 1 diversity index were all significantly higher than those of the soil fungi community, suggesting that bacterial communities were more active than fungal communities during the regeneration of P. bournei, exerting a greater influence on community ecological processes.

4.3. The Relationship between Community Productivity and Diversity and Soil Environment during the Regeneration Process of P. bournei

Species and the environment interact with each other and form specific structures under certain spatiotemporal changes, which is the comprehensive result of species’ response to the environment [41]. Tree growth, development, reproduction, and interactions with other species are all influenced by changes in soil nutrient availability, and soil nutrient content reflects the nutrient absorption status of the community. In the results of this study, the Shannon–Wiener diversity index, Simpson diversity index, and standard deviation of diameter at breast height of the community showed a significant positive correlation with soil pH, indicating that soil acidity or alkalinity can regulate plant community diversity. Previous studies have shown that increasing alkalinity in acid soil can enhance community diversity in subtropical regions. Species diversity and structural diversity were significantly positively correlated with soil C:P and N:P ratio, suggesting that the effectiveness of phosphorus nutrients increased with the increase in species and structural diversity. Over the past 60 years, research has revealed that the increase in nitrogen deposition and intensified global warming have exacerbated phosphorus limitation in subtropical forests. Under such circumstances, plants tend to enhance phosphorus recycling efficiency and reduce phosphorus content in plant litter [42,43], which results in more phosphorus being released back into the soil through decomposition. The standard deviation of diameter at breast height and tree height, which represents structural diversity, showed a significant positive correlation with soil nutrient content and stoichiometric ratios, and a significant negative correlation with soil enzymes related to carbon and nitrogen acquisition. This indicates that a complex community structure promotes nutrient accumulation and transformation, and reduces the limitations of soil nutrient availability on plant growth due to differences in growth and complementary interactions among plants.
The relationship between biodiversity and ecosystem functioning (BEF) has been a focal point of research in ecology. The results of this study indicate a significant positive correlation between community species diversity and biomass during the regeneration stage of P. bournei. This finding is consistent with the majority of previous studies [44,45,46]. Additionally, community structural diversity is also positively correlated with biomass, suggesting that a complex community structure can effectively enhance plant light absorption and utilization efficiency, as well as optimize soil water and nutrient uptake, thereby promoting biomass accumulation. Furthermore, in this study, both species diversity and structural diversity show no significant correlation with productivity, which differs from most research findings (structural diversity positively correlated with productivity). This may be attributed to the fact that during the early- to mid-regeneration stage, P. bournei, as a high carbon reserve species, has lower productivity in terms of seedlings, and other high carbon storage species mutually constrain each other in intense competition. Therefore, the highly diverse community does not exhibit a strong complementarity effect. In the later stages of regeneration, with a decrease in community species diversity, P. bournei dominates the allocation of community resources, becoming the primary contributor to community productivity with stable production capacity. Hence, the relationship between community diversity and productivity is not evident in this study. Interactions between trees can be positive or negative, depending on the species composition and environmental influences [32,33]. Therefore, when exploring the relationship between diversity and productivity in ecosystems, it is necessary to consider the regeneration state of the stand, focus on variations in tree growth and inter-specific competition within the community, and comprehensively analyze and evaluate trends in community productivity.
Interactions between aboveground and belowground processes [19], as well as between plants and soil microorganisms [47], can have an impact on productivity. The results of this study show a significant positive correlation between soil microbial Shannon diversity, ACE, Chao 1 index, and community productivity in the P. bournei natural forest. This indicates that the regeneration process of P. bournei regulates aboveground plant community productivity by altering soil nutrients and the microbial community.
In conclusion, soil C:P, N:P ratio, and the availability of nitrogen and phosphorus nutrients are the primary environmental factors influencing the species and structural diversity in the P. bournei natural forest. As the effectiveness of soil nutrient availability increases, community diversity also increases. Additionally, the increase in soil microbial diversity facilitates the growth of community productivity.

5. Conclusions

This study conducted continuous observational research in Nanmuchong, Mingyue Mountain Forest Farm, Jiangxi Province from 2018 to 2021, revealing the impacts of natural regeneration of P. bournei on plant communities, soil nutrients, and microorganisms. The main conclusions of this paper are as follows: (1) P. bournei possesses significant competitive advantages compared to other tree species during the natural regeneration process, gradually increasing its dominant position and ultimately becoming the main contributor to community biomass and productivity. (2) The regeneration process of P. bournei significantly improves soil moisture content and the effectiveness of phosphorus nutrients, and the increase in soil C:P, N:P ratio, and nutrient effectiveness enhances community diversity. (3) The productivity of the P. bournei natural forest during the regeneration process is regulated by changes in soil microbial community diversity. In conclusion, when considering the ecological processes and management of P. bournei natural forests, it is crucial to take into account the interactions between plants, soils, and microorganisms, especially the driving factors and influences of changes in underground microbial communities.

Author Contributions

Investigation, P.Z. and L.L.; Data curation, J.S. and H.D.; Writing—original draft, Z.X.; Writing—review & editing, G.W. All authors have read and agreed to the published version of the manuscript.

Funding

This research is supported by the Key Research and Development Project of Hunan Province of China (Grant No. 2022Nk2018) and the Key Projects of Science and Technology of Guangxi Province of China (Grant No. AB21220026).

Data Availability Statement

The data presented in this study are available on request from the corresponding author. The data are not publicly available due to restrictions eg privacy.

Conflicts of Interest

The authors declare no conflict of interest.

References

  1. Yang, K.; Zhu, J.; Zhang, M.; Yan, Q.; Sun, O.J. Soil microbial biomass carbon and nitrogen in forest ecosystems of Northeast China: A comparison between natural secondary forest and larch plantation. J. Plant Ecol. 2010, 3, 175–182. [Google Scholar] [CrossRef]
  2. Wang, C.K.; Yang, J.Y. Rhizospheric and heterotrophic compo-nents of soil respiration in six Chinese temperate forests. Glob. Chang. Biol. 2007, 13, 123–131. [Google Scholar] [CrossRef]
  3. Burton, J.; Chen, C.R.; Xu, Z.H. Gross nitrogen transformations in adjacent native and plantation forests of subtropical Australia. Soil Biol. Biochem. 2007, 39, 426–433. [Google Scholar] [CrossRef]
  4. Chandra, L.R.; Gupta, S.; Pande, V.; Singh, N. Impact of forest vegetation on soil characteristics: A correlation between soil biological and physico-chemical properties. 3 Biotech. 2016, 6, 188. [Google Scholar] [CrossRef] [PubMed]
  5. Feng, C.; Ma, Y.H.; Jin, X.; Wang, Z.; Ma, Y.; Fu, S.L.; Chen, H.Y.H. Soil enzyme activities increase following resto ration of degraded subtropical forests. Geoderma 2019, 351, 180–187. [Google Scholar] [CrossRef]
  6. Green, R. Ecology and Evolution of Communities.by Martin L. Cody; Jared M. Diamond. Biometrics 1976, 32, 701. [Google Scholar] [CrossRef]
  7. Vincent, A.G.; Schleucher, J.; Grbner, G.; Vestergren, J.; Persson, P.; Jansson, M.; Giesler, R. Changes in organic phosphorus composition in boreal forest humus soils: The role of iron and aluminium. Biogeochemistry 2012, 108, 485–499. [Google Scholar] [CrossRef]
  8. Gren, G.I.; Wetterstedt, J.M.; Billberger, M.F.K. Nutrient limitation on terrestrial plant growth–modeling the interaction between nitrogen and phosphorus. New Phytol. 2012, 194, 953–960. [Google Scholar]
  9. Gnankambary, Z.; Ilstedt, U.; Nyberg, G.; Hien, V.; Malmer, A. Nitrogen and phosphorus limitation of soil microbial respiration in two tropical agroforestry parklands in the South-Sudanese zone of Burkina Faso: The effects of tree canopy and fertilization. Soil Biol. Biochem. 2008, 40, 350–359. [Google Scholar] [CrossRef]
  10. Hu, B.; Yang, B.; Pang, X.Y.; Bao, W.K.; Tian, G.L. Responses of soil phosphorus fractions to gap size in a reforested spruce forest. Geoderma 2016, 279, 61–69. [Google Scholar] [CrossRef]
  11. Lewandowska, A.M.; Biermann, A.; Borer, E.T.; Cebrián-Piqueras, M.A.; Hillebrand, H. The influence of balanced and imbalanced resource supply on biodiversity-functioning relationship across ecosystems. Philos. Trans. R. Soc. B Biol. Sci. 2016, 371, 1–9. [Google Scholar] [CrossRef]
  12. Fridley, J.D. Resource availability do minates an dalters the relationship between species diversity an decosystem productivity in experimental plant communities. Oeclolgical 2002, 132, 271–277. [Google Scholar] [CrossRef] [PubMed]
  13. Darwin, G.; Margot, V.; Lander, B.; Jan, V.; An, M.; Dries, B.; Luc, L.; Kris, V. Competition, tree age and size drivethe productivity of mixed forests of pedunculate oak, beech and red oak. For. Ecol. Manag. 2018, 430, 609–617. [Google Scholar]
  14. Lehman, C.L.; Tilman, D. Biodiversity stability, and productivity in com petitive communities. Am. Nat. 2000, 156, 534–552. [Google Scholar] [CrossRef] [PubMed]
  15. Pedro, M.S.; Ramme, R.W.; Seidl, R. Disentangling the effects of composi tional and structural diversity on forest productivity. J. Veg. Sci. 2017, 28, 649–658. [Google Scholar] [CrossRef]
  16. Pretzsch, H. Canopy space filling and tree crown morphology in mixed-species stands compared with monocultures. For. Ecol. Manag. 2014, 327, 251–264. [Google Scholar] [CrossRef]
  17. Six, J.; Bossuyt, H.; Degryze, S.; Denef, K. A history of research on the link between (micro) aggregates, soil biota, and soil organic matter dynamics. Soil Tillage Res. 2004, 79, 7–31. [Google Scholar] [CrossRef]
  18. Noguez, A.M.; Escalante, A.E.; Forney, L.J.; Mendoza, M.N.; Rosas, I.; Souza, V.; Oliva, F.G. Soil aggregates in a tropical deciduous forest: Effects on C and N dynamics, and microbial communities as determined by t-RFLPs. Biogeochemistry 2008, 89, 209–220. [Google Scholar] [CrossRef]
  19. Tilman, D.; Knops, J.; Wedin, D.; Reich, P.; Ritchie, M.; Siemann, E. The influence of functional diversity and composition on ecosystem processes. Science 1997, 277, 1300–1302. [Google Scholar] [CrossRef]
  20. Tilman, D.; Reich, P.B.; Knops, J.; David, W.; Troy, M.; Lehman, C. Diversity and Productivity in a Long-Term Grassland Experiment. Science 2001, 294, 843–845. [Google Scholar] [CrossRef]
  21. Zhen, W.J. Chinese Tree Records; China Forestry Publishing House: Beijing, China, 1983; pp. 795–797. [Google Scholar]
  22. Li, T.; Min, X. Dormancy characteristics and germination requirements of Phoebe bournei seed. Sci. Hortic. 2020, 260, 108903. [Google Scholar] [CrossRef]
  23. Wu, D.R.; Zhu, Z.D. Preliminiary study on structure and spatial distribution pattern of Phoebe bournei in Luoboyan nature reserve in Fujian province. Sci. Silvae Sin. 2003, 39, 23–30, (In Chinese, with English Abstract). [Google Scholar]
  24. Whittaker, R.H. Evolution and measurement of species diversity. Taxon 1972, 21, 213–251. [Google Scholar] [CrossRef]
  25. Pielou, E.C. Ecological Diversity; John Wiley and Sons: New York, NY, USA, 1975; p. 165. [Google Scholar]
  26. Schnabel, F.; Schwarz, J.A.; Dnescu, A.; Fichtner, A.; Nock, C.A.; Jürgen, B.; Potvin, C. Drivers of productivity and its temporal stability in a tropical tree diversity experiment. Glob. Chang. Biol. 2019, 25, 4257–4272. [Google Scholar] [CrossRef]
  27. Luo, J.; Dai, C.D.; Tian, Y.X.; Peng, P.; Ma, F.F.; Zeng, Z.Q.; Zhou, X.L.; Zhang, M. Establishment of main constructive species biomass model for project forests of carbon sink in Hunan. Hunan For. Sci. Technol. 2016, 43, 12–16+21, (In Chinese, with English Abstract). [Google Scholar]
  28. Lasky, J.R.; Uriarte, M.; Boukili, V.K.; Erickson, D.L.; Kress, W.J.; Chazdon, R.L. The relationship between tree biodiversity and biomass dynamics changes with tropical forest succession. Ecol. Lett. 2014, 17, 1158–1167. [Google Scholar] [CrossRef]
  29. Lei, X.D.; Wang, W.F.; Peng, C.H. Relationships between stand growth and structural diversity in spruce-dominated forests in New Brunswick, Canada. Can. J. For. Res. 2009, 39, 1835–1847. [Google Scholar] [CrossRef]
  30. Hardiman, B.S.; Bohrer, G.; Gough, C.M.; Vogel, C.S.; Curtisi, P.S. The role of canopy structural complexity in wood net primary production of a maturing northern deciduous forest. Ecology 2011, 92, 1818–1827. [Google Scholar] [CrossRef] [PubMed]
  31. Wang, W.F.; Lei, X.D.; Ma, Z.H.; Kneeshaw, D.D.; Peng, C.H. Positive relationship between aboveground carbon stocks and structural diversity in spruce-dominated forest stands in New Brunswick, Canada. For. Sci. 2011, 57, 506–515. [Google Scholar]
  32. Forrester, D.I.; Pretzsch, H. Tamm review: On the strength of evidence when comparing ecosystem functions of mixtures with monocultures. For. Ecol. Manag. 2015, 356, 41–53. [Google Scholar] [CrossRef]
  33. Forrester, D.I.; Bauhus, J. A review of processes behind diver-Sity-productivity relationships in forests. Curr. For. Rep. 2016, 2, 45–61. [Google Scholar] [CrossRef]
  34. Dănescu, A.; Albrecht, A.T.; Bauhus, J. Structural diversity promotes productivity of mixed, uneven-aged forests in southwestern Germany. Oecologia 2016, 182, 319–333. [Google Scholar] [CrossRef]
  35. Fichtner, A.; Härdtle, W.; Bruelheide, H.; Kunz, M.; Li, Y.; Oheimb, G.V. Neighbourhood interactions drive overyielding in mixed-species tree communities. Nat. Commun. 2018, 9, 1144. [Google Scholar] [CrossRef]
  36. Zhu, D.H.; Peng, S.H.; Wang, J.Y.; Hui, D.F. Responses of nutrient resorption to human disturbances in Phoebe bournei forests. Forests 2022, 13, 905. [Google Scholar] [CrossRef]
  37. Wan, X.H.; Huang, Z.Q.; He, Z.M.; Yu, Z.P.; Wang, M.H.; Davis, M.R.; Yang, Y.S. Soil C:N ratio is the major determinant of soil microbial community structure in subtropical coniferous and broadleaf forest plantations. Plant Soil 2015, 387, 103–116. [Google Scholar] [CrossRef]
  38. Shen, F.F.; Wu, J.P.; Fan, H.B.; Liu, W.F.; Guo, X.M.; Duan, H.L.; Hu, L.; Lei, X.M.; Wei, X.H. Soil N/P and C/P ratio regulate the responses of soil microbial community composition and enzyme activities in a long-term nitrogen loaded Chinese fir forest. Plant Soil 2019, 436, 91–107. [Google Scholar] [CrossRef]
  39. Meetei, T.T.; Devi, Y.; Khaidem, J. Effect of various enzymes on mineralization of soil organic matter. Plant Arch. 2020, 20, 3392–3395. [Google Scholar]
  40. Donovan, P.G.; Kathleen, R.B.M.; Madeleine, M.S.; Steven, D.A. The Michaelis-Menten kinetics of soil extracellular enzymes in response to temperature: A cross-latitudinal study. Glob. Chang. Biol. 2012, 18, 1468–1479. [Google Scholar]
  41. Ricklefs, R.E.; Latham, R.; Qian, H. Nordic society oikos global patterns of tree species richness in moist forests: Distinguishing ecological influences and historical contingency. Oikos 1999, 86, 369–373. [Google Scholar] [CrossRef]
  42. Kitayama, K.; Majalap-Lee, N.; Aiba, S. Soil phosphorus fractionation and phosphorus-use efficiencies of tropical rainforests along altitudinal gradients of Mount Kinabalu, Borneo. Oecologia 2000, 123, 342–349. [Google Scholar] [CrossRef]
  43. See, C.R.; Yanai, R.D.; Fisk, M.C.; Vadeboncoeur, M.A.; Quintero, B.A.; Faheyet, T.J. Soil nitrogen affects phosphorus recycling: Foliar resorption and plant-soil feedbacks in a northern hardwood forest. Ecology 2015, 96, 2488–2498. [Google Scholar] [CrossRef] [PubMed]
  44. Barrufol, M.; Schmid, B.; Bruelheide, H.; Chi, X.; Hector, A.; Ma, K.; Michalski, S.; Tang, Z.; Niklaus, P.A. Correction: Biodiversity Promotes Tree Growth during Succession in Subtropical Forest. PLoS ONE 2013, 8, 1. [Google Scholar] [CrossRef] [PubMed]
  45. Bruelheide, H.; Nadrowski, K.; Assmann, T.; Bauhus, J.; Both, S.; Buscot, F.; Chen, X.Y.; Ding, B.Y.; Durka, W.; Erfmeier, A.; et al. Designing forest biodiversity experiments: General considerations illustrated by a new large experiment in subtropical China. Methods Ecol. Evol. 2014, 5, 74–89. [Google Scholar] [CrossRef]
  46. Cavanaugh, K.C.; Gosnell, J.S.; Davis, S.L.; Ahumada, J.; Boundja, P.; Clark, D.B.; Mugerwa, B.; Jansen, P.A.; O’Brien, T.G.; Rovero, F. Carbon storage in tropical forests correlates with taxonomic diver sity and functional dominance on a global scale. Glob. Ecol. Biogeogr. 2014, 23, 563–573. [Google Scholar] [CrossRef]
  47. Kaiser, J. Rift Over Biodiversity Divides Ecologists. Science 2000, 289, 1282–1283. [Google Scholar] [CrossRef] [PubMed]
Figure 1. Overview map of the study area. The study site is located in Nanmuchong Area of Mingyue Mountain Forest Farm, Anfu County, Ji’an City, Jiangxi Province, China. It comprises a well-regenerated natural forest of P. bournei (Phoebe bournei). In the map, I, II, III, and IV represent the plots corresponding to successional stages I, II, III, and IV, respectively.
Forests 14 01783 g001
Figure 2. Proportion changes of biomass and productivity for P. bournei to community during regeneration process (a). Changes in the growth rate of biomass and productivity of P. bournei during regeneration process (b). Different lowercase letters indicate significant differences (p < 0.05) in the ratio of biomass or productivity for P. bournei in the community among different regeneration stages.
Forests 14 01783 g002
Figure 3. The proportion of P. bournei in community biomass and productivity changes during the regeneration process. Different lowercase letters indicate significant differences (p < 0.05) in the ratio of P. bournei to community biomass and productivity between different stages of regeneration.
Forests 14 01783 g003
Figure 4. Alpha diversity index of soil fungi and bacteria at different regeneration stages. ACE (Abundance-based Coverage Estimator) and Chao 1 indices are both metrics used to assess community richness. Different capital letters in the figure indicate significant differences in the diversity index of fungi and bacteria at the same regeneration stage (p < 0.05), while different lowercase letters indicate significant differences in the diversity index at different regeneration stages (p < 0.05).
Forests 14 01783 g004
Figure 5. Pearson correlation between soil environmental factors and community diversity, biomass, and productivity. (P, productivity; B, biomass; the meanings of other abbreviations are the same as in Table 3 and Table 4, and Figure 4; *, p < 0.05; **, p < 0.01).
Forests 14 01783 g005
Table 1. Basic situation of the P. bournei (Phoebe bournei) growth in natural forest from 2018 to 2021.
Regeneration
Stage
YearCommunity Abundance
(Stem/Plot)
P. bournei Abundance
(Stem/Plot)
Proportion
(%)
Maximum DBH of P. bournei (cm) Maximum Age of P. bournei (a)
I2018693449.287.45–10
2019935761.297.8
2020935761.298.0
2021976162.898.2
II20181045451.9212.710–20
20191217259.5014.0
20201227259.0214.5
20211227359.8415.1
III20181076863.5514.820–30
20191258467.2016.2
20201238468.2916.8
20211248568.5516.9
IV201811410491.2332.030–40
201912411491.9433.9
202012511592.0035.3
202112611692.0635.5
Table 2. Growth overview of dominant tree species across different successional stages in 2021.
Regeneration
Stage
No.Tree SpeciesRelative Density/%Important
Value/%
Mean DBH
/cm
Mean Tree
Height/m
I1Phoebe bournei62.8935.34 4.81 ± 1.436.70 ± 1.61
2Castanopsis fargesii12.3728.07 22.95 ± 14.5122.95 ± 14.51
3Cunninghamia lanceolata5.157.40 19.02 ± 4.8718.90 ± 6.10
4Cyclobalanopsis glauca5.155.79 14.38 ± 7.6714.6 ± 7.51
5Liquidambar formosana2.065.62 30.00 ± 3.3924.00 ± 5.65
II1Phoebe bournei59.8434.43 5.35 ± 2.268.30 ± 2.48
2Cyclobalanopsis glauca7.3812.91 20.67 ± 12.1918.55 ± 7.42
3Castanopsis fargesii8.2012.87 20.39 ± 8.4017.40 ± 6.83
4Photinia davidsoniae3.288.34 28.37 ± 12.0826.75 ± 0.95
5Vernicia montana3.287.12 26.75 ± 6.6325.75 ± 3.30
6Cinnamomum camphora1.645.89 37.20 ± 1.1322.50 ± 0.70
III1Phoebe bournei68.5542.45 6.27 ± 2.868.89 ± 3.11
2Schima superba10.4821.35 20.70 ± 14.0420.27 ± 8.70
3Cunninghamia lanceolata11.299.40 10.64 ± 4.5111.37 ± 3.21
4Michelia figo1.617.40 39.15 ± 13.5039.15 ± 13.50
5Castanopsis fargesii0.815.22 48.70 ± 0.0030.00 ± 0.00
IV1Phoebe bournei92.0675.117.95 ± 4.8511.19 ± 4.38
2Photinia davidsoniae3.9710.67 24.04 ± 5.3018.9 ± 2.92
3Cyclobalanopsis glauca0.795.99 44.00 ± 0.0018.00 ± 0.00
4Quercus fabri0.795.79 43.20 ± 0.0013.50 ± 0.00
Table 3. Community diversity characteristics at different regeneration stages. Different lowercase letters in the table indicate significant differences (p < 0.05) in diversity indices among different stages of regeneration.
VariablesRegeneration
Stage I
Regeneration Stage IIRegeneration Stage IIIRegeneration Stage IVp
Species richness (R)1417127-
Shannon–Wiener diversity index (H′)1.55 ± 0.14 ab1.72 ± 0.09 a1.37 ± 0.28 b0.4 ± 0.01 c<0.001
Simpson diversity index (D)0.62 ± 0.05 a0.64 ± 0.03 a0.58 ± 0.11 a0.15 ± 0.01 b<0.001
Pielou evenness index (E)0.59 ± 0.05 a0.61 ± 0.03 a0.55 ± 0.11 a0.15 ± 0.01 b<0.001
Standard deviation of DBH (SDD, cm)9.59 ± 0.23 ab9.80 ± 0.11 a9.29 ± 0.34 b6.94 ± 0.22 c<0.001
Height standard deviation (SDh, m)6.74 ± 0.50 a6.82 ± 0.54 a6.04 ± 0.47 a3.81 ± 0.91 b<0.001
Stand density (StaD, m2/ha)35.16 ± 3.46 b50.02 ± 3.10 a44.72 ± 4.40 a29.94 ± 4.08 b<0.001
Table 4. Characteristics of soil nutrient and enzyme activities at different regeneration stages. Different lowercase letters in the table indicate significant differences (p < 0.05) in soil nutrient and enzyme activity among different stages of regeneration.
IndexRegeneration
Stage I
Regeneration
Stage II
Regeneration
Stage III
Regeneration
Stage IV
p
SMC (%)9.43 ± 1.75 b15.43 ± 3.19 a16.25 ± 4.26 a16.60 ± 3.69 a<0.001
pH4.58 ± 0.13 ab4.60 ± 0.11 a4.59 ± 0.23 ab4.39 ± 0.18 b0.052
C (g·kg−1)31.47 ± 4.63 a21.14 ± 7.39 b12.28 ± 6.42 c21.34 ± 4.55 b<0.001
N (g·kg−1)2.18 ± 0.47 a1.37 ± 0.48 b1.12 ± 0.42 b1.30 ± 0.29 b<0.001
P (g·kg−1)0.26 ± 0.03 d0.47 ± 0.04 c0.58 ± 0.05 b0.72 ± 0.06 a<0.001
C/N11.22 ± 7.3215.46 ± 1.8212.26 ± 10.1916.38 ± 0.890.276
C/P97.83 ± 60.67 a47.05 ± 17.09 ab21.28 ± 10.79 b30.88 ± 5.98 b0.002
N/P8.51 ± 2.29 a3.08 ± 1.13 b1.86 ± 0.75 b1.96 ± 0.41 b<0.001
URH (u·g−1)677.21 ± 83.88 a671.97 ± 113.56 a611.59 ± 117.34 a375.41 ± 88.77 b<0.001
AcP (u·g−1)10387.79 ± 132.28 a9676.03 ± 491.31 a7093.41 ± 271.95 b5186.03 ± 2129.45 c0.001
βG (u·g−1)11.74 ± 3.22 a7.62 ± 2.19 b6.08 ± 1.82 b4.81 ± 1.69 b<0.001
LAP (u·g−1)1.02 ± 0.27 a0.38 ± 0.30 b0.23 ± 0.24 b0.48 ± 0.49 b0.004
NAG (u·g−1)13.79 ± 8.12 a7.31 ± 3.71 ab4.75 ± 2.53 b3.56 ± 1.37 b0.006
Table 5. Characteristic values and contribution rates of species diversity, structural diversity, soil nutrients, soil microbial diversity, and enzyme activity.
ClassComponentEigenvalueContribution Rate
of Variance (%)
Cumulative
Contribution Rate
of Variance (%)
Species
diversity
13.8395.8595.85
20.164.0799.91
30.000.08100.00
Structural
diversity
12.6187.1087.10
20.3611.8798.97
30.031.03100.00
Soil
nutrients
16.1676.9976.99
21.4718.3895.37
30.374.63100.00
Soil enzyme activity13.3684.1084.10
20.6315.8099.90
30.000.10100.00
Microbial diversity14.0681.1881.18
20.9017.9499.12
30.040.88100.00
Table 6. Correlation analysis of species diversity, structural diversity, soil nutrients, soil microbial diversity, and enzyme activities. (*, p < 0.05; **, p < 0.01).
BiomassProductivitySpecies DiversityStructural DiversityMicrobial DiversitySoil NutrientEnzyme Activity
Biomass1
Productivity0.0231
Species diversity0.536 *−0.1231
Structural diversity0.793 **−0.0650.9171
Soil nutrients0.4470.982 *−0.1570.0521
Soil enzyme activity0.121−0.2700.514 *0.506 *−0.2471
Microbial diversity−0.3080.209−0.772−0.8270.167−0.6651
Disclaimer/Publisher’s Note: The statements, opinions and data contained in all publications are solely those of the individual author(s) and contributor(s) and not of MDPI and/or the editor(s). MDPI and/or the editor(s) disclaim responsibility for any injury to people or property resulting from any ideas, methods, instructions or products referred to in the content.

