Article

The Influence of Vibration and Moisture Content on the Compactness of the Substrate in Nursery Container Cells Determined with a Multipenetrometer

1
Department of Forest Utilization, Engineering and Forest Techniques, Faculty of Forestry, University of Agriculture in Krakow, Al. 29 Listopada 46, 31-425 Kraków, Poland
2
Department of Ecology and Silviculture, Faculty of Forestry, University of Agriculture in Krakow, Al. 29 Listopada 46, 31-425 Kraków, Poland
*
Author to whom correspondence should be addressed.
Forests 2023, 14(9), 1750; https://doi.org/10.3390/f14091750
Submission received: 5 August 2023 / Revised: 28 August 2023 / Accepted: 29 August 2023 / Published: 29 August 2023
(This article belongs to the Special Issue Forest Machinery and Mechanization)

Abstract

:
An important problem of container nurseries is ensuring equal and favorable growth conditions for cultivated plants. This can be achieved by ensuring the physical parameters of the substrate used to grow seedlings in individual cells of the container are similar. The nursery container is filled with a specially composed substrate through an automated line. Quickly controlling the parameters related to the quality of substrate filling presents a significant problem, as it requires the ongoing correction of the filling module settings (e.g., extending the vibration time or changing the vibration amplitude). To address this issue, it would be helpful to determine the compactness of the substrate, which can be easily measured using a penetrometer. This paper presents a prototype automated station, known as a multipenetrometer, designed for the simultaneous testing of compactness in 15 selected container cells. The prototype was put to the test at the Nursery Farm in Sukowo, where two types of polystyrene containers (V150—650/312/150 mm; 74 cells; and 0,148 cm3 cell volume and V300—650/312/180 mm; 53 cells; and 0.275 cm3 cell volume) were filled with peat–perlite substrate on the Urbinati Ypsilon automated line. This study investigated the influence of substrate moisture (two levels—70 and 75%) and vibration intensity (two levels—8 and 12 G) of the vibrating table on its compactness within the individual cells of the nursery container. The results indicated that with an increase in substrate moisture and vibration intensity, the compactness of the substrate increased, and the variation in compactness between individual cells decreased. Notably, the V300 containers, with a larger cell volume (265 cm3), experienced a higher level of change compared to the V150 containers (145 cm3). Despite the use of substrate compaction techniques based on the experience of line operators filling containers, the coefficient of variation between the compactness of the substrate in individual cells of the container remained at 30%. Based on the findings, it was confirmed that the optimal parameters for filling V150 and V300 containers with peat–perlite substrate on the Urbinati line, at a filling capacity of approximately 400 containers h−1, are a moisture content of around 75% and a maximum vibration intensity of 12 G.

1. Introduction

The air–water properties of the substrate and its chemical composition are one of the main factors that affect the cultivation of seedlings in nursery containers [1,2]. In Poland, the substrate used for seedling production is prepared from high-sphagnum peat with a small addition of other components like perlite and vermiculite. High peat has high porosity and water capacity, sterility, and low mineral content, which facilitates the determination of fertilization doses [3]. Recommended parameters for the commonly used peat–perlite substrate in Poland include a total porosity ranging from 70% to 93% by volume, water capacity at 73% by volume, air capacity between 20% and 25% by volume, available water at 48% by volume, and wet weight of 864 kg∙m−3 [3,4,5,6]. The quoted ranges are wide, and the inconsistent measurement methodology poses a problem for ongoing control during seedling breeding [7,8,9]. Inadequate physical parameters of the substrate are difficult to correct, with one of the main issues being the air capacity, which can be either too low or too high and is often related to substrate compaction [10]. The degree of compaction and subsidence of the substrate in the container cells are more pronounced when thicker substrate elements are used, when the bulk density of components varies, or when intensive irrigation is employed. Over time, compaction changes occur due to the movement of fine substrate particles from the upper to the lower levels of the cell and the decomposition of organic matter. Root development also contributes to increased substrate density while enhancing its permeability, which facilitates the diffusion of gases [7,10,11,12,13,14].
An important problem of container nurseries is ensuring equal and favorable growth conditions for cultivated plants. This can be achieved by ensuring the physical parameters of the substrate in individual cells of the container are similar [15]. The process of filling a nursery container with a specially composed substrate is typically automated, involving modules equipped with a vibrating table, scraper brushes, and compaction pins. However, quickly controlling the parameters related to substrate filling poses a significant problem, as it necessitates the ongoing correction of the filling unit settings, such as extending the vibration time, changing the vibration amplitude, and adjusting the scraper units, among others. In this regard, specifying the penetration resistance of the substrate, which can be easily measured using a cone penetrometer, could be beneficial. Penetration resistance, also known as compactness, is considered a measure of soil compaction and finds applications in various fields, including civil engineering, agriculture, and forestry, in addition to its use in the military [16,17,18,19,20,21]. Penetration resistance is the ratio of the resistance arising when pressing the penetrometer cone to the area of its base. Compactness is mainly influenced by the granulometric composition, structure, bulk density, and moisture content of the nursery substrate [22,23,24,25].
The high level of penetration resistance, resulting from a high bulk density, is considered a factor that inhibits plant growth. This is mainly due to the low porosity and air content in the substrate, and the problem with the penetration of the substrate by plant roots [26,27,28,29]. Excessive compactness also affects the accumulation of elements [30], increases the appearance of pathogens [31], and disrupts the functioning of soil microorganisms [32]. Research on this subject, focused on forest species, has been carried out mainly for forest soils [33,34], as well as for substrates used in nursery containers [35,36].
The advantage of using penetration resistance is that it can be measured quickly and in a relatively simple way. This provides information about the current condition of the nursery substrate and enables tracking changes that may occur under the influence of external factors [37,38]. Penetration resistance is typically measured using various designs of penetrometers, with static cone penetrometers being the most commonly used. Another solution, especially often used in geoengineering, is dynamic penetrometers [23,39,40,41]. Multipenetrometers are also available, which allow for the simultaneous measurement of compactness at multiple places using several penetrometers [42].
In this work, a new prototype measuring station called the “Multipenetrometer for containers” was utilized to measure penetration resistance [43]. The device allows for quick control of the substrate’s compactness in a nursery container, simultaneously performed in several cells. This control accompanies the process of filling containers on automated lines for filling the substrate.
The aim of the research was to determine the value and variability of substrate compactness in container cells after they were filled on an automated substrate-filling line. The measurements were assumed to be carried out while filling the containers with the substrate at various moisture levels and by changing the intensity of vibration on the vibrating table integrated into the line. The research hypotheses were as follows: (a) An increase in substrate moisture and vibration intensity affects the density of the substrate in the container cells. (b) The increase in moisture and vibration intensity affects the variability of substrate compaction among different cells of the containers.

2. Materials and Methods

The research was carried out at the Nursery Farm in Suków Papiernia (coordinates 50.79613, 20.71011), within the Daleszyce Forest District. The experiment involved the use of an automatic Urbinati S.r.l Ypsilon line (Figure 1) to fill polystyrene containers. In the experiment, two types of polystyrene containers (new and not used before), namely Marbet V150 and V300 (Table 1, Figure 2), along with peat–perlite substrate (95/5 by vol.) from Nursery Farms in Nędza, were used. The peat–perlite substrate had the following granulometric composition: fraction 10.1/20 mm—2.5%, 4.1/10 mm—12.5%, 2.1/4.0 mm—12.5%, <2.0 mm—72.5%. Additionally, it had a maximum degree of decomposition of 15% and an organic matter content exceeding 85%.
The containers were filled while changing the intensity of vibration on the vibrating table, with the scale of the table regulator ranging from 1 to 6, where the highest value represented the lowest level of vibration. The level of vibrations was measured using the Voltcraft DL-131G device [43], ranging linearly from 12.0 G for the value 1 on the regulator scale to 8 G for the value 6 on the regulator scale. Intermediate vibration level 3 (designation: VibAvg = 10 G) and maximum level 1 (designation: VibMax = 12 G) were selected for the tests. However, the lowest vibration level 6 (VibMin = 8 G) was rejected from further measurements due to the underfilling of the container cells, which eliminates this variant from being used for backfilling the containers with the substrate used in the tests. During the tests, the efficiency of the line was set at 400 containers h−1, which is the normal speed used when filling containers in a nursery. This parameter was kept constant as it does not affect the residence time of the containers on the vibrating table and was not considered a research factor. The containers were filled at two moisture levels, specifically 70% and 75%, which are within the standard range used during their filling. The research utilized a prototype measuring station known as the “Multipenetrometer for containers” (Figure 3), which has been submitted for patent protection (Patent Office of the Republic of Poland, number P.441918) [44]. This automated measurement device allows for the simultaneous measurement of compactness in multiple cells of the container. The measurement can be performed in several evenly distributed cells on the container’s surface by inserting penetrometer cones to the desired depth. The stand consists of a frame (1) with a movable base (2) in the form of a flat steel plate and a fixed upper steel plate (3) on which strain gauges (4) are attached at various positions. These sensors are affected by insertion rods (5) that end with indenters (penetrometers) in the form of cones (6). A nursery container (7) is placed on the base plate (2). The base plate is mounted on linear bearings (8) running on guide shafts (9), and its movement is driven by a drive shaft (10). The upward movement of the movable plates (1) and the container (7) causes the strain gauges (4) on the upper plate (3) to be acted upon by the insertion rods (5) ending with cones (6). The rotation of the drive shafts (5) is caused by chain gears (11), which are driven by an electric motor (12) with a reduction gear (13). The rotational speed of the electric motor (12), controlled by an inverter, regulates the speed of inserting the cones (6) into the cells. The plate’s up and down movement is limited by length limit sensors (14) connected to the system that controls the direction and operation of the drive motor (12). Strain gauges (4) can be mounted at various prearranged places on the upper plate (3), enabling measurements for containers of various types and dimensions. The force of pressing the cones (6) into the substrate in the container cells (7) is measured by strain gauges (4) after amplification and then transferred to a multichannel recorder and computer for data processing and archiving. The experiment involved simultaneous measurements in 15 cells of each of the V150 and V300 containers (Table 1).
The research began with determining the desired moisture content of the peat–perlite substrate, which was supplied in 200 l bags by the manufacturer. Each bag was weighed before pouring the substrate into the mixer. After filling the mixer, the substrate was mixed thoroughly to ensure uniform initial moisture. Nine samples of the substrate (im) were taken from the mixer, and their moisture levels were measured using three WPS 110 ± 0.1 g moisture analyzers, working simultaneously. The initial moisture of the substrate was found to be at the level of im = 58.86% ± 0.86. Once the im was determined, the amount of water required to achieve the desired humidity level (m1 = 70%) was calculated. Water was added to the mixer at a predetermined time using spray nozzles whose output in L s−1 had been previously determined. The substrate was mixed for 30 min, and at 15 and 30-min intervals, three samples were taken for moisture control using weighing dryers (WPS). After obtaining the target moisture level and setting the parameters of the vibrating unit to the average vibration level (VibAvr), the containers were filled. Initially, 10 containers were filled, and after stabilizing the line’s operating conditions, four more V150 containers (C1_150, C2_150, C3_150, and C4_150) were taken for measurements. Subsequently, the line was switched to filling V300 containers, and the same process was repeated with another 10 containers and four additional V300 containers (C1_300, C2_300, C3_300, and C4_300) taken for measurements. Next, the vibration level on the vibrating table was changed to the maximum level (VibMax), and the containers were filled again, similar to the VibAvr variant, with an additional collection of four V300 containers, followed by four V150 containers. The remaining substrate in the mixer was then moistened to achieve a moisture level of m2 = 75%, using the same procedure as before. The amount of water required was calculated, taking into account the weight of the substrate taken for measurements in the containers for the first moisture level (all filled containers were weighed). The moisture level m2 = 75% is considered optimal and is usually used when filling containers with peat–perlite substrate. From each set of four collected containers (C1_150, C1_300), one container was chosen to determine the bulk density of the substrate in selected container cells. A collector with six holes (for V150 containers) or five holes (for V300 containers), evenly distributed over the surface of the container, was used. Volumetric cylinders with a volume of 500 mL were inserted into the holes to collect the poured substrate (see Figure 4a). The container with the collector was then rotated by 180°, causing the contents of the selected cells to be poured into the cylinders (see Figure 4b). The cylinders containing substrate from a single cell were weighed to determine the mass of the wet substrate ms [g]. Using the volume of a single cell V [cm3] and the mass (ms) of the substrate, the bulk density gs [g∙cm−3] of the substrate in selected cells of the V150 and V300 containers was calculated.
In the remaining three containers (C2_150, C3_150, C4_150, and C2_300, C3_300, C4_300), the penetration resistance was measured using a multipenetrometer (Figure 3b). The multipenetrometer was equipped with penetrometer cones featuring an opening angle of 30°, a cone base diameter of 20.5 mm (area of the base of the cone—3.3 cm2), and a cell penetration speed of 25.4 mm·s−1. The ratio of the area of the inlet opening of the cell to the area of the base of the cone was 6.7 for V300 and 5.0 for V150. A total of 360 compactness measurements were taken (2 types of containers × 2 levels of humidity × 2 levels of vibration × 3 replicates × 15 cells in containers). Additionally, 44 measurements of bulk density were conducted (2 levels of humidity × 2 levels of vibration × 5 cells in V300 containers and 2 levels of humidity × 2 vibration levels × 6 cells in V120 containers). The data obtained from the measurements of compactness and bulk density were subjected to univariate and multifactor analysis of variance to assess differences in maximum penetration resistance values based on the type of container, starting moisture of the substrate, vibration intensity, and container replication (only for compactness). Furthermore, Pearson’s linear correlation (r) was analyzed to examine the relationships between the compactness and bulk density of the substrate, as well as penetration resistance and bulk density with the initial moisture content of the substrate and the acceleration of the vibrating table. The strength of the relationship between the two features was assessed using the scale proposed by Guilford [45] for significant values of correlation coefficients. All statistical analyses were performed using Statistica 12 [46].

3. Results

The analysis of variance (Table 2) showed significant differences in both the maximum penetration resistance and bulk density of the substrate in the container cells due to the substrate moisture during filling and the intensity of vibration. However, there were no differences observed due to the type of container and repetition in the case of the measurement of penetration resistance, where the measurement was performed in three containers.
The maximum average penetration resistance values obtained in 45 cells of V150 containers (C2_150–C4_150 containers) reached 28.1 kPa, and for V300 containers (C2_300–C4_300 containers) reached 27.2 kPa. These values were observed for the moisture variant of 75% (w75%) and the maximum intensity of vibrations (VibMax) (Table 3 and Table 4). As for bulk density, the maximum values for the V150 (C1_150) container were 0.342 g∙cm3, and for the V300 (C1_300) container, it was 0.299 g∙cm3, also occurring at the higher moisture level and the maximum level of vibrations (at 75%; VibMax). An interesting observation is that with an increase in moisture and vibration level, there was a noticeable decrease in the variability of compactness and bulk density in the cells of the containers. For the V150 container, the variability decreased from a maximum value of 67.4% (m1—70%; VibAvg) to 39.9% (m2—75%; VibMax), and for the V300 container, it decreased from 53% (m1—70%; VibAvg) to 33.1% (m2—75%; VibMax). Similarly, in the case of bulk density, the variability decreased for V150 from 9.53% (m1—70%; VibAvr) to 3.46% (m2—75%; VibMax), and for V300, it decreased from 10.9% to 3.14%, respectively. Another interesting finding is the noticeably greater variation in compactness and density at higher moisture levels and lower vibration intensity compared to lower moisture levels. This observation may be attributed to the greater weight of the substrate, which is only compacted in the cell at higher vibration levels.
When analyzing the interaction of vibration and moisture, it can be concluded that the V150 container exhibited a greater response to these factors in terms of both penetration resistance and bulk density. The increments in both penetration resistance and bulk density were higher at higher moisture levels and increased vibration (Figure 5 and Figure 6).
Regarding the relationship between compactness and bulk density of the peat substrate, it was observed that a higher average correlation occurred for V300 containers (r = 0.48). These containers have a larger cell volume compared to the V150 containers, where the correlation was weaker (r = 0.25) (Table 5).
There were no significant correlations between compactness and moisture, while high correlations occurred between bulk density and moisture, indicating a direct relationship between bulk density and the mass of the substrate and the water content in the substrate (Table 6). For V300 containers, this association was higher (r = 0.677) compared to V150 containers (r = 0.529). On the other hand, when analyzing the correlation of compactness with vibration intensity and bulk density with vibration intensity, high correlations were found regardless of the container type. The V300 container showed the lowest high correlation with vibration for compactness (r = 0.57), while the V150 container exhibited the highest high correlation with vibration for bulk density (r = 0.602). There was no correlation between the compactness of the substrate and the ratio of the inlet surface area to the cell and the surface area of the cone base (r = 0.0796; p = 0.132).
The measurement of compactness in the container carried out with a multipenetrometer allowed for visualizing the changes in compaction as a function of depth (Figure 7). Notably, there were clear differences in the course of compactness as a function of depth, depending on the type of container (V150, V300), vibration level (VibAvr, VibMax), and substrate humidity (m1—70%, m2—75%).

4. Discussion

The proposed prototype station was used to measure the maximum compactness of the substrate in the container cells, and this measurement was then correlated with the bulk density determined from substrate samples taken from the container cells. The correlation value depended on the volume of the container cell (r = 0.250 for V150 and r = 0.480 for V300). However, there was a poor correlation in the case of the V150 container, possibly due to the cone being too large in diameter compared to the cell size of the container. Despite the fact that there was no correlation between compactness and the surface area of the cone base and the surface area of the inlet to the cell ratio (r = 0.0796), to improve accuracy, it is suggested to use a smaller cone that is proportional to the cell size in this case. Nevertheless, statistically significant correlations were found in both cases, which allows us to conclude the compaction of the substrate in the container cells based on the compactness measured with the proposed device. The significance of this method is particularly important in the challenges of quickly measuring substrate density in container cells. The conventional approach involves substrate sampling, which proves to be difficult and time-consuming, especially within nursery containers. When attempting to analyze substrate density during the automated filling process on a line that operates at an efficiency of 350–400 containers/h, this standard method fails to provide timely data for correcting automated filling line parameters. As a result, the current practice involves controlling substrate compactness in cells through an organoleptic approach, where a person presses a finger into a selected cell. However, this method is highly imprecise and relies on the individual’s experience in performing the measurement. In contrast, the proposed technical solution of using a station to measure compactness in multiple container cells simultaneously offers a quick and efficient measurement process. Each measurement cycle takes less than a minute, enabling the ability to randomly control compaction in selected containers during the filling process. It was shown that increasing moisture and vibration intensity leads to higher values of penetration resistance and bulk density, with greater increases in the V300 containers (cell volume of 275 cm3) compared to the V150 containers (cell volume of 145 cm3). Additionally, higher substrate moisture levels, combined with vibration, led to increased compactness and bulk density for both container types. The course of changes in compactness as a function of depth reflects the increase in compaction value with increasing moisture of substrate and vibration intensity; it is also consistent with the course of the soil material compaction curves. The multipenetrometer not only indicates the value of compactness in a single cell but, by using multiple penetrometers simultaneously, also helps determine the variability of compactness within the container. This information holds significant importance as a high value of variability indicates a lack of substrate homogeneity. Such variability can be attributed to several factors, including inadequately performed mixing and wetting processes, such as insufficient mixing time. Additionally, it may stem from issues with the substrate itself (e.g., high variability of granulometric compositions with the presence of particles with large dimensions, and with inaccurate fragmentation of peat fibers). Furthermore, the multipenetrometer allows the evaluation of the work of employees handling the process of filling containers. Despite the optimal parameters of filling the containers with the substrate, according to the experience of the operators, the coefficient of variation of the maximum compactness in the container cells reached 39.9% (V150) and 33.1% (V300) (Table 2 and Table 3). At lower moisture and vibration intensity than optimal, the variability of compactness and bulk density within the containers increased significantly to 67.4% (V150) and 53.0% (V300). Understanding the value and variability of compaction is important because both excessively high and low compactness levels, as well as significant variability, can affect production effects, leading to variations in seedling characteristics. Notably, parameters like shoot height, diameter at the root collar, root dimensional structure, and the degree of root overgrowth of the lump can be affected [35,36]. Different plant species have different preferences concerning substrate density. For example, research on the container production of pine Pinus sylvestris L., the predominant species in Poland covering 58.6% of the forest area [47], has demonstrated its high sensitivity to substrate density. The level of density significantly influences its biometric features, including height, root collar thickness, dry weight of needles, shoots, and roots, as well as the average length of skeletal roots (diameter >2 mm) and small roots [35]. The findings indicate that both excessively high and low densities restrict the growth of pine seedlings. On the other hand, for beech (Fagus sylvatica L.), another important species in Poland, occupying 8% of the forest area [47], it has been observed that high substrate density in containers negatively affects the growth of seedlings of this species [36]. Both pine and beech seedlings are affected by substrate compaction levels, particularly concerning the growth of very fine roots (diameter below 0.05 mm) responsible for element uptake. In both species, changes in substrate density within nursery containers also influence the content of macroelements in the seedlings, with high density leading to a reduced uptake of elements, especially in the assimilation apparatus [48]. An important issue related to container nursery and substrate compaction is the process of seed germination. Low levels and high variability of density result in uneven seed germination. This is because seeds placed in cells with intense moistening settle at different depths due to gravity, leading to varying water access and water retention by the substrate [15,49]. A loose substrate quickly releases water, resulting in low or short-lived moisture near the seed. Conversely, excessive water in a densely compacted cell can hinder outflow and create a conducive environment for pathogenic factors, particularly increased fungal growth [31]. However, this is not always the case, as studies on black spruce (Picea mariana Mill.) and banks pine (Pinus banksiana Lamb.) have not shown a significant effect of different soil compaction levels on seed germination [50]. Moreover, the germination analysis of linseed (Linum usitatissimum L.) revealed an optimal level of bulk density for this crop plant species [51]. Excessive bulk density and penetration resistance can also cause hindered root growth of seedlings due to increased substrate penetration resistance. This effect has been confirmed for pine and beech grown in containers [35,36], as well as for other species growing on soil substrates [27,28,29]. The proposed technical solution provided the opportunity to present, for the first time, the course of substrate penetration resistance within the container cell space. The multipenetrometer not only enables the continuous monitoring of the compaction parameter in individual cells of containers used in nursery production, but also proves to be valuable for optimizing or designing new container solutions or testing new substrates for container nurseries. Moreover, the instrument’s versatility allows for the installation of indenters in various places and the use of indenters with different shapes, as previously demonstrated with peat material [52]. Peat is known to be a challenging material to diagnose in terms of compaction. The results of the experiment confirmed that filling containers with peat–perlite substrate below 70% moisture and at a low level of vibration (VibMin) is not recommended. Under such conditions, the container cells are not adequately filled, and the substrate spills during transport on the elements of the Urbinati Ypsilon automated line.

5. Patents

P.441918 Stanowisko pomiarowe do badania zwięzłości podłoża w kontenerach, zwłaszcza szkółkarskich Zgłoszenie patentowe. Measuring stand for testing the compactness of the substrate in containers, especially nursery containers. Patent pending P.441918 on 2 August 2022. Creators: Kormanek, M.; Małek, S.; Mateusiak, Ł.; Banach, J. Polish Patent Office, Warsaw, Poland 2022. p. 12.

6. Conclusions

Based on the tests and analysis of the measurement results, the following key findings were observed:
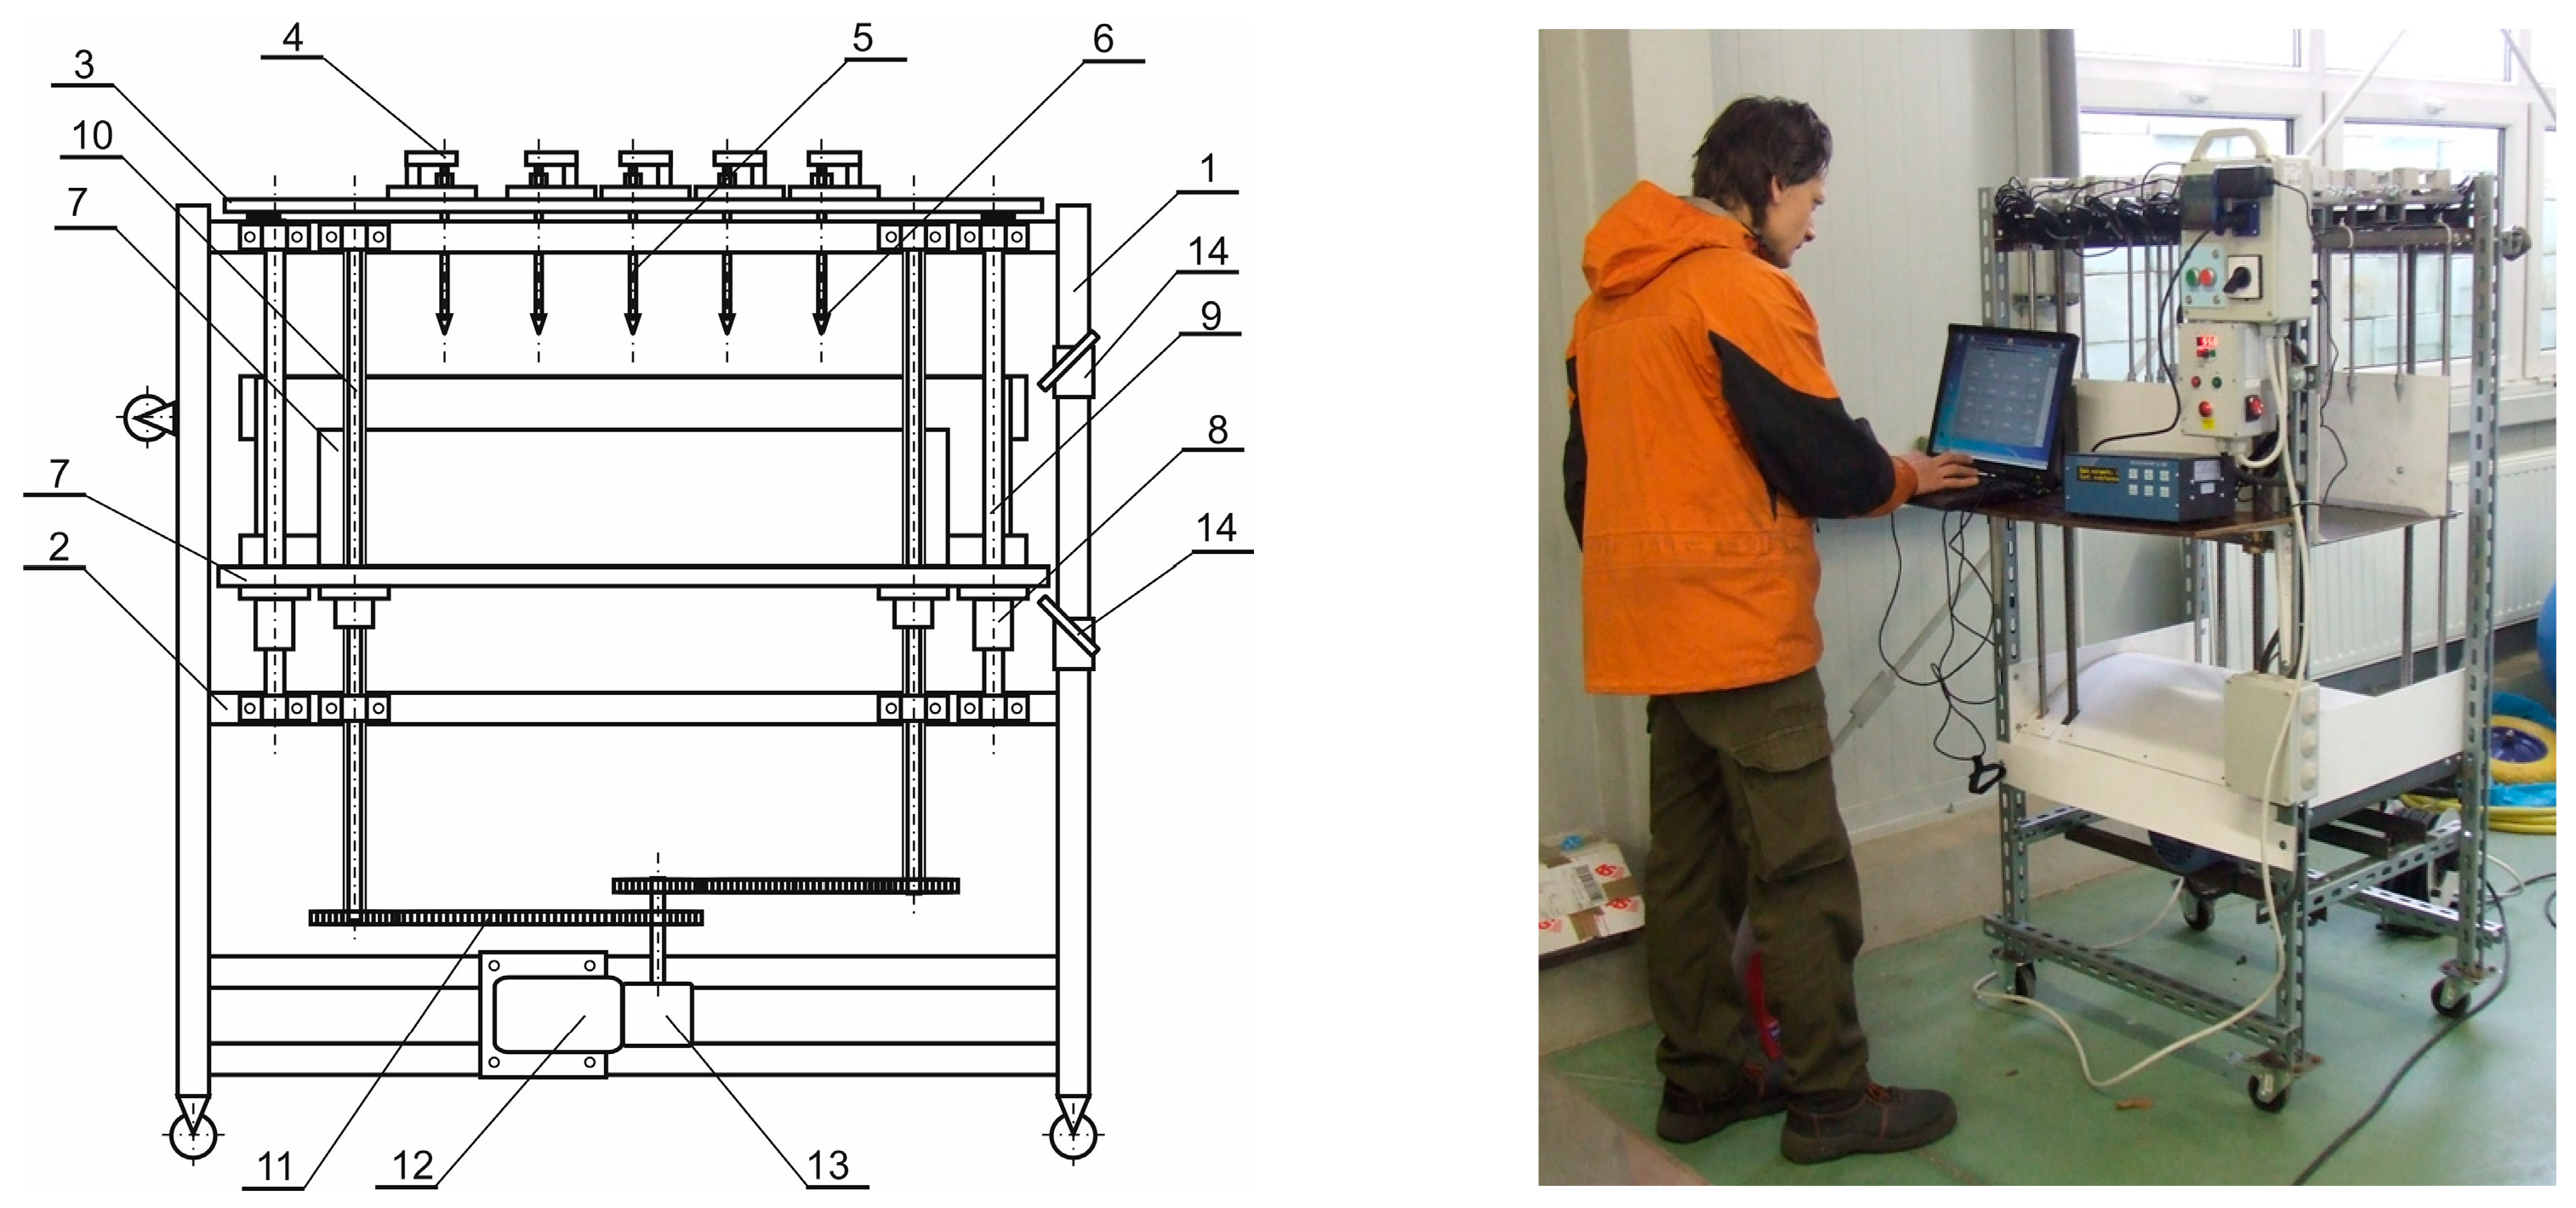
  • The prototype multipenetrometer measuring station allowed for the rapid measurement of substrate compactness in multiple cells of the container. This capability enables the quick quality control of container filling by the automatic line and assessment of the operators’ performance.
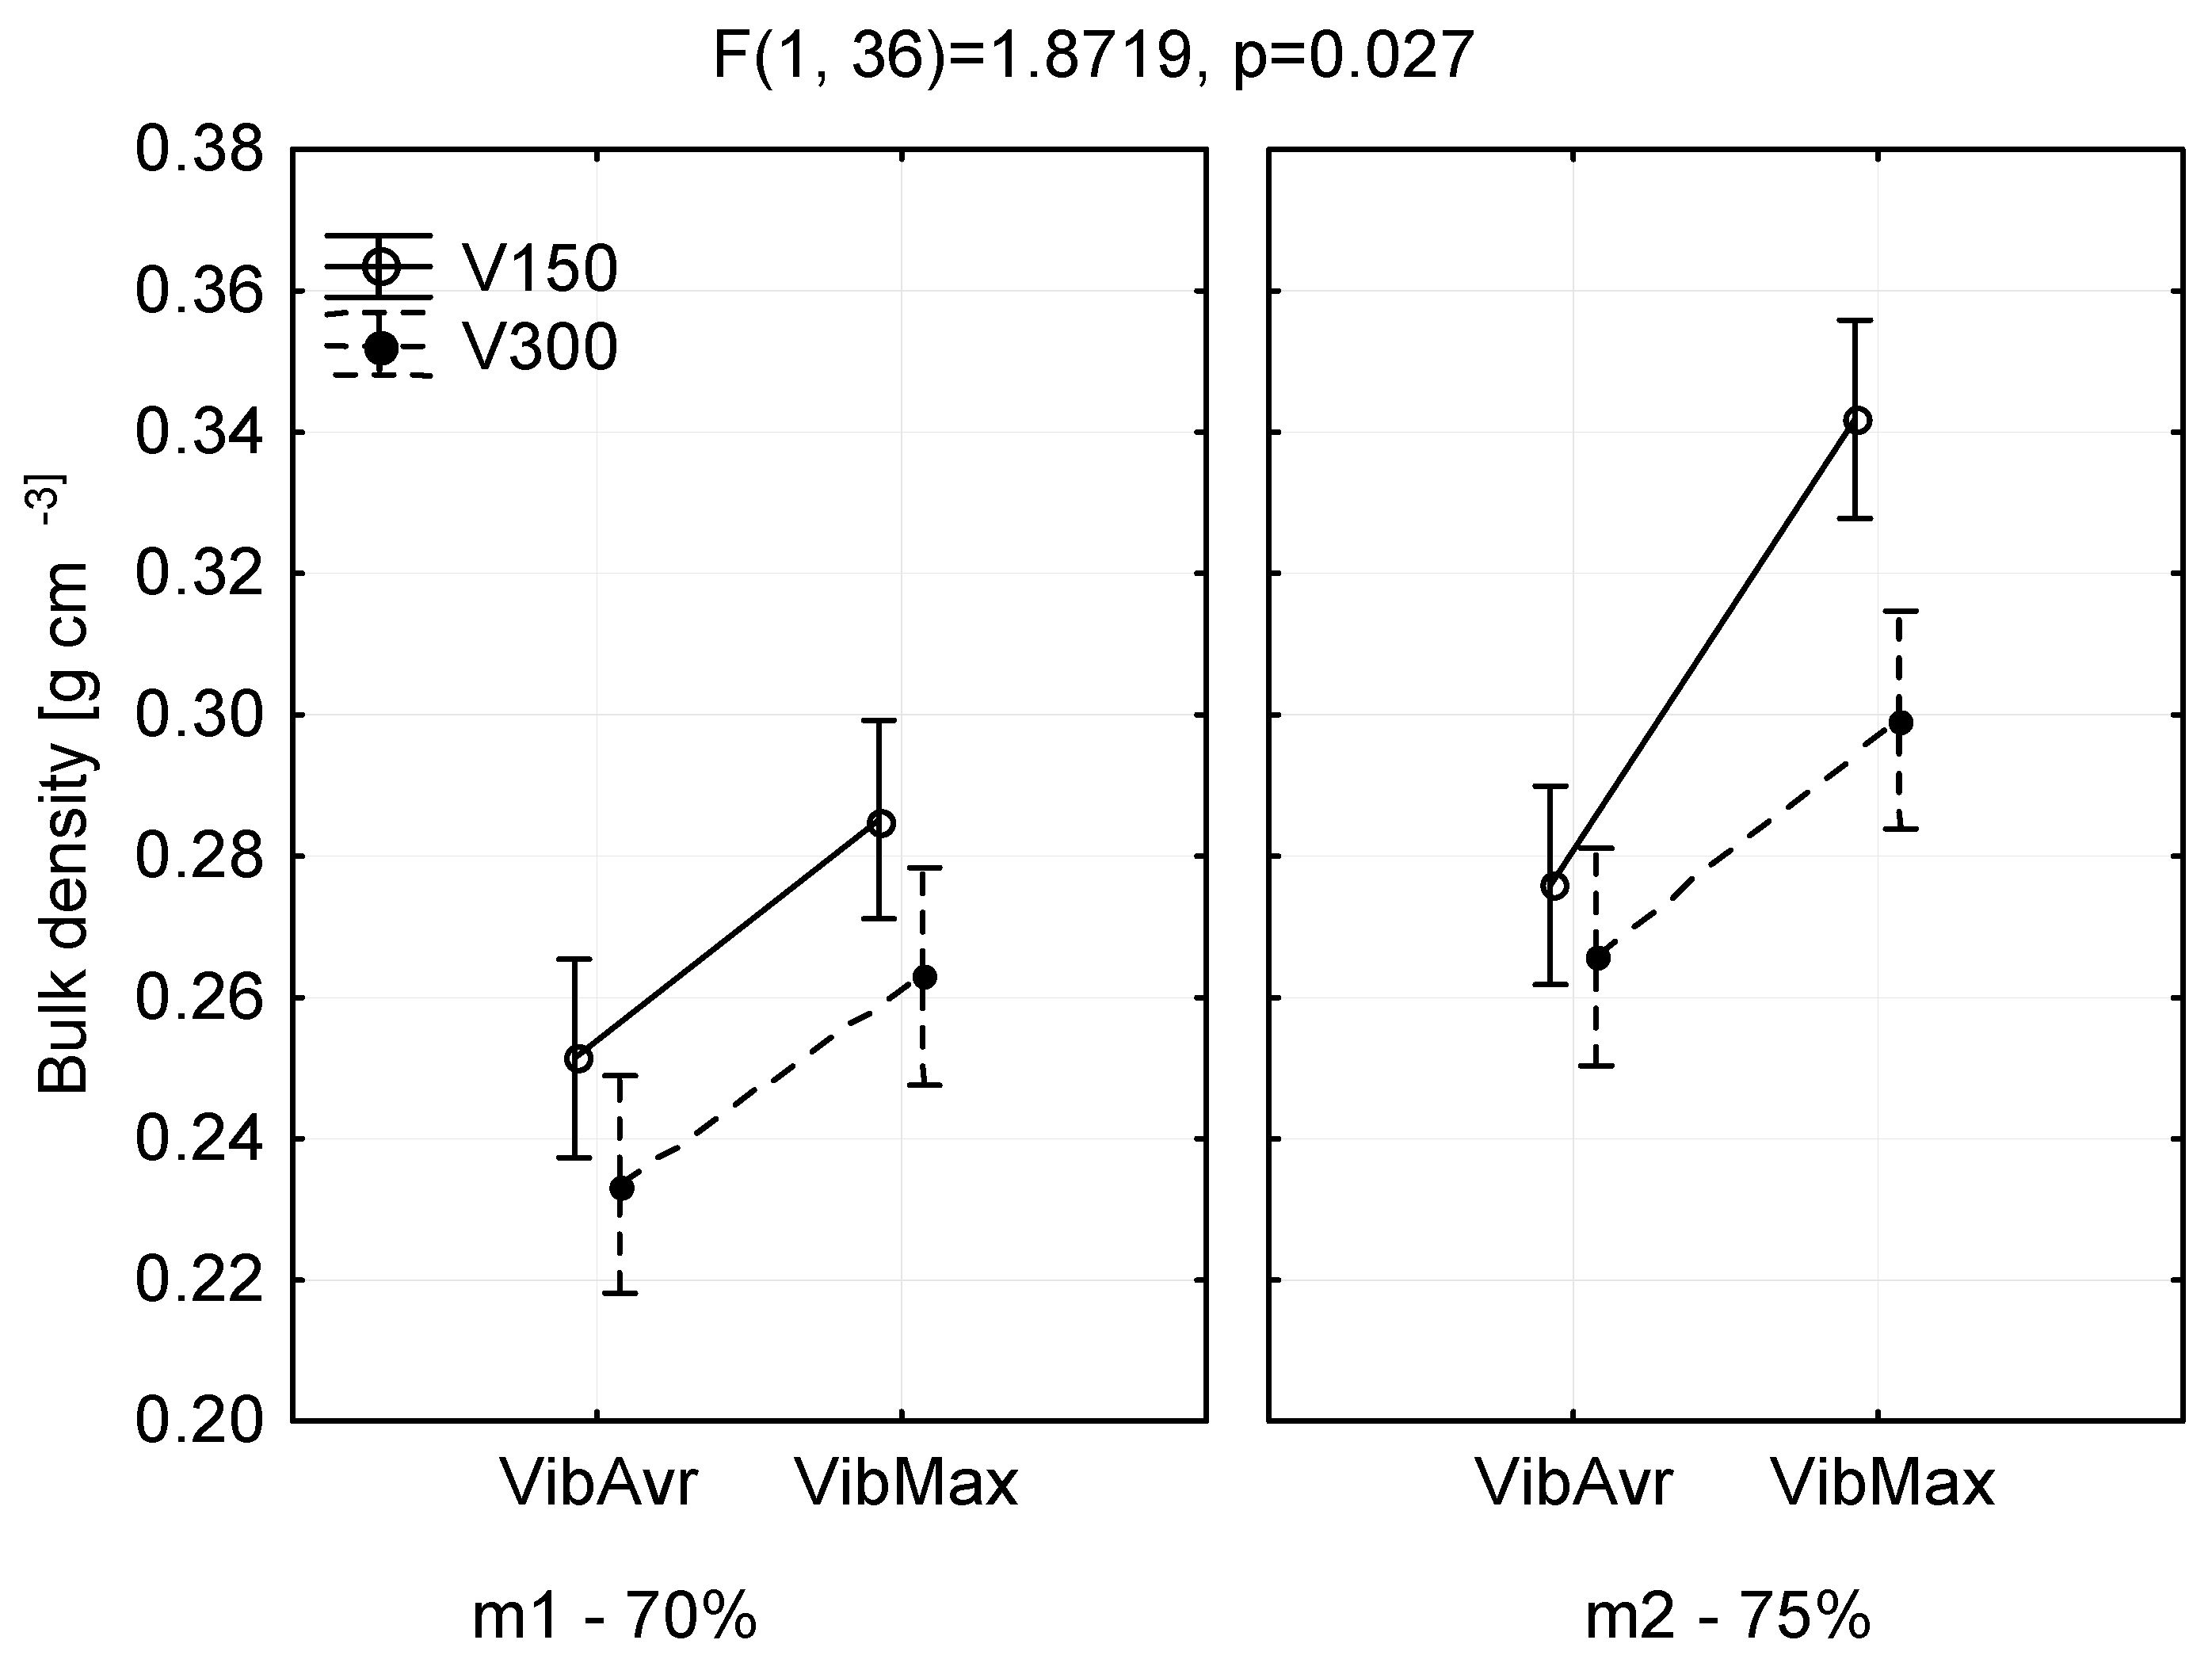
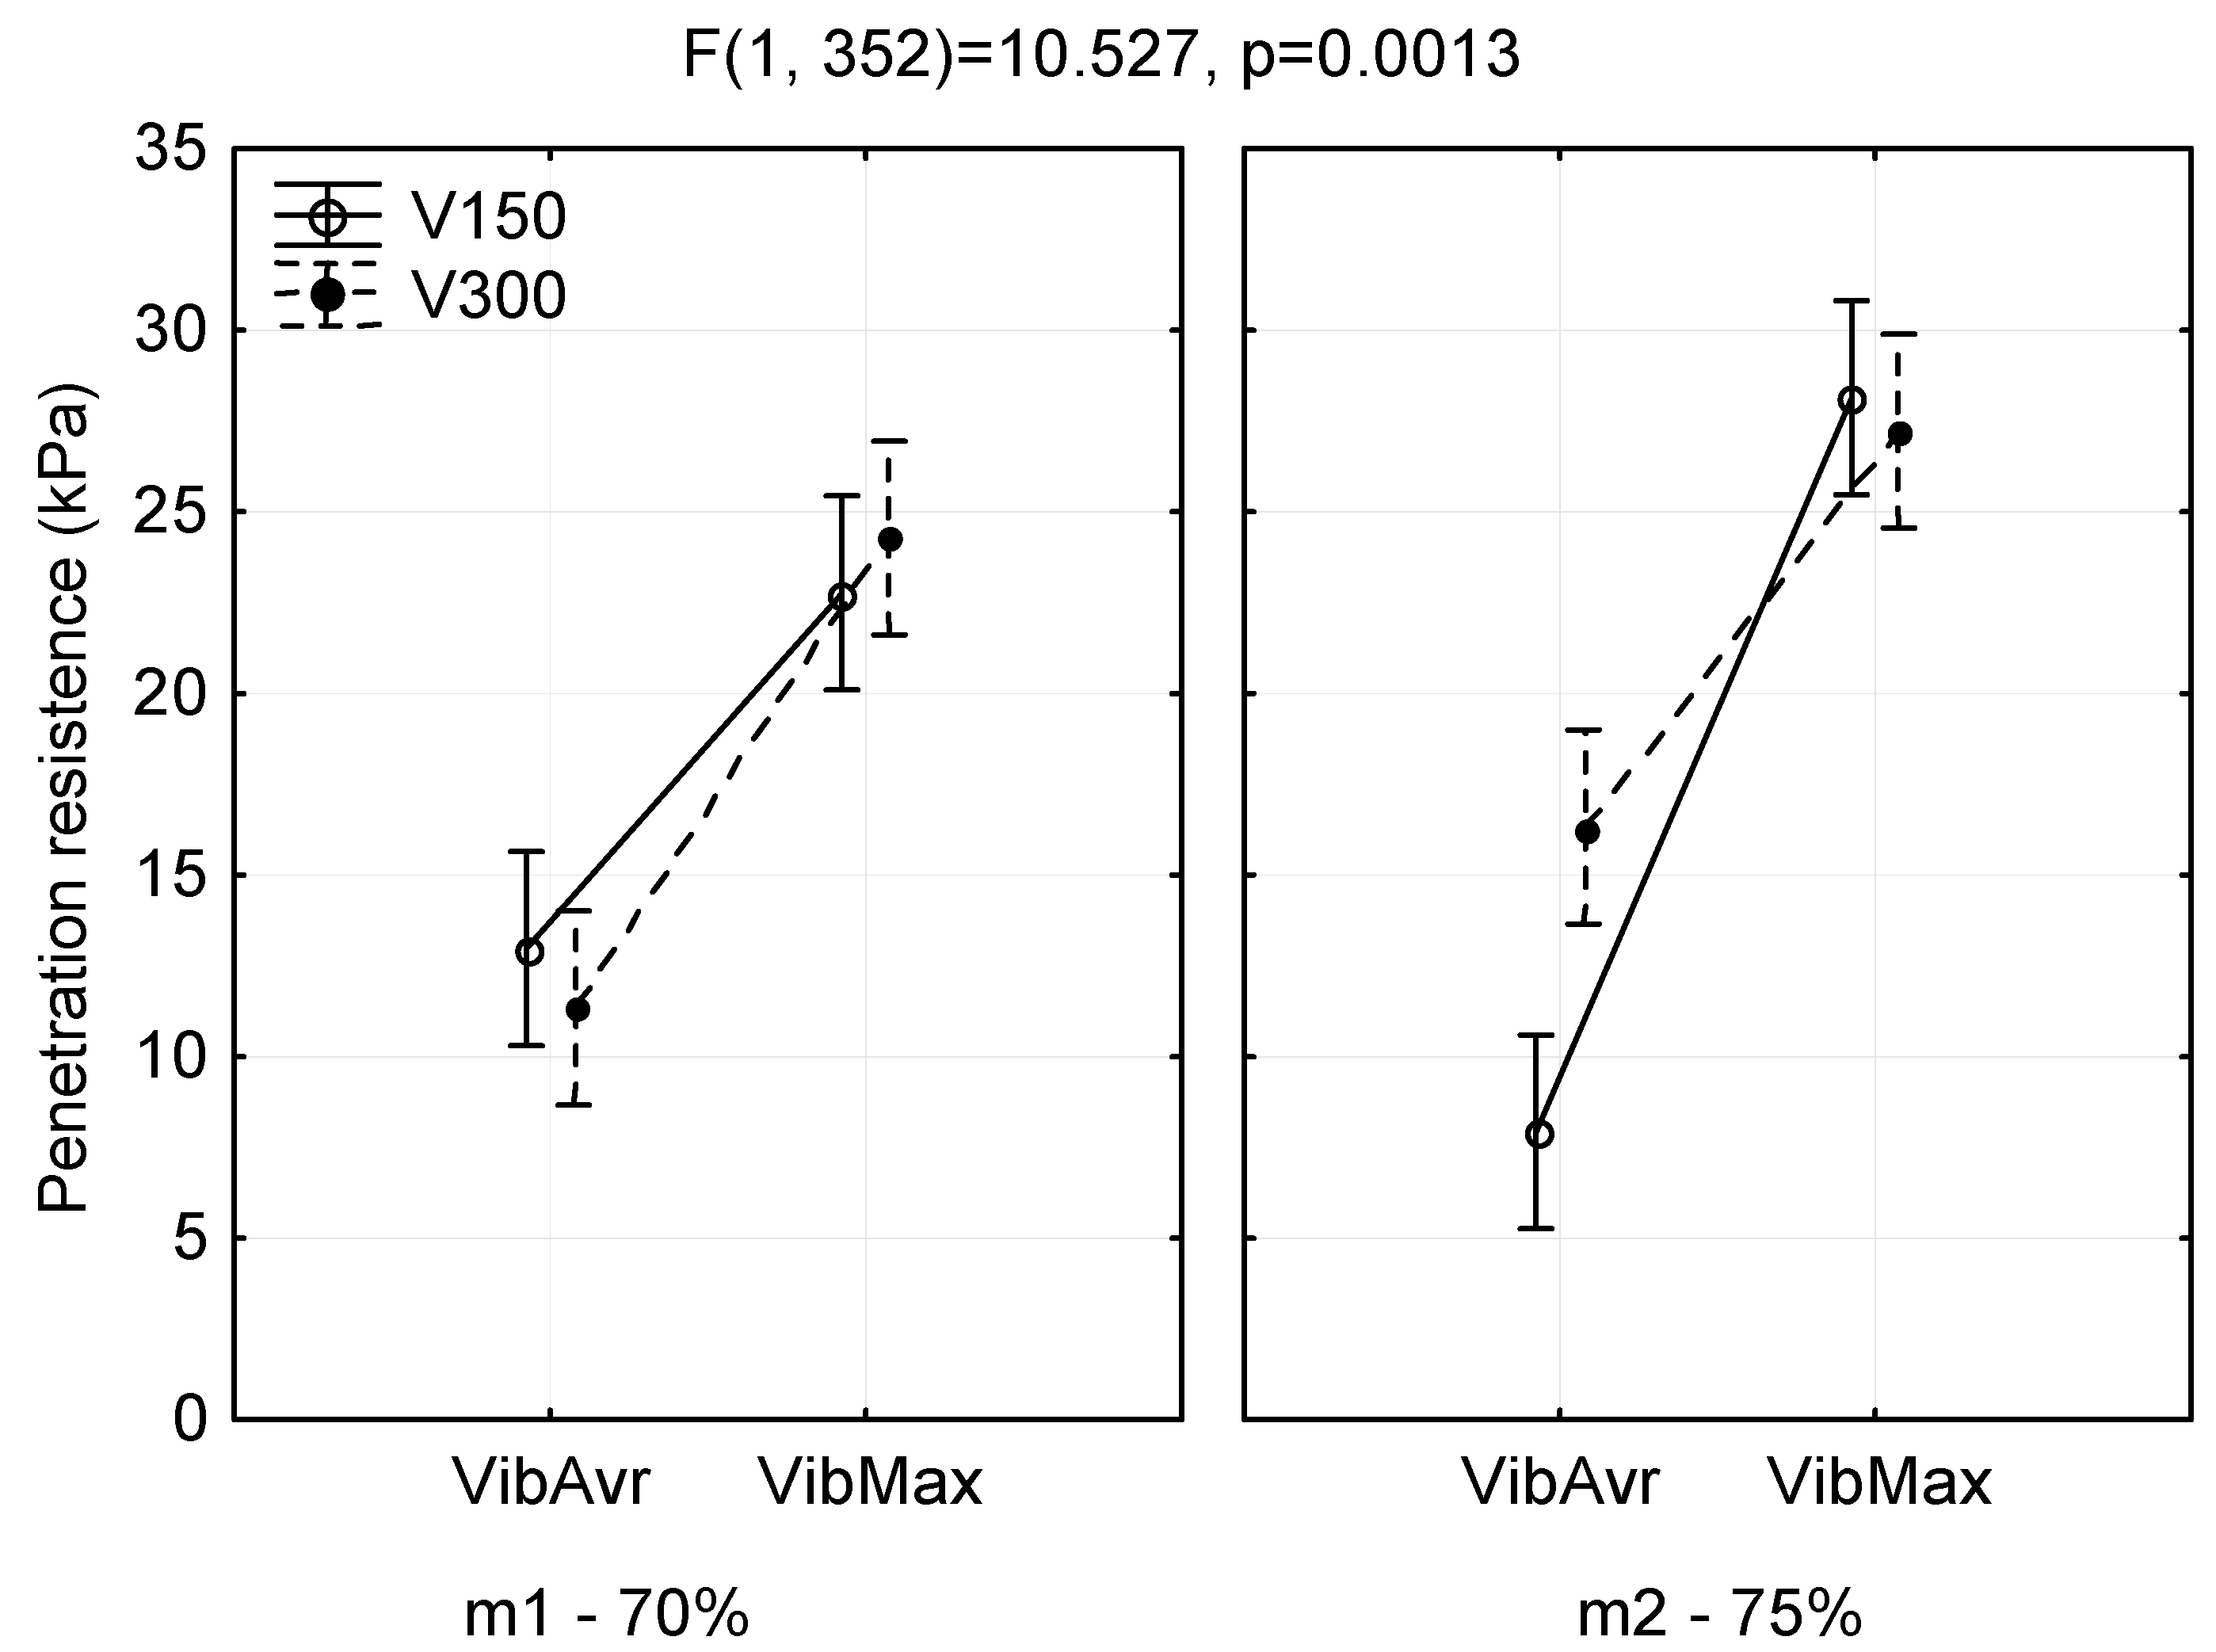
  • Increasing substrate moisture and vibration intensity had a significant impact on substrate compaction and its variability within the container cells. This effect was indicated by an increase in both compactness and bulk density, along with a decrease in the variability of these parameters.
  • With higher moisture levels and vibration intensity, there was a notable increase in penetration resistance and bulk density, and the variability of these parameters decreased more significantly in the cells of V300 containers (with a larger cell volume of 265 cm3) compared to V150 containers (with a cell volume of 145 cm3).
  • The study confirmed the optimal parameters for filling V150 and V300 containers using a peat–perlite substrate on the Urbinati Ypsilon automated line, which operates at a capacity of approximately 400 containers h−1. The ideal settings are a moisture level of approximately 75% and a vibration set to the maximum level of G.

Author Contributions

M.K.: conceptualization, methodology, software, validation, formal analysis, investigation, resources, data curation, writing—original draft, writing—review and editing, visualization. S.M.: conceptualization, writing—review and editing, funding acquisition, supervision, project administration. J.B.: conceptualization, methodology, validation, investigation, writing—review and editing. All authors have read and agreed to the published version of the manuscript.

Funding

This research was funded by NCBiR project 1/4.1.4/2020_Application projects. Development of innovative technology to produce substrate and fertilizers from domestic raw materials for the production of forest tree seedlings. The project is cofinanced by the European Union from the funds of the European Regional Development Fund under the Smart Growth Operational Program.

Data Availability Statement

Data are available upon request.

Acknowledgments

Special thanks to the Staff of Daleszyce Forest District and thanks to the Managers of the Nursery Farm in Suków Papiernia.

Conflicts of Interest

The authors declare no conflict of interest.

References

  1. Rolbiecki, S.; Musiał, M.; Fórmaniak, A.; Ryterska, H. Próba porównania potrzeb nawadniania szkółek leśnych w latach 2000–2009 w okolicach Bydgoszczy, Chojnic i Tomnia. An attempt to compare the needs of forest nursery irrigation in the years 2000–2009 in the vicinity of Bydgoszcz, Chojnice and Toruń. Infrastruct. Ecol. Rural Areas 2010, 14, 23–30. (In Polish) [Google Scholar]
  2. Leciejewski, P. Nawodnienia w Szkółkach Leśnych. Irrigation of Forest Nurseries. Biblioteczka Leśniczego; SITLiD Publishing House: Warsaw, Poland, 2011; Volume 330, pp. 1–14. (In Polish) [Google Scholar]
  3. Szabla, K.; Pabian, R. Szkółkarstwo Kontenerowe: Nowe Technologie i Techniki w Szkółkarstwie Leśnym. Container Nursery. New Technologies and Techniques in Forestry Nursery; State Forests Information Centre: Warsaw, Poland, 2003; p. 212. ISBN 83–88478–43–5. (In Polish) [Google Scholar]
  4. Cabrera, P.I.; Johnson, J.R. Fundamentals of container media management: Part 1. In Greenhouse and Nursery Crops Fact Sheets & Bulletins; Rutgers Fact sheet FS 812; The State University of New Jersey: New Brunswick, NJ, USA, 2014; p. 3. [Google Scholar]
  5. De Boodt, M.; Verdonck, O. The Physical Properties of the Substrates in Horticulture. Acta Hortic. 1972, 26, 37–44. [Google Scholar] [CrossRef]
  6. Fernandes, C.; Cora, J.E. Bulk density and relationship air/water of horticulture substrate. Sci. Agric. 2004, 61, 446–450. [Google Scholar] [CrossRef]
  7. Paquet, J.M.; Caron, J.; Banton, O. In situ determination of the water desorption characteristics of peat substrates. Can. J. Soil. Sci. 1993, 73, 339–349. [Google Scholar] [CrossRef]
  8. Bilderback, T.; Warren, S.; Owen, J.; Albano, J.P. Healthy substrates need Physicals too! HortTechnology 2005, 15, 747–751. [Google Scholar] [CrossRef]
  9. Cook, A.; Bilderback, T.; Lorscheider, M. Physical property measurementsin container substrates: A field Quantification strategy. SNA. Res. Conf. 2004, 49, 102–104. [Google Scholar]
  10. Allaire, S.E.; Caron, J.; Duchesne, I.; Parent, L.É.; Rioux, J.A. Air–filled porosity, gas relative diffusivity, and tortuosity: Indices of Prunus ×Cistena sp. growth in peat substrates. J. Amer. Soc. Hort. Sci. 1996, 121, 236–242. [Google Scholar] [CrossRef]
  11. Strojny, Z. Podłoże w pojemnikowej produkcji szkółkarskiej. Substrate in container nursery production. Nursery 2003, 4, 61–67. (In Polish) [Google Scholar]
  12. Mathers, H.M.; Yeager, T.H.; Case, L.T. Improving irrigation water use in container nurseries. HortTechnology 2005, 15, 8–12. [Google Scholar] [CrossRef]
  13. Evans, M.R.; Gachukia, M.M. Physical properties of sphagnum peat– based root substrates amended with perlite or parboiled fresh rice hulls. HortTechnology 2007, 17, 312–315. [Google Scholar] [CrossRef]
  14. Altland, T.E.; Owen, J.O.; Gabriel, M.Z. Influence of Pumice and Plant Roots on Substrate Physical Properties. HortTechnology 2011, 21, 554–557. [Google Scholar] [CrossRef]
  15. Kormanek, M.; Małek, S.; Banach, J.; Jagiełło-Leńczuk, K.; Dudek, K. Seasonal changes of perlite–peat substrate properties in seedlings grown in different sized container trays. New For. 2021, 52, 271–283. [Google Scholar] [CrossRef]
  16. Kremer, J.; Matthies, D.; Borchert, H. The impact of different carriages on soil and roots—Wheels and tracks in comparison. Meeting the Needs of Tomorrows’ Forests—New Developments in Forest Engineering. In Proceedings of the 9 Austro 2007/FORMEC’07, AU, Vienna and Heiligenkreuz, Austria, 7–11 October 2007; pp. 1–9. [Google Scholar]
  17. Wang, J.I. Terramechanics and Off-Road Vehicle Engineering: Terrain Behaviour, Off-Road Vehicle Performance and Design; Butterworth-Heinemann: Oxford, UK, 2009; p. 397. ISBN 9780080942537. [Google Scholar]
  18. Lee, J.-S.; Kim, S.Y.; Hong, W.-T.; Byun, Y.-H. Assessing subgrade strength using an instrumented dynamic cone penetrometer. Soils Found. 2019, 59, 930–941. [Google Scholar] [CrossRef]
  19. Kormanek, M.; Walczyk, M.; Walczyk, J. Wpływ obciążenia i liczby przejazdów ciągników zrywkowych na zmianę zwięzłości wybranych gleb leśnych. The effect of load and number of passes of skidding tractors on compaction of forest soils. Sylwan 2008, 10, 48–55. (In Polish) [Google Scholar] [CrossRef]
  20. Kormanek, M.; Dvořák, J. Ground Pressure Changes Caused by MHT 8002HV Crawler Harvester Chassis. Crojfe J. For. Eng. 2021, 42, 201–211. [Google Scholar] [CrossRef]
  21. Kormanek, M.; Dvořák, J. Use of Impact Penetrometer to Determine Changes in Soil Compactness after Entracon Sioux EH30 Timber Harvesting. Crojfe J. For. Eng. 2022, 43, 13. [Google Scholar] [CrossRef]
  22. ASAE S313.3 Published FEB1999 (R2018); ASAE Standards Soil Cone Penetrometer. American Society of Association Executives: Washington, DC, USA, 1999; pp. 820–821.
  23. Herrick, J.E.; Jones, T.L. A dynamic cone penetrometer for measuring soil penetration resistance. Soil Sci. Soc. Am. J. 2002, 66, 1320–1324. [Google Scholar] [CrossRef]
  24. Kees, G. Hand—Held Electronic Cone Penetrometers for Measuring Soil Strength; USDA Forest Service Technology and Developement Prgram: Missoula, MT, USA, 2005; p. 13.
  25. De Moraes, M.T.; Da Silva, W.R.; Zwirtes, A.L.; Carlesso, R. Use of penetrometers in agriculture: A review. Eng. Agric. Jaboticabal. 2014, 34, 179–193. [Google Scholar] [CrossRef]
  26. Allaire-Leung, S.E.; Caron, J.; Parent, L.E. Changes in physical properties of peat substrates during plant growth. Can. J. Soil Sci. 1999, 79, 137–139. [Google Scholar] [CrossRef]
  27. Lipiec, J.; Hajnos, M.; Świeboda, R. Estimating effects of compaction on pore size distribution of soil aggregates by merkury porosimeter. Geoderma 2012, 179−180, 20–27. [Google Scholar] [CrossRef]
  28. Kormanek, M.; Banach, J.; Sowa, P. Effect of soil bulk density on forest tree seedlings. Int. Agrophys. 2015, 29, 67–74. [Google Scholar] [CrossRef]
  29. Kormanek, M.; Głąb, T.; Banach, J.; Szewczyk, G. Effects of soil bulk density on sessile oak Quercus petraea Liebl. seedlings. Eur. J. For. Res. 2015, 134, 969–979. [Google Scholar] [CrossRef]
  30. Gajda, A.; Przewłoka, B. Soil biological activity as affected by tillage intensity. Int. Agrophys. 2012, 26, 15–23. [Google Scholar] [CrossRef]
  31. Abawi, G.S.; Widmer, T.L. Impact of soil health management practices on soilborne pathogens, nematodes and root diseases of vegetable crops. Appl. Soil Ecol. 2000, 15, 37–47. [Google Scholar] [CrossRef]
  32. Marshall, V.G. Impacts of forest harvesting on biological processes in northern forest soils. For. Ecol. Manag. 1999, 133, 43–60. [Google Scholar] [CrossRef]
  33. Sands, R.; Bowen, G.D. Compaction of sandy soils in radiata pine forests. II. Effects of compaction on root conRycination and growth of radiata pine seedlings. Aust. For. Res. 1978, 8, 163–170. [Google Scholar] [CrossRef]
  34. Banach, J.; Małek, S.; Kormanek, M.; Durło, G. Growth of Fagus sylvatica L. and Picea abies (L.) Karst. Seedlings Grown in Hiko Containers in the First Year after Planting. Sustainability 2020, 12, 7155. [Google Scholar] [CrossRef]
  35. Pająk, K.; Małek, S.; Kormanek, M.; Banach, J. Effect of peat substrate compaction on growth parameters and root system morphology of Scots pine Pinus sylvestris L. seedlings. Sylwan 2022, 166, 2537–2550. [Google Scholar] [CrossRef]
  36. Pająk, K.; Kormanek, M.; Małek, S.; Banach, J. Effect of Peat-Perlite Substrate Compaction in Hiko V265 Trays on the Growth of Fagus sylvatica L. Seedlings. Sustainability 2022, 14, 4585. [Google Scholar] [CrossRef]
  37. Kleibl, M.; Klvac, R.; Lombardini, C.; Porhaly, J.; Spinelli, R. Soil compaction and recovery after mechanized final felling of Italian coastal Pine Plantations. Crojfe J. For. Eng. 2014, 35, 63–71. [Google Scholar]
  38. Cambi, M.; Certini, G.; Neri, F.; Marchi, E. The impact of heavy traffic on forest soils: A review. For. Ecol. Manag. 2015, 338, 124–138. [Google Scholar] [CrossRef]
  39. Jones, D.; Kunze, M. Guide to Sampling Soil Compaction Using Hand-Held Soil Penetrometers; CEMML TPS 04-1; Center for Environmental Management of Military Lands (CEMML), Colorado State University: Fort Collins, CO, USA, 2004; pp. 1–8. [Google Scholar]
  40. Vanags, C.; Minasny, B.; McBratney, A.B. The dynamic penetrometer for assessment of soil mechanical resistance. Super soil AU, 2004, Published on CDROM. Available online: https://www.regional.org.au/au/asssi/ (accessed on 9 July 2023).
  41. Vaz, C.M.P.; Manieri, J.M.; De Maria, I.C.; Tuller, M. Modeling and correction of soil penetration resistance for varying soil water content. Geoderma 2011, 166, 92–101. [Google Scholar] [CrossRef]
  42. Raper, R.L.; Washington, B.H.; Jarrell, J.D. Technical notes: A tractor-mounted multiple-probe soil cone penetrometer. Appl. Eng. Agric. 1999, 15, 287–290. [Google Scholar] [CrossRef]
  43. Voltcraft DL-131G. USB Vibration Logger DL 131G. Operating Instruction. Version 08/13. Voltcraft 2013. 2. Available online: https://asset.conrad.com/media10/add/160267/c1/-/pl/000419329ML04/manual-419329-voltcraft-dl-131g-acceleration-data-logger-unit-of-measurement-vibrationacceleration-18-up-to-18-g.pdf (accessed on 10 June 2023).
  44. Kormanek, M.; Małek, S.; Mateusiak, Ł.; Banach, J.P. 441918 Stanowisko Pomiarowe do Badania Zwięzłości Podłoża w Kontenerach, Zwłaszcza Szkółkarskich Zgłoszenie Patentowe. Measuring Stand for Testing the Compactness of the Substrate in Containers, Especially Nursery Containers. Patent Pending P.441918, 2 August 2022. (In Polish). [Google Scholar]
  45. Rabiej, M. Statystyka z Programem Statistica. Statistics with the Program; Helion: Warszawa, Poland, 2012; p. 344. (In Polish) [Google Scholar]
  46. StatSoft. Electronic Statistics Manual. Krakow, PL. 2006. Available online: http://www.statsoft.pl/textbook/stathome.html (accessed on 14 July 2023).
  47. Raport o stanie lasów w Polsce 2021. Report on the Condition of Forests in Poland 2021; State Forests Information Center: Warszawa, Poland, 2022; p. 162. ISSN 1641–3229. (In Polish) [Google Scholar]
  48. Pająk, K.; Małek, S.; Kormanek, M.; Jasik, M. The effect of peat substrate compaction on the macronutrient content of Scots pine Pinus sylvestris L. container seedlings. Sylwan 2022, 166, 211–223. [Google Scholar] [CrossRef]
  49. Caron, J.; Elric, C.E.; Michel, J.C.; Naasz, R. Physical properties of organic soils and growing media: Water and air storage and flow dynamics. In Soil Sampling and Methods of Analysis, 2nd ed.; Carter, M.R., Gregorich, E.G., Eds.; CRC Press: Boca Raton, FL, USA, 2007; pp. 885–912. ISBN 13 978-0-8493-3586-0. [Google Scholar]
  50. Vannieuwenhuizen, K. Effects of Soil Compaction on the Germination and Growth of Picea Mariana and Pinus Banksiana. Master’s Thesis, Faculty of Natural Resources Management, Lakehead University, Thunder Bay, Ontario, CA, USA, 2020; p. 66. Available online: http://knowledgecommons.lakeheadu.ca/handle/2453/4634 (accessed on 14 July 2023).
  51. Soureshjani, H.K.; Bahador, M.; Tadayon, M.; Dehkordi, A.G. Modelling seed germination and seedling emergence of flax and sesame as affected by temperature, soil bulk density, and sowing depth. Ind. Crops Prod. 2019, 141, 111770. [Google Scholar] [CrossRef]
  52. Boylan, N.; Long, M.; Mathijssen, F.A.J.M. In situ strength characterisation of peat and organic soil using full-flow penetrometers. Can. Geotech. J. 2011, 48, 1085–1099. [Google Scholar] [CrossRef]
Figure 1. Urbianati S.r.l. Ypsilon line in the Nursery Farm in Suków, general view (left), substrate filling unit (right). Photo: M. Kormanek.
Forests 14 01750 g001
Figure 2. V300 (left) and V150 (right) containers filled with substrate. Photo: M. Kormanek.
Forests 14 01750 g002
Figure 3. Prototype station multipenetrometer for measuring soil penetration resistance in nursery containers [43]. Scheme of the station (left): frame (1), movable base (2), top plate (3), strain gauges (4), inserters rods (5), conical indenters (6), nursery container (7), linear bearings (8), guide rollers (9), drive shaft (10), chain gears (11), electric motor (12) reduction gear (13), length limit sensor (14); measurement in the cassette (right). Figure and photo: M. Kormanek.
Forests 14 01750 g003
Figure 4. Bulk density measurement in container cells. Collector with volumetric cylinders placed on the container (a); pouring the substrate into the cylinders (b). Photo: M. Kormanek.
Forests 14 01750 g004
Figure 5. Change in compactness with increasing moisture (m1; m2) and vibration intensity (VibAvr—medium level vibration; VibMax—maximum level of vibration).
Forests 14 01750 g005
Figure 6. Change in bulk density with increasing moisture (m1; m2) and vibration intensity intensity (VibAvr—medium level vibration; VibMax—maximum level of vibration).
Forests 14 01750 g006
Figure 7. The course of the compactness of the substrate as a function of cone penetration into the substrate with varying moisture (m1—70%, m2—75%) and vibration intensity (VibAvr—average vibration level; VibMax—maximum vibration level) when filling containers: V150 (a); V300 (b).
Forests 14 01750 g007
Table 1. Parameters of the containers used in the experiment.
ParameterV150V300
Length/width/height650/312/150 mm650/312/180 mm
Number of cells74 pc.53 pc.
Cell volume0.145 dm30.275 dm3
Cell opening diameter5.3 cm4.6 cm
Table 2. The influence of the analyzed factors on the penetration resistance and bulk density of the nursery substrate.
Substrate ParametersFactor
Container
Type
Substrate
Moisture
Vibration
Intensity
Container
Repeat
F-TestpF-TestpF-TestpF-Testp
Penetration
resistance (kPa)
3.4860.0634.3920.037 *186.910<0.001 **0.5860.557
Bulk density (g∙cm3)3.4950.0624.4020.366187.340<0.001 **
Significant differences were marked “*”at <0.05 and “**” at < 0.01.
Table 3. Average values of penetration resistance and bulk density depending on substrate moisture and vibration intensity for a V150 container.
Moisture
Variant
Vibration VariantValuePenetration Resistance [kPa]Bulk den.
[g∙cm−3]
ContainerC1C2C3C1–C3C4
m1
70%
VibAvrAverage12.615.011.312.970.234
St. dev.8.56.95.87.10.012
Coef. of var. [%]67.246.051.654.54.95
VibMaxAverage27.416.724.222.80.263
St. dev.11.213.011.411.90.010
Coef. of var. [%]40.777.747.252.13.88
m2
75%
VibAvrAverage9.57.37.17.90.276
St. dev.5.34.54.84.80.026
Coef. of var. [%]55.961.767.461.19.53
VibMaxAverage30.025.728.828.10.342
St. dev.10.211.112.311.20.012
Coef. of var. [%]34.243.342.739.93.46
Table 4. Average values of penetration resistance and bulk density depending on substrate moisture and vibration level for a V300 container.
Moisture
Variant
Vibration VariantValuePenetration Resistance [kPa]Bulk den.
[g∙cm−3]
ContainerC1C2C3C1–C3C4
m1
70%
VibAvrAverage12.88.912.411.340.251
St. dev.5.13.34.94.40.012
Coef. of var. [%]40.137.339.239.04.7
VibMaxAverage22.326.923.624.30.285
St. dev.10.510.56.59.20.021
Coef. of var. [%]47.238.927.337.77.3
m2
75%
VibAvrAverage14.418.615.916.30.266
St. dev.6.211.78.08.60.029
Coef. of var. [%]42.962.950.553.010.9
VibMaxAverage27.827.426.527.20.299
St. dev.9.110.08.09.00.009
Coef. of var. [%]32.636.430.233.13.1
Table 5. Correlation analysis of compactness and bulk density.
FactorBulk Density
V150V300V150 and V300
rprprp
Penetration resistance0.2500.024 *0.4800.032 *0.3270.030 *
Significant correlations are marked “*” at <0.05.
Table 6. Correlation analysis of compactness, bulk density, moisture, and vibration intensity.
ContainerV150V300V150 and V300
Moisture Content [%]
rprprp
Penetration resistance [kPa]−0.0940.6630.1810.4460.1810.446
Bulk density [g∙cm−3] 0.5290.007 *0.6770.001 *0.6770.002 *
Vibration intensity [m∙s−2]
Penetration resistance [kPa]0.6020.000 **0.5700.000 **0.5830.000 **
Bulk density [g∙cm−3] 0.6550.001 *0.6230.003 *0.5960.000 **
Significant correlations are marked “*” at <0.05 “**” at <0.01.
Disclaimer/Publisher’s Note: The statements, opinions and data contained in all publications are solely those of the individual author(s) and contributor(s) and not of MDPI and/or the editor(s). MDPI and/or the editor(s) disclaim responsibility for any injury to people or property resulting from any ideas, methods, instructions or products referred to in the content.

