Article

The Effect of Carbon Sink Afforestation Projects on China’s Forest Product Export Trade: Empirical Evidence from Chinese Microenterprises

1
School of Economics and Management, Beijing Forestry University, Beijing 100083, China
2
School of Economics, Central South University of Forestry and Technology, Changsha 410004, China
3
The Research Center for High-Quality Development of Industrial Economy, Key Research Base of Philosophy and Social Sciences in Hunan Province, Changsha 410004, China
*
Author to whom correspondence should be addressed.
Forests 2023, 14(8), 1667; https://doi.org/10.3390/f14081667
Submission received: 3 August 2023 / Revised: 15 August 2023 / Accepted: 15 August 2023 / Published: 18 August 2023
(This article belongs to the Section Forest Economics, Policy, and Social Science)

Abstract

:
Forestry carbon sinks are an important measure for enabling China to cope with global climate change and realize its “double carbon” goal. Carbon sink afforestation projects (CSAPs) are a type of forestry carbon sink projects, and the question of whether China’s forest products with an export orientation can adapt to the requirements of high-quality development is important for balancing the relationship between emissions reduction and development. We use the micro-data of forest product export enterprises provided by the China Customs Database and construct a difference-in-difference (DID) model to investigate the impact of CSAPs on China’s forest product export and its heterogeneity. The results show that CSAPs significantly increase the export scale of China’s forest products. CSAPs lead to significant heterogeneity regarding the forest product export scale in relation to regions, production factor intensity, trade pattern, enterprise ownership, and export destination countries. We further find that although the implementation of CSAPs significantly reduces the export types of forest products, it significantly promotes an increase in the export price and the expansion of the export quantity of forest products, and it optimizes the export structure of forest products to some extent. The “Belt and Road” initiative (BRI) has played a significant positive role in regulating the expansion of the forest product export scale with CSAPs. The implementation of CSAPs reduces the risk of termination of trade relations among forest product export enterprises and extends the export duration. The conclusions provide implications for policy makers and managers of forest product enterprises.

1. Introduction

Forestry carbon sinks are an important measure for China to cope with global climate change and realize its “double carbon” goal. According to the Paris Agreement, countries should take relevant actions to protect forest carbon pools and increase forest carbon sinks. In 2012, Chinese pilot carbon trading policies were launched in seven provinces and cities, and forestry carbon sink projects (FCSPs) were incorporated into the carbon trading market as an emission reduction offset mechanism. In line with the main object of FCSPs, carbon sink afforestation projects (CSAPs) can increase the CO2 absorption capacity of the forest through afforestation and other forestry activities and contribute to the realization of “carbon neutrality” in China by 2060. Therefore, the ecological and economic effects of CSAPs have gradually attracted academic attention [1,2].
Under export-oriented policies, China has become a major producer and exporter of forest products. China’s output and exports of wood furniture, paper products, plywood, wood flooring, and a variety of wood products have become the largest in the world [3]. Thus, Chinese forest products have formed a trade pattern that relies excessively on the international market and resources. At present, due to the global economic downturn, trade protectionism, trade imbalances, and disputes over trade interests have emerged in an endless stream [4]. The Chinese 14th Five-Year Plan clearly stated that the government would unswervingly implement the new development concepts of innovation, coordination, greenness, openness, and sharing (Source: https://www.gov.cn/xinwen/2021-03/13/content_5592681.htm (accessed on 1 August 2023)). Based on high-quality development requirements in the new era and the double carbon target, how do the CSAPs influence the forest product export trade? Is there heterogeneity among enterprises in different geographical locations, forest products with different factors, and trade modes? The answers to the above questions provide a comprehensive and objective evaluation of the effect of CSAPs. They also imply a need for China to transform from a large trading country into a strong trading country of forest products.
Research on the export trade of forest products gradually attracted the attention of scholars. They began to focus on the factors affecting the export scale of forest products, so as to realize the sustainable development of forest product enterprises and forestry [5,6,7]. With the further refinement of the international division of production, subsequent studies focused on the driving factors of forest products’ export trade, export quality, and the global value chain [1,8,9,10]. The development of forestry may occupy the resources of other non-forestry activities, while providing an economic development effect [11]. With the establishment of the Clean Development Mechanism (CDM) under the Kyoto Protocol, countries are gradually launching forestry carbon reduction activities such as CSAPs. CSAP refers to the use of market-oriented means to participate in forestry resource trading; they provide impetus for economic growth, and have a strong growth effect on impoverished areas [12]. However, most studies have only theoretically explored the economic effects of CSAPs [12,13], and there are few studies on the trade effects of CSAPs.
On the basis of existing research, the main contributions of this study are reflected in the following aspects: Firstly, the economic impact of CSAPs is investigated from the perspective of forest product export trade. Based on the practical background of the implementation of forestry carbon sinks, existing studies mainly study the economic, social, and ecological effects of CSAPs theoretically [14,15,16], while a small number of studies carry out empirical analysis centering on industrial structure upgrading and economic growth, and argue that CSAPs can improve local economic growth and optimize the industrial structure [17,18]. They neglect the fact that an important purpose of CSAPs is to improve the international competitiveness of Chinese forest product enterprises. Therefore, we empirically analyze the effects of CSAPs on forest product export trade. Secondly, the existing research focuses on the export trade structure, evaluating the international competitiveness index and its influencing factors, international competitiveness, and the comparative advantages of forest products. We employ the difference-in-difference (DID) method to evaluate the implementation effect of CSAPs. In recent years, the method has been widely used as an important tool to evaluate the effect of policy implementation [19,20,21,22,23,24]. This method regards a certain policy as a quasi-natural experiment, unlikely to be affected by survey data and individuals [25], and the impact results of policies as more robust. Finally, we expand the connotation of export trade, and analyze the effect of CSAPs on the marginal effect and duration of forest product exports.

2. Background of Forestry Carbon Sink Afforestation Projects and Research Hypothesis

2.1. Background of Forestry Carbon Sink Afforestation Projects

Forestry has the function of adapting to and mitigating climate change, and it is an essential method for increasing carbon sinks, reducing carbon emissions, and promoting ecological civilization construction in the future. The relevant provisions of the Paris Agreement state that countries should take relevant actions to protect forest carbon pools and increase forest carbon sinks. FCSPs, as carbon trading method for forestry activities, have frequently appeared in domestic and international carbon trading markets. At the end of 2017, there were 110 FCSPs being carried out and registered with China’s Development and Reform Commission. The approval scheme Chinese Certified Emission Reduction (CCER) of China’s FCSPs is distributed in 23 provinces and cities. According to the selected tree species and combination methods, there are differences in the carbon reduction effects of different types of projects.
At present, China’s forestry carbon sequestration mainly includes the afforestation type of FCSPs (CSAPs and bamboo afforestation) and the forestry management type of forestry carbon sequestration projects (forest management and bamboo forest management). By the end of March 2017, 66 CSAPs in China had been approved and 11 had been registered, mainly distributed in Inner Mongolia, Jiangxi, and Hubei (collected from China Voluntary Emission Reduction Trading Information Platform.). According to Yang et al. [26], the average annual carbon reduction of these projects is 11.26 tons/hectare. At the time, one bamboo afforestation project had been approved and zero projects had been registered in Hubei Province, with an average annual carbon reduction of 9.35 tons/hectare. Twenty-five forest management projects had been approved and one had been filed, mainly distributed in Jilin, Heilongjiang, and Inner Mongolia. The average annual carbon reduction of these projects is 2.87 tons/hectare. Five bamboo forest management projects had been approved and one had been registered, mainly distributed in Zhejiang and Hubei. The average annual carbon reduction is 5.87 tons/hectare. It can be seen that CSAPs account for the largest proportion of China’s forestry carbon sequestration projects, with the highest carbon reduction.
As the main implementation object of FCSPs, CSAPs can absorb CO2 in the atmosphere through afforestation and contribute to China’s goal of “carbon neutrality” by 2060. At present, the types of CSAPs in China mainly include CDM, CCER, and other voluntary projects such as the Forestry Voluntary Carbon Reduction Standard (VCS) project. There are five registered forestry carbon sequestration CDM projects in China, all of which are afforestation and reforestation projects. As early as 2003, Guangxi collaborated with the World Bank’s Biocarbon Fund to develop the world’s first CDM carbon sequestration afforestation methodology. In 2006, the first CDM reforestation project to be approved and registered in the world was designed and implemented in Huanjiang and Cangwu, namely “the Pearl River Basin reforestation project in Guangxi, China”. In 2008, the “Reforestation Project for Degraded Land in Northwest Guangxi” was implemented in Longlin, Tianlin, and Lingyun. By the end of 2019, these two CDM projects had generated 748,000 tons and traded 640,000 tons of carbon sequestration and received a carbon sequestration transaction payment of USD 2.98 million.
In March 2017, due to issues such as a low volume of voluntary greenhouse gas reduction trading and the insufficient standardization of individual projects, the National Development and Reform Commission temporarily suspended the acceptance of applications for the registration of greenhouse gas voluntary emissions reduction trading methodologies, projects, and certification institutions. At present, there are 11 registered CCER CSAPs in China. They are distributed in Guangdong, Jiangxi, Inner Mongolia, Beijing, Hebei, Heilongjiang, and Yunnan. Overall, major carbon trading pilot regions have shown some inclination towards forestry carbon sink CCER projects. For example, the CCER project used by Hubei Carbon Exchange for offsetting encourages priority use of agricultural and forestry projects. Shenzhen Carbon Exchange designates the areas for wind power, photovoltaic, waste incineration, and other projects, while agricultural and forestry projects are not subject to regional restrictions. Considering that carbon sequestration and afforestation projects account for a relatively large proportion of China’s forestry carbon sequestration projects and contribute the most to carbon reduction, and that China’s developing forestry carbon sequestration VCS projects have been ongoing since 2017, we select China’s registered CDM and CCER projects as examples to reflect the implementation effect of China’s forestry CSAPs.

2.2. Research Hypothesis

CSAPs enhance the efficiency of forest resource utilization and promote sustainable development of forestry by implementing afforestation and forest management, thus reducing deforestation. They are of great significance in promoting local forest product export and improving the quality of life of forest farmers. CSAPs can alleviate the financing constraints of local forest product export enterprises and provide financial support for the development of forest product export. Implementing CSAPs in the local area, the government will introduce a series of industrial policies related to industry guidance, platform construction, and industry chain expansion based on the positive signal effect of the market [27]. Through direct government subsidies [28,29] or conveying positive signals to the market, accelerating capital aggregation has reduced the financing costs and expanded financing channels for related forest product enterprises [30]. This provides financial support for forest product enterprises to expand production and increase their export trade scale.
Moreover, the implementation of CSAPs can strengthen local production advantages and encourage forest product enterprises to occupy a comparative advantage in export, further expanding their export scale. CSAPs introduce advanced afforestation and agricultural product cultivation technologies, cultivate the afforestation skills of forest farmers [31], and affect the types of exported forest products. It can accelerate the industrial agglomeration of forest products, form the scale effect of production of forest product enterprises, reduce the export-fixed cost and variable cost [32], and may affect the price and quantity of export forest products. At the same time, spatial clustering around CSAPs can enable export enterprises to obtain more export information or share more international marketing networks, and expand sources of market information. They further strengthen the production advantages of enterprises, enhance the international competitiveness of forest products [33], and thus facilitate the increase in the scale of forest product export.
In addition, CSAPs can promote the upgrading and rationalization of regional industrial structures and reshape export competitive advantages. Hu and Zeng [34] estimated the effects of CSAPs on county economic development by using the propensity-score-matching difference-in-difference (PSM-DID) model, and found that the implementation of CSAPs significantly promoted the growth of regional real GDP. In addition, local economic development can be promoted mainly through optimizing the local industrial structure and raising residents’ savings rates. Wu et al. [1] constructed the PSM-DID model to study the impact of CSAPs on local economic growth. It was found that CSAPs play an important role in promoting county economic development, and that the economic benefits of a CSAP gradually appear from the sixth year of the implementation of the project. Therefore, the hypothesis is proposed as follows:
Hypothesis 1. 
CSAPs have a significant promoting effect on the scale of forest product export and affect the export trade structure of forest products by affecting the types, prices, and quantities of export products.
China has a vast land area, and there are differences in technological level and industrial foundation among different regions. Existing research has verified that environmental regulations have different impacts on export competitiveness in different regions of China [35], leading to differences in the impact of CSAPs on export in different regions. Some scholars have also found that there are differences in the dependence degree of industries with different factor intensities on technological innovation [36], and the export expansion effect caused by CSAPs may vary among forest product enterprises with different factor intensities. Chen et al. [21] argue that SOEs, which balance social responsibility such as improving local employment, are less sensitive to costs and may respond less to environmental regulations. There are also differences in the financing capabilities of enterprises with different ownership systems [37]. Zheng et al. [38] pointed out that there were differences in the degree and mode of enterprise participation in the global division of labor under different trade patterns, and forest product enterprises with a processing trade pattern rely on imported intermediate goods. The expansion effect on export scale brought about by CSAPs may vary among enterprises with different trade patterns. Existing research has verified that the development status of export destination countries, such as the level of financial and economic development, can affect export [39]. Therefore, the export effect of CSAPs may vary with the development level of export destination countries. In addition, when the export destination country is a country along the BRI, the level of its transportation infrastructure has been improved, which can effectively reduce the trade cost with China [40]. Therefore, the hypothesis is proposed as follows:
Hypothesis 2. 
When considering the location, production factor intensities, enterprise trade mode, ownership, development degree of the export destination country, and whether it is a country along the BRI, there is heterogeneity in the export scale of forest product enterprises affected by CSAPs.
Enhancing the export duration is the key to the sustained growth of China’s forest product exports [41]. CSAPs accelerate the agglomeration of local forest product industries, resulting in agglomeration effects and trade costs such as information search costs, communication costs, and payment costs for export enterprises. Moreover, more small enterprises have emerged within the forest product industry cluster, which will stimulate the innovation level of enterprises due to more intense competition [42]. The spillover effect of expertise and technology, as well as the improvement in the innovation level of forest product enterprises, will promote the productivity and export level of relevant forest product export enterprises [32]. In addition, carbon sink afforestation projects reduce the export fixed cost and variable costs of enterprises by gathering related industries to form a certain scale effect, which not only promotes the sustainable growth of the original export market of forest products [41], but also provides sufficient space and motivation for the implementation of strategies such as brand building and product upgrading for enterprises. This enhances the innovation level and productivity of enterprises, thereby increasing the export duration of forest products. Therefore, the theoretical hypothesis proposed in this study is:
Hypothesis 3. 
The implementation of CSAPs promotes the export duration of forest product enterprises.

3. Model and Data

3.1. Model Construction

We selected CSAPs as a quasi-natural experiment to examine the impact on China’s forest product export trade. Given that several regions implemented CSAPs in different years, we implemented the DID method with multiple time periods. The specific model settings are as follows:
export ipct = β 0 + β 1 treat i × post t + λ X + μ i + γ p + θ c + σ t + ε ipct
where the dependent variable export ipct represents the export volume of p products exported by enterprise i to country c in year t. The core explanatory variable is treat i × post t . The treatment variable treat i takes 1 when a CSAP is implemented in the region where enterprise i is located, and otherwise it is 0. post t is a time dummy variable, it takes 1 when a CSAP is implemented, and otherwise it is 0. X represents the set of control variables from enterprise, national, and regional perspectives. The detailed explanation is provided below. β 0 is the intercept term, β 1 reflects the effects of implementation of CSAPs. λ are estimation coefficients of control variables. μ i represents individual fixed effects at the enterprise level, γ p represents individual fixed effects at the product level, θ c represents individual fixed effects at the country level, σ t represents the time fixed effect, and ε ipct is the error term.

3.2. Variable Explanation

We select control variables that affect export trade, including enterprise-level, national-level, and regional-level variables. The enterprise-level control variables include enterprise ownership structure (SOE) and enterprise trade mode (general). State-owned firms are beneficial for increasing government subsidies and thus have a greater export volume [43]. Thus, among them, SOE is set to be 1 when the enterprise is a state-owned enterprise, and otherwise it is 0. Processing trade is an important impulse to promote export expansion due to cheap labor and land inputs in China [44]. The trade type indicator of the enterprise is set to be 1 when the trade type of the enterprise is general trade, and 0 for processing trade.
The national-level control variables include whether the export destination country has signed a free-trade agreement (FTA) with China and the per capita GDP of the export destination country (WGDP). Free-trade agreements promote bilateral trade through trade creation effects [45,46]. FTA is set to be 1 when the export destination country has signed an FTA with China, and otherwise it is 0. Economic conditions in trading partner countries matter for market demands, and higher market demands are positively correlated with exports [47,48]. WGDP is measured by the per capita GDP of the export destination country in log.
Regional-level control variables include regional per capita GDP, transport infrastructure, number of internet users, trade openness, and forest utilization ratio. The level of economic development in exporting areas reflects local industrialization and supply capacities, which is fundamental to exports [49,50]. The per capita GDP of the region is represented by the per capita GDP of the region in log. Considering that the density of regional roads or railways can reflect the efficiency of logistics transportation and is one of the infrastructure conditions that affect the export trade of wood forest products [50], transport infrastructure level is expressed by dividing the mileage of roads in the region by the administrative area in log. Information technology can help firms to find more trading partners and effectively reduce trade costs [51,52]. Considering that the development level of regional internet to some extent reflects the information technology level of the forestry industry in the region, number of internet users is expressed as the number of internet users per hundred people in log. Higher trade openness results in intense market competition, and firms can improve their TFP through spillover effects and human resource effects [53,54]. Thus, trade openness is also beneficial for firm exports. Trade openness is expressed as the proportion of regional total imports and exports to GDP. The conditions of the forest industry are closely related with forest product exports [55]. Forest utilization ratio is expressed as the ratio of forest area to forestland area, and it is an important indicator for measuring the level of forestry development in a region.

3.3. Data Sources and Correlations Test

The enterprise-level data, including forest products export trade scale, enterprise ownership, and enterprise trade model, are obtained from the China Customs Import and Export Trade Database. This database provides the data from 2000 to 2016. Based on the “China’s Import and Export Tax Regulations”, the relevant categories of forest products were systematically defined, and a sample of enterprises involved in the export of forest products was retained. Meanwhile, the national-level data include whether the export destination country has signed an FTA with China and WGDP. The FTAs are obtained from the China Free Trade Zone Service Network. The WGDP data of export destination countries are sourced from the World Bank database. In addition, the relevant variables at the regional level in China come from the China Urban Statistical Yearbook and the China Environmental Statistical Yearbook. Due to the fact that enterprise-level data have only been updated up to 2016, the final sample is from 2000 to 2016. The descriptive statistics of data are shown in Table 1.
Table 2 shows the correlation test between various variables, and the results show that the correlation coefficient between each variable is very low and there is no obvious correlation relationship.

4. Analysis of Regression Results

4.1. Basic Results

Table 3 shows the impact of CSAPs on the export scale of China’s forest products, all of which are clustered at the urban level. From column (2), it is found that without considering the control variables, the implementation of CSAPs has expanded the export volume of China’s forest products by 0.0986%. This means that the implementation of China’s CSAPs has significantly increased the export scale of forest products. After considering the control variables, column (4) shows that the implementation of CSAPs has led to an increase of 0.0762% in the export scale of forest products in treatment areas, which is significant at the 5% level. The result supports Hypothesis 1 and indicates that the carbon sequestration afforestation projects can significantly increase the export scale of forest products.
The basic regression indicates that the implementation of CSAPs has a positive impact on the expansion of China’s forest product exports. The reasons may be that the CASPs can encourage local farmers to improve their skills and create employment opportunities [2], promote local reduction in the use of agricultural land [56], and encourage local labor to flow into industries such as forest product manufacturing [57]. It may expand the output value of forest products. Moreover, as CSAPs can attract socially and environmentally responsible enterprises and investors and provide diversified financing channels for the local area [1], they effectively improve the financing level and innovation ability of local forest product export enterprises. In addition, CSAPs can encourage China to improve the standards of forest products in the long run in order to meet the requirements of environmentally strict countries, thereby expanding the export market.

4.2. Heterogeneity Analysis

In order to investigate the heterogenous impact of CSAPs on China’s forest product exports, we conducted the following heterogeneity analysis: (1) Considering China’s vast territory, large land area, and significant regional differences in economic development and technology in different geographical locations, triple-cross terms of the central dummy variable (middle) and western dummy variable (west) with the DID interaction term treat × post were set separately to examine the different impacts across regions. (2) Considering the differences in the production factors invested in different forest products production activities, forest products were divided into labor-intensive products (including wood products, wood furniture, and artificial board products), capital- and technology-intensive products (including wood pulp, paper, and paper products), and resource-intensive products (other forest products that do not belong to the above two categories). Triple-cross terms of the resource-intensive products dummy variable (source) and the capital- and technology-intensive products dummy variable (capital) with the DID interaction term treat × post were set separately to examine different impacts of different factors’ endowment products. (3) Considering the differences in enterprises’ export behavior under different trade patterns, we distinguished between general trade, processing trade, and mixed trade types, and set triple-cross terms of the processing trade dummy variable (process) and the mixed trade dummy variable (mixed) separately with the DID interaction term treat × post to examine the different impacts of different trade patterns. (4) Considering the significant differences between SOEs and non-SOEs in financing channels, enterprise scale, and other aspects, a triple-cross term was set up between the SOE dummy variable (SOE) and the DID interaction term treat × post to examine the different impacts of different enterprise ownerships. (5) Considering that countries with different economic development have different requirements for the quality and environmental protection standards of imported products, we distinguished export destination countries between developed and developing countries, setting up a triple-cross term of the developed export destination countries dummy variable (dev) with the DID interaction term treat × post to examine the different impacts of different export destination countries’ development levels. The results are shown in columns (1)–(5) of Table 4.
From column (1), it is found that CSAPs have the highest significant positive effect on the export scale of forest products in China’s eastern and western regions, while they have a significant negative effect in the central region. The result supports Hypothesis 2. This may be due to the fact that the eastern region is more favorable in terms of the business environment and market openness compared to the central and western regions. Chen et al. [35] verified that environmental regulation enhanced the eastern region’s export competitiveness. Therefore, CSAPs enable enterprises in the eastern region to face the fierce competition in the international market.
From column (2), it is found that CSAPs have a greater positive effect on the expansion of China’s resource-intensive forest product exports compared with labor-intensive forest product exports. The result supports Hypothesis 2. On the other hand, these projects have a significant inhibitory effect on the export of capital- and technology-intensive forest products in China. This indicates that the positive impact of CSAPs on China’s forest product export scale is achieved through the increased export of labor-intensive and resource-intensive forest products. Capital- and technology-intensive industry is more affected by environmental regulations, but their development needs to be driven by innovation [36]. It is worth pondering for policy makers how to improve market-oriented CSAPs to help promote the technological improvement of export forest products.
Column (3) shows that CSAPs have led to an increase of 0.1232% in the export scale of general trade enterprises, while the export scale of processing trade enterprises and mixed trade enterprises has decreased by 0.1323% and 0.1525%, respectively. The result supports Hypothesis 2. CSAPs have a significant promoting effect on the exports of general trading enterprises, while they have a significant negative effect on the exports of processing trade and mixed trade enterprises. Imported intermediate goods have an impact on export scale through the complexity of export technology [58]. The degree of dependence on imports varies under different trade patterns, and processing trade and mixed trade need imported intermediate goods. Therefore, the implementation of CSAPs has different impacts on exports under different trade patterns.
From column (4), it can be seen that these projects have a significant positive impact on the forest product export scale of non-SOEs (0.4777%), while they have a significant negative impact on the forest product export scale of SOEs (0.8922%), with the negative impact being far greater than that on forest product export from non-SOEs. The result supports Hypothesis 2. Compared with previous results of control variable SOE, although SOEs are more likely to expand their export scale of forest products, the implementation of CSAPs will actually promote the expansion of forest product export scale of non-SOEs. This may be due to the characteristics of non-SOEs, such as more flexible organizational forms, greater freedom, and faster responses to market changes [37,59]. Due to these characteristics of non-SOEs, the implementation of CSAPs can enable non-SOEs making forest products to adjust their investment direction more quickly, use resources more freely to achieve their own interests, and thus promote the expansion of the forest product export scale.
Column (5) shows that the export scale of forest products to developing countries has significantly increased (0.1249%), while the export scale of forest products to developed countries has significantly decreased (0.0842%). The result supports Hypothesis 2 and indicates that there are structural differences based on export destination in the scale of Chinese forest products exported to different regions due to the impact of CSAPs. This may be due to environmental regulation affecting the price transmission and product conversion of export products, leading to export companies adjusting their export destination countries [60]. The implementation of CSAPs allows Chinese enterprises to export more forest products to developing regions and reduce the amount of forest products being exported to developed regions.

4.3. Results of Robustness Test

Based on the previous results, if enterprises in regions where CSAPs have been implemented demonstrate a trend of expanding the export scale of their forest products before the implementation of the projects, the positive effect of CSAPs of promoting the export trade of forest products found earlier will be exaggerated. In summary, the potential concern regarding the DID model is that the effectiveness of a project’s implementation may be partially attributed to the efforts made or potential trends exhibited before the project’s implementation, which may lead to the changes after the project’s implementation actually being caused by previous efforts. Therefore, it is necessary to conduct parallel trend testing in order to examine the possibility of exaggerating the effectiveness of the projects [35,59]. Taking into account all lags in CSAPs, we construct the following model:
lnexport ipct = α 0 + n = 4 5 ( ρ t I t t p o s t treat i p o s t t ) + λ X + μ i + γ p + θ c + σ t + ε ipct
when t post = n , I t t p o s t is 1, and otherwise it is 0. t represents the year, and post represents the dummy variable for before and after the implementation of the CSAPs. The value is 1 in regions where a project had been implemented during the implementation period, and otherwise it is 0. X represents the set of control variables, which are the same as in model (1). In the parallel trend test, it is important to focus on coefficients of ρ t .
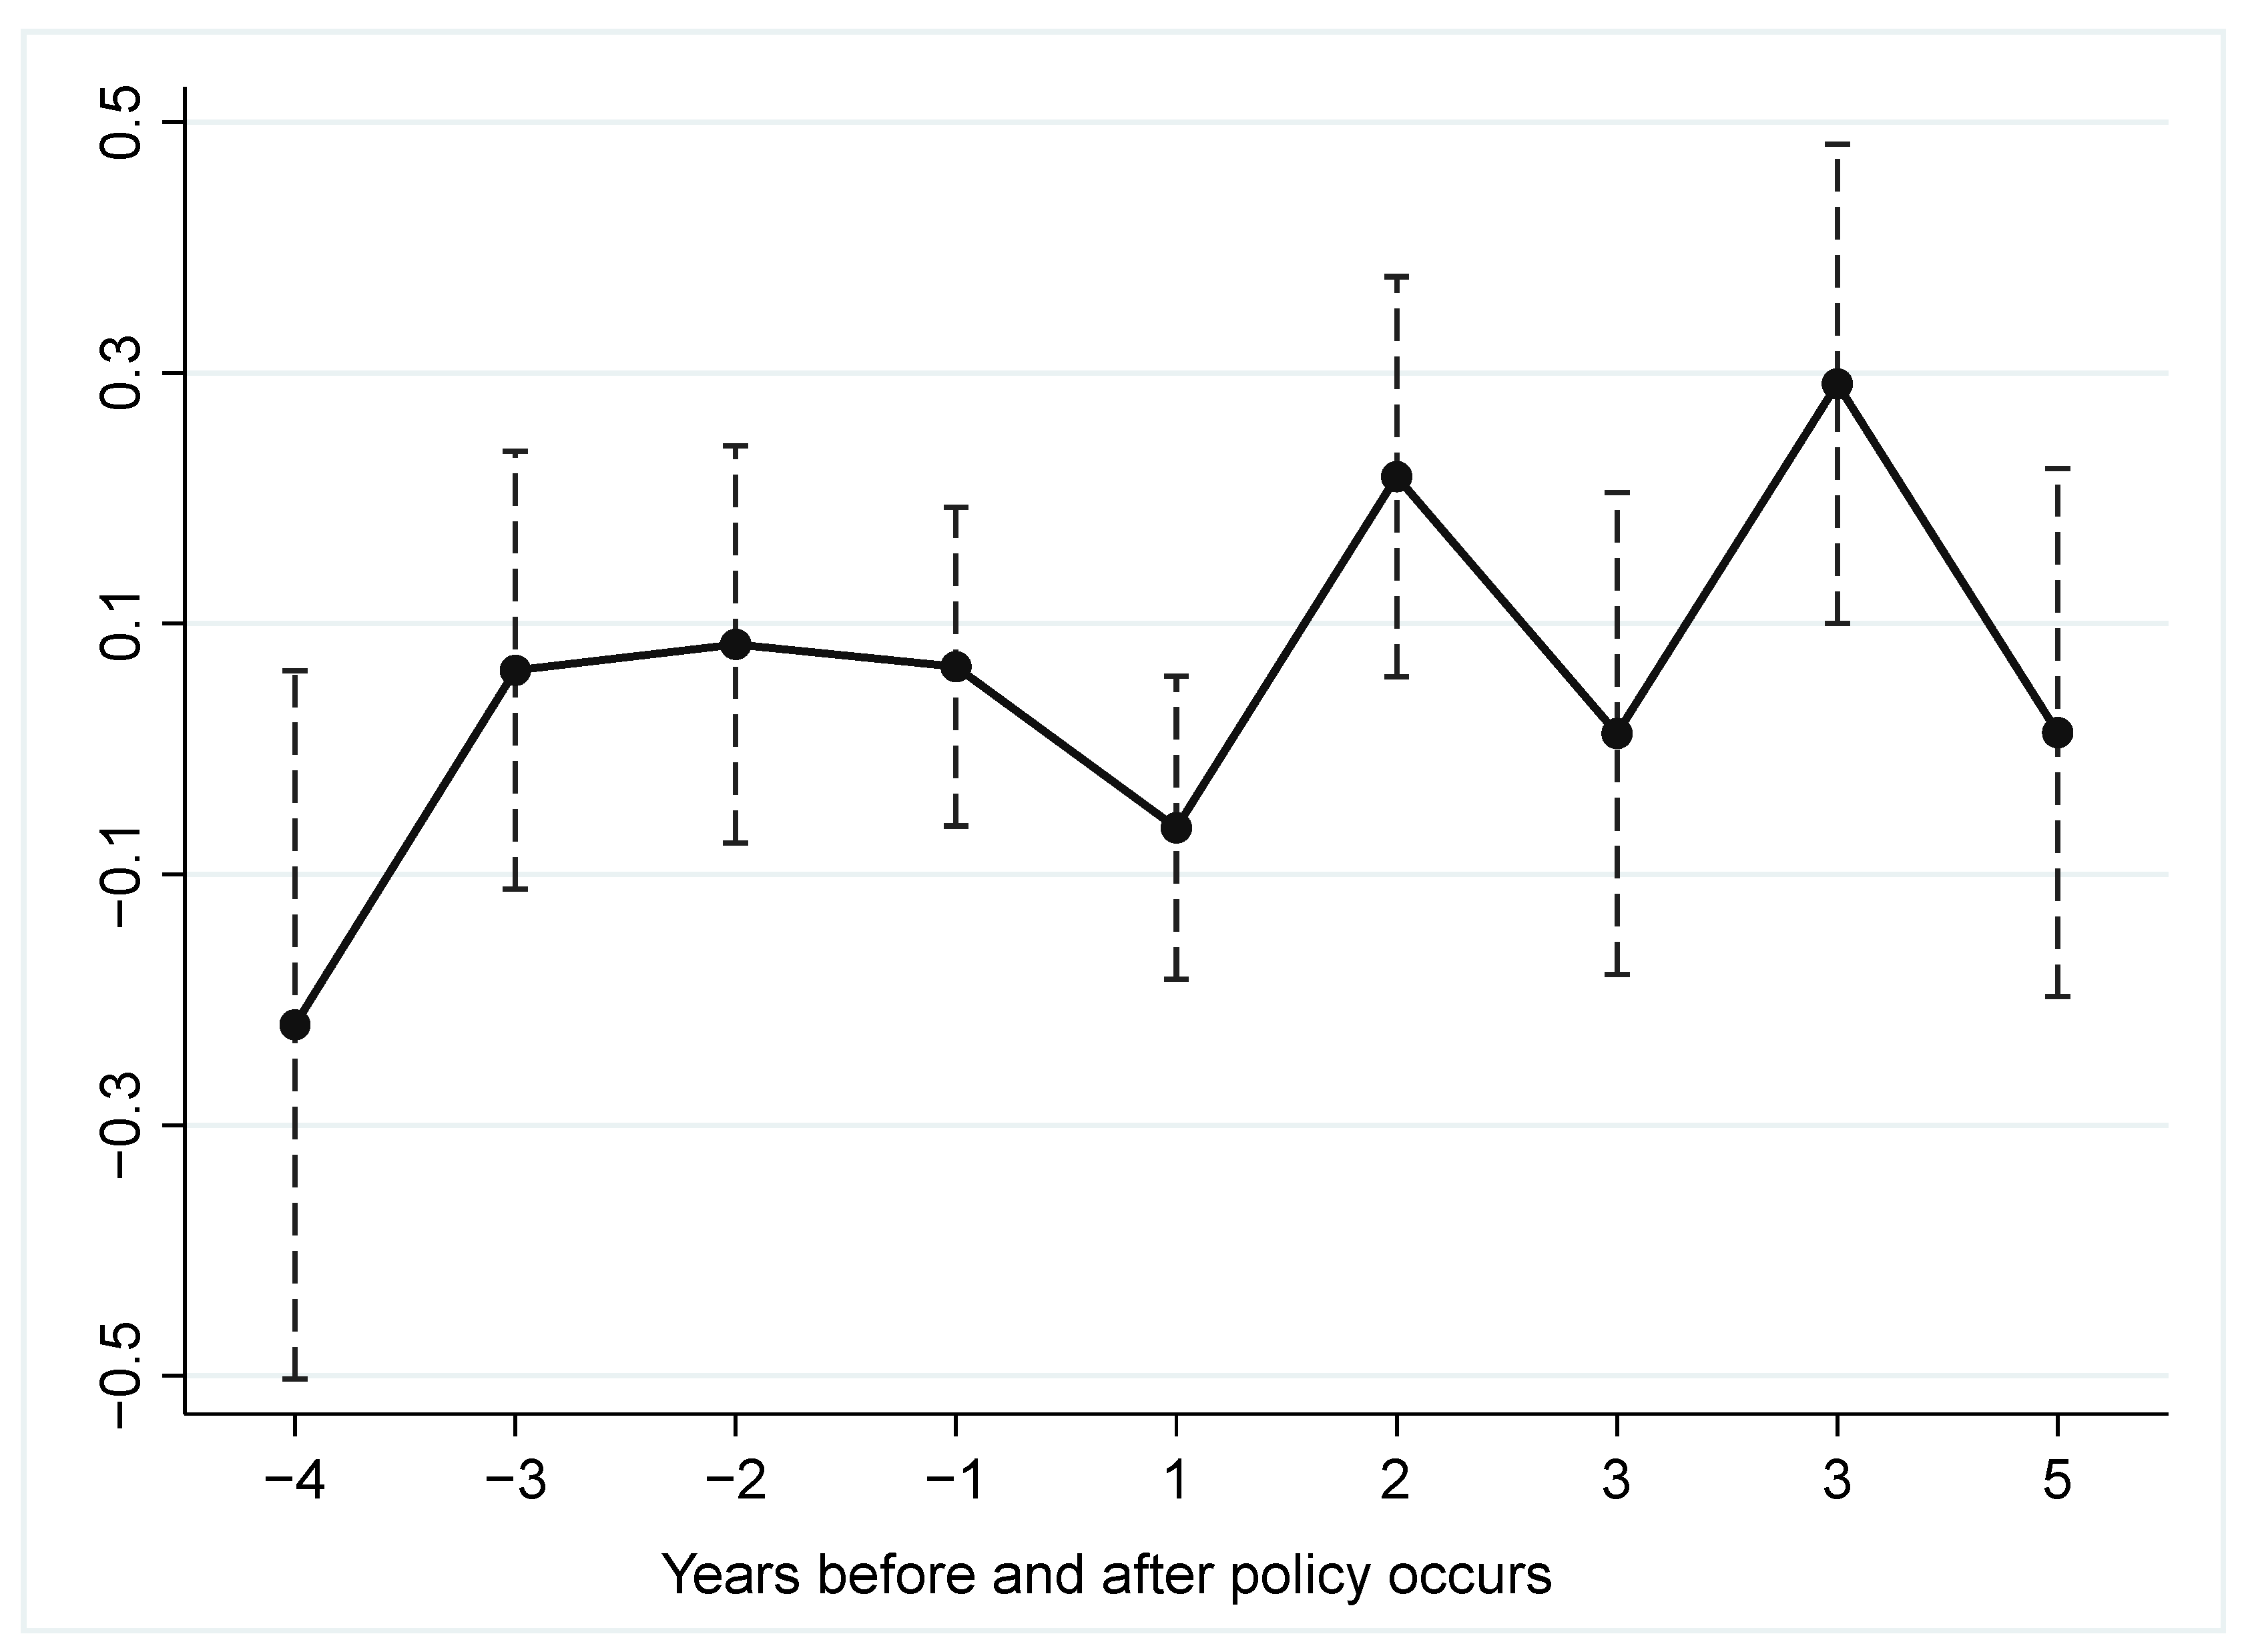
Figure 1 shows the estimated coefficients of the parallel trend test at the 95% confidence interval. From Figure 1, the DID interaction terms are not significant before the implementation of the CSAPs, while the coefficients after the implementation of the projects are statistically significant. We do not observe a continuous increase or decrease in the difference in the export scale of forest products between the treatment group and the control group, resulting in an upward or downward tilt in the estimated processing effect. This indicates that there is a similar trend in the export scale of forest products before a CSAP. After the implementation of the CSAPs, there is a significant difference in the change trend of the export scale of forest products. The parallel trend test is passed, and there are no exaggerated effects of the CSAPs.
In order to test the robustness of basic results, we conduct the following robustness tests: (1) The global financial crisis triggered by the US subprime mortgage crisis in 2008 had a profound impact on China’s export trade. In order to eliminate the impact of this financial crisis on China’s forest product exports, data from 2007, 2008, and 2009 are excluded for regression. The results are shown in column (1) of Table 4. (2) Considering the significant differences in export behavior between forest product trade intermediaries and other forest product production enterprises, we exclude the sample of trade intermediaries with enterprise names containing fields such as “import and export”, “trade”, “economy and trade”, “foreign economy”, “science and trade”, and re-regress model (1). The results are shown in column (2) of Table 4. (3) For possible outliers, we conduct a 1% level bilateral tail shrinking for each variable, and the results are shown in column (3) of Table 5.
From column (1), it can be seen that after excluding the potential impact of the 2008 financial crisis, the implementation of CSAPs can lead to a significant increase of 0.1403% in China’s forest product export scale. Column (2) shows that after excluding the sample of forest product trade intermediaries, CSAPs can still provide significant positive effects, increasing forest products export scale by 0.1201%. Column (3) shows that the implementation of CSAPs can bring about a 0.077% increase in China’s forest product export after the tail-shrinking treatment of possible outliers, which is significant at the 5% confidence level. From this, it can be seen that although the estimated coefficient of CSAPs has changed, it is still significantly positive at the 1% or 5% confidence level. The implementation of CSAPs can significantly improve China’s forest product export scale, verifying the robustness of the basic results above.
In order to analyze the impact of CSAPs on China’s forest product export structure from a more microscopic perspective, inspired by Berman and Hericourt [60] and Minetti and Zhu [61], we decompose export trade into the expansion margin, price margin, and quantity margin from the product level, exploring the marginal utility of CSAPs on forest product export. In Table 6, columns (1)–(3) show the effects of CSAPs on the export expansion margin, price margin, and quantity margin of forest products, respectively. At the same time, considering that the BRI has strengthened and deepened trade exchanges between China and countries along the BRI, we set the dummy variable BRI to indicate whether the export destination country is a country along the BRI. If it is a country along the BRI, BRI = 1; otherwise, it is 0. Furthermore, the interaction term of difference-in-difference-in-difference (DDD) treat × post × BRI is added to model (1). The results are shown in column (4) of Table 6. Column (1) indicates that the coefficient of CSAPs on the export types of forest products in China is -0.0196, demonstrating statistical significance. This indicates that when China implements CSAPs, the number of types of forest product exports in China correspondingly decrease. One possible reason for this result is that CSAPs consider carbon sequestration efficiency, afforestation feasibility, and other carbon sequestration attributes, and mainly promote carbon-sequestering tree species such as the camphor tree, Schima superba, and Chinese fir. This leads to a concentration of corresponding forest product enterprise export types in carbon-sequestering tree-related products, resulting in a decrease in the number of forest product export types. Column (2) shows that the implementation of CSAPs can lead to an increase of 0.0509% in the export price of forest products, which is significant at the 1% confidence level. This may be due to the implementation of CSAPs, as it encourages forest product enterprises to obtain more profits through carbon sequestration market trading mechanisms and motivates enterprises to improve technology and product quality. It helps enterprises to achieve marginal price growth and gain international competitiveness. Column (3) shows that CSAPs have a positive impact on the marginal export quantity of forest products. This indicates that the implementation of CSAPs enhances the export competitiveness of forest products and increases export scale, which is similar to the results of Du and Li [62]. In summary, although the implementation of CSAPs significantly inhibits the marginal expansion of forest product exports, it has a significant promoting effect on the price and quantity margin of forest products export. CSAPs have a certain degree of optimization effect on the export structure of Chinese forest products. The result supports Hypothesis 2. The implementation of CSAPs improves the quality of China’s forest product export trade in more ways than by achieving the extensive growth model of expanding export volume.
Column (4) shows that the coefficient of treat × post is 0.096, and the coefficient of treat × post × BRI is 0.1852. This shows that the BRI has played a significant positive role in regulating the expansion of China’s forest product export driven by CSAPs. The result supports Hypothesis 2. This is consistent with Tian et al. [40], who state that the BRI will improve the infrastructure of countries along the BRI and bring about the growth of China’s net export. It can be seen that forest product export enterprises should focus on countries that have joined the BRI when choosing forest product export destination countries, so as to better take advantage of the expansion effect on export brought by CSAPs.
Maintaining stable export development is the foundation for achieving the sustainable development of forest product exports. Survival analysis usually uses survival or risk functions to describe the distribution characteristics of survival time. Therefore, we construct a survival function and export duration for enterprises, to examine whether CSAPs have a positive effect on the export duration of forest products.
Due to the fact that the Cox proportional risk model is mainly applied to continuous variables, when there are higher nodes, i.e., many enterprises have the same survival time, the estimation of this method will have significant errors. Therefore, we construct a discrete survival analysis model, the cloglog model, to estimate the impact of CSAPs on the export duration of forest product enterprises. The cloglog model for discrete data is set as follows:
cloglog 1 h it = β 0 + β 1 treat i post t + β X + τ t + δ t + θ d + μ h + ε idht
where h it represents the discrete time risk rate; the higher the enterprise risk rate cloglog 1 h it , the higher the probability of the enterprise exiting a certain export market, indicating that the trade relationship between the enterprise and its export market is maintained for a shorter period of time. X represents the set of control variables. Similar to the continuous time model, for the discrete event model, the export risk rate of a company depends on two parts: one is the same risk rate for all companies τ t , and the other part is the differences brought about by enterprise heterogeneity, set as fail.
In theory, we should control for the enterprise–product–destination country fixed effect, but the use of the clog log model in Stata greatly limits the large sample regression and therefore cannot control for individual fixed effects of enterprises. Thus, we construct the following model based on export duration:
Duration idht = β 0 + β 1 treat i × post t + β X idht + ε icht + δ t + θ idh + ε idht
where Duration represents the duration of the enterprise’s exports. β is the coefficient to be estimated, and X represents the set of control variables. We also control for enterprise–product–destination country fixed effects θ ich and fixed year effects δ t .
The discrete event model is a binary selection model, where each year’s data for a trade relationship are treated as an observation. If the duration of a trade relationship is complete, the last year’s fail (occurrence of a failed event) is assigned a value of 1, and the remaining years are assigned a value of 0. If the duration of a trade relationship is deleted, we assign a value of 0 to the annual failure of the trade relationship. Additionally, if the trade segment had not exited the export market by 2016, we assign a value of 0 to the annual fail. Besedeš and Prusa [63] showed that regardless of the same trade relationship going through multiple durations, the method of treating the first duration period as the only duration period is basically the same as treating multiple durations as independent durations. Therefore, we consider multiple durations of the same trade relationship as independent durations. From this, a total of 2,543,919 export duration periods are obtained for forest product exports from 2000 to 2016, set as Duration. The results are shown in Table 7. Columns (1)–(3) represent the results of model (3), and columns (4)–(5) represent the results of model (4).
From Table 7, it can be seen that CSAPs have a negative impact on the probability of exiting an export market determined by enterprise heterogeneity, which is significant at a 1% confidence level. Meanwhile, CSAPs have a significant positive impact on the export duration of enterprises. The results show that with the implementation of CSAPs, the trade relationship between forest product enterprises and their export market will be maintained for a longer time. By implementing environmental regulation, enterprises can upgrade their product quality to meet environmental standards, improve the international competitiveness of exported products, and extend the duration of product exports [64]. Therefore, these conclusions validate Hypothesis 3. The implementation of CSAPs reduces the risk of termination of trade relations among forest product export enterprises, and the risk of failure in trade relations will be lower, thus extending the duration of their exports.

5. Conclusions and Policy Suggestions

Forestry carbon sequestration is an important tool for China to respond to global climate change. As the main implementation object of forestry CSAPs, carbon sequestration projects can absorb CO2 in the atmosphere through afforestation, making contributions to China’s goal of “carbon neutrality” by 2060. As China is a major country in the global forest product production and import and export trades, studying the impact of CSAPs on forest product export can help improve relevant policies and help Chinese forestry enterprises achieve high-quality trade development. We employ the micro-data of forest products export enterprises provided by the Chinese Customs database to construct a time-varying DID model and examine the impact and heterogeneity of CSAPs on China’s forest product export.
We find that CSAPs have significantly increased China’s forest products export. The implementation of these projects has led to an increase of 0.0762% in forest products export. Moreover, there is significant regional, industry, trade pattern, enterprise ownership, and export-destination-country-related heterogeneity in the impact of CSAPs on China’s forest product export scale. The implementation of these projects has a significant promoting effect on the export scale of forest products for enterprises in the eastern and western regions, labor-intensive and resource-intensive enterprises, general trade enterprises, non-state-owned enterprises, and export destinations located in developing countries. On the contrary, it has a significant negative effect for enterprises in the central region, capital- and technology-intensive enterprises, processing and mixed trade enterprises, SOEs, and export destinations located in developed countries.
Further analysis reveals that although the implementation of CSAPs significantly reduces the different types of exported forest products, it has a significant promoting effect on the increase in export prices and the quantity of forest products to varying degrees. CSAPs have a certain degree of optimization effect on the export structure of forest products. The BRI has played a significant positive role in regulating the expansion of China’s forest product export scale driven by CSAPs. Moreover, these projects reduce the risk of termination of trade relations among forest product export enterprises, lower the risk of failure in trade relations, and prolong the export duration of forest product enterprises through CSAPs.
The conclusions provide inspiration for policy makers and forest product enterprise managers. Firstly, the Chinese government should continue to promote CSAPs and increase publicity efforts to improve the liquidity of CSAPs. They can establish a sound long-term and stable operation mechanism and carbon trading markets for these projects. Governors should establish information-based carbon-sink-trading platforms, and guide more enterprises to participate in CSAPs to realize coordinated development between environmental protection and trade transformation. Secondly, when considering the impact of CSAPs, forest product enterprises need to formulate different strategic guidelines based on their geographical location, dependence on production factor inputs, trade patterns, enterprise ownership, and product export destination countries. Enterprises should adjust their export policies and methods in cases where there may be negative impacts from policies in a timely manner, and leverage the positive impact of CSAPs. For example, the government assists private enterprises in optimizing the export market structure and expanding the export market of forest products in developing countries. Forestry enterprises need to transform trade patterns, encourage internal product upgrades and technological innovation, and enhance international market competition by climbing up the global value chain. Thirdly, guided by depth and quality, the Chinese government can consider deepening the terms of the BRI and FTA provisions, and carrying out high-quality international economic and trade cooperation in areas such as regional investment and service trade. When selecting destination countries for forest product exports, forest product export enterprises should focus on countries that have joined the BRI and trade partner countries that have signed FTAs with China. This way, enterprises can fully reduce trade costs, and better leverage the expansion effect of export brought by CSAPs.
China is in the stage of transitioning to a power-trading country, and it is worth conducting in-depth research on how to use CSAPs to improve the quality of China’s forest product exports. Moreover, as the BRI is proposed, China’s export market shows a trend of diversification. It is worth further exploring whether CSAPs can promote the export of forest products through export market diversification. This research will provide a reference for China and other developing countries to better use forestry-related environmental policies to boost export trade quality in the future.

Author Contributions

Conceptualization, X.G. and C.Z.; methodology, X.G.; software, X.G.; validation, X.G. and C.Z.; formal analysis, X.G.; resources, X.G.; data curation, X.G.; writing—original draft preparation, X.G.; writing—review and editing, C.Z.; visualization, C.Z.; supervision, C.Z.; project administration, X.G.; funding acquisition, X.G. All authors have read and agreed to the published version of the manuscript.

Funding

This research was funded by Hunan Natural Science Foundation Youth Project (grant number 2022JJ4088) and Hunan Provincial Education Department Scientific Research Excellent Youth Project (grant number 21B0272).

Data Availability Statement

The data presented in this study are available on request from the corresponding author. The data are not publicly available due to the data has been cleaned and processed by authors.

Conflicts of Interest

The authors declare no conflict of interest.

References

  1. Wu, J.; Hou, F.; Yu, W. The effect of carbon sink plantation projects on local economic growth: An empirical analysis of county-level panel data from Guangdong province. Sustainability 2021, 13, 13864. [Google Scholar] [CrossRef]
  2. Shi, Y.; Guan, Y.; Li, L.; Huang, M.R. Empirical analysis on the impacts of carbon sink afforestation project on county industrial structural upgrading. Alex. Eng. J. 2022, 61, 207–216. [Google Scholar] [CrossRef]
  3. Barbu, M.C.; Tudor, E.M. State of the art of the Chinese forestry, wood industry and its markets. Wood Mater. Sci. Eng. 2022, 17, 1030–1039. [Google Scholar] [CrossRef]
  4. Pop, R.A.; Dabija, D.C.; Pelău, C.; Dinu, V. Usage intentions, attitudes, and behaviors towards energy-efficient applications during the COVID-19 pandemic. J. Bus. Econ. Manag. 2022, 23, 668–689. [Google Scholar] [CrossRef]
  5. Nasrullah, M.; Chang, L.; Khan, K.; Rizwanullah, M.; Zulfiqar, F.; Ishfaq, M. Determinants of forest product group trade by gravity model approach: A case study of China. For. Policy Econ. 2020, 113, 102117. [Google Scholar] [CrossRef]
  6. Wu, H.; Wan, L.; Tian, H.; Zhang, Y. The ternary margins of China’s forest products export and their determinants. For. Policy Econ. 2021, 123, 102378. [Google Scholar] [CrossRef]
  7. Saraswati, R.I.; Harianto, H.; Rifin, A. Factors Affecting Forest Product Exports. J. Manag. Agribus. 2023, 20, 22. [Google Scholar] [CrossRef]
  8. Magezi, E.; Taner, O. Competitiveness analysis of forest products trade between Turkey and European Union countries. Turk. J. For. 2019, 20, 366–372. [Google Scholar] [CrossRef]
  9. Coelho, J.L.M.; Santos, H.F.; Soares, N.S. International competitiveness of exports of forest products. Ciência Rural 2023, 53, 20220137. [Google Scholar] [CrossRef]
  10. Su, H.; Hou, F.; Yang, Y.; Han, Z.; Liu, C. An assessment of the international competitiveness of China’s forest products industry. For. Policy Econ. 2020, 119, 102256. [Google Scholar] [CrossRef]
  11. Qiu, L.; Zeng, W.; Kant, S.; Wang, S. The Role of Social Capital in Rural Households’ Perceptions toward the Benefits of Forest Carbon Sequestration Projects: Evidence from a Rural Household Survey in Sichuan and Yunnan Provinces, China. Land 2021, 10, 91. [Google Scholar] [CrossRef]
  12. Guan, J.; Cao, Y.; Zhu, Z.; Zou, Y. Economic Value Evaluation and Sensitivity Analysis of Larch Carbon Sequestration Afforestation Project Based on B-S Option Pricing Theory. J. Arid Land Resour. Environ. 2020, 34, 63–70. [Google Scholar]
  13. Cao, X.; Zhang, Y. Analysis on Emission Reduction, Economic Value and Sensitivity of Yunnan Simao Pine Carbon Sink Afforestation Project. Ecol. Environ. Sci. 2017, 26, 234–242. (In Chinese) [Google Scholar]
  14. Jindal, R.; Kerr, J.M.; Carter, S. Reducing poverty through carbon forestry? Impacts of the N’hambita community carbon project in Mozambique. World Dev. 2012, 40, 2123–2135. [Google Scholar] [CrossRef]
  15. Beyene, A.D.; Bluffstone, R.; Mekonnen, A. Community forests, carbon sequestration and REDD+: Evidence from Ethiopia. Environ. Dev. Econ. 2016, 21, 249–272. [Google Scholar] [CrossRef]
  16. Ehrenstein, V. Carbon sink geopolitics. Econ. Soc. 2018, 47, 162–186. [Google Scholar] [CrossRef]
  17. Marques, A.; Martins, I.S.; Kastner, T.; Plutzar, C.; Theurl, M.C.; Eisenmenger, N.; Huijbregts, M.A.J.; Wood, R.; Stadler, K.; Bruckner, M.; et al. Increasing impacts of land use on biodiversity and carbon sequestration driven by population and economic growth. Nat. Ecol. Evol. 2019, 3, 628–637. [Google Scholar] [CrossRef]
  18. Zhang, Z.; Wan, X.; Sheng, K.; Sun, H.; Jia, L.; Peng, J. Impact of carbon sequestration by terrestrial vegetation on economic growth: Evidence from Chinese county satellite data. Sustainability 2023, 15, 1369. [Google Scholar] [CrossRef]
  19. Cai, X.; Lu, Y.; Wu, M.; Yu, L. Does environmental regulation drive away inbound foreign direct investment? Evidence from a quasi-natural experiment in China. J. Dev. Econ. 2016, 123, 73–85. [Google Scholar] [CrossRef]
  20. Diao, M.; Leonar, D.; Sing, T.F. Spatial-difference-in-differences models for impact of new mass rapid transit line on private housing values. Reg. Sci. Urban Econ. 2017, 67, 64–77. [Google Scholar] [CrossRef]
  21. Chen, Z.; Kahn, M.E.; Liu, Y.; Wang, Z. The consequences of spatially differentiated water pollution regulation in China. J. Environ. Econ. Manag. 2018, 88, 468–485. [Google Scholar] [CrossRef]
  22. Jia, R.; Shao, S.; Yang, L. High-speed rail and CO2 emissions in urban China: A spatial difference-in-differences approach. Energ. Econ. 2021, 99, 105271. [Google Scholar] [CrossRef]
  23. Pretis, F. Does a carbon tax reduce CO2 emissions? Evidence from British Columbia. Environ. Resour. Econ. 2022, 83, 115–144. [Google Scholar] [CrossRef]
  24. Gupta, S.; Montenovo, L.; Nguyen, T.; Lozano-Rojas, F.; Schmutte, I.; Simon, K.; Weinberg, B.A.; Wing, C. Effects of social distancing policy on labor market outcomes. Contemp. Econ. Policy 2023, 41, 166–193. [Google Scholar] [CrossRef]
  25. Berrone, P.; Fosfuri, A.; Gelabert, L. Necessity as the mother of ‘green’ inventions: Institutional pressures and environmental innovations. Strateg. Manag. J. 2013, 34, 891–909. [Google Scholar] [CrossRef]
  26. Yang, Y.; Miu, H.C.; Zeng, W.W.; Zhang, J. CCER Value Analysis: A Comprehensive Analysis of Forestry Carbon Sinks. Ind. Res. Rep. Hwabao Secur. 2021. [Google Scholar]
  27. He, Y.; Ren, Y. Can carbon sink insurance and financial subsidies improve the carbon sequestration capacity of forestry? J. Clean. Prod. 2023, 397, 136618. [Google Scholar] [CrossRef]
  28. O’Donnell, A.; Cummins, M.; Byrne, K.A. Forestry in the Republic of Ireland: Government policy, grant incentives and carbon sequestration value. Land Use Policy 2013, 35, 16–23. [Google Scholar] [CrossRef]
  29. España, F.; Arriagada, R.; Melo, O. Forest plantation subsidies: Impact evaluation of the Chilean case. Forest Policy Econ. 2022, 137, 102696. [Google Scholar] [CrossRef]
  30. van der Gaast, W.; Sikkema, R.; Vohrer, M. The contribution of forest carbon credit projects to addressing the climate change challenge. Clim. Policy 2018, 18, 42–48. [Google Scholar] [CrossRef]
  31. Parajuli, R.; Lamichhane, D.; Joshi, O. Does Nepal’s community forestry program improve the rural household economy? A cost–benefit analysis of community forestry user groups in Kaski and Syangja districts of Nepal. J. Forest. Res. 2015, 20, 475–483. [Google Scholar] [CrossRef]
  32. Li, L.; Li, F.; Tao, C.; Cheng, B. The impact of spatial agglomeration on export of forest products manufacturing in China: Evidence from enterprises’ data. J. Sustain. For. 2019, 38, 743–754. [Google Scholar] [CrossRef]
  33. Zhou, C. Can FDI and industrial agglomeration help to improve the international competitiveness: An empirical research on China’s manufacturing industries based on panel-VAR model. Econ. Theory Bus. Manag. 2016, 10, 56–69. (In Chinese) [Google Scholar]
  34. Hu, Y.; Zeng, W. Does the carbon sink afforestation project promote local economic development?—An empirical study of PSM-DID based on Sichuan county panel data. China Popul. Resour. Environ. 2020, 30, 89–98. (In Chinese) [Google Scholar]
  35. Chen, X.; He, J.; Qiao, L. Does environmental regulation affect the export competitiveness of Chinese firms? J. Environ. Manag. 2022, 317, 115199. [Google Scholar] [CrossRef] [PubMed]
  36. Zhang, H.; Xu, K. Impact of environmental regulation and technical progress on industrial carbon productivity: An approach based on proxy measure. Sustainability 2016, 8, 819. [Google Scholar] [CrossRef]
  37. Dong, G.; Kokko, A.; Zhou, H. Innovation and export performance of emerging market enterprises: The roles of state and foreign ownership in China. Int. Bus. Rev. 2022, 31, 102025. [Google Scholar] [CrossRef]
  38. Zheng, L.; Zhao, Y.; Shi, Q.; Qian, Z.; Wang, S.; Zhu, J. Global value chains participation and carbon emissions embodied in exports of China: Perspective of firm heterogeneity. Sci. Total Environ. 2022, 813, 152587. [Google Scholar] [CrossRef]
  39. Ma, X.; Xie, W. Destination country financial development and margins of international trade. Econ. Lett. 2019, 177, 99–104. [Google Scholar] [CrossRef]
  40. Tian, X.; Hu, Y.; Yin, H.; Geng, Y.; Bleischwitz, R. Trade impacts of China’s Belt and Road Initiative: From resource and environmental perspectives. Resour. Conserv. Recycl. 2019, 150, 104430. [Google Scholar] [CrossRef]
  41. Sun, C.; Zhang, X. Duration of US forest products trade. For. Policy Econ. 2018, 95, 57–68. [Google Scholar] [CrossRef]
  42. Long, C.; Zhang, X. Cluster-based industrialization in China: Financing and performance. J. Int. Econ. 2011, 84, 112–123. [Google Scholar] [CrossRef]
  43. Martincus, C.V.; Carballo, J. Is export promotion effective in developing countries? Firm-level evidence on the intensive and the extensive margins of exports. J. Int. Econ. 2008, 76, 89–106. [Google Scholar] [CrossRef]
  44. Koopman, R.; Wang, Z.; Wei, S.J. Estimating domestic content in exports when processing trade is pervasive. J. Dev. Econ. 2012, 99, 178–189. [Google Scholar] [CrossRef]
  45. Vicard, V. On trade creation and regional trade agreements: Does depth matter? Rev. World Econ. 2009, 145, 167–187. [Google Scholar] [CrossRef]
  46. Harada, K.; Nishitateno, S. Measuring trade creation effects of free trade agreements: Evidence from wine trade in East Asia. J. Asian Econ. 2021, 74, 101308. [Google Scholar] [CrossRef]
  47. Rob, R.; Vettas, N. Foreign direct investment and exports with growing demand. Rev. Econ. Stud. 2003, 70, 629–648. [Google Scholar] [CrossRef]
  48. Nguyen, D.X. Demand uncertainty: Exporting delays and exporting failures. J. Int. Econ. 2012, 86, 336–344. [Google Scholar] [CrossRef]
  49. Rodrik, D. What’s so special about China’s exports? China World Econ. 2006, 14, 1–19. [Google Scholar] [CrossRef]
  50. Portugal-Perez, A.; Wilson, J.S. Export performance and trade facilitation reform: Hard and soft infrastructure. World Dev. 2012, 40, 1295–1307. [Google Scholar] [CrossRef]
  51. Clarke, G.R.G.; Wallsten, S.J. Has the internet increased trade? Developed and developing country evidence. Econ. Inq. 2006, 44, 465–484. [Google Scholar] [CrossRef]
  52. Mathews, S.; Healy, M.; Wickramasekera, R. The Internetalisation of information, knowledge, and interaction components of the firm’s internationalisation process. J. Market Manag. 2012, 28, 733–754. [Google Scholar] [CrossRef]
  53. Trejos, S.; Barboza, G. Dynamic estimation of the relationship between trade openness and output growth in Asia. J. Asian Econ. 2015, 36, 110–125. [Google Scholar] [CrossRef]
  54. Huchet-Bourdon, M.; Le Mouël, C.; Vijil, M. The relationship between trade openness and economic growth: Some new insights on the openness measurement issue. World Econ. 2018, 41, 59–76. [Google Scholar] [CrossRef]
  55. Culas, R.J. Deforestation and the environmental Kuznets curve: An institutional perspective. Ecol. Econ. 2007, 61, 429–437. [Google Scholar] [CrossRef]
  56. Wu, X.; Wang, S.; Fu, B.; Liu, Y.; Zhu, Y. Land use optimization based on ecosystem service assessment: A case study in the Yanhe watershed. Land Use Policy 2018, 72, 303–312. [Google Scholar] [CrossRef]
  57. Konu, H. Developing a forest-based wellbeing tourism product together with customers—An ethnographic approach. Tour. Manag. 2015, 49, 1–16. [Google Scholar] [CrossRef]
  58. Song, Y.; Hao, X.; Zheng, L. Intermediate import, independent innovation and export sophistication of Chinese manufacturing enterprises. Struct. Change Econ. D 2022, 60, 126–140. [Google Scholar] [CrossRef]
  59. Deng, Y.; Wu, Y.; Xu, H. On the relationship between pollution reduction and export product quality: Evidence from Chinese firms. J. Environ. Manag. 2021, 281, 111883. [Google Scholar] [CrossRef]
  60. Berman, N.; Héricourt, J. Financial factors and the margins of trade: Evidence from cross-country firm-level data. J. Dev. Econ. 2010, 93, 206–217. [Google Scholar] [CrossRef]
  61. Minetti, R.; Zhu, S.C. Credit constraints and firm export: Microeconomic evidence from Italy. J. Int. Econ. 2011, 83, 109–125. [Google Scholar] [CrossRef]
  62. Du, W.; Li, M. Influence of environmental regulation on promoting the low-carbon transformation of China’s foreign trade: Based on the dual margin of export enterprise. J. Clean. Prod. 2020, 244, 118687. [Google Scholar] [CrossRef]
  63. Besedeš, T.; Prusa, T.J. Product differentiation and duration of US import trade. J. Int. Econ. 2006, 70, 339–358. [Google Scholar] [CrossRef]
  64. Li, M.; Du, W. Environmental Regulation and Enterprise Export Product Quality: Analysis Based on Institutional Environment and Export Duration. R D Manag. 2018, 30, 111–120. (In Chinese) [Google Scholar]
Figure 1. Parallel trend test.
Forests 14 01667 g001
Table 1. Descriptive statistics of data.
VariablesDefinitionNMeanSdMinMax
lnexportExport of forest products4.903 × 1068.4262.7580.69319.02
treat × postWhether to implement CSAPs4.903 × 1060.01340.11501
SOEDummy variable of enterprise ownership structure4.903 × 1060.1770.38201
GeneralDummy variable of trade pattern4.903 × 1060.6790.46701
lnWGDPPer capita GDP of the export destination country4.868 × 1069.9151.1624.59412.22
lnforestForest utilization ratio4.903 × 1060.8060.08130.2850.937
lnpgdpRegional per capita GDP4.900 × 10610.770.7334.59513.06
lntransTransport infrastructure level4.903 × 106−0.03120.462−3.7122.520
lninternetNumber of internet users4.903 × 1063.2691.142−5.1095.904
lnopenTrade openness4.903 × 1061.5741.268−1.6443.703
FTADummy variable of export destination country signing a free-trade agreement with China4.903 × 1060.1900.39201
Table 2. Variable correlations test.
exporttreat × postSOEGeneralWGDPForestpgdplntranslninternetlnopenfta
export1.0000
treat × post0.01171.0000
SOE0.1162−0.04681.0000
General−0.0921−0.01530.02791.0000
lnWGDP0.0359−0.02180.02760.00421.0000
lnforest0.0326−0.02300.00290.00560.24141.0000
lnpgdp−0.0987−0.0950−0.0867−0.0832−0.02020.04331.0000
lntrans−0.0711−0.0585−0.1405−0.0762−0.04170.01950.25991.0000
lninternet−0.1393−0.1020−0.0596−0.08350.01120.05950.34340.30571.0000
lnopen−0.0249−0.16380.1288−0.03630.06840.08970.42770.07270.28971.0000
fta−0.02910.0989−0.1172−0.0375−0.01020.06150.18020.09740.12130.01901.0000
Table 3. Results of basic regression.
(1)(2)(3)(4)
treat × post0.1263 ***0.0986 ***0.1420 ***0.0762 **
(0.0358)(0.0356)(0.0358)(0.0357)
SOE 0.4856 ***0.2473 ***
(0.0379)(0.0381)
General −0.0918 ***−0.1042 ***
(0.0025)(0.0026)
FTA 0.1497 ***0.1437 ***
(0.0027)(0.0027)
lnWGDP 0.0809 ***0.0790 ***
(0.0010)(0.0010)
lnpgdp −0.2546 ***0.0116 *
(0.0047)(0.0068)
lntrans −0.4041 ***−0.0090
(0.0070)(0.0101)
lninternet 0.0079 ***0.0030
(0.0022)(0.0024)
lnopen 0.0208 ***0.0206 ***
(0.0034)(0.0054)
lnforest −0.8948 ***0.2513 ***
(0.0622)(0.0828)
Constant8.4433 ***8.4403 ***10.8909 ***7.2026 ***
(0.0010)(0.0010)(0.0547)(0.0957)
Enterprise fixed effectYesYesYesYes
Product fixed effectYesYesYesYes
Country fixed effectYesYesYesYes
Year fixed effectNoYesNoYes
Observations4,830,6574,865,8214,826,4804,826,480
R-squared0.45680.46300.46170.4656
Notes: *, **, and *** indicate statistical significance at 10%, 5%, and 1%, respectively. The values in parentheses are standard error.
Table 4. Results of heterogeneity analysis.
(1)(2)(3)(4)(5)
treat × post0.5383 ***0.4398 ***0.1232 ***0.4777 ***0.1249 ***
(0.0205)(0.0398)(0.0363)(0.0100)(0.0372)
middle × treat × post−0.1269 ***
(0.0234)
west × treat × post0.0939 **
(0.0414)
source × treat × post 0.4929 ***
(0.0803)
capital × treat × post −0.8746 ***
(0.0365)
process × treat × post −0.1323 ***
(0.0215)
mixed × treat × post −0.1525 ***
(0.0281)
soe × treat × post −0.8922 ***
(0.0619)
dev × treat × post −0.0842 ***
(0.0182)
SOE0.3002 ***0.2476 ***0.2480 ***0.3023 ***0.2472 ***
(0.0031)(0.0381)(0.0381)(0.0031)(0.0381)
General−0.7203 ***−0.1041 ***−0.1065 ***−0.7203 ***−0.1042 ***
(0.0025)(0.0026)(0.0026)(0.0025)(0.0026)
FTA0.0876 ***0.1437 ***0.1437 ***0.0878 ***0.1436 ***
(0.0029)(0.0027)(0.0027)(0.0029)(0.0027)
lnWGDP0.1186 ***0.0789 ***0.0790 ***0.1186 ***0.0794 ***
(0.0010)(0.0010)(0.0010)(0.0010)(0.0010)
lnpgdp0.3923 ***0.0112 *0.0118 *0.3918 ***0.0116 *
(0.0031)(0.0068)(0.0068)(0.0031)(0.0068)
lntrans0.1762 ***−0.0084−0.00940.1759 ***−0.0090
(0.0029)(0.0101)(0.0101)(0.0029)(0.0101)
lninternet−0.3124 ***0.00280.0030−0.3126 ***0.0030
(0.0017)(0.0024)(0.0024)(0.0017)(0.0024)
lnopen−0.0783 ***0.0199 ***0.0207 ***−0.0776 ***0.0207 ***
(0.0018)(0.0054)(0.0054)(0.0018)(0.0054)
lnforest0.8433 ***0.2831 ***0.2534 ***0.8233 ***0.2498 ***
(0.0148)(0.0828)(0.0828)(0.0148)(0.0828)
Constant3.8581 ***7.1881 ***7.2000 ***3.8789 ***7.2003 ***
(0.0342)(0.0957)(0.0957)(0.0341)(0.0957)
Enterprise fixed effectYesYesYesYesYes
Product fixed effectYesYesYesYesYes
Country fixed effectYesYesYesYesYes
Year fixed effectYesYesYesYesYes
Observations4,863,9634,826,4804,826,4804,863,9634,826,480
R-squared0.23220.46570.46560.23220.4656
Notes: *, **, and *** indicate statistical significance at 10%, 5%, and 1%, respectively. The values in parentheses are standard error.
Table 5. Results of robustness test.
(1)(2)(3)
treat × post0.1403 ***0.1201 ***0.0770 **
(0.0436)(0.0439)(0.0352)
SOE0.59700.3251 ***0.2475 ***
(0.8806)(0.0417)(0.0376)
General−0.0934 ***−0.1277 ***−0.1013 ***
(0.0028)(0.0032)(0.0025)
FTA0.1494 ***0.2082 ***0.1401 ***
(0.0030)(0.0034)(0.0026)
lnWGDP0.0944 ***0.1153 ***0.0784 ***
(0.0011)(0.0012)(0.0010)
lnpgdp0.00020.0360 ***0.0101
(0.0070)(0.0077)(0.0080)
lntrans0.0400 ***0.0369 ***−0.0090
(0.0112)(0.0119)(0.0104)
lninternet0.0098 ***0.0063 **−0.0014
(0.0029)(0.0029)(0.0027)
lnopen0.0157 ***0.0249 ***0.0213 ***
(0.0059)(0.0065)(0.0054)
lnforest0.03260.3842 ***0.2771 ***
(0.1022)(0.1012)(0.0821)
Constant7.3753 ***6.5361 ***7.2158 ***
(0.1992)(0.1146)(0.1032)
Enterprise fixed effectYesYesYes
Product fixed effectYesYesYes
Country fixed effectYesYesYes
Year fixed effectYesYesYes
Observations3,967,5953,237,7004,826,480
R-squared0.47560.50060.4658
Notes: **, and *** indicate statistical significance at 5%, and 1%, respectively. The values in parentheses are standard error.
Table 6. Results of the trade triple margin and BRI.
(1)(2)(3)(4)
treat × post−0.0196 ***0.0509 ***0.0389 ***0.0960 ***
(0.0063)(0.0189)(0.0100)(0.0365)
treat × post × BRI 0.1852 ***
(0.0182)
BRI 0.1221 ***
(0.0245)
General0.1181 ***−0.00140.1115 ***0.4784 ***
(0.0067)(0.0201)(0.0030)(0.0384)
FTA0.0072 ***0.0022−0.4108 ***−0.0921 ***
(0.0005)(0.0014)(0.0024)(0.0025)
lnWGDP−0.0019 ***−0.0219 ***0.1132 ***0.1519 ***
(0.0005)(0.0015)(0.0028)(0.0027)
lnpgdp−0.0020 ***0.0474 ***−0.0122 ***0.0824 ***
(0.0002)(0.0005)(0.0010)(0.0010)
lntrans0.0149 ***−0.0326 ***−0.1606 ***−0.2607 ***
(0.0012)(0.0036)(0.0029)(0.0048)
lninternet0.0112 ***−0.0986 ***−0.0530 ***−0.4045 ***
(0.0018)(0.0054)(0.0028)(0.0071)
lnopen0.0137 ***−0.0074 ***−0.00070.0088 ***
(0.0004)(0.0013)(0.0016)(0.0022)
lnforest0.0428 ***−0.0159 ***0.0029 *0.0270 ***
(0.0010)(0.0029)(0.0017)(0.0034)
Constant0.1278 ***−0.4190 ***0.7440 ***−0.9144 ***
General(0.0146)(0.0439)(0.0142)(0.0628)
1.7611 ***1.1095 ***8.4214 ***10.9175 ***
(0.0169)(0.0506)(0.0324)(0.0553)
Enterprise fixed effectYesYesYesYes
Product fixed effectYesYesYesYes
Country fixed effectYesYesYesYes
Year fixed effectYesYesYesYes
Observations4,842,2994,608,2164,720,5924,842,297
R-squared0.90810.49850.22530.4623
Notes: * and *** indicate statistical significance at 10% and 1%, respectively. The values in parentheses are standard error.
Table 7. Impact of carbon sink afforestation projects on the duration of forest product trade exports.
FailFailFailDurationDurationDuration
(1)(2)(3)(4)(5)(6)
treat × post−0.1546 ***−0.1694 ***−0.0455 ***0.1958 ***0.1974 ***0.2008 ***
(0.0067)(0.0069)(0.0074)(0.0245)(0.0245)(0.0245)
General −0.3351 ***−0.3217 *** −0.5622 ***−0.5462 ***
(0.0022)(0.0023) (0.0262)(0.0262)
FTA 0.1392 ***0.1145 *** 0.1465 ***0.1487 ***
(0.0015)(0.0015) (0.0018)(0.0018)
lnWGDP −0.0691 ***−0.0668 *** 0.0347 ***0.0342 ***
(0.0018)(0.0018) (0.0018)(0.0018)
lnpgdp −0.1202 ***−0.1192 *** 0.0843 ***0.0843 ***
(0.0006)(0.0006) (0.0007)(0.0007)
lntrans −0.2324 *** −0.0010
(0.0024) (0.0046)
lninternet −0.3006 *** 0.2108 ***
(0.0031) (0.0070)
lnopen 0.1736 *** 0.0134 ***
(0.0013) (0.0016)
lnforest −0.1095 *** −0.0632 ***
(0.0014) (0.0037)
Constant 1.7707 *** 0.4070 ***
General (0.0400) (0.0569)
−0.1569 ***1.1749 ***2.3272 ***1.8598 ***0.9994 ***0.7405 ***
(0.0561)(0.0570)(0.0645)(0.0007)(0.0081)(0.0658)
Product fixed effectYESYESYESYESYESYES
Country fixed effectYESYESYESNONONO
Year fixed effectYESYESYESYESYESYES
Enterprise fixed effectNONONOYESYESYES
Observations4,112,7184,083,0404,082,7954,865,8234,830,6594,826,482
R-squared——————0.36370.36690.3670
Notes: *** indicates statistical significance at 1%. The values in parentheses are standard error.
Disclaimer/Publisher’s Note: The statements, opinions and data contained in all publications are solely those of the individual author(s) and contributor(s) and not of MDPI and/or the editor(s). MDPI and/or the editor(s) disclaim responsibility for any injury to people or property resulting from any ideas, methods, instructions or products referred to in the content.

