Article

A Framework for Assessing Trade-Offs and Synergies in Green Space System Services Based on Ecosystem Services Bundles

1
School of Architecture and Urban Planning, Guangdong University of Technology, Guangzhou 510090, China
2
Landscape Planning and Ecological Restoration Research Center, Guangdong University of Technology, Guangzhou 510090, China
*
Author to whom correspondence should be addressed.
Forests 2023, 14(8), 1614; https://doi.org/10.3390/f14081614
Submission received: 4 July 2023 / Revised: 30 July 2023 / Accepted: 8 August 2023 / Published: 10 August 2023
(This article belongs to the Topic Urban Forestry and Sustainable Environments)

Abstract

:
Urban green and blue spaces (UGBS) take on critical significance in urban development. In this study, the physical characteristics and landscape-ecology-society-space (LESS) system services of 24 urban parks in 2 greenbelts surrounding Foshan City are analyzed. Five service bundles are proposed based on the four systems, comprising landscape-ecological-social-spatial-composite driving bundles. Subsequently, the trade-offs and synergies (TOS) of the four systems are assessed through principal component analysis (PCA), a self-organization neural network model (SOM), and geographically weighted regression (GWR). As indicated by the results, a high trade-off relationship is identified between the landscape and ecology systems, as well as a low synergy relationship between the ecology system and the society system. Furthermore, there are structural differences in the physical characteristics of the parks in the greenbelts surrounding the city, with parks in the inner ring having higher social and spatial effects, while parks in the outer ring have higher landscape and ecological effects. Lastly, recommendations are presented for planning UGBS around the city. In this study, a feasible framework is developed to achieve high-quality urban living environments based on the multi-objective balanced strategies for UGBS.

1. Introduction

Urban green and blue spaces (UGBS) provide ecosystem services that enhance human health and well-being [1]. It is noteworthy that the greenbelt around the city has progressively stressed the essential role in the structure of urban natural environments and green spaces, which can contribute to human health, biodiversity, ecosystem services, and economic development [2,3]. An urban greenbelt is a designated open space surrounding or in a city, serving as a buffer to prevent sprawl and maintain ecological balance [4,5].
Moreover, there has been growing attention on the role of UGBS in addressing a range of societal challenges, such as climate change, global warming, water scarcity, and air pollution [6,7]. Several global organizations have proposed solutions to the conflict between urban green spaces and human needs [8]. UN Sustainable Development Goal No. 11 aims at making cities and human settlements inclusive, safe, resilient, and sustainable [9]. It has been suggested by the World Health Organization that green cities be developed that provide citizens with green spaces as a top priority [10]. Accordingly, the protection and restoration of the ecological system should be considered based on the synergy of multiple systems, especially ecological and social systems [11].
However, existing research has placed a focus on the disturbance issues of natural space and the social system separately, and the inherent mechanism of the multiple systems involved has been rarely investigated [12]. Focusing on a single ecological environmental impact perspective, several previous studies have ignored the social spatial effects exerted by human behavior disturbances (e.g., social reconstruction, spatial differentiation, feature evolution, and vitality enhancement) [13,14]. To ensure the sustainable development of urban ecological space and harmonize the interests of nature and society, it is essential to thoroughly examine the underlying impact mechanisms in the city’s ecological environment. Simultaneously, a comprehensive investigation into the trade-offs and synergies between nature and society should be conducted, allowing for informed decision-making and effective planning strategies.
UGBS system services can adopt bundle algorithms to identify regions or features in the system that have similar system services characteristics. In general, bundle algorithms refer to clusters of ecosystem services, which are combinations of ecosystem services characterizing the trade-offs and synergies among ecosystem services and can lay a scientific basis for the development of effective regional socio-ecosystem management programs. Self-Organizing Map (SOM) applies to bundles and visualization of high-dimensional datasets [15]. It forms a topological structure neural network by mapping the complex and high-dimensional data into a lower-dimensional space, where each dimension represents a specific variable or feature. Thus, similar data can be grouped together, such that the data can be more easily visualized and analyzed. It has been extensively employed in the fields of geographic information science and land system science, including for the classification of land systems [16], the analysis of user’s behavior in urban parks to identify different types of users and usage patterns [17], and the study of the synergistic effects of green infrastructure on environmental justice and relationships in urban areas [18]. Furthermore, geographically weighted regression (GWR) refers to a regression analysis method based on geographic location weights that is used to analyze the spatial heterogeneity and non-stationarity of spatial data [19], including the provision of water resources, air quality regulation, and biodiversity conservation [20,21].
In accordance with the theoretical concepts of trade-offs and synergies of ecosystem services, the social-ecological systems framework is optimized, combining two models (i.e., SOM and GWR). The synergies and trade-offs between different UGBS systems can be explored by integrating the basic characteristics of landscape pattern [22], ecological effects [23], social effects [24], and spatial effects [25] in green spaces, leading to more effective and sustainable urban planning and management. UGBS refers to a complex system comprising interactions and feedbacks between ecological processes, social dynamics, and spatial configurations. The landscape-ecology-society-space (LESS) framework acknowledges the significance of considering ecological functions, social values, and spatial organization jointly to gain more insights into the role and significance of UGBS in urban environments. The above-described method involves using several techniques (e.g., feature recognition, mechanism exploration, mechanism construction, and strategy development). Using the LESS framework, this study should conform to the requirements of multi-objective balanced planning, and four systems should be managed and balanced to achieve the optimal output of green and blue areas for their services.
In this study, a framework is developed for the investigation of the interactions among landscape, ecology, society, and space systems. A total of 24 parks in 2 greenbelts around Foshan City are selected as the experimental area. In general, this study aims at (1) developing a framework for combining multiple system services to identify a balanced and synergistic relationship, (2) examining the inherent characteristics of dominant bundles to determine the disturbance mechanism of four systems of the UGBS around the city, (3) exploring whether differences exist in the spatial structure characteristics between the inner and outer rings in the greenbelt, and (4) discussing the potential effects on the urban area and the corresponding strategies, such that high-quality development can be achieved by optimizing multiple objectives based on the LESS system.

2. Research Area and Data

2.1. Research Area

Following the Foshan Territorial Spatial Master Plan (2020–2035), two park rings are planned to be constructed on the greenbelt around the city, i.e., Thousand-Acre Ecological Park Ring and Ten-Thousand-Acre Forest Ring, which play essential roles in improving the city’s ecological environment and providing recreational opportunities for citizens. The Thousand-Acre Ecological Park Ring is located on the inner ring that surrounds Foshan City, and the Ten-Thousand-Acre Forest Ring is located on the outer ring. In addition to providing excellent recreational spaces for citizens, the Thousand-Acre Ecological Park Ring is part of the city’s green infrastructure, which is conducive to protecting the ecosystem, regulating the city’s climate, providing diverse ecosystem services, and enhancing the city’s image. Moreover, the Ten-Thousand-Acre Forest Ring lies on the outer belt of the urban greenbelt, which encompasses several towns in the northern part of Foshan (e.g., Nanzhuang, Lishui, Leping, and Xingtang). The parks on this outer ring are rich in natural resources and healthy ecosystems.
In general, the structure of UGBS in Foshan is conducive to alleviating urban environmental problems. To study the landscape, ecological, social, and spatial effects and service values of Foshan UGBS in depth, 24 parks are selected from 2 greenbelts around the city as the samples for the study (Figure 1).

2.2. Research Data Sources

To examine the landscape patterns of urban parks in two greenbelts (Table 1), the land cover information of the parks from Google Earth is acquired using high-resolution remote sensing data with a spatial resolution of 0.5 m. The data are interpreted using object-oriented segmentation and classification techniques. Land cover is classified into five classes (i.e., forest, grass, water, bare land, and impervious surface). A total of 50 verification points are randomly selected in the respective category through the visual interpretation of remote sensing images to determine the practical land cover types. The overall accuracy and kappa coefficient of the remote sensing interpretation are calculated using a confusion matrix, and the respective park achieves 85% or greater [26]. The above-mentioned landscape indexes are obtained using Fragstats software 4.0 [27], i.e., a software capable of performing landscape pattern index calculations. This software is capable of calculating a variety of indexes at the patch level, type level, and landscape level. There are several landscape indexes employed in the study (e.g., landscape density, landscape shape index, aggregation index, Shannon diversity index, and Shannon evenness index) [28].
To measure the ecological effect of the parks in two greenbelts, ecological remote sensing data are combined to measure the NDVI, LST, WET, and NDBSI of the parks [29]. The NDVI index is adopted in Landset 8 to reflect vegetation cover and growth status, as well as to assess the quality and ecological environment of urban green spaces. The land surface temperature index (LST) refers to one of the methods for measuring surface temperature, suggesting the surface temperature [30]. The WET index represents the relative humidity in the air; the higher the value, the more water vapor will be present. The dryness index is obtained by determining the normalized difference bare soil index (NDBSI), which represents the surface bareness and the density of the building.
In addition, some indexes are used to reflect the social attributes of the parks. These indexes include the density of the population around the park and the number and density of points of public transportation stations, shopping services, restaurant services, and entertainment services. In this study, social characteristics information of the parks in a 30 min walking distance were selected. Lastly, the spatial characteristics of the parks were analyzed from five aspects, i.e., the border frontage rate, green barrier rate, blocking wall rate, boundary waterfront rate, and boundary openness rate.
Overall, these multidimensional features of the landscape-ecology-society-space (LESS) system can be used to understand the design and usage of these parks and provide recommendations for improvement.
Table 1. Index calculation method of four systems.
CategoryIndexAbbreviationFormulaUnitReference
Landscape pattern indexTotal areaTATA = A/NPKm2[31]
Number of patchesNPThe number of patchesNumber[26,32]
Landscape Shape IndexLSILSI = 4 × π × patch area/square of patch circumference-[32,33]
CONTAGCONTAGCONTAG = SUM ((pi × pj × dij)/(pi + pj − pi × pj))%[34,35]
Interspersion juxtaposition indexIJIIJI = SUM [(a × dij)/(1 + b × dij)]%[33]
Shannon’s diversity indexSHDI S H D I = I = 1 M ( p i l n p i ) -[26,28]
Shannon’s evenness indexSHEI E = H H m a x = k = 1 m P k ln   ( P k ) ln   ( m ) [0, 1][28,32,36]
Aggregation indexAI A I = g i i m a x g i i × 100 % -[33,34]
Ecological effect indexNormalized differential vegetation indexNDVINDVI = (ρNIR – ρred)/(ρNIR + ρred)[−1, 1][37,38]
Land surface temperatureLSTL6 = gain × ND + bias
T = K2/ln(K1/L6 + 1)
LST = T/[1 + (λT/ρ) lnε]
Degree[30,39]
Wetness indexWETWet = 0.0315ρblue + 0.2021ρgreen + 0.3102ρred + 0.1594ρNIR − 0.6806ρSWIR1 − 0.6109ρSWIR2-[39,40]
Normalized differential build-up and bare soil index(NDBSI)NDBSI = (SI + IBI)/2
SI = [(ρSWIR1 + ρred) − (ρblue + ρNIR)]/[(ρSWIR1 + ρred) + (ρblue + ρNIR)]
IBI = [2ρSWIR1/(ρSWIR1 + ρNIR) − (ρNIR/(ρNIR + ρred) − ρgreen/(ρgreen + ρSWIR1)]/[2ρSWIR1/(ρSWIR1 + ρNIR) + ρNIR/(ρNIR + ρred) + ρgreen/(ρgreen + ρSWIR1)]
[−1, 1][41]
Social effect indexPopulation density of service areaPODPermanent population densityNumber/km2[42,43]
Bus station densityBDBus station density = number of bus stations/half hour reachable areaNumber/km2[44]
Parking densityPADParking lot density = number of parking lots/half hour reachable areaNumber/km2[44,45]
Shopping densitySDShopping density/half hour reachable areaNumber/km2[46]
Restaurant densityRDRestaurant density = number of restaurants/half hour reachable areaNumber/km2[47]
Leisure and entertainment densityLDLeisure and entertainment density = quantity of leisure and entertainment/area reachable in half an hourNumber/km2[47]
Tourism accommodation densityTDTourism accommodation density = number of tourism accommodations/half hour reachable areaNumber/km2[48]
Reachable area in half an hourRAThe range that the public can reach by walking for half an hour based on the density of the road networkKm2[43,46]
Spatial effect indexBorder frontage rateBFRBoundary frontage ratio = boundary frontage length/patch perimeter%[25]
Green barrier rateGBRGreen barrier rate = transparent green wall length/patch perimeter%[49,50]
Blocking wall rateBWRBlocking wall rate = sealing wall length/patch perimeter%[49]
Boundary waterfront rateBRBoundary waterfront rate = boundary waterfront length/patch perimeter%[45]
Boundary openness rateBORBoundary openness = entrance length/patch perimeter%[25]

3. Methods

3.1. Study Design and Setting

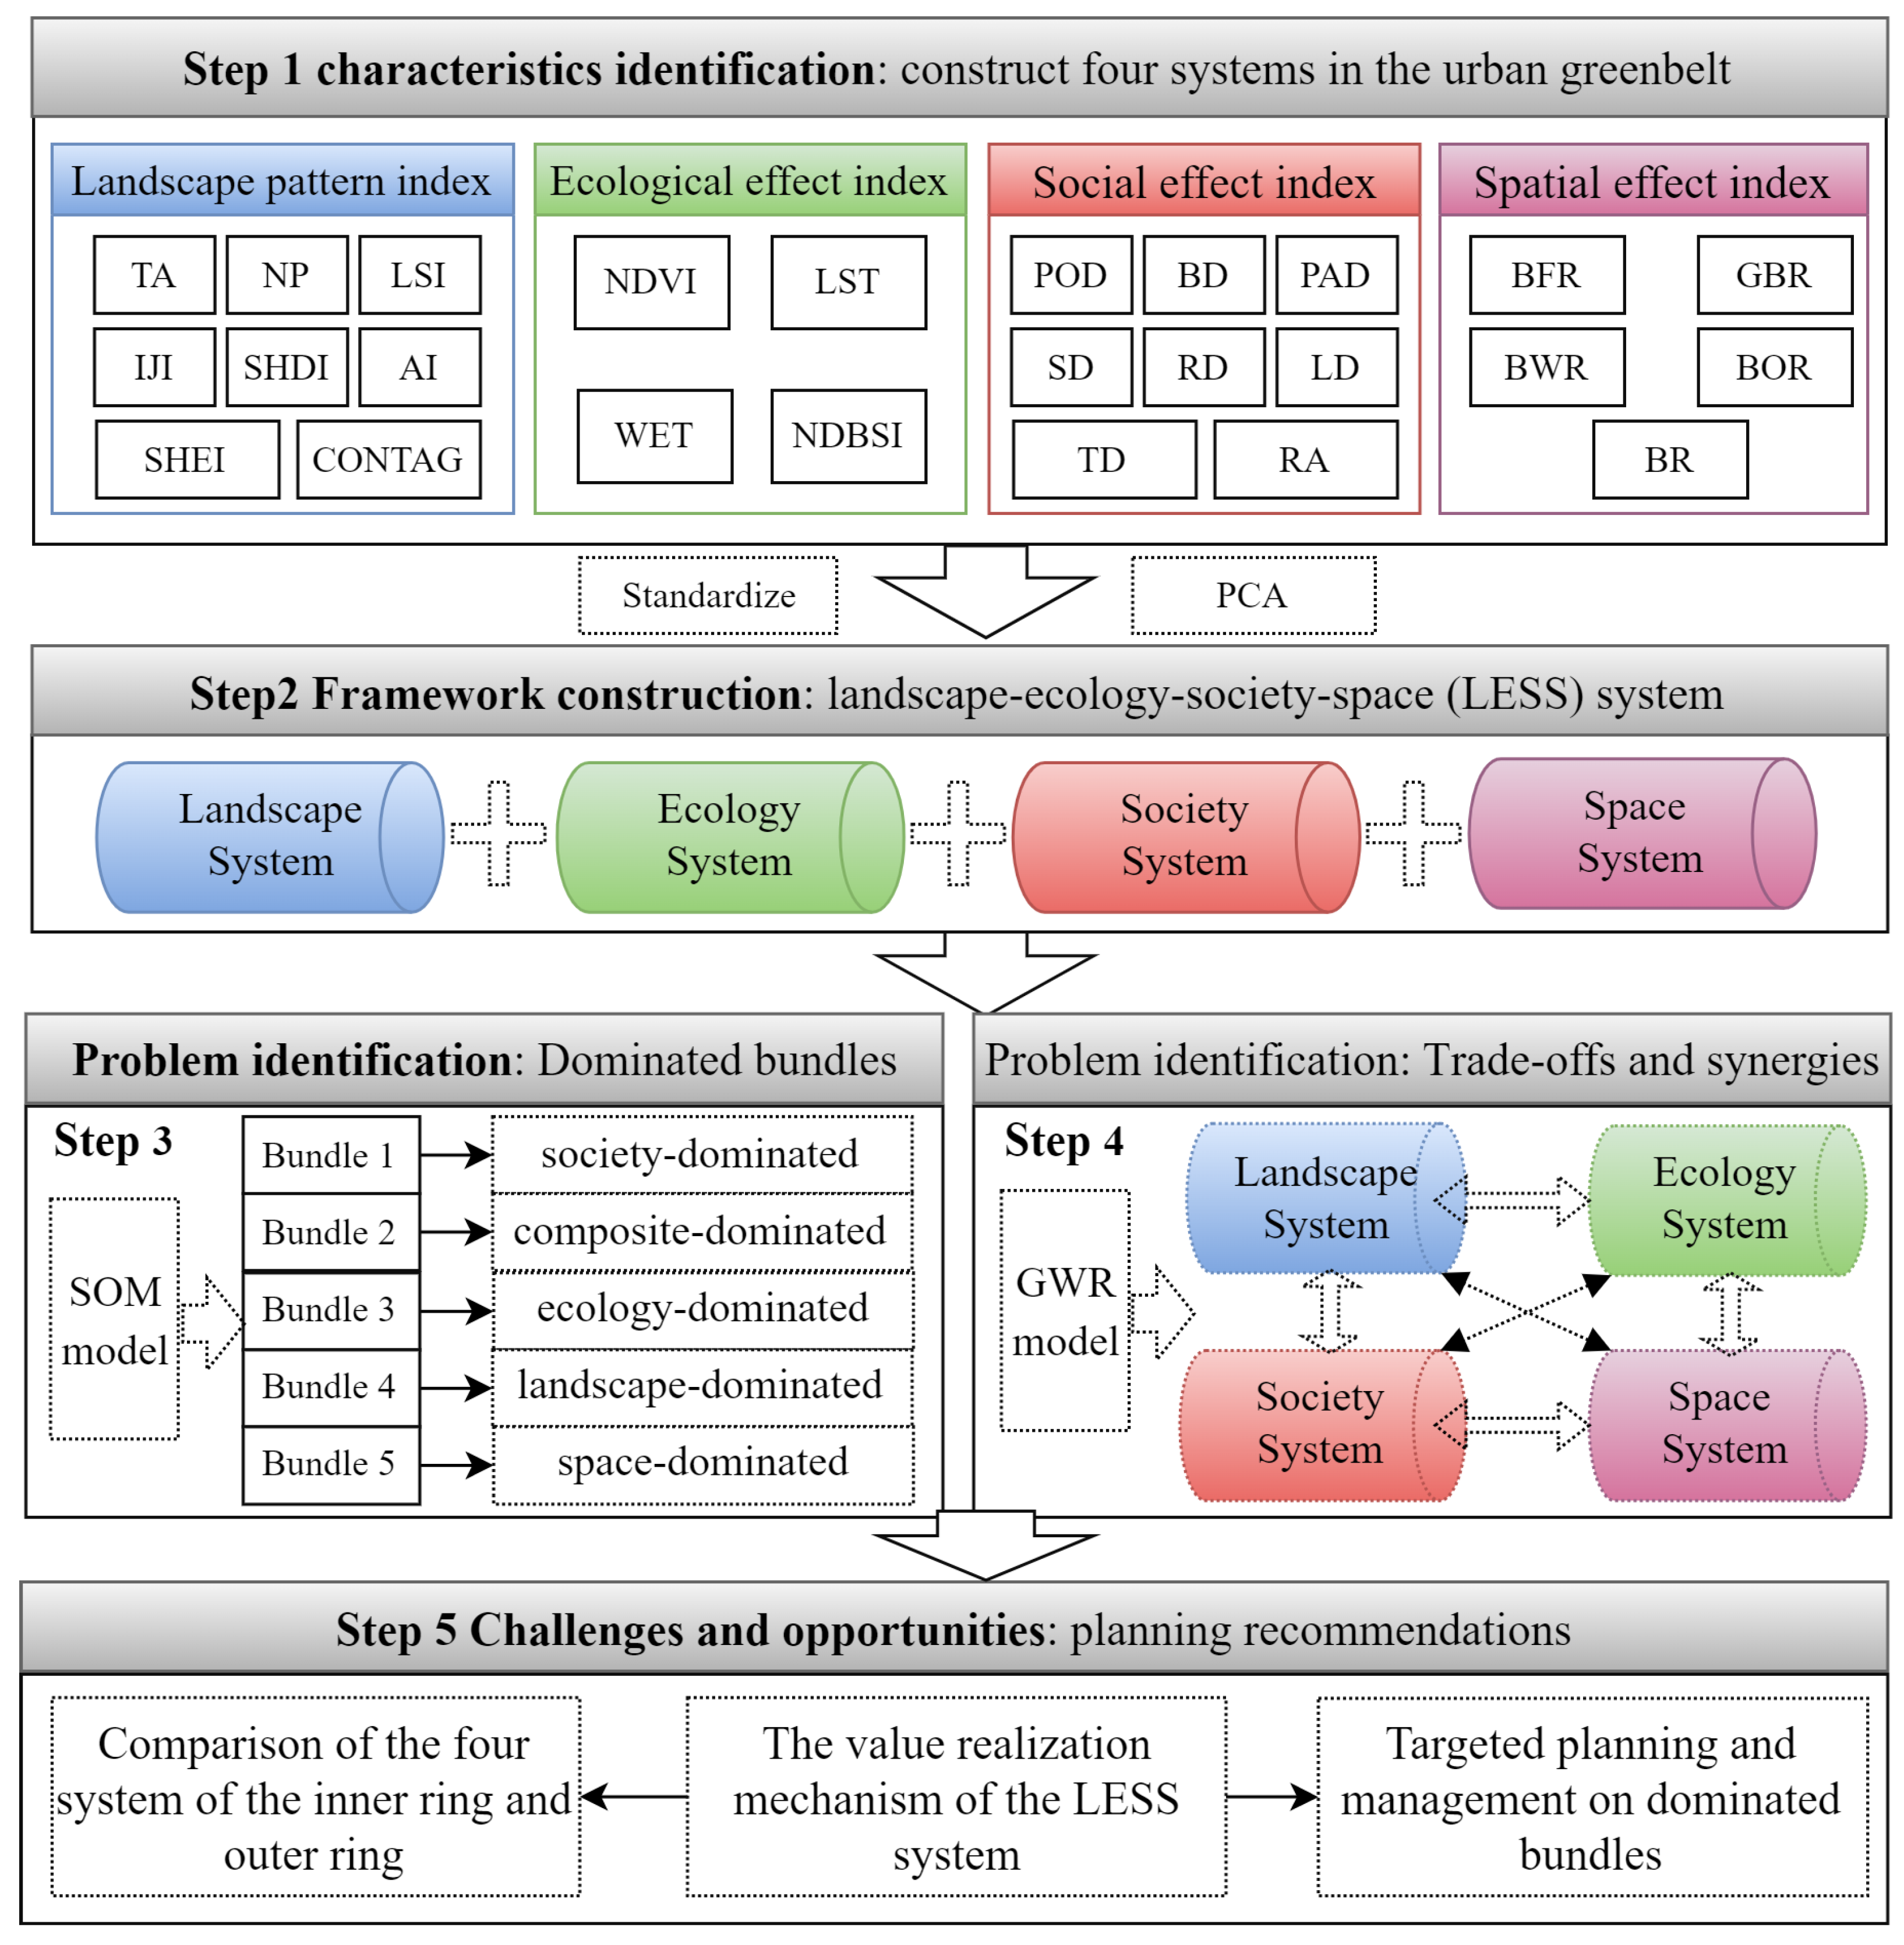
This study consists of five main steps, the first step is to construct four systems based on the characteristics of the urban greenbelt, i.e., a landscape-ecology-society-space (LESS) system (Figure 2); the second step is to screen the indexes of the four systems, standardize the data of the indexes of the four systems, and construct a model containing the four systems by using the principal component analysis (PCA); in the third step, the SOM bundle algorithm is then used to group these indexes into several bundles, with more than 75% of indexes defined as dominant system bundles, and the inherent characteristics of each bundle are analyzed; the fourth step is to analyze the trade-offs and synergies among the LESS systems by using geographically weighted regression and to explore the characteristics of the LESS systems in combination with the structural characteristics of the parks in two greenbelts; finally, the planning recommendations for the driving bundles are put forward, which provide an opportunity for the planning and construction of UGBS to be carried out.

3.2. Principal Component Analysis

Principal component analysis (PCA) is a commonly used data analysis method that aims to reduce the dimensionality of data and capture the main variability in the data [51]. For the four systems of landscape, ecology, society, and space in the urban greenbelt, PCA can be used to find a set of principal components that contain most of the variance in the data. These principal components can be used to explain the variation in the original data and reduce its dimensionality, making it easier to understand and process. When performing PCA on each system, we can identify which indexes are most important and which indexes are less important, allowing us to gain a deeper understanding of the system’s structure. Listed below are the formulas for the standardized and covariance matrix.
Z i j = x i j x j ¯ s j
S = 1 n 1 i = 1 n ( z i z ¯ ) ( z i z ¯ ) T

3.3. Self-Organizing Maps

Self-Organizing Maps (SOM) are a type of unsupervised learning algorithm that is capable of bundling multidimensional data into a low-dimensional space while preserving topological relationships between the original data [52]. SOM bundle algorithms provide better insight into the correlations between bundles, which can provide more effective guidance for the planning and construction of the urban greenbelt. Data fall into multiple pre-set bundles, where data points in the respective bundle share a higher degree of similarity than those in others. In this study, the SOM bundle algorithm is adopted to detect the characteristics of the LESS system’s data into several bundles, over 75% of which are defined as dominant system bundles.
O j = F m i n d j = F m i n I X i W i j 2
W i j = O J η X i W i j
where “ O j ” denotes the output unit j, “ X i ” represents the activation value from the input unit, “ W i j ” is the lateral weights connecting to the output unit, “ d j ” is neurons in the neighborhood, “ F m i n ” expresses the unity function returning 1 or 0, and “ η ” is the gain term decreasing over time.

3.4. Geographically Weighted Regression

Geographically weighted regression (GWR) analysis refers to a statistical method based on spatial relationships used to explore spatial correlation and trade-offs among variables [19]. GWR analysis can be conducted to explore the spatial trade-off and synergy between the index data of this system and those of other systems [53]. To ensure the reliability and accuracy of the analysis results, appropriate kernel functions, bandwidths, and spatial weight matrixes should be selected. To be specific, the GWR model package in R studio 4.2.3 can be employed for operation [54].
β u i , v i = X T W u i , v i X 1 X T W u i , v i y
W i j = e x p d i j / b 2
A I C = 2 n ln σ + n ln 2 π + n n + t r S n 2 t r S
β u i , v i represents regression coefficients, positive regression coefficients represent spatial synergy, and negative regression coefficients represent spatial trade-offs [55]. “ X ” expresses the matrix of independent variable explanatory values, “ W u i , v i ” is the spatial weight matrix of the model; “ W i j ” is the weighted influence between index i and j, and “b” is the bandwidth. The larger the bandwidth of b, the slower the weight influence decays as the distance dij increases. Bandwidth is the determining factor in the weight calculation. The basic idea of AIC (Akaike’s information criteria) refers to penalizing the inclusion of additional variables in the model. The lower the AIC, the better the model will be. In this study, the optimized bandwidth of the respective twin system is at 22,966.84 (Landscape System—Ecology System), 26,462.46 (Landscape System—Society System), 21,929.39 (Landscape System—Space System), 42,522.09 (Ecology System—Society System), 32,992.97 (Ecology System—Space System), and 54,325.37 (Society System—Space System), respectively.

4. Result

4.1. Service Characteristics of the Four Systems

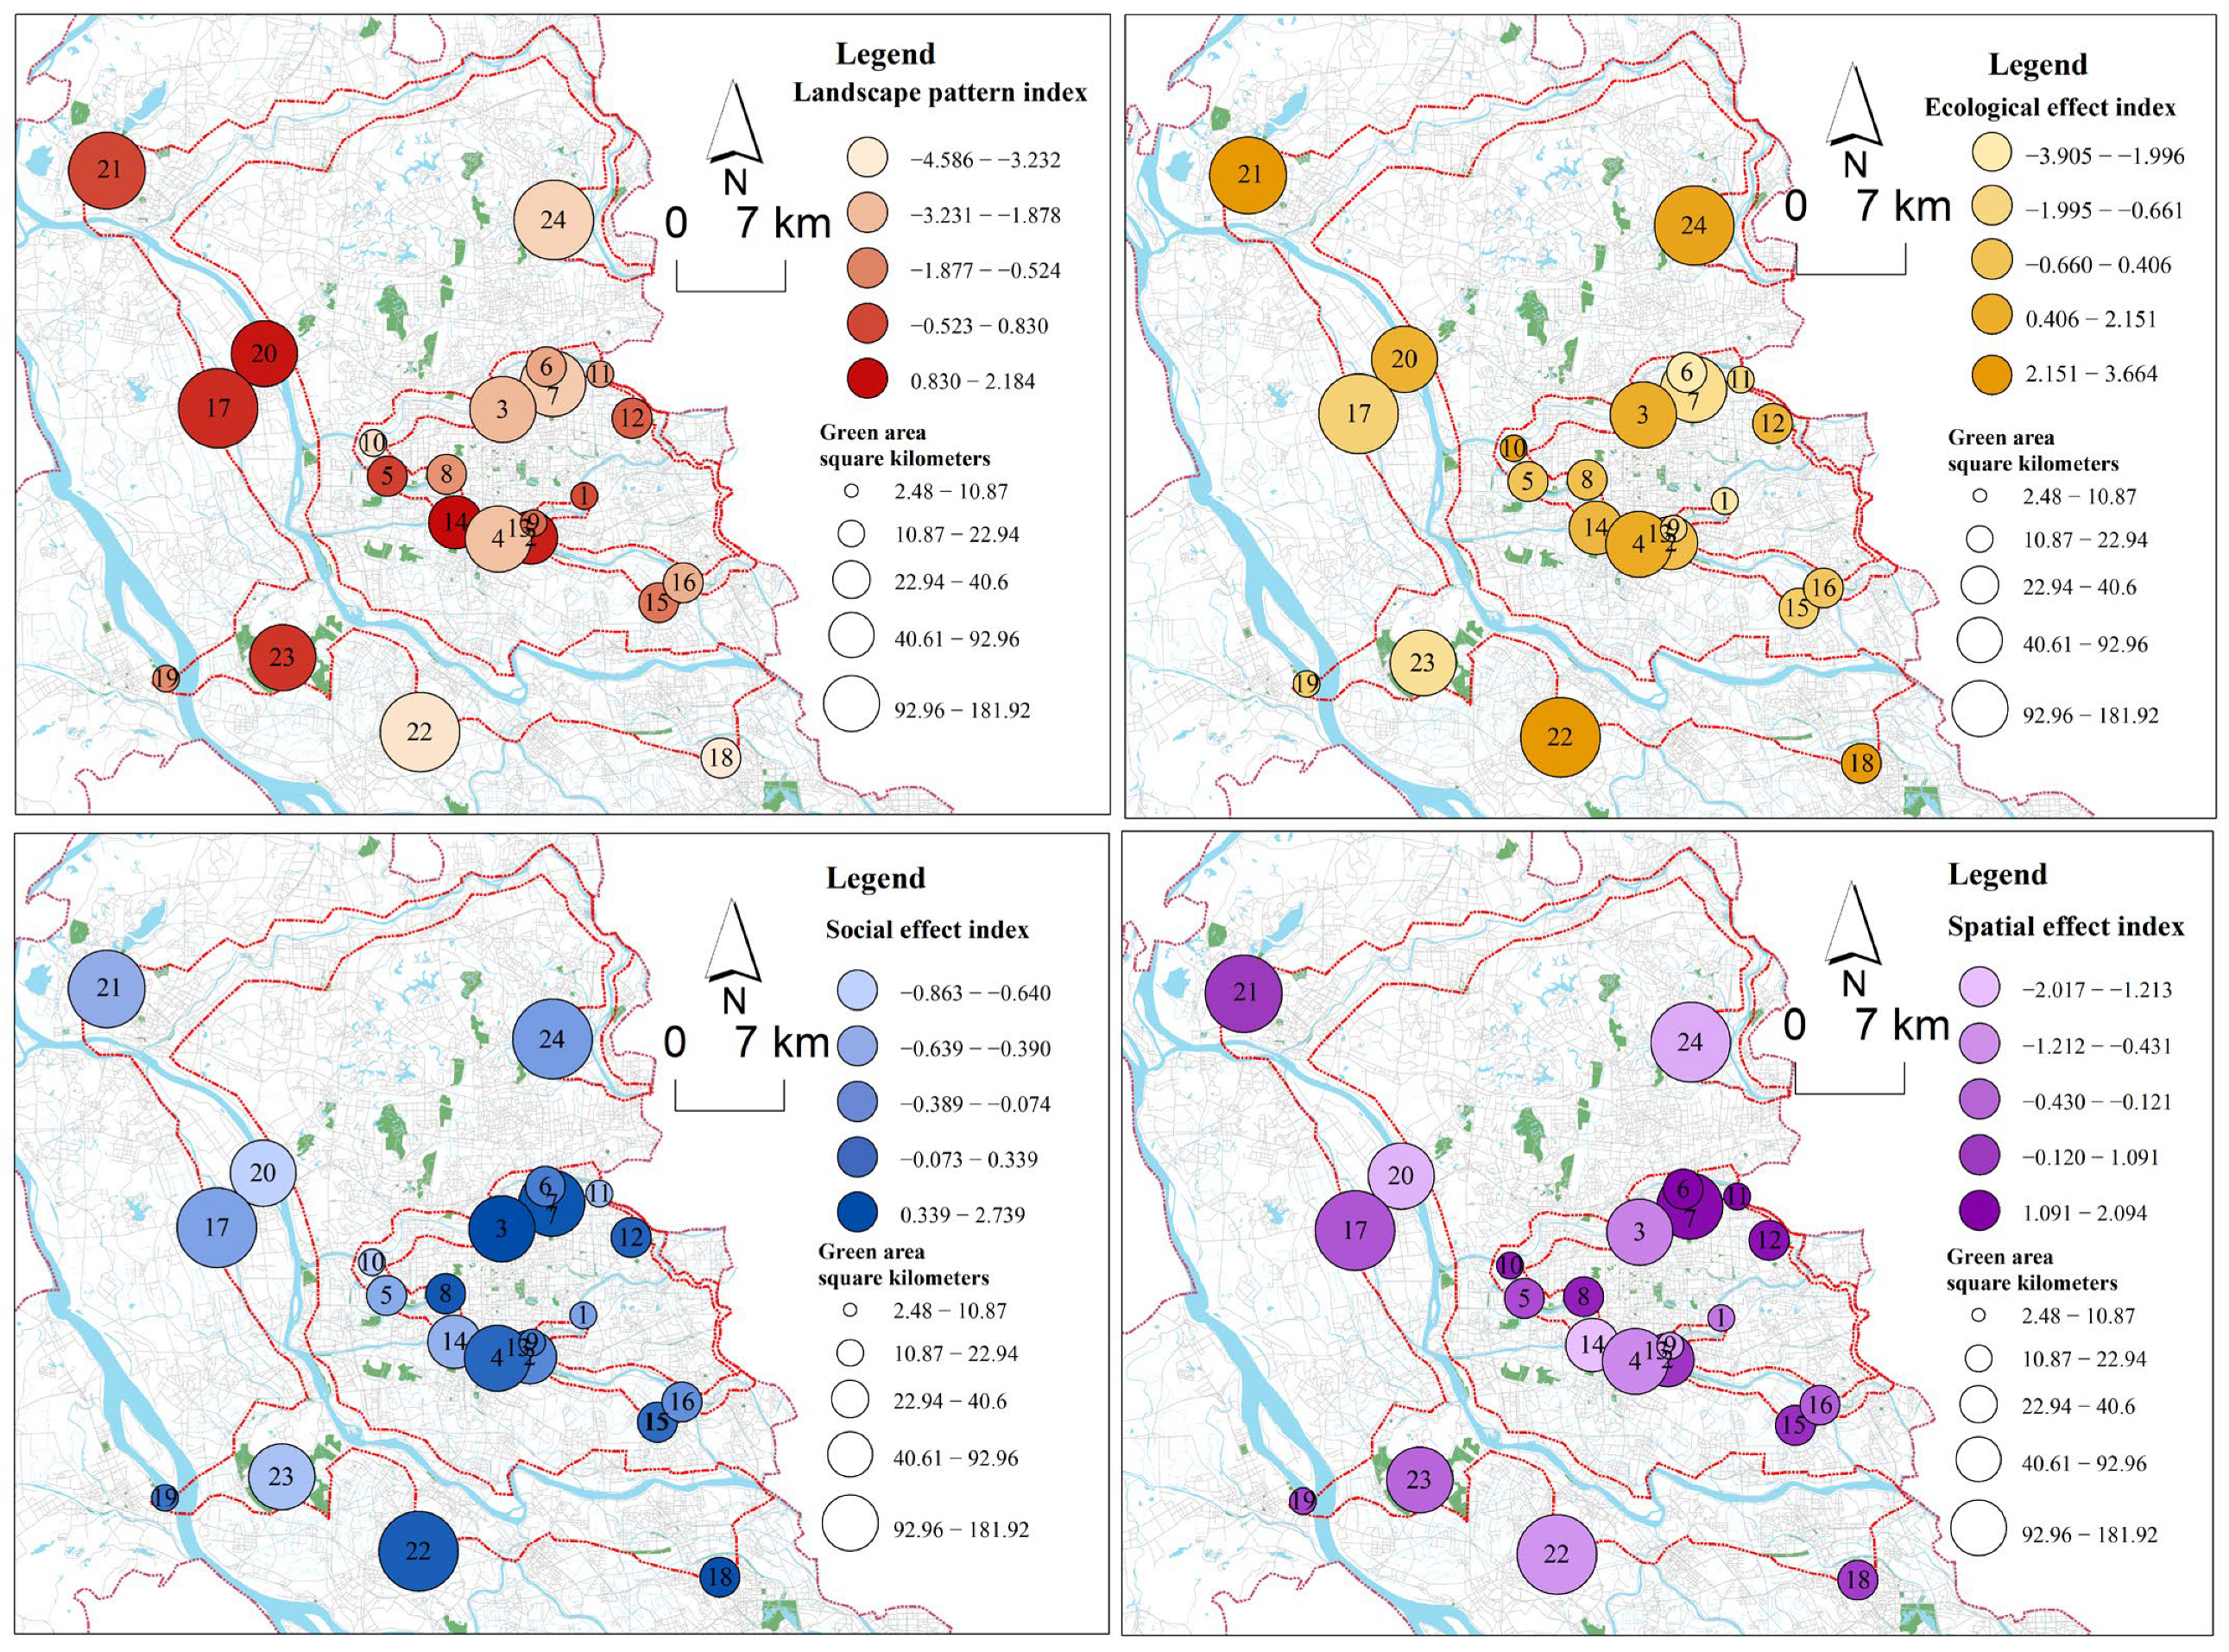
Notably, a wide variety of landscapes provides unique benefits from the perspective of landscape system services. There are large areas of forests in Sanshui Forest Park and Tianhu Forest Park. The CONTAG connectivity index serves as a measure of the degree of connectivity among green spaces, with higher values suggesting greater connectivity. According to the CONTAG index, Foshan New Town Riverside Wetland Park has the best connectivity among all parks, with 68.85. The IJI indirect index represents the degree of internal connectivity of green spaces, with higher values suggesting a better internal connectivity. Half Moon Island Wetland Park has the maximum IJI index of 71.96, suggesting that it has the best internal connectivity among parks. The SHDI index is a type of diversity index that reflects the species diversity in plant communities in parks. The SHDI index ranges from 0.12 to 1.53, with most parks having an SHDI index around 1.0, which indicates a relatively high diversity of plant communities.
For ecology system services, the NDVI index is strong in Zhanqi Peak Ecological Park, Tianhu Forest Park, and Fengling Park, with mean values of 0.68, 0.70, and 0.63, respectively. Half Moon Island Wetland Park has high LST values in all seasons due to its location in an industrial area and a highly urbanized area. In contrast, Hanlinhu Agricultural Park has relatively low LST values in all seasons as a result of its large water body and the agricultural ponds, both of which are major features of the park. There are significant differences between park LST values during different seasons, which can be attributed to multiple factors (e.g., their geographic location, vegetation coverage, water bodies, as well as buildings). There has been a significant difference in the WET index values among the parks, with the maximum value at 1392.58 and the minimum value at −2160.85. There is also a variation in the NDBSI index among the parks. For instance, Fengling Park has the maximum summer value, which is significantly higher than that of other parks, suggesting that the land surface in this park is very dry and bare during the summer.
Significant differences are reported in the density of facilities across a variety of parks from the perspective of society system services. Zhongshan Park in Chancheng belongs to parks with dense populations, suggesting that it is located in a densely populated area. Thus, planning and management of these parks should consider the needs of local residents. A high density of bus stops in the vicinity of parks indicates convenient transportation in the surrounding area, which promotes the use of the parks. High shopping density parks are surrounded by dense commercial areas, suggesting an abundance of commercial resources, which, in turn, provides residents and tourists with a greater choice of shopping options. There is a positive correlation between population density and shopping density, restaurant density, and leisure and entertainment density, as seen in Nanhai National Fitness and Sports Park and Yingyue Lake Park; meanwhile, some parks have a negative correlation between population density and shopping density, dining density, and leisure and entertainment density, such as Wangjiegang Forest Park and Hanlin Lake Park. Accordingly, parks with high supporting facilities can improve the attractiveness and utilization of the parks, while parks with a smaller accessible range can encourage greater attendance.
For spatial effect characteristics, the green barrier rate refers to the proportion of transparent green walls set up along the boundary of a park, which can enhance the park’s landscape effect and transparency. As an example, Yuchong Cultural Park and Wuyakou Park have relatively high values in GR, respectively, at 41.98% and 32.21%, suggesting good landscape effects that can increase the attractiveness of the parks. The boundary waterfront rate refers to the proportion of a park’s boundary that is in contact with water bodies, reflecting the quality of the water environment and the level of utilization. For instance, Nanhai Wetland Park has a waterfront ratio of 54.32%, while Zhouweiwei Park has a waterfront ratio of 75.54%, both of which indicate the quality of the water environment is significantly better and can be further enhanced by appropriate water activities and landscape design. The openness of a park’s boundary is manifested by the transparency and openness of the park’s boundaries, suggesting the degree to which the park is open to the general public. For instance, the Tianhu Forest Park exhibits a significantly low boundary openness rate of only 0.37%, which may affect the utilization and attractiveness of the park. Thus, the boundaries of the park should be open further, and it is imperative to improve its publicity and promotion.
Thus, when planning and constructing urban parks in the greenbelt around the city, it is necessary to consider the comprehensive performance of these indexes to improve the comprehensive benefits. As a result of analyzing these four system characteristics, we will be able to develop more comprehensive insights into the design and use of these UGBS.

4.2. Dimensionality Reduction Analysis

In this study, a dimensionality reduction analysis is conducted on the landscape pattern index, the ecological effect index, the social effect index, and the spatial effect index of the LESS system. Principal component analysis (PCA) was used to extract the weights of each index. The KMO and Bartlett tests were used to assess the suitability of the data and whether PCA could be used for data dimensionality reduction. As indicated by the results, the KMO values exceed 0.5, and the significance P values of Bartlett’s sphericity test are lower than 0.001, suggesting that the PCA model was effective. In the PCA results for the LESS system, the squared loadings for each variable exceed 75%, which is conducive to identifying the critical principal components and variables for future analysis and interpretation (Table 2).
The component matrix is generated through PCA, where the respective feature component corresponds to a set of indexes, and weighted combinations of these indexes are conducted. As a result of the variance contribution and cumulative contribution rate for the respective feature component, the component’s explanatory power can be assessed for the total variance. Each of the landscape, society, and space systems extract two components each, while the ecology system extracts one component. A model is synthesized, and the weights are normalized by calculating the overall main weights of the four characteristic indexes through the total variance explained and the component matrix score.
As indicated by the results, the LSI exerts the most significant effect on the landscape pattern model, with weights of 0.369. In the ecological effect model, the two indexes that compose aridity had a negative impact on the model, with weights of 0.514 and 0.513. According to the spatial effect model, the border frontage rate indicates a positive component with a weight of 0.439. To facilitate comparisons and assessments among different systems, the values can be used to calculate the weights for the four effects of the UGBS (Figure 3).

4.3. Analysis of the Major Bundles in the LESS System Services

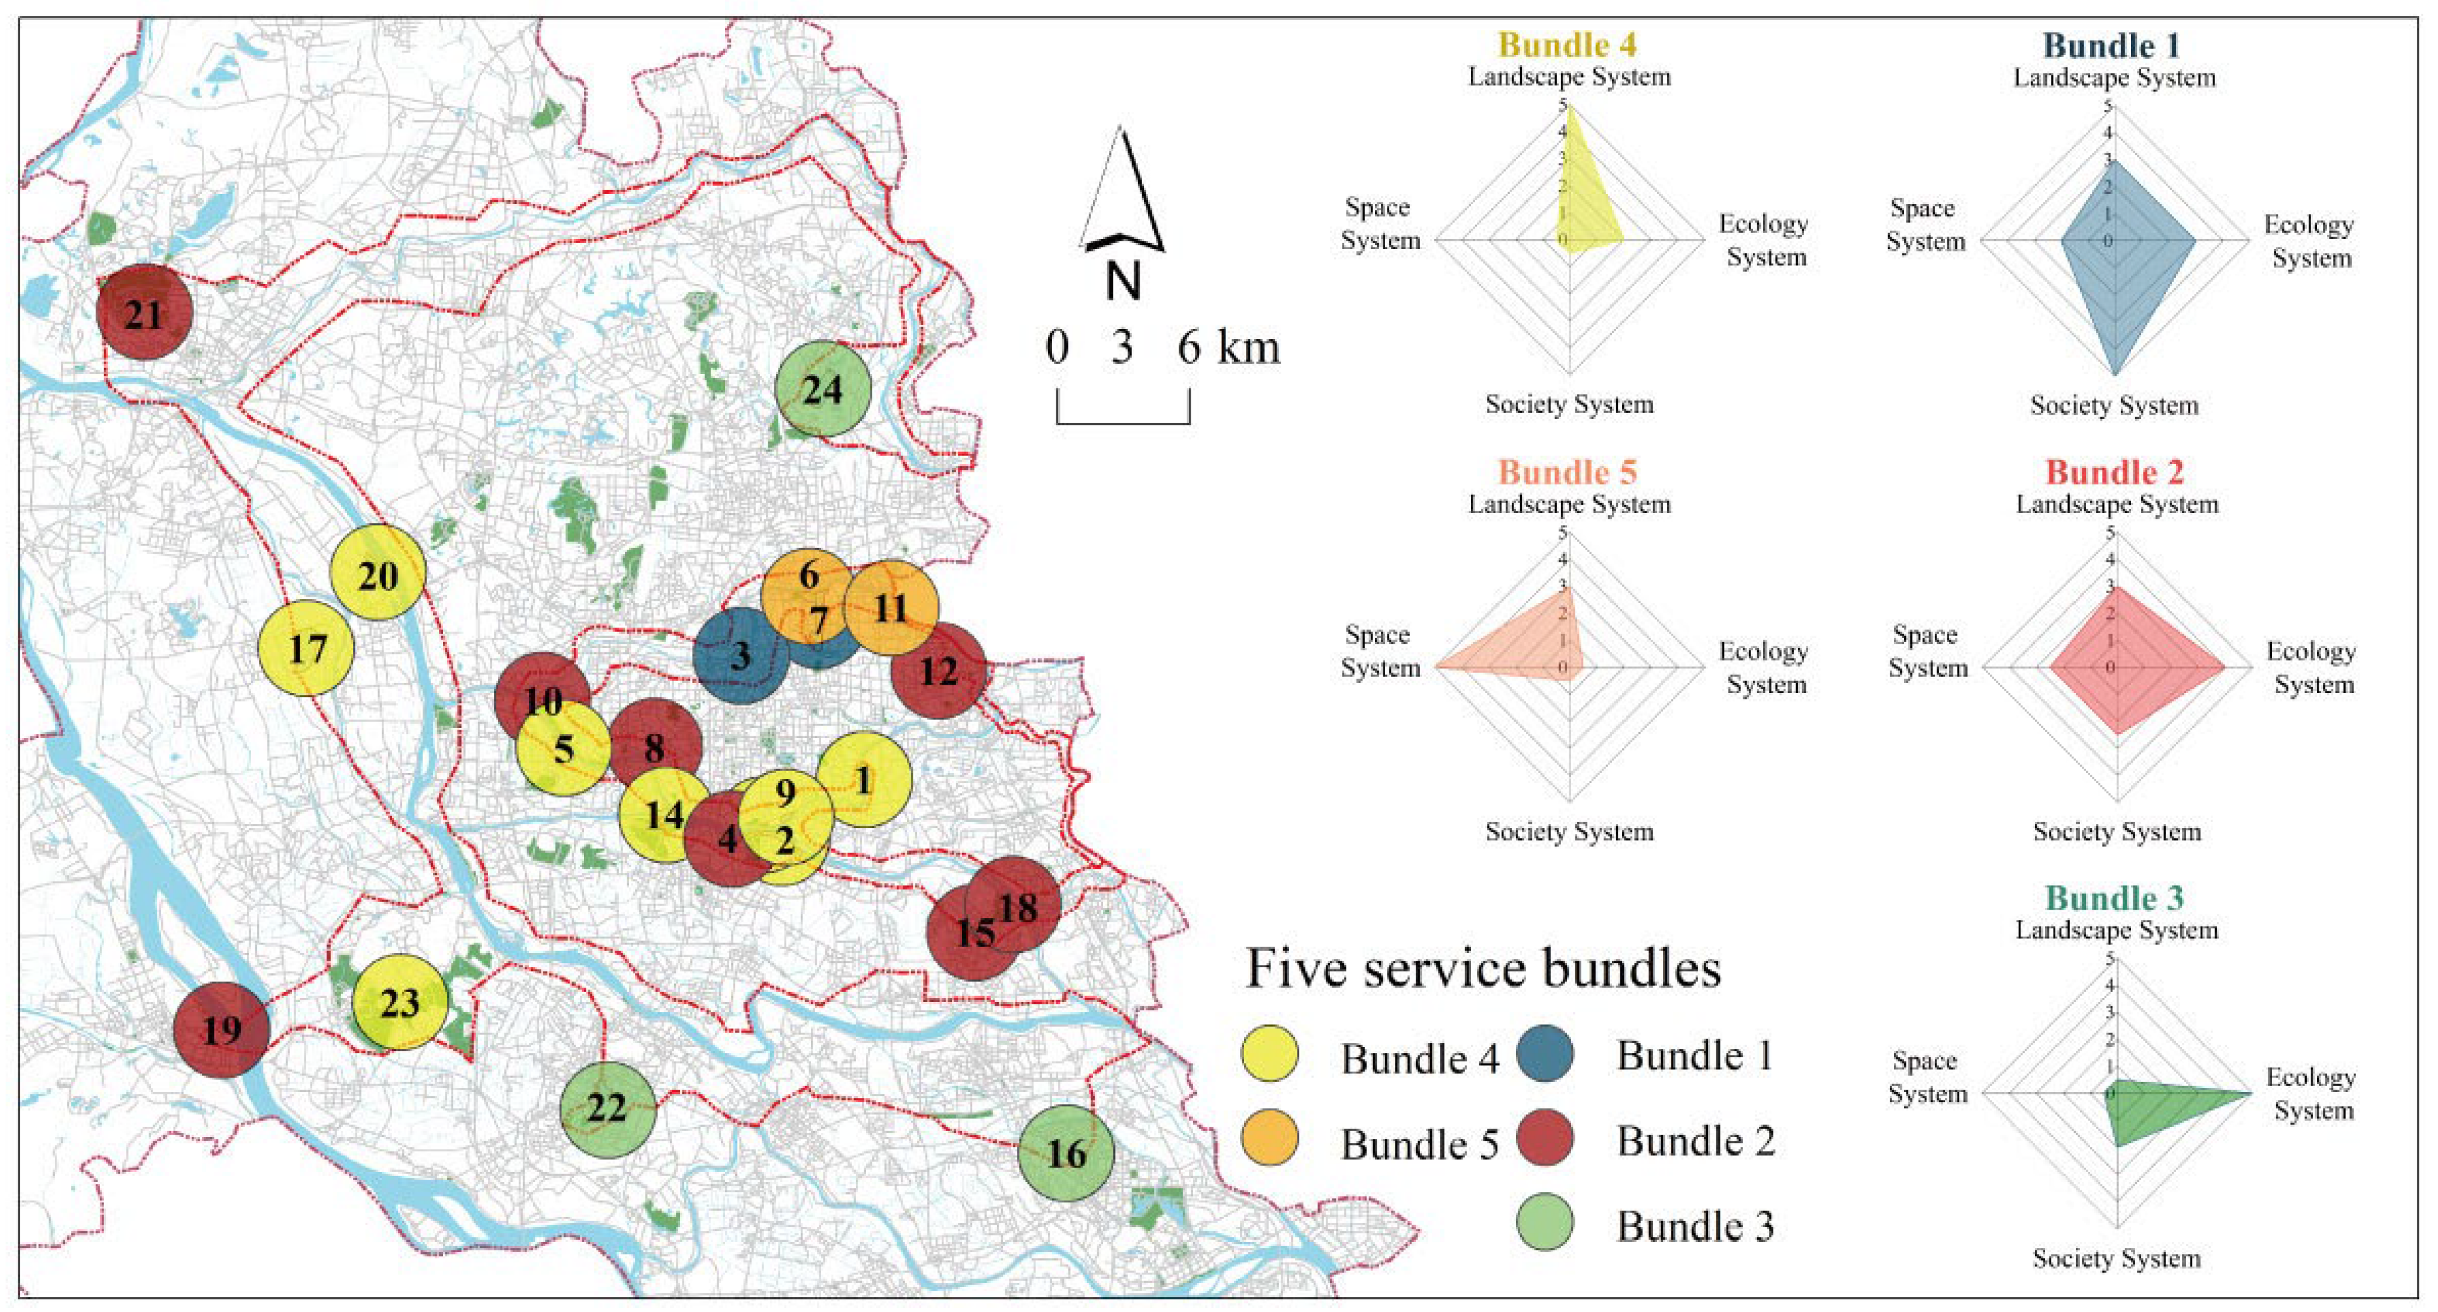
Ecosystem service bundles analysis is a technique for grouping geographically similar areas in an ecosystem into the same category. In this technique, multiple indexes are used to assess the degree of similarity for each area. In this study, green space data were used to identify region features in the LESS system using the SOM bundle algorithm.
According to the results, there are five bundles, i.e., landscape-dominated, ecology-dominated, society-dominated, space-dominated, and composite-dominated bundles (Figure 4). Bundle 1 was dominated by the social driving bundle, with a higher social effect index than other bundles. Bundle 2 was dominated by the composite driving bundle, with parks performing relatively well almost across all indexes, such as Yingyue Lake Park with positive values for all four indexes, i.e., landscape pattern index (0.613), ecological effect index (0.406), social effect index (0.089), and spatial effect index (1.428). Bundle 3 was dominated by the ecological driving bundle, with parks such as Fengling Park, Tianhu Forest Park, and Zhanqi Peak Park performing well in ecological effect index (3.044) and social effect index (1.563), but poorly in landscape pattern index (−4.586). Bundle 4 was dominated by the landscape driving bundle, with many parks classified as wetland parks, performing well in landscape pattern index and ecological effect index, but poorly in social effect index and spatial effect index. Bundle 5 was dominated by the spatial driving bundle, with Nanhai Public Fitness and Sports Park and Wuya Kou Park performing well in social effect index, despite poor performance in landscape pattern index and ecological effect index.
In general, the system bundles classified in UGBS suggest that they exhibit different characteristics under different indexes. The above-mentioned indexes can be adopted to gain a better understanding of the ecological features of parks and green spaces, which will be conducive to improving planning and design.

4.4. Trade-Offs and Synergies among Four Systems

Most of the green space system services interact with one another. There is a complex relationship between multiple system services and social development. The GWR model can be used to explore interactions among multiple systems. We assessed the interactions between pairs of the LESS system: landscape, ecology, society, and space (Table 3).
For the landscape-ecology system, P4 (Foshan New Town Riverside Wetland Park) scores the maximum, suggesting that the park pays more attention to ecological protection and the balance of the ecosystem in landscape design, conforming to the concept of environmental protection. For instance, with the establishment of ecological corridors, wetlands, green corridors, and other landscape elements, the connectivity of the ecology system can be increased, habitats can be provided for wildlife, and the ecological environment can be optimized. Furthermore, there is also a certain balance between the landscape pattern system and the ecology system. Our analyses show synergy between the landscape pattern system and the ecology system since landscape pattern planning and design can more effectively protect and enhance the functionality and services of the ecology system. Landscape pattern optimization may require the weakening of certain ecological functions to achieve a better landscape. Furthermore, landscape pattern design may require the re-layout and reconstruction of the ecological functions, probably triggering some ecological disturbance. Thus, a balance between the landscape pattern system and the ecology system should be stricken to achieve greater synergy and benefits.
In accordance with the landscape-society system, P1 (Half Moon Island Wetland Park) scores the maximum, suggesting that the park pays more attention to social benefits in landscape design, conforming to the urbanization construction requirements. In addition, a certain balance exists between the landscape pattern system and the society system. As such, it may be necessary to lose some landscape pattern functions to achieve better social benefits. Landscape patterns can be altered by interference, whereas they are constrained by them. Landscape interference is a vital process facilitating heterogeneity and fragmentation of the landscape.
Following the landscape-space system, P4 (Foshan New Town Waterside Wetland Park) scores the maximum, suggesting that the park pays more attention to space utilization and planning in landscape design, conforming to the requirements of urban planning and construction.
Regarding balance between the ecology and society systems, P2 (Wetland Riverside Children’s Park) scored the lowest, suggesting that the park has significant issues with balancing between the ecology and society systems. Accordingly, it is necessary to enhance both ecological and social functions of parks in the greenbelt around the city. The synergy between ecology and society systems scored the minimum among all the parks, suggesting that synergy between ecology and society systems should be further enhanced.
For the ecology-space system aspect, P9 (Shiwan Wetland Park) scored the lowest, suggesting that the park has significant issues in balancing between the ecology system and the space system and should strengthen ecological protection while optimizing space utilization. Regarding the society-space system aspect, P2 (Wetland Riverside Children’s Park) scored the lowest, suggesting that the park has significant issues in balancing between the society system and the space system and should strengthen social benefits while optimizing space utilization.
Obviously, the result shows a high trade-off relationship between the landscape and ecology systems and a low synergy relationship between the ecology and society systems. To achieve the goals of the synergistic development of the ecological and social functions, socio-economic development, and multi-objective development in the greenbelt around Foshan, we should balance correlation among four systems in the LESS system to realize the landscape enhancement and increase social benefits without weakening the ecological functions.

5. Discussion

5.1. Classification of Ring Parks Based on Circle Layer

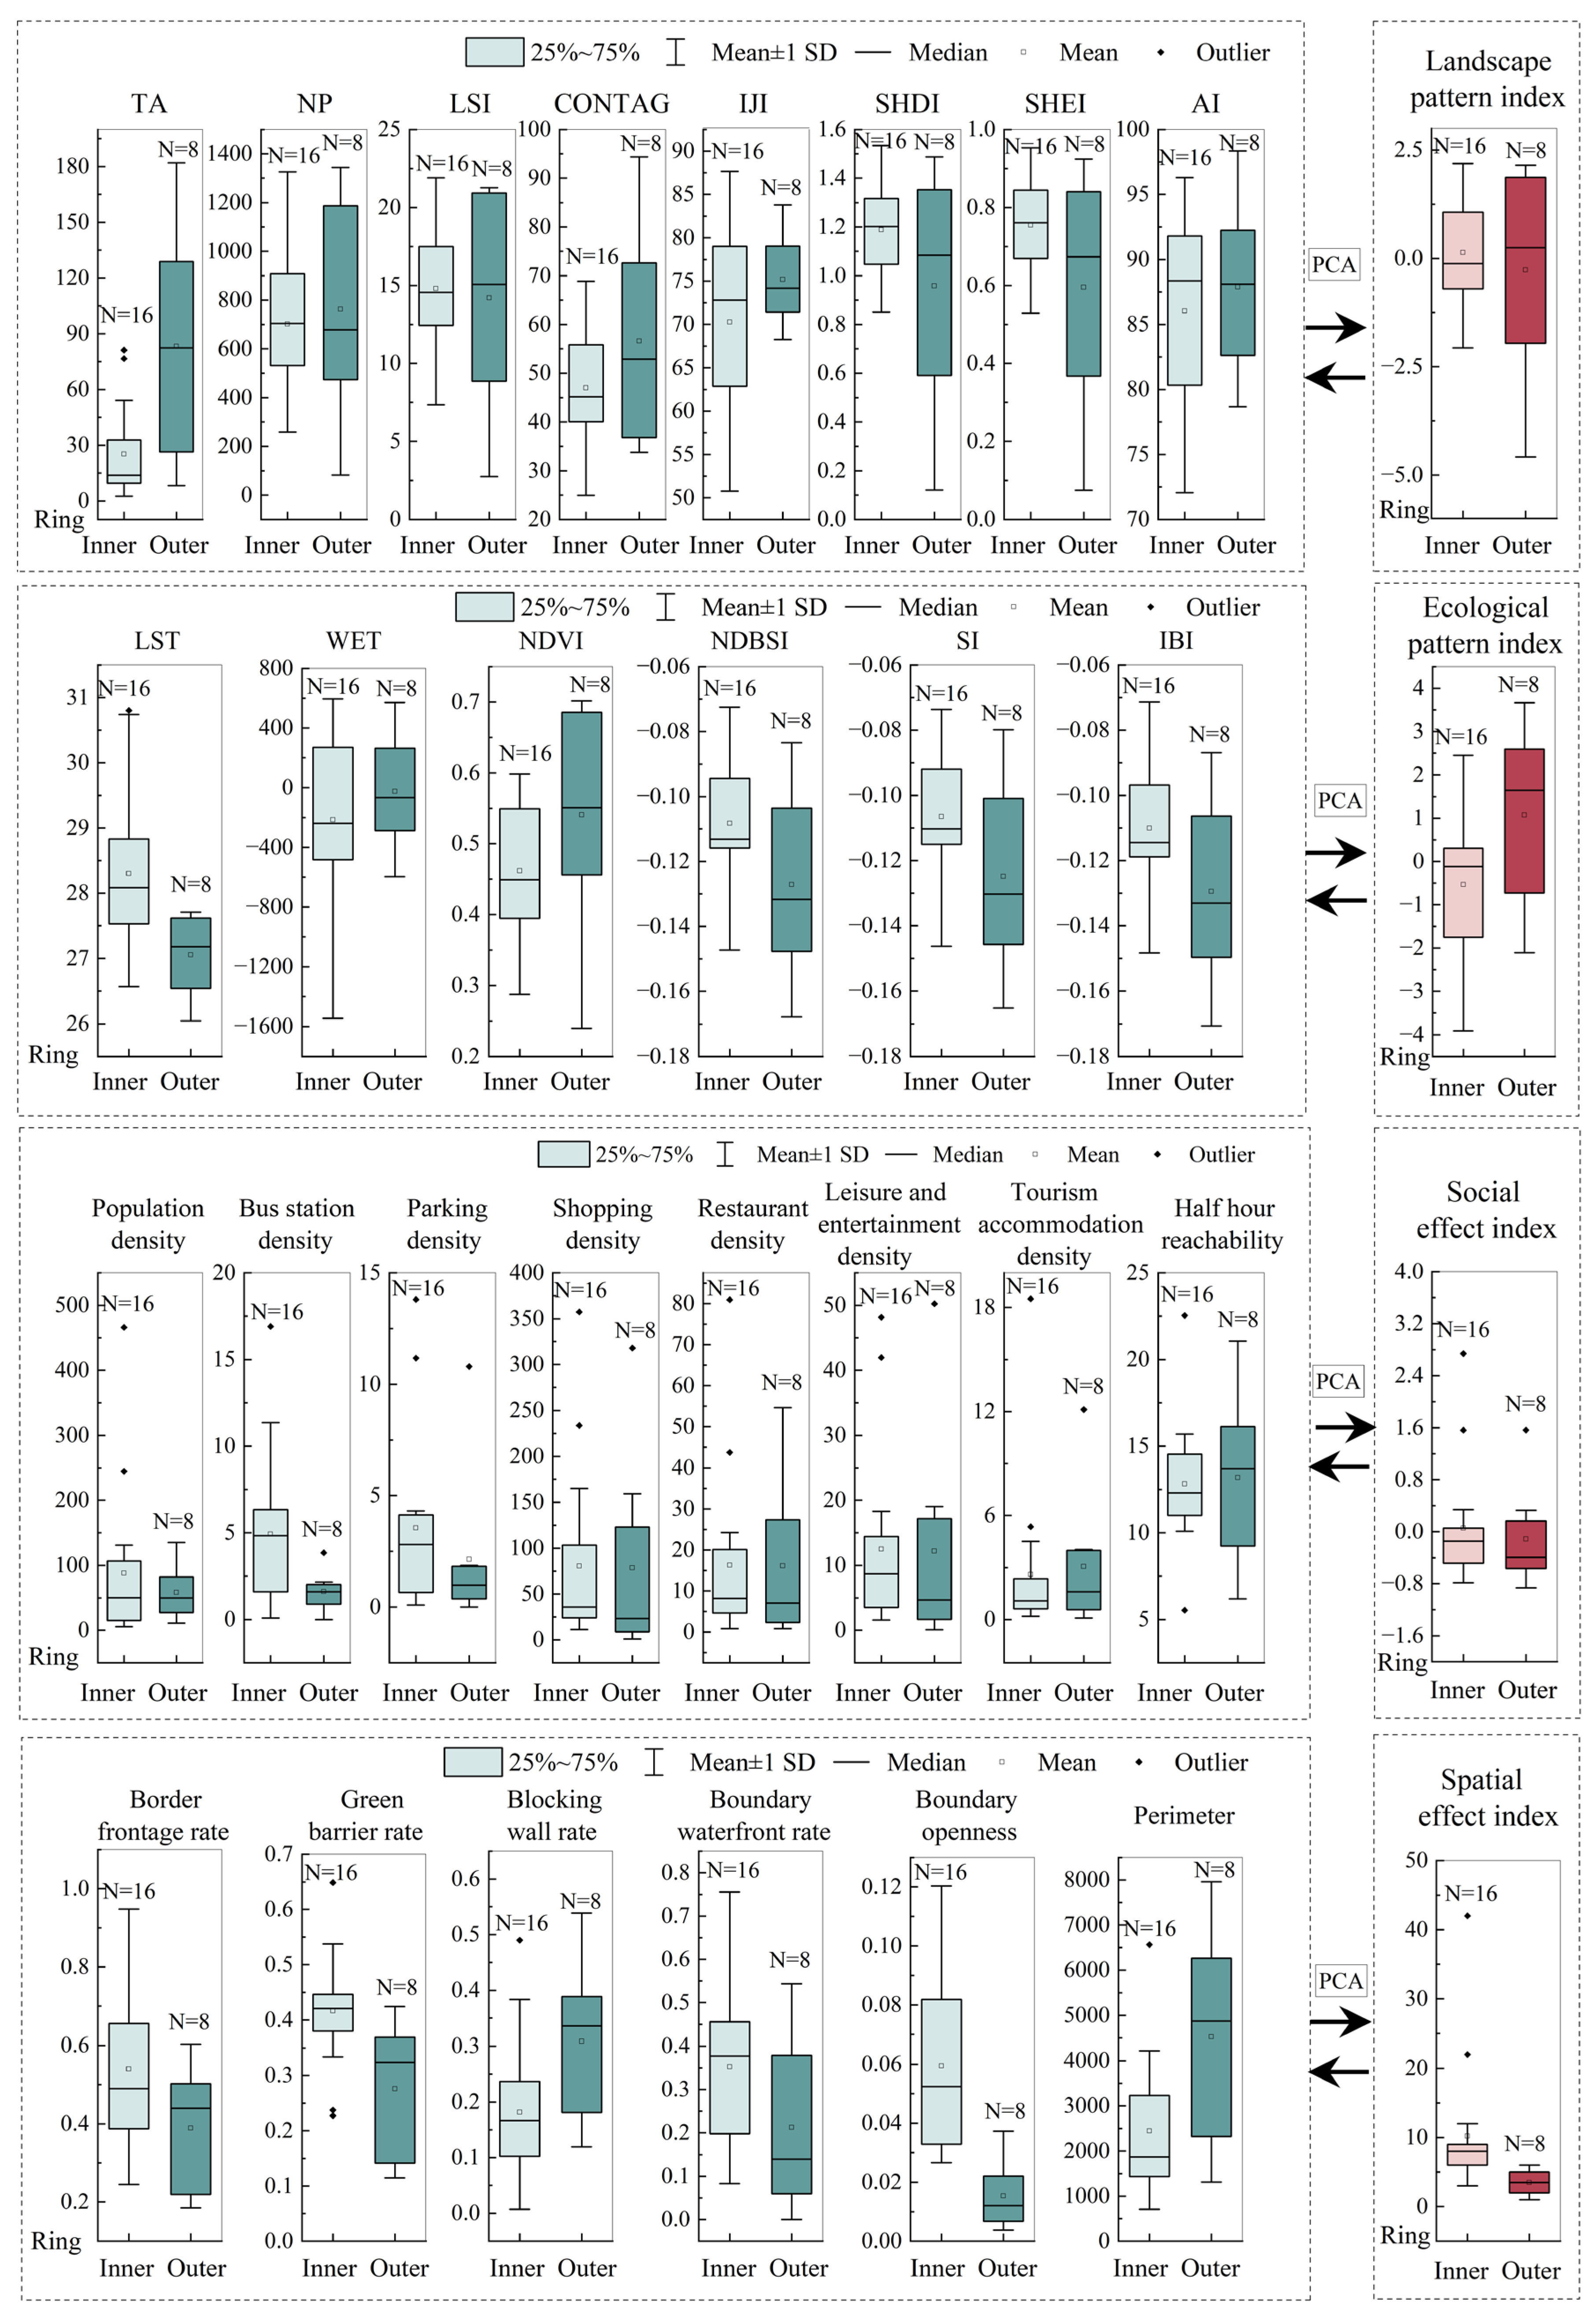
The spatial structure of the inner and outer rings in the Foshan greenbelt has significant research significance and value (Figure 5). According to the landscape pattern index, the park area of the outer ring is larger than that of the inner ring in the mean value, and the median of the LST, CONTAG, and IJI indexes shows that the outer ring has an advantage over the inner ring for landscape pattern. As shown in the ecological pattern index, the outer ring’s WET and NDVI indexes are significantly higher than the inner ring’s. The LST index has a cooling effect advantage in the city [39], and the cooling effect of the outer ring is significantly better than that of the inner ring, suggesting that the outer ring’s ecological environment quality level is greater than the inner ring’s. However, the social effect index shows that the inner ring has a relatively higher density of transportation facilities. Similarly, the spatial effect index shows that park border frontage, green barrier, and boundary openness are higher in the inner ring.
Thus, through comparison analyses among four systems of the inner ring and outer ring, it was found that the social and spatial effects of the Thousand-Acre Ecological Park Greenbelt are higher, while the ecological and landscape effects of the Ten Thousand-Acre Forest Park Greenbelt are higher.
Different functions and values conform to their distinct geographical locations and characteristics [10]. Green spaces of the inner ring are capable of prioritizing community functions and transportation connections while preserving natural ecological elements [50]. As such, green spaces of the outer ring should stress landscape and ecological values, attract tourists and nature enthusiasts [44], and optimize ecological functions. Through well-designed planning, inner and outer rings’ green spaces can fully achieve their maximum effects, providing the city and its residents with greater social, ecological, and economic benefits.

5.2. The Value Realization Mechanism of the LESS System

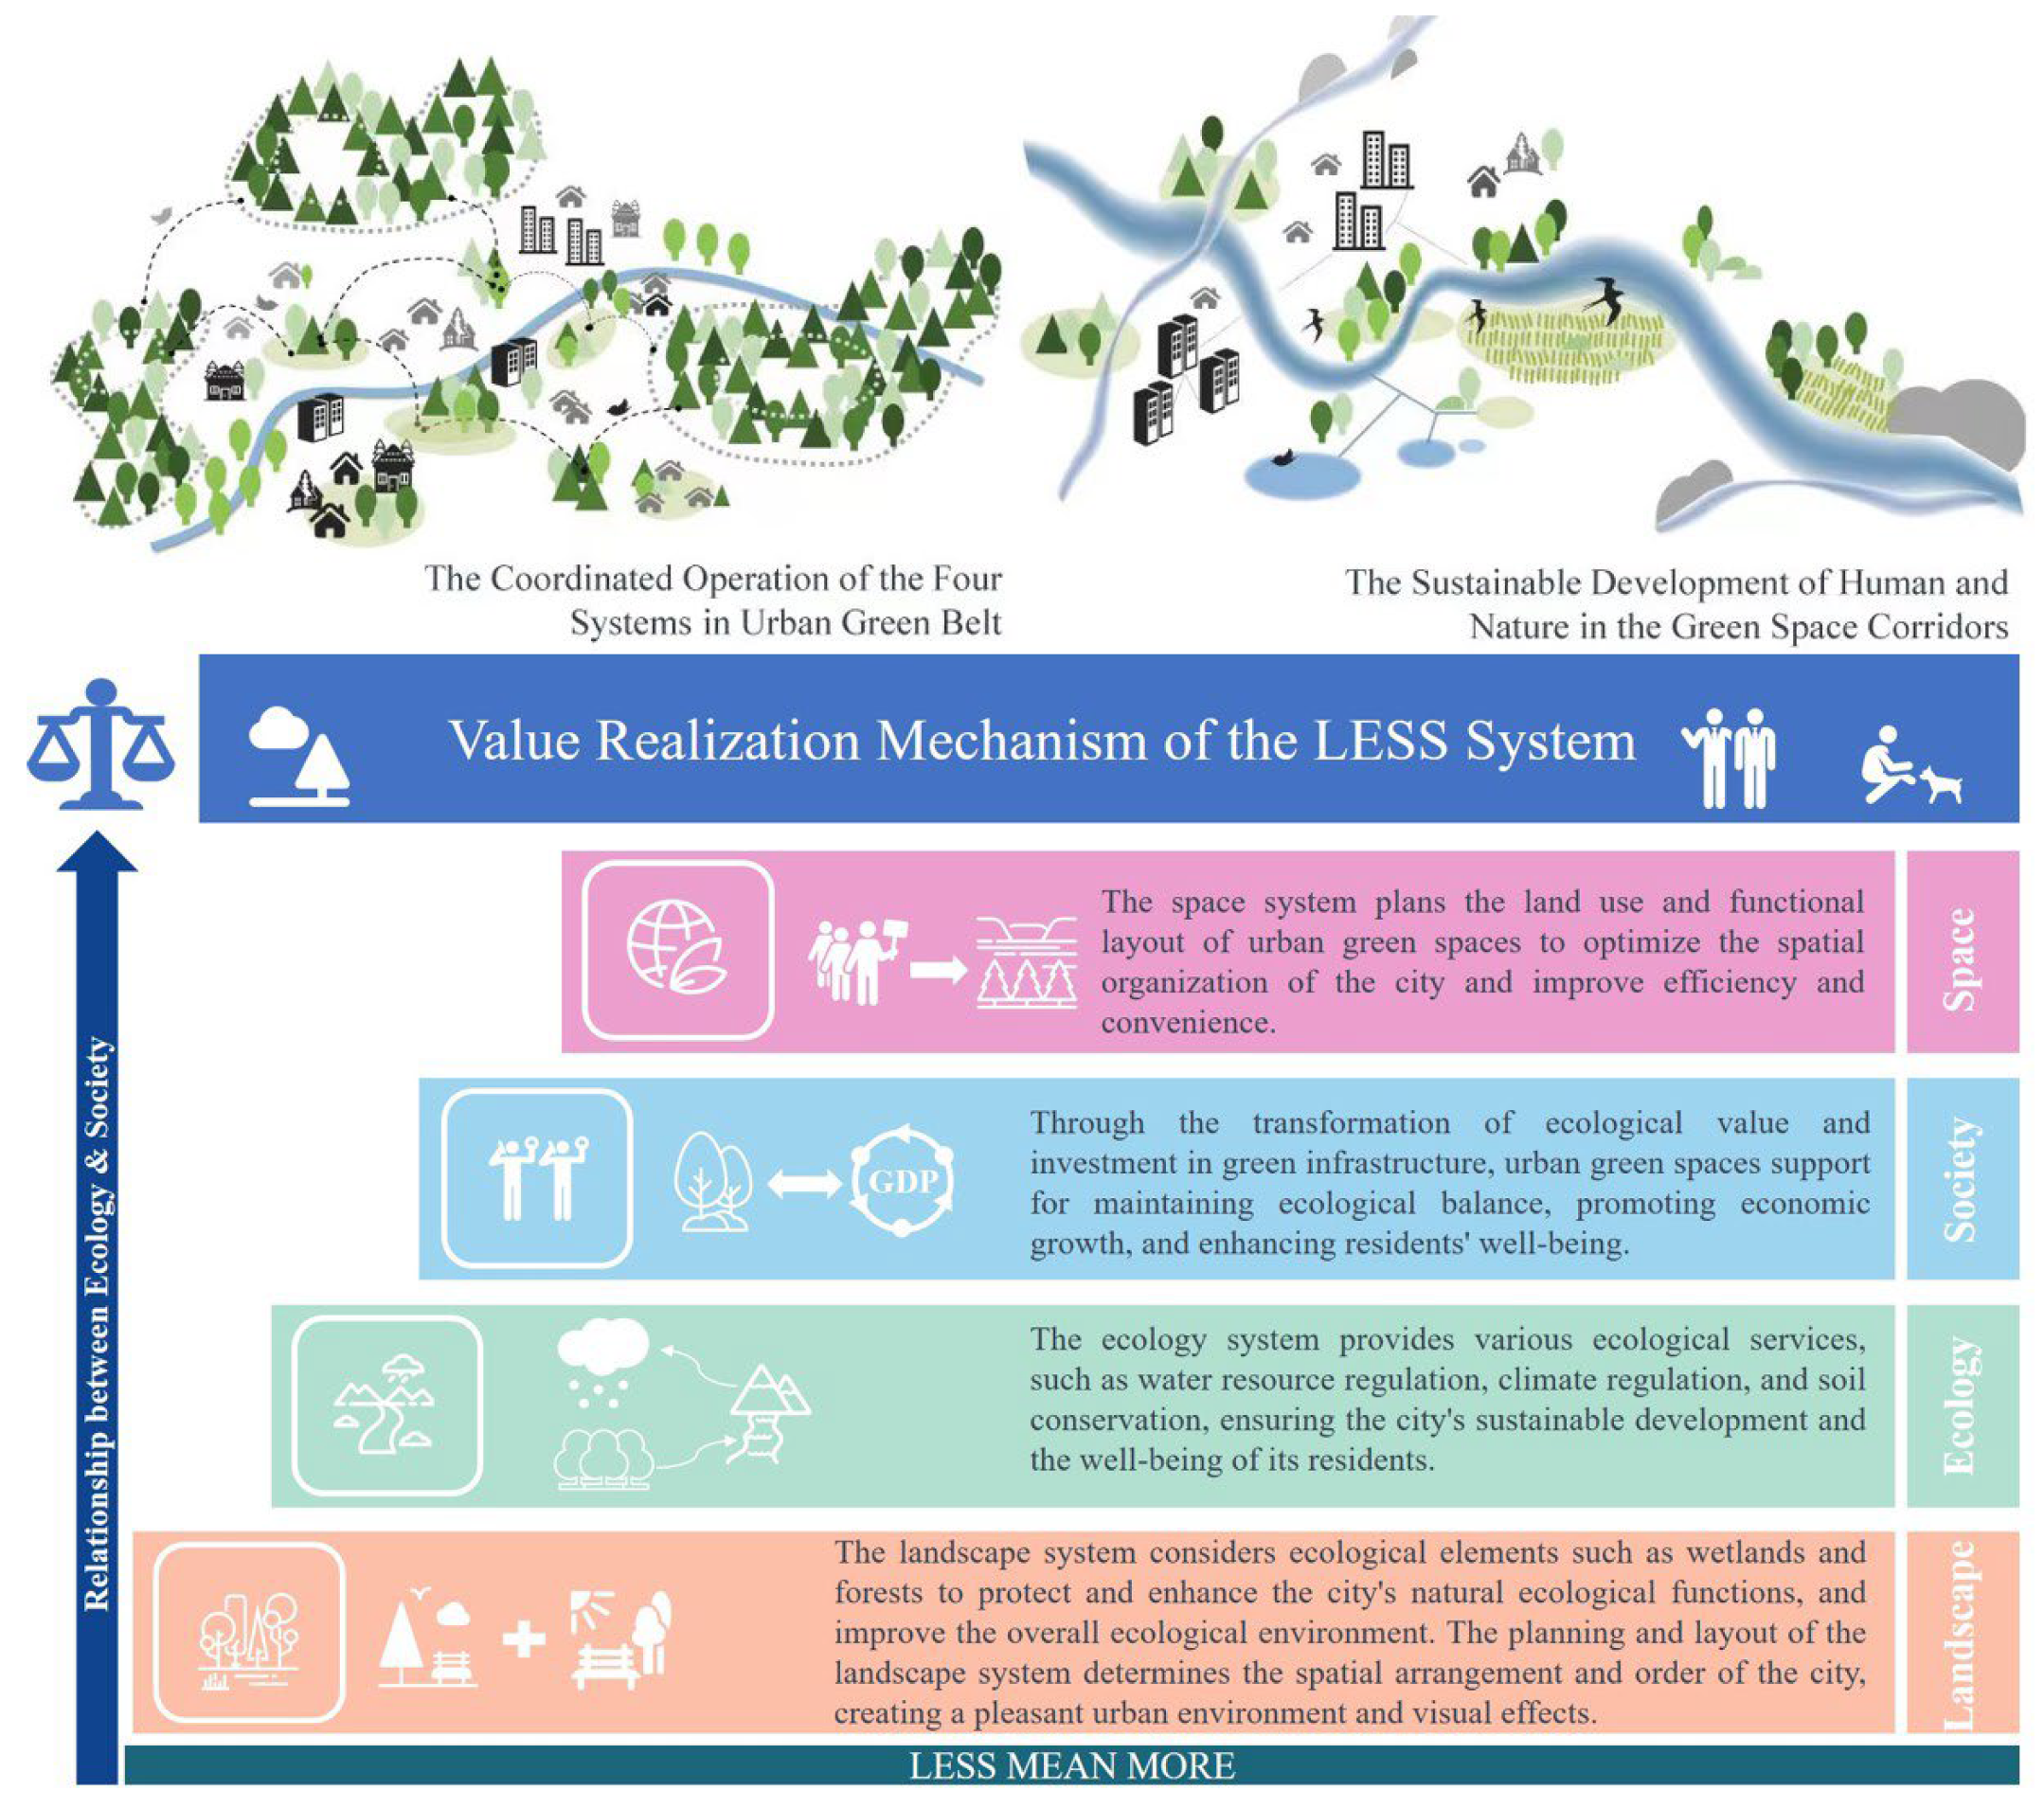
The value realization mechanism of the LESS system (landscape, ecology, society, and space) is implemented by coordinating the correlations among the four systems, optimizing urban planning and development, and achieving sustainable urban development [56] (Figure 6).
The landscape system considers ecological elements (e.g., wetlands and forests) to protect and enhance the city’s ecological functions, improving the overall ecological environment. The planning and layout of the landscape system can determine the spatial layout and order of the city, create a pleasant urban environment and visual effects, and notably affect the quality of life of residents [57]. The ecology system provides a wide variety of ecological services (e.g., water resource regulation, climate regulation, and soil conservation), such that the city’s sustainable development and the well-being of its residents can be ensured [58].
In the society system, through the transformation of ecological values and investment in green infrastructure, urban green spaces become beautiful landscapes while turning out to be vital support points for maintaining ecological balance, such that economic growth, community cohesion, and social consensus are facilitated [59]. The space system is involved in planning of the layout and spatial design of urban green spaces, optimization of urban spatial organization, provision of high-quality urban public space for residents, promotion of leisure and recreational activities for urban residents, and enhancement of urban vitality [49].
In brief, the LESS system achieves the comprehensive development of urban green spaces through the coordinated operation of the four systems (e.g., ecological protection, social harmony, economic prosperity, and spatial optimization), such that the residents’ sense of well-being and quality of life can be improved.

5.3. Targeted Planning and Management of Dominated Bundles

The five bundles (i.e., landscape-dominated, ecology-dominated, society-dominated, space-dominated, and composite-dominated bundles) take on critical significance in shaping the development and management of urban green spaces. However, in the pursuit of their individual objectives, challenges arise in the effects between trade-offs and synergies on the LESS system.
The landscape-dominated bundle stresses landscape connectivity, diversity, human suitability, and sustainability. Isolated and scattered areas hindering ecological functioning can be effectively avoided by enhancing the spatial continuity and integrity of green spaces [18]. Moreover, ensuring diverse vegetation and landscape elements while considering human needs for relaxation, play, and socialization can increase the overall appeal of urban green spaces [28].
The ecology-dominated bundle addresses ecological restoration, biodiversity preservation, surrounding environmental protection, and environmental monitoring. It is vital to employ ecological restoration technologies to enhance ecosystem stability and services [22]. Protecting and restoring biodiversity and reducing environmental pollution through greenbelts and environmental projects contribute to sustainable ecological development.
The society-dominated bundle places a focus on social justice, cultural identity, social welfare, and urban safety, with the aim of creating inclusive and vibrant urban spaces. While these goals are crucial for enhancing the well-being of urban residents, they may pose potential threats to the ecological integrity of green areas [45]. Accordingly, incorporating ecological considerations and adopting sustainable practices in the design and development of social amenities can help strike a balance between social benefits and ecological conservation.
The space-dominated bundle emphasizes boundary guidance, permeability, traffic reachability, and internal connectivity in green spaces. Effective boundary designs and permeability considerations can ensure public access while enhancing the user experience [47]. With the improvement of traffic reachability, the distance between the park and surrounding communities can be minimized, such that more people are encouraged to enjoy the benefits of urban green space [49]. Furthermore, optimizing the design of pathways and connectivity in the park can facilitate public walking and cycling experiences.
The composite-dominated bundle focuses on the harmonious coexistence of landscape and ecology, society and landscape, space and society, and space and ecology. Properly managing the development of buildings and roads in green areas can foster synergistic relationships between urban landscapes and ecological systems. Concurrently, integrating social facilities, such as fitness equipment and rest areas, while preserving the landscape’s integrity, contributes to the overall livability of the city [58].
To address the challenges and achieve a harmonious and integrated urban green space system, interdisciplinary collaboration among urban planners, landscape architects, ecologists, and social scientists is vital [56]. Additionally, adaptive management strategies that continuously monitor and assess the effects exerted by green space planning and development take on critical significance in ensuring the sustainability and resilience of urban green spaces [10]. By leveraging innovative technologies and community engagement, cities can effectively navigate the complexities and foster urban green spaces that enrich the lives of residents, support biodiversity, and contribute to a more sustainable and livable urban environment.

5.4. Limitation and Future Research

In this study, the trade-offs and synergies among the four systems (i.e., landscape, ecology, society, and space) of the parks in two greenbelts are investigated and certain explorations are made. However, there are some shortcomings in this study. Firstly, the sample size of the study is limited and may not be representative of the entire city. It is necessary to expand the scope of research and increase the sample size. Secondly, traditional statistical methods were used for bundles and dimensionality reduction in this study, which are unable to capture the full and accurate complexity and diversity of urban green space systems. In future studies, it may be possible to use advanced machine learning and artificial intelligence methods, such as deep learning, to better capture the characteristics and patterns of urban parks. In addition, this study focuses on the coordinated development of landscape, ecology, society, and space systems, and it is still necessary to examine the influence of other systems. It would be beneficial to conduct further studies focusing on how multiple systems interact in urban parks to gain more insight. Lastly, this study can contribute to future understanding of the interactions and influences among the LESS system, thereby improving planning, design, and management of urban parks.

6. Conclusions

Urban green and blue spaces (UGBS) present challenges with managing, designing, planning, and servicing under sophisticated urban systems, such that a more comprehensive and synergistic method is urgently required. Thus, the comprehensive LESS (landscape, ecology, society, and space) framework is proposed to gain insights into solutions and green space system services and guide the relevant research. In the area of two greenbelts surrounding Foshan City, the research reveals functional and structural differences among the four systems (i.e., landscape, ecology, society, and space systems). Notably, green spaces of the inner ring exhibit higher social and spatial effects, while green spaces of the outer ring exert higher ecological and landscape effects. Using the Self-Organizing Map model, the UGBS service bundles are classified into five distinct characteristics (i.e., landscape-dominated, ecology-dominated, society-dominated, space-dominated, and composite-dominated bundles) under the LESS system. Moreover, the geographically weighted regression model is employed to explore the correlation between trade-offs and synergies of the LESS systems in depth. It reveals a significant balancing relationship between the landscape system and the ecology system, while a lower synergistic relationship exists between the ecology system and the society system. The value realization mechanism of the LESS system comprises optimizing the interactions and coordination for fulfilling better urban planning and sustainable objectives. The integration of a wide variety of systems can expedite the collaboration and development of urban ecology and society for enhancing their multifaceted benefits formulated and sustainable development goals.

Author Contributions

Conceptualization, L.C. and Y.M.; methodology, L.C. and Y.M.; theoretical analysis, L.C.; data analysis, L.C.; writing—original draft preparation, L.C.; writing—review and editing, L.C. and Y.M. All authors have read and agreed to the published version of the manuscript.

Funding

This work was supported by the GuangDong Basic and Applied Basic Research Foundation (2023A1515011450).

Data Availability Statement

The data presented in this study are available upon request from the corresponding author.

Conflicts of Interest

The authors declare no conflict of interest.

References

  1. Brander, L.M.; Koetse, M.J. The value of urban open space: Meta-analyses of contingent valuation and hedonic pricing results. J. Environ. Manag. 2011, 92, 2763–2773. [Google Scholar] [CrossRef]
  2. Niemelä, J. Ecology and urban planning Biodiversity and Conservation. Biodivers. Conserv. 1999, 8, 119–131. [Google Scholar] [CrossRef]
  3. Gulsrud, N.M.; Hertzog, K.; Shears, I. Innovative urban forestry governance in Melbourne? Investigating “green placemaking” as a nature-based solution. Environ. Res. 2018, 161, 158–167. [Google Scholar] [CrossRef]
  4. Kong, F.; Yin, H.; Nakagoshi, N.; Zong, Y. Urban green space network development for biodiversity conservation: Identification based on graph theory and gravity modeling. Landsc. Urban Plan. 2010, 95, 16–27. [Google Scholar] [CrossRef]
  5. Subiza-Pérez, M.; Hauru, K.; Korpela, K.; Haapala, A.; Lehvävirta, S. Perceived Environmental Aesthetic Qualities Scale (PEAQS)—A self-report tool for the evaluation of green-blue spaces. Urban. For. Urban Green. 2019, 43, 126383. [Google Scholar] [CrossRef]
  6. Cohen-Shacham, E.; Walters, G.; Janzen, C.; Maginnis, S.; Adolphe, L. Nature-Based Solutions to Address Global Societal Challenges; IUCN (International Union for Conservation of Nature): Gland, Switzerland, 2016. [Google Scholar]
  7. Ives, C.D.; Lentini, P.E.; Threlfall, C.G.; Ikin, K.; Shanahan, D.F.; Garrard, G.E.; Bekessy, S.A.; Fuller, R.A.; Mumaw, L.; Rayner, L.; et al. Cities are hotspots for threatened species. Glob. Ecol. Biogeogr. 2016, 25, 117–126. [Google Scholar] [CrossRef]
  8. Secretariat of the Convention on Biological Diversity. Cities and Biodiversity Outlook: Action and Policy. Available online: https://www.cbd.int/doc/health/cbo-action-policy-en.pdf (accessed on 20 September 2022).
  9. Transforming Our World: The 2030 Agenda for Sustainable Development. Available online: https://sustainabledevelopment.un.org (accessed on 20 September 2022).
  10. Anguluri, R.; Narayanan, P. Role of green space in urban planning: Outlook towards smart cities. Urban. For. Urban Green. 2017, 25, 58–65. [Google Scholar] [CrossRef]
  11. Maas, J.; van Dillen, S.M.E.; Verheij, R.A.; Groenewegen, P.P. Social contacts as a possible mechanism behind the relation between green space and health. Health Place 2009, 15, 586–595. [Google Scholar] [CrossRef] [Green Version]
  12. Frantzeskaki, N.; McPhearson, T.; Kabisch, N. Urban sustainability science: Prospects for innovations through a system’s perspective, relational and transformations’ approaches. Ambio 2021, 50, 1650–1658. [Google Scholar] [CrossRef]
  13. Banzhaf, E.; Kabisch, S.; Knapp, S.; Rink, D.; Wolff, M.; Kindler, A. Integrated research on land-use changes in the face of urban transformations—An analytic framework for further studies. Land Use Policy 2017, 60, 403–407. [Google Scholar] [CrossRef]
  14. Enqvist, J.P.; Tengö, M.; Bodin, Ö. Are bottom-up approaches good for promoting social–ecological fit in urban landscapes? Ambio 2020, 49, 49–61. [Google Scholar] [CrossRef] [PubMed] [Green Version]
  15. Murtagh, F.; Contreras, P. Algorithms for hierarchical clustering: An overview. WIREs Data Min. Knowl. Discov. 2011, 2, 86–97. [Google Scholar] [CrossRef]
  16. Levers, C.; Müller, D.; Erb, K.; Haberl, H.; Jepsen, M.R.; Metzger, M.J.; Meyfroidt, P.; Plieninger, T.; Plutzar, C.; Stürck, J.; et al. Archetypical patterns and trajectories of land systems in Europe. Reg. Environ. Chang. 2018, 18, 715–732. [Google Scholar] [CrossRef]
  17. Li, S.; Zhao, Y.; Xiao, W.; Yellishetty, M.; Yang, D. Identifying ecosystem service bundles and the spatiotemporal characteristics of trade-offs and synergies in coal mining areas with a high groundwater table. Sci. Total Environ. 2022, 807, 151036. [Google Scholar] [CrossRef]
  18. Amaral, M.H.; Benites-Lazaro, L.L.; Antonio De Almeida Sinisgalli, P.; Prates Da Fonseca Alves, H.; Giatti, L.L. Environmental injustices on green and blue infrastructure: Urban nexus in a macrometropolitan territory. J. Clean. Prod. 2021, 289, 125829. [Google Scholar] [CrossRef]
  19. Brunsdon, C.; Fotheringham, A.S.; Charlton, M.E. Geographically weighted regression: A method for exploring spatial nonstationarity. Geogr. Anal. 1996, 28, 281–298. [Google Scholar] [CrossRef]
  20. McMillen, D. Geographically weighted regression: The analysis of spatially varying relationships. Am. J. Agric. Econ. 2004, 86, 554–556. [Google Scholar] [CrossRef]
  21. Ma, X.; Ji, Y.; Yuan, Y.; Van Oort, N.; Jin, Y.; Hoogendoorn, S. A comparison in travel patterns and determinants of user demand between docked and dockless bike-sharing systems using multi-sourced data. Transp. Res. Part A Policy Pract. 2020, 139, 148–173. [Google Scholar] [CrossRef]
  22. Standish, R.J.; Hobbs, R.J.; Miller, J.R. Improving city life: Options for ecological restoration in urban landscapes and how these might influence interactions between people and nature. Landsc. Ecol. 2013, 28, 1213–1221. [Google Scholar] [CrossRef] [Green Version]
  23. Carpenter, S.R.; Mooney, H.A.; Agard, J.; Capistrano, D.; Defries, R.S.; Diaz, S.; Dietz, T.; Duraiappah, A.K.; Oteng-Yeboah, A.; Pereira, H.M.; et al. Science for managing ecosystem services: Beyond the Millennium Ecosystem Assessment. Proc. Natl. Acad. Sci. USA 2009, 106, 1305–1312. [Google Scholar] [CrossRef]
  24. Masterson, V.A.; Enqvist, J.P.; Stedman, R.C.; Tengö, M. Sense of place in social–ecological systems: From theory to empirics. Sustain. Sci. 2019, 14, 555–564. [Google Scholar] [CrossRef] [Green Version]
  25. Rakowska, S.B.; Lutz, K.L.; Réquia, W.J.; Adams, M.D. Examining the effects of green space accessibility on school performance for 3421 elementary schools. Landsc. Urban Plan. 2023, 234, 104731. [Google Scholar] [CrossRef]
  26. Dramstad, W.E.; Tveit, M.S.; Fjellstad, W.J.; Fry, G.L.A. Relationships between visual landscape preferences and map-based indicators of landscape structure. Landsc. Urban Plan. 2006, 78, 465–474. [Google Scholar] [CrossRef]
  27. University of Massachusetts-Produced Program. FRAGSTATS: Spatial Pattern Analysis Program for Categorical Maps. Available online: http://www.umass.edu/landeco/research/fragstats/fragstats.html (accessed on 20 September 2022).
  28. Herbst, H.; Förster, M.; Kleinschmit, B. Contribution of landscape metrics to the assessment of scenic quality—The example of the landscape structure plan Havelland/Germany. Landsc. Online 2009, 10, 1–17. [Google Scholar] [CrossRef]
  29. Xu, H.; Wang, M.; Shi, T.; Guan, H.; Fang, C.; Lin, Z. Prediction of ecological effects of potential population and impervious surface increases using a remote sensing based ecological index (RSEI). Ecol. Indic. 2018, 93, 730–740. [Google Scholar] [CrossRef]
  30. Ahmed, K.S. Comfort in urban spaces: Defining the boundaries of outdoor thermal comfort for the tropical urban environments. Energy Build. 2003, 35, 103–110. [Google Scholar] [CrossRef]
  31. Cohen, D.A.; Marsh, T.; Williamson, S.; Derose, K.P.; Martinez, H.; Setodji, C.; McKenzie, T.L. Parks and physical activity: Why are some parks used more than others? Prev. Med. 2010, 50, S9–S12. [Google Scholar] [CrossRef] [Green Version]
  32. Dadashpoor, H.; Azizi, P.; Moghadasi, M. Land use change, urbanization, and change in landscape pattern in a metropolitan area. Sci. Total Environ. 2019, 655, 707–719. [Google Scholar] [CrossRef]
  33. Fan, C.; Myint, S. A comparison of spatial autocorrelation indices and landscape metrics in measuring urban landscape fragmentation. Landsc. Urban Plan. 2014, 121, 117–128. [Google Scholar] [CrossRef]
  34. Masoudi, M.; Tan, P.Y. Multi-year comparison of the effects of spatial pattern of urban green spaces on urban land surface temperature. Landsc. Urban Plan. 2019, 184, 44–58. [Google Scholar] [CrossRef]
  35. Ha, J.; Kim, H.J.; With, K.A. Urban green space alone is not enough: A landscape analysis linking the spatial distribution of urban green space to mental health in the city of Chicago. Landsc. Urban Plan. 2022, 218, 104309. [Google Scholar] [CrossRef]
  36. Wang, H.; Zhang, M.; Wang, C.; Wang, K.; Wang, C.; Li, Y.; Bai, X.; Zhou, Y. Spatial and Temporal Changes of Landscape Patterns and Their Effects on Ecosystem Services in the Huaihe River Basin, China. Land 2022, 11, 513. [Google Scholar] [CrossRef]
  37. Półrolniczak, M.; Potocka, I.; Kolendowicz, L.; Rogowski, M.; Kupiński, S.; Bykowski, A.; Młynarczyk, Z. The Impact of Biometeorological Conditions on the Perception of Landscape. Atmosphere 2019, 10, 264. [Google Scholar] [CrossRef] [Green Version]
  38. Palang, H.; Fry, G.; Jauhiainen, J.S.; Jones, M.; Sooväli, H. Editorial: Landscape and Seasonality-Seasonal Landscapes. Landsc. Res. 2005, 30, 165–172. [Google Scholar] [CrossRef]
  39. Martins, T.A.L.; Adolphe, L.; Bonhomme, M.; Bonneaud, F.; Faraut, S.; Ginestet, S.; Michel, C.; Guyard, W. Impact of Urban Cool Island measures on outdoor climate and pedestrian comfort: Simulations for a new district of Toulouse, France. Sustain. Cities Soc. 2016, 26, 9–26. [Google Scholar] [CrossRef]
  40. Healey, S.; Cohen, W.; Zhiqiang, Y.; Krankina, O. Comparison of Tasseled Cap-based Landsat data structures for use in forest disturbance detection. Remote Sens. Environ. 2005, 97, 301–310. [Google Scholar]
  41. Zha, Y.; Gao, J.; Ni, S. Use of normalized difference built-up index in automatically mapping urban areas from TM imagery. Int. J. Remote Sens. 2003, 3, 583–594. [Google Scholar] [CrossRef]
  42. Barrera, F.D.L.; Reyes-Paecke, S.; Banzhaf, E. Indicators for green spaces in contrasting urban settings. Ecol. Indic. 2016, 62, 212–219. [Google Scholar] [CrossRef]
  43. La Rosa, D. Accessibility to greenspaces: GIS based indicators for sustainable planning in a dense urban context. Ecol. Indic. 2014, 42, 122–134. [Google Scholar] [CrossRef]
  44. Peña, L.; Casado-Arzuaga, I.; Onaindia, M. Mapping recreation supply and demand using an ecological and a social evaluation approach. Ecosyst. Serv. 2015, 13, 108–118. [Google Scholar]
  45. Frank, S.; Fürst, C.; Koschke, L.; Makeschin, F. A contribution towards a transfer of the ecosystem service concept to landscape planning using landscape metrics. Ecol. Indic. 2012, 21, 30–38. [Google Scholar] [CrossRef]
  46. Giles-Corti, B.; Broomhall, M.H.; Knuiman, M.; Collins, C.; Douglas, K.; Ng, K.; Lange, A.; Donovan, R.J. Increasing walking. Am. J. Prev. Med. 2005, 28, 169–176. [Google Scholar] [PubMed]
  47. Fan, P.; Xu, L.; Yue, W.; Chen, J. Accessibility of public urban green space in an urban periphery: The case of Shanghai. Landsc. Urban Plan. 2017, 165, 177–192. [Google Scholar] [CrossRef]
  48. Pietrzyk-Kaszyńska, A.; Czepkiewicz, M.; Kronenberg, J. Eliciting non-monetary values of formal and informal urban green spaces using public participation GIS. Landsc. Urban Plan. 2017, 160, 85–95. [Google Scholar] [CrossRef]
  49. Wright Wendel, H.E.; Zarger, R.K.; Mihelcic, J.R. Accessibility and usability: Green space preferences, perceptions, and barriers in a rapidly urbanizing city in Latin America. Landsc. Urban Plan. 2012, 107, 272–282. [Google Scholar] [CrossRef]
  50. Ekkel, E.D.; de Vries, S. Nearby green space and human health: Evaluating accessibility metrics. Landsc. Urban Plan. 2017, 157, 214–220. [Google Scholar] [CrossRef]
  51. Abdi, H.; Williams, L.J. Principal component analysis. Wiley interdisciplinary reviews. Comput. Stat. 2010, 2, 433–459. [Google Scholar]
  52. Melin, P.; Monica, J.C.; Sanchez, D.; Castillo, O. Analysis of Spatial Spread Relationships of Coronavirus (COVID-19) Pandemic in the World using Self Organizing Maps. Chaos Solitons Fractals 2020, 138, 109917. [Google Scholar] [CrossRef]
  53. Kupfer, J.A.; Farris, C.A. Incorporating spatial non-stationarity of regression coefficients into predictive vegetation models. Landsc. Ecol. 2007, 22, 837–852. [Google Scholar] [CrossRef]
  54. Gollini, I.; Lu, B.; Charlton, M.; Brunsdon, C.; Harris, P. GWmodel: An R Package for Exploring Spatial Heterogeneity using Geographically Weighted Models. J. Stat. Softw. 2015, 17, 1–50. [Google Scholar] [CrossRef] [Green Version]
  55. Xia, H.; Yuan, S.; Prishchepov, A.V. Spatial-temporal heterogeneity of ecosystem service interactions and their social-ecological drivers: Implications for spatial planning and management. Resour. Conserv. Recycl. 2023, 189, 106767. [Google Scholar]
  56. Bennett, E.M.; Peterson, G.D.; Gordon, L.J. Understanding relationships among multiple ecosystem services. Ecol. Lett. 2009, 12, 1394–1404. [Google Scholar] [PubMed]
  57. Newell, J.P.; Seymour, M.; Yee, T.; Renteria, J.; Longcore, T.; Wolch, J.R.; Shishkovsky, A. Green Alley Programs: Planning for a sustainable urban infrastructure? Cities 2013, 31, 144–155. [Google Scholar]
  58. Tzoulas, K.; Korpela, K.; Venn, S.; Yli-Pelkonen, V.; Kaźmierczak, A.; Niemela, J.; James, P. Promoting ecosystem and human health in urban areas using Green Infrastructure: A literature review. Landsc. Urban Plan. 2007, 81, 167–178. [Google Scholar]
  59. Mell, I.C.; Henneberry, J.; Hehl-Lange, S.; Keskin, B. Promoting urban greening: Valuing the development of green infrastructure investments in the urban core of Manchester, UK. Urban For. Urban Green. 2013, 12, 296–306. [Google Scholar]
Figure 1. Locations of the greenbelts around Foshan City, China.
Forests 14 01614 g001
Figure 2. General research steps.
Forests 14 01614 g002
Figure 3. The calculated score of the four systems of the UGBS includes landscape, ecology, society, and space.
Forests 14 01614 g003
Figure 4. The spatial distribution of five service bundles in the parks of the greenbelt in Foshan, represented by the radar map as the average value of four systems detected in each service bundle.
Forests 14 01614 g004
Figure 5. Comparison of the four systems of the inner ring and outer ring.
Forests 14 01614 g005
Figure 6. The value realization mechanism of the LESS system.
Forests 14 01614 g006
Table 2. The weights of indexes of four systems.
Landscape Pattern IndexEcological Effect IndexSocial Effect IndexSpatial Effect Index
IndexWeightIndexWeightIndexWeightIndexWeight
TA0.128NDVI0.390POD0.055BFR0.439
NP0.324BD0.129
LSI0.369WET0.408PAD0.151GBR0.315
CONTAG−0.307SD0.141
IJI0.193LST0.393RD0.153BWR0.214
SHDI0.287LD0.151
SHEI0.281NDBSISI−0.514TD0.142BR−0.292
AI−0.274IBI−0.513RA0.078BOR0.323
Table 3. The assessment of the trade-offs and synergies of the landscape, ecology, society, and space systems in the parks in Foshan greenbelts.
NumberParkLandscape System—Ecology SystemLandscape System—Society SystemLandscape System—Space SystemEcology System—Society SystemEcology System—Space SystemSociety System—Space System
P1Half Moon Island Wetland Park−0.198−0.2380.2210.0860.064−0.188
P2Riverside Wetland Park Children’s Park−0.280−0.598−1.1530.0880.015−0.164
P3Chancheng Zhongshan Park−0.142−1.172−0.2540.0520.072−0.220
P4Foshan New Town Riverside Wetland Park−0.278−2.6751.6320.0830.081−0.161
P5Green Island Lake Wetland Park−0.263−1.692−0.5040.0500.032−0.166
P6Nanhai National Fitness Sports Park−0.135−0.410−0.3360.0480.060−0.249
P7Qiandeng Lake Park−0.134−0.659−1.2990.0530.004−0.241
P8Shiwan Park−0.218−0.462−0.4550.0590.053−0.181
P9Shiwan Wetland Park−0.248−2.524−0.7840.084−0.020−0.171
P10Wang Bengang Forest Park−0.230−0.610−0.4100.0390.063−0.175
P11Wuyakou Park−0.131−0.448−0.2930.0580.070−0.251
P12Ying Yue Lake Park−0.112−0.697−0.4740.0750.055−0.230
P13Fishing Village Cultural Park−0.260−0.402−0.3180.0830.059−0.167
P14Zhouweiwei Park−0.273−0.557−0.6060.0720.044−0.162
P15Beijiao Park−0.549−0.584−0.7730.1230.033−0.144
P16Junlan Riverside Park−0.539−0.661−0.4930.1240.053−0.152
P17Hanlin Lake Park−0.577−1.147−0.2180.0050.076−0.105
P18Fengling Park−1.133−0.601−0.7430.1790.035−0.063
P19Linggui Park−0.703−2.808−0.8600.065−0.0250.010
P20Nanhai Wetland Park−0.349−0.629−0.598−0.0010.044−0.158
P21Sanshan Forest Park−0.479−0.677−0.514−0.0700.0510.176
P22Tianhu Forest Park−0.631−0.381−0.2530.1160.066−0.060
P23Fishermen’s Village Yueyun Park−0.653−0.654−0.4730.0780.055−0.052
P24Zhanqifeng Park−0.160−1.311−0.8170.0080.008−0.334
Disclaimer/Publisher’s Note: The statements, opinions and data contained in all publications are solely those of the individual author(s) and contributor(s) and not of MDPI and/or the editor(s). MDPI and/or the editor(s) disclaim responsibility for any injury to people or property resulting from any ideas, methods, instructions or products referred to in the content.