Article

Nutritional Status of Wood Melick (Melica uniflora Retz.) in a Natural Forest Stand in South-Western Poland

by
Anna Paszkiewicz-Jasińska
1,
Barbara Wróbel
1,*,
Wojciech Stopa
1,
Zuzanna Jakubowska
1,
Aleksandra Steinhoff-Wrześniewska
1 and
Waldemar Zielewicz
2
1
Institute of Technology and Life Sciences-National Research Institute, Falenty, 3 Hrabska Avenue, 05-090 Raszyn, Poland
2
Department of Grassland and Natural Landscape Sciences, Poznań University of Life Sciences, Wojska Polskiego 28, 60-637 Poznań, Poland
*
Author to whom correspondence should be addressed.
Forests 2023, 14(8), 1605; https://doi.org/10.3390/f14081605
Submission received: 1 July 2023 / Revised: 5 August 2023 / Accepted: 7 August 2023 / Published: 9 August 2023
(This article belongs to the Special Issue Forest Grazing)

Abstract

:
Melica uniflora Retz., commonly known as wood melick, is a grass species that is native to most of Europe. Melica uniflora grows in hardwood forests near Fagus species, providing vital food and shelter for forest wildlife. The nutritional status of wood melick is not sufficiently recognized. The study aims to identify the intrapopulation variability of Melica uniflora plants collected from natural forest habitats in Poland in terms of nutritional status variability in relation to stage development and the course of weather conditions. The research was conducted for two consecutive years: 2021 and 2022, in the area of the Ślęża Massif, near the town of Sobótka in Lower Silesia voivodeship (Poland). The material for analyses was collected from 10 natural forest sites twice: in July (I) and October (II). The content of nutritive components: crude protein (CP), crude ash (CA), neutral detergent fiber (NDF), acid detergent fiber (ADF), acid detergent lignin (ADL), and water-soluble carbohydrates (WSC) was evaluated. Relative feed value (RFV), dry matter digestibility (DDM), dry matter intake (DMI), cellulose (CL), and hemicellulose (HCL) content were calculated based on ADF and NDF. Melica uniflora plants contained 75.2 g·kg−1 DM of CP, 290.6 g·kg−1 DM of CF, 120.0 g·kg−1 DM of CA, and 25.9 g·kg−1 DM of WSC. The content of NDF was 637.6 g·kg−1 DM, ADF 407.5 g·kg−1 DM, and ADL 58.0 g·kg−1 DM. The nutritional status of wood melick depended on the course of weather conditions in the following years and its location, which changed during the growing season. Plants collected in the first year of the study contained more CL, NDF, and ADF fractions and less CA, ADL, and WSC. Melica uniflora plants harvested in June were characterized by higher CP (102.1 g·kg−1 DM) and WSC (30.1 g·kg−1 DM) content and lower content of remaining nutrients. It can be concluded that Melica uniflora plants can be a valuable source of these nutrients in the forage of forest animals.

1. Introduction

Grasses play a key role in maintaining the world’s ecosystems and biodiversity. They have a significant role in the nutrition of wildlife and domesticated species, mainly ruminants [1]. Wild grasses supplement forage resources, improve herbivore productivity in natural forests, and are a potentially good protein supplement, especially during critical periods of the year with scant quality and quantity of grass [2,3,4,5]. Knowledge of the forage value of wild grasses enables us to improve the condition of natural wildlife habitats [6]. The chemical composition of grasses is a factor that affects the attractiveness of wild grasses by influencing their forage value, while the presence of specific substances can enhance or reduce their palatability (e.g., tannin compounds) [7].
The grasses that make up the sward of traditional grasslands are well recognized, and as shown by studies, individual species vary in chemical composition. For instance, in terms of CP content, the amounts can range from 107–166 g·kg−1 of dry matter in species growing in Europe [8,9] and 59.4–119.4 g·kg−1 of dry matter in grasses in humid and mountainous areas of the west coast of the Indian Peninsula [2] to 97–124 g·kg−1 [10] in dry and extremely hot areas of the Arabian Peninsula. Chemical composition and the resulting forage value are also related to soil pH and nutrient abundance [10,11,12], the course of weather conditions (amount and distribution of precipitation and air temperature) [13], and the developmental stage of plants [14].
Among the 150 grass species described in Poland, the genus Melica L. is represented by five native species, two of which are forest species. The native species include Melica uniflora Retz. [8,15], Melica picta K. Koch [16], Melica transsilvanica Schur [17,18], Melica altissima L. [19], and Melica nutans L. [8,15,20]. These species are well-recognized botanically and in terms of their occurrence [20]. However, there is a lack of information on their chemical composition and nutritional value. Importantly, the forest species Melica uniflora and Melica nutans can supplement forage for wild ruminants, such as Capreolus capreolus (roe deer) [21], in forested areas in Poland. Thus, further research is needed to complete the information on the feed value of Melica uniflora species in particular.
Melica uniflora is mainly found in southern and western Poland, both in the lowlands and the foothills, and occasionally in the lower regale [22]. The species is often observed in the undergrowth layer on fertile beech sites, where it grows locally, often in patches [15,23]. In such a case, it makes up a larger share of the forage of herbivorous forest animals. In the classification of plant communities, Melica uniflora is characteristic of the association Galio odorati-Fagetum Rübel 1930 ex Sougnez et Thill (1959), of the alliance Fagion sylvaticae R.Tx. et Diem., of the class Fagetalia sylvaticae Pawł. in. Pawł., Sokoł. et Wall. (1928), and of the class Querco-Fagetea Br.-Bl. et Vlieg. (1937) [24]. Galio odorati-Fagetum is a relatively poor form of fertile beech. The composition of this association is dominated by Fagus L., sometimes with admixtures of other tree species, including Quercus L. and Carpinus L.
The chemical composition of Melica uniflora is similar to that exhibited by Melica nutans. However, some minor differences are noticeable. Firstly, Melica uniflora is characterized by a lower proportion of sugars and a tendency to produce larger amounts of lignin. Also, its mineral composition indicates a deficiency of phosphorus and the presence of cyanogenic glycosides [8,25]. The analysis of the chemical composition assessing the content of ascorbic acid, proline, and antioxidant activity showed that wood melick (Melica uniflora) can be classified as a plant with a high content of ascorbic acid (about 43 mg %) [26,27] which is favorable in terms of animal feed value. In addition, research conducted in Turkey [28] showed that Melica uniflora may be an important forage for Capreolus capreolus (roe deer) in Yenice Forests due to its antibacterial properties—both phenolic and antioxidant content. Results showed that an ethanolic extract from fresh leaves of Melica uniflora inhibited both Gram-positive and Gram-negative bacteria and yeasts.
Forest habitats are difficult environments for grasses to grow and develop, especially due to moisture, light, and nutrient deficiencies in the soil. There is also competition for water and light and a shortage of nutrients in the soil. These factors have a crucial impact on the nutritional value of grass species native to these habitats. The forage value of grasses is not constant and changes during the growing season. Knowing the forage value of plants available to wild ruminants during the full growing season (in July) and before the winter period (in October), when animals are preparing for the period of food shortage, is significant.
Information on the quality of forage for wild ruminants (knowledge of the forage value of wild grasses) is important, especially because the number of these animals in Poland has doubled in the last ten years to a state of more than 70,669 thousand [29], and grasses and other graminoids can account for 1/3 of the forage consumed (depending on the animal species) [4]. Due to the scarcity of information on the forage value of grasses of the genus Melica, research on Melica uniflora was undertaken.
The study aims to identify the intrapopulation variability of Melica uniflora plants growing in natural forest habitats in terms of nutritional status variability in relation to stage development and the course of weather conditions.

2. Materials and Methods

2.1. Study Area Characteristics

The research was conducted in Poland in the area of the Ślęża Massif (Figure 1).
According to the physic-geographical division of Poland [30], the Ślęża Massif belongs to the province of the Bohemian Massif, a subprovince of the Sudetes and Sudeten Foreland, and is the highest elevation of the Sudeten Foreland. The massif is located in the Ślężanski Landscape Park. The highest elevation of the massif is Ślęża (50°51′54″ N, 16°42′31″ E) which reaches 718 m above sea level, and its relative height is about 500 m [31,32]. Most of the Ślęża Massif is composed of alkaline and ultramafic rocks. [31,32,33,34]. The forest cover of the massif area is 84%, 20% of which is coniferous forests dominated by spruce (Picea sp.), 23% by deciduous forests with a high proportion of oak (Quercus sp.) and beech (Fagus sp.), and 41% by mixed forests. The remaining 16% comprises agricultural habitats.
One of the largest forest communities in terms of area is acid beech, which overgrows a large part of the Ślęża mountain with its peaks and middle parts. The habitat is characterized by a relatively species-poor groundcover mainly overgrown by grasses of little value to wildlife, mosses, and ferns [35,36]. Several scattered forest communities with small areas occur on the massif. These include fertile beech with a stand dominated by common beech (Fagus sylvatica L.). Such habitat occurs in the top parts of Mt. Ślęża in a mosaic with acid beech [37].

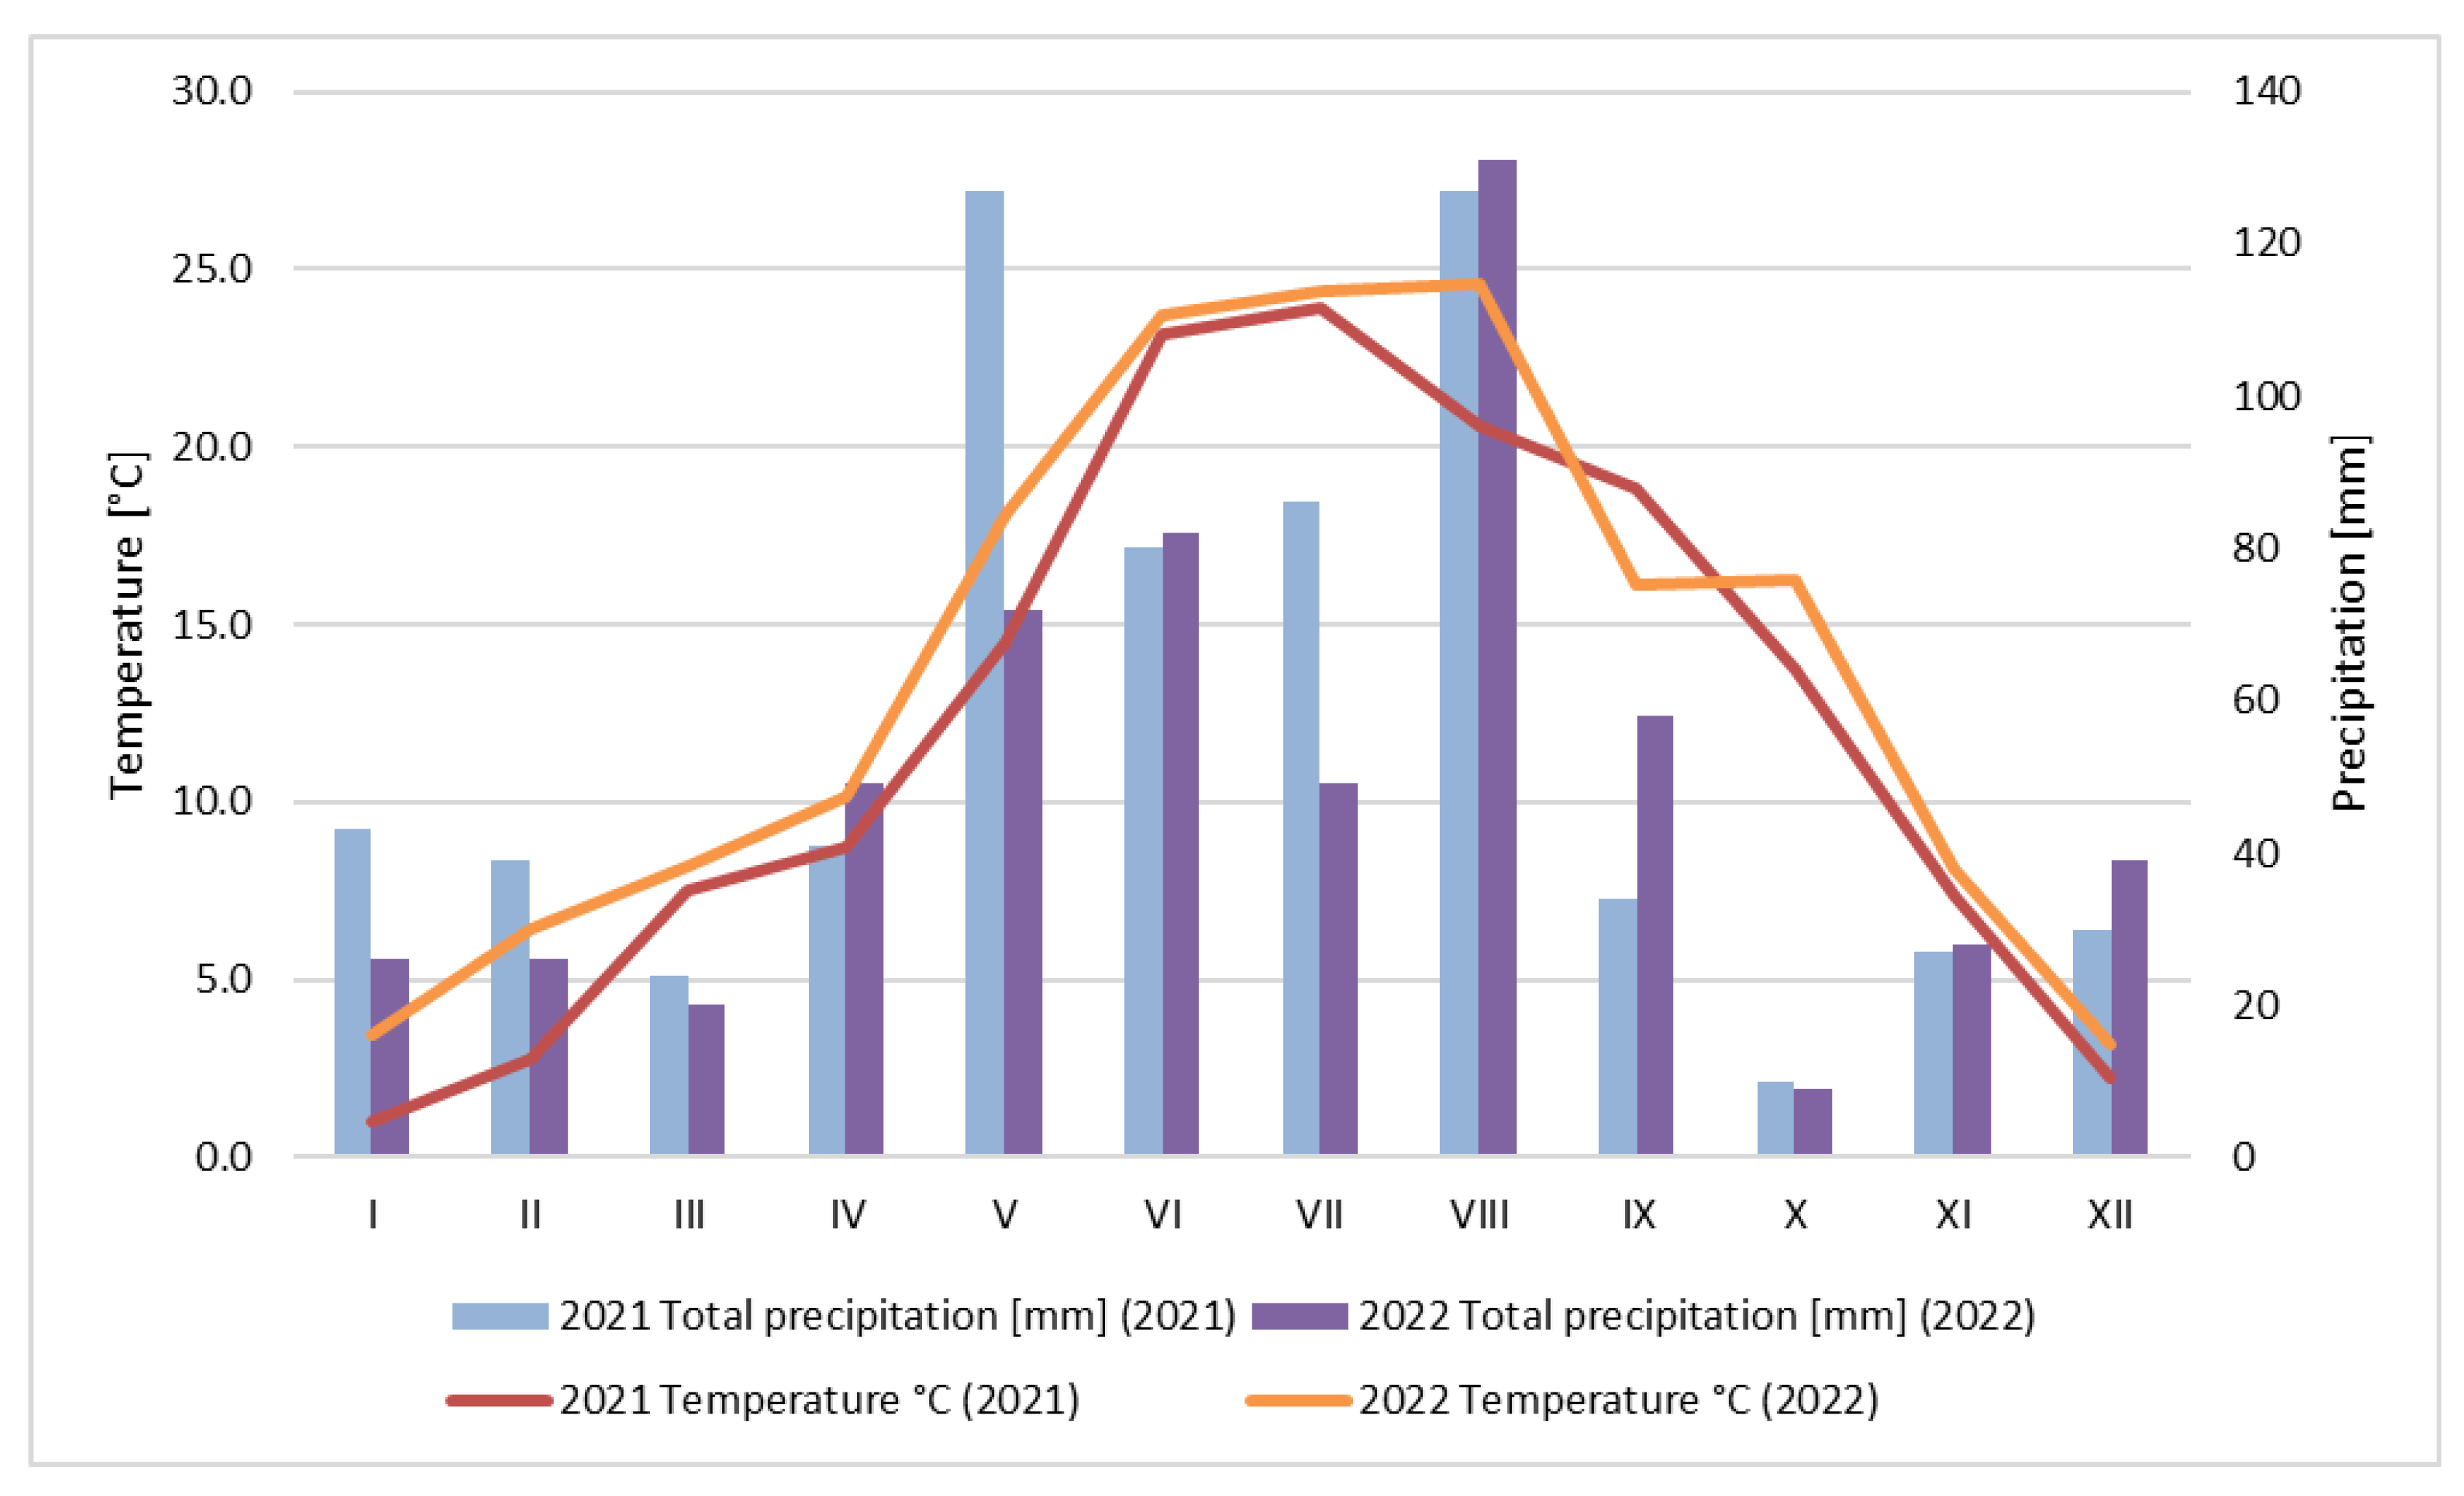
2.1.1. Weather Conditions

Weather data for the study area came from a public database of archived data available electronically, provided by OpenWeather-Map.org. [38]. The characterization of pluviothermic conditions was presented using the Sielianinov hydrothermal coefficient (HCT) [39]. Uses temperature and precipitation values and is sensitive to dry conditions specific to the climate regime being monitored. It is flexible enough to be used in both monthly and decadal applications. Useful in the monitoring of agricultural drought conditions and has also been used in climate classifications.
It is calculated according to the following formula:
HTC = (P∙10)/Σt
where:
P—the total monthly rainfall (mm),
Σt—the monthly total of average daily air temperatures > 0 °C.
A division into 10 classes of HTC–value was used:
extremely dry HTC ≤ 0.4, very dry 0.4 < HTC ≤ 0.7, dry 0.7 < HTC ≤ 1.0, fairly dry 1.0 < HTC ≤ 1.3, optimal 1.3 < HTC ≤ 1.6, fairly wet 1.6 < HTC ≤ 2.0, wet 2.0 < HTC ≤ 2.5, very wet 2.5 < HTC ≤ 3.0, and extremely wet HTC > 3.0.

2.1.2. Soil Conditions

In order to characterize soil conditions in the first year of the study, topsoil samples (0–10 cm) were taken from each site on the first harvest date. The following parameters were determined in the soil samples: soil pH measured in 1 mol KCl by the potentiometric method [40], soil abundance in N—modified by the Kjeldahl method; P—total phosphorus by the colorimetric method using ammonium molybdate and sodium metabisulphate; K—by the emission method; and Mg and Ca—by atomic absorption spectrometry (S Series AA Spectrometer, Thermo Fisher Scientific, Waltham, MA, USA).

2.2. Collection and Analysis of Plant Material

The study was conducted for two consecutive years (2021 and 2022), each year on two dates. Material for the analysis of the content of selected nutrients in wood melick (Melica uniflora) was collected from 10 natural forest sites located in the Ślęża Massif, near Sobótka, Lower Silesia Province (Poland).
The selection of sites for the surveys was done using the marshaling method [41]. The field marshaling method used in this study was aimed at a detailed penetration of the study area. Consisted of moving on foot in the study area and locating sites of Melica uniflora occurrence in it. A total of 10 localizations were found. In both survey years, samples of plant material for the study were taken from each site every year on two dates: on 13 July (the 1st date) and on 9 October (the 2nd date). The analytical material consisted of aboveground parts of the shoots of Melica uniflora. Plants for analysis were collected at the stages of full generative development (in July) and seed ripening (in October). In each location (1–10), four test plots with an area of 1 m2 were selected within 3 m of each other. From each plot, one 25 g subsample was collected. The total mass of the plant sample from the location intended for chemical analyses was 100 g of fresh mass (4 × 25 g).
To mark where the plant material was harvested and allow it to be harvested from the same locations the next year, numbered markers were placed at each site. Locations were pointed out using a Trimble Juno SB GPS receiver (Westminster, CO, USA). For each study site, the altitude was read and then the exposure was determined, as shown in Table 1.
The material for analyses of the nutritional quality of Melica uniflora was dried at 70 degrees Celsius to a constant weight to determine dry matter (DM) content. A chemical composition including crude protein (CP), crude ash (CA), neutral detergent fiber (NDF), acid detergent fiber (ADF), acid detergent lignin (ADL), and water-soluble carbohydrates (WSC) was determined with near infrared reflectance spectroscopy (NIRS) technology (NIRFlex N-500, Buchu, Flawil, Switzerland), using calibration for meadow hay. Analyses in three replications were performed. Cellulose (CL) and hemicellulose (HCL) contents were calculated by the following formulas:
CL = ADF − ADL
HCL = NDF − ADF
The RFV (dimensionless quantity) was calculated using the estimates of digestible dry matter (DDM%) and potential dry matter intake (DMI% of body weight) of the forage, based on the ADF and the NDF fractions, respectively, using the formulas [42]:
DDM = 88.9 − 0.779 × ADF (% of DM)
DMI = 120/NDF (% of body weight)
RFV = (DDM × DMI)/1.29
Based on the RFV index, the resulting forage was assigned to each quality class (quality class):
prime (RFV > 151), 1st (RFV 151–125), 2nd (RFV 124–103), 3rd (RFV 102–87), 4th (RFV 86–75), and 5th (RFV < 75).

2.3. Statistical Analysis

Statistical processing of the results was performed using Statistica v. 6.0 programs (Statsoft, Krakow, Poland). Before statistical analyses, the data were statistically tested for normality using the Shapiro–Wilk test and variance homogeneity using the Levene test. The results allow us to conclude that the distributions of the measured variables do not differ significantly from the normal distribution. The model included the fixed effects of year (Y), harvesting term (HT), and location (L). Random effects were: Y*HT, HT*L, Y*L, and Y*HT*L. Thereafter, a three-way analysis of variance (ANOVA) was used to examine variations between treatments. When the treatment effect was found to be significant, Tukey’s pairwise comparison was performed to isolate which treatment means were significantly different at a 5% significance level. Next, correlations between the parameters were calculated using Spearman’s rank order.

3. Results

3.1. Weather Conditions

The weather pattern during the study period (i.e., precipitation and temperature) is presented in Figure 2.
The Sielianinov hydrothermal coefficient (HTC) calculated from these meteorological data is presented in Table 2. For both years, the lowest values of the HTC occurred in October (0.2). This indicates that this month was extremely dry (HTC ≤ 0.4), mainly due to low rainfall (Figure 2). Also, September 2021 and July 2022 were very dry months, when the HTC was 0.6. In 2021, the highest value of the HTC (2.8) coefficient was reached in May, classifying it as a very wet month (2.5 < HTC ≤ 3.0), while in 2022, the highest value occurred in August, classifying it as quite wet. The average value of the HTC for the period April–October 2021 was 1.36, indicating that this period was optimal while the 2022 April–October period was fairly dry (HTC = 1.1).

3.2. Soil Conditions

The characteristics of soil conditions (pH, soil abundance in N, P, K, Mg, and Ca) at each test site are shown in Table 3.

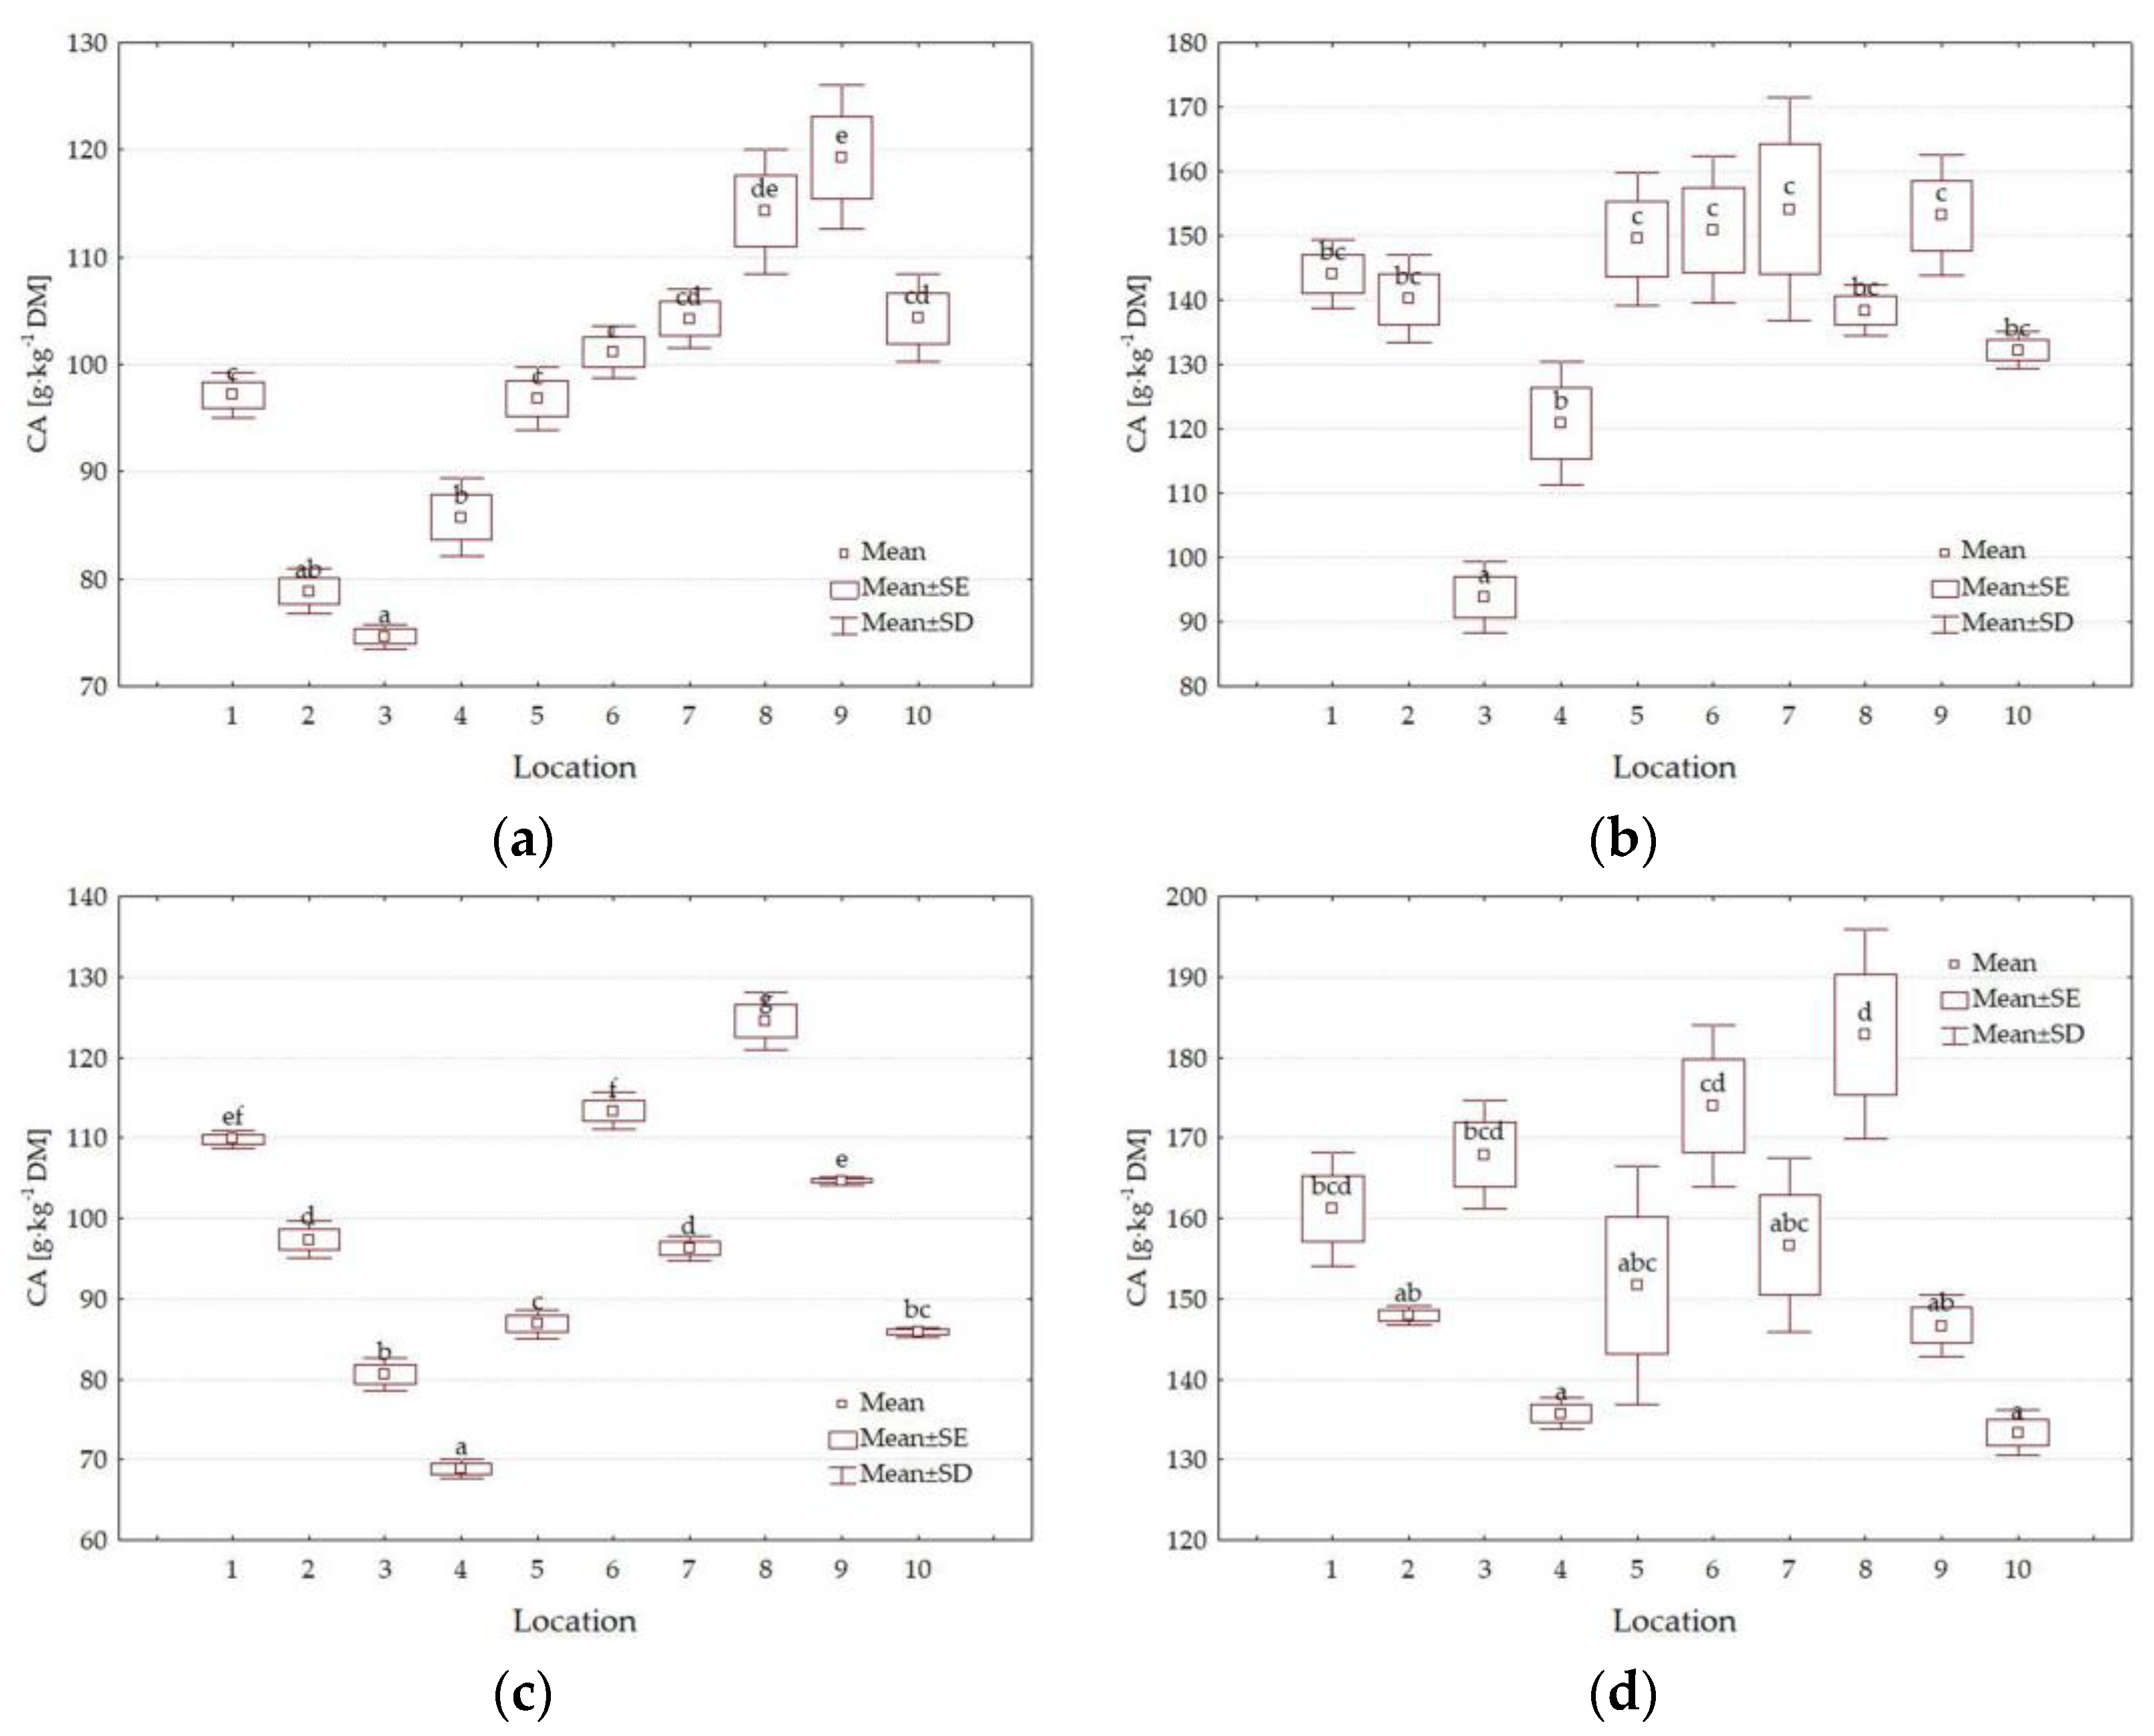
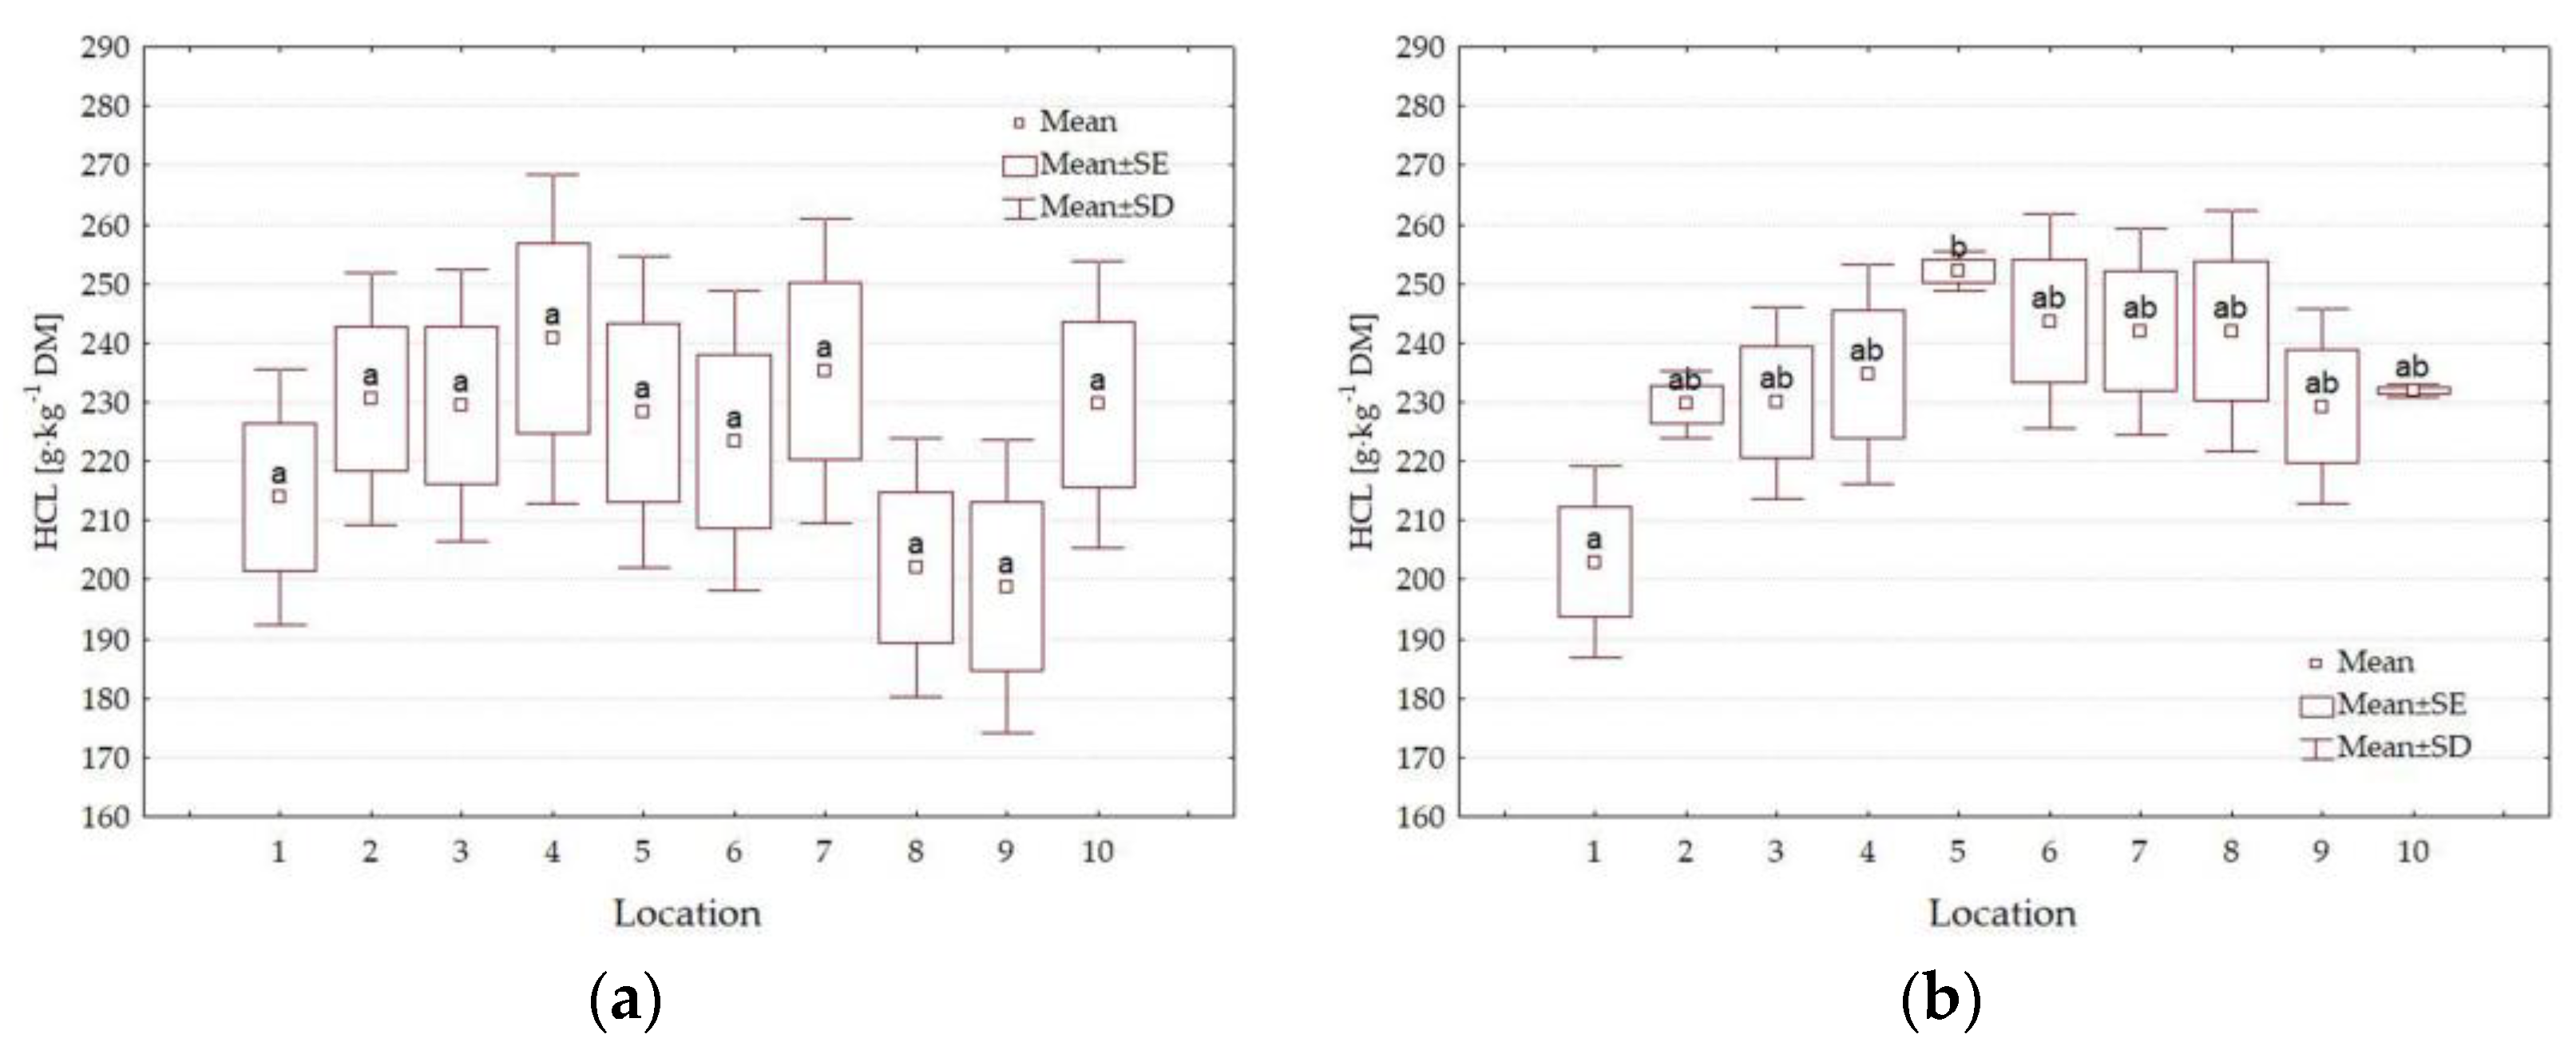
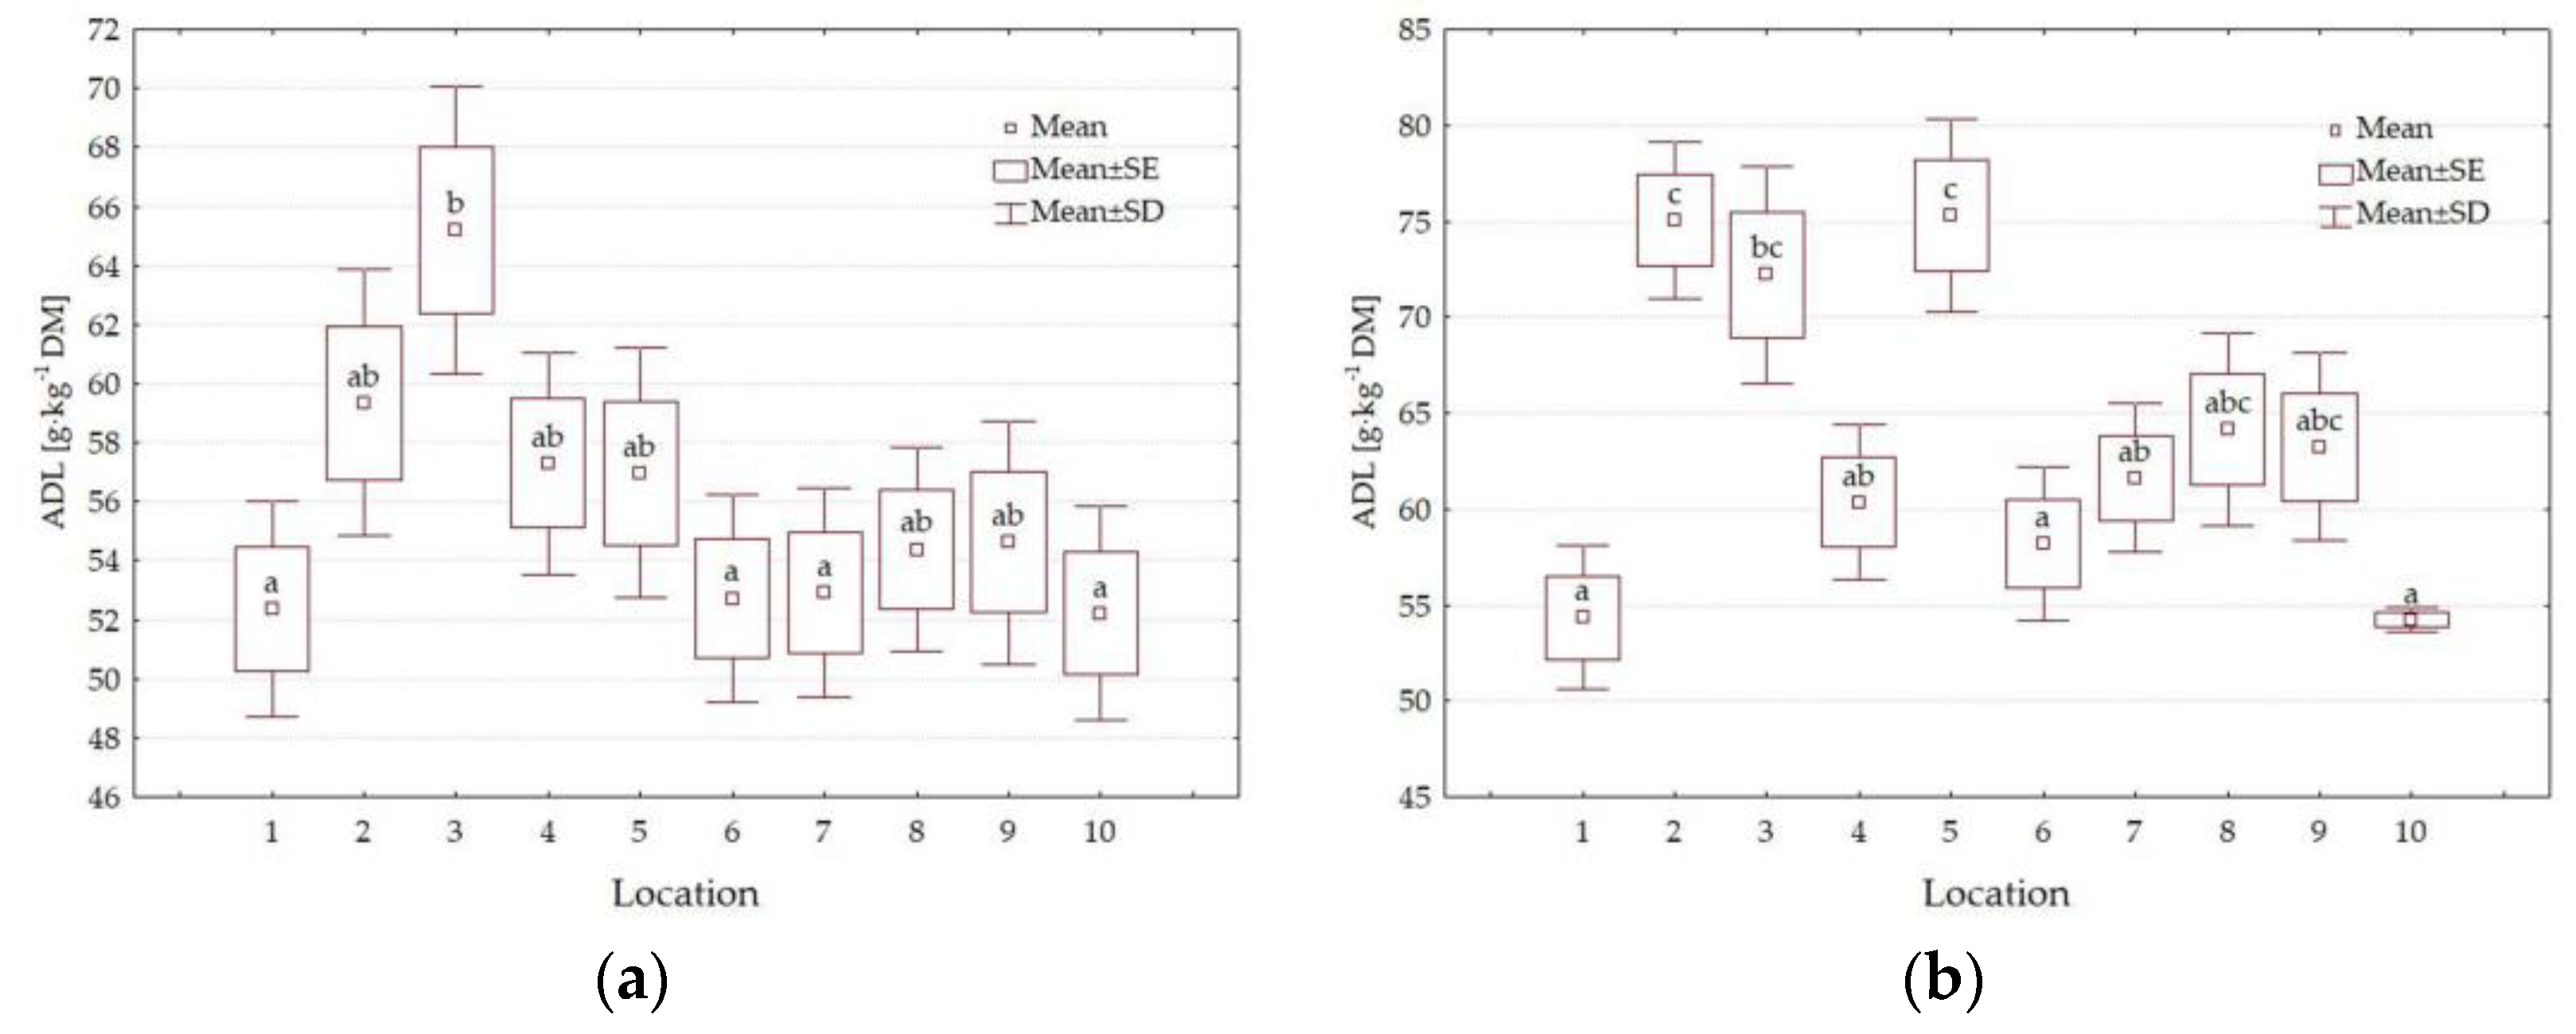
3.3. Chemical Composition

The effects of different factors and the interactions between them on studied parameters of Melica uniflora plants are shown in Table 4.
The DM content in Melica uniflora plants was quite high, averaging more than 470 g·kg−1 FM, differed significantly between the study years (Y), sites (L), and term of harvesting (HT), and significantly depended on the interaction of Y*HT, HT*L, and Y*HT*L (Table 4, Table 5, Table 6 and Table 7). Plants collected on the 1st date—in July—were characterized by a higher DM concentration than those collected on the 2nd date, i.e., in late autumn (Table 5).
The CP content of Melica uniflora plants was influenced both by the harvesting date and location. On the first harvest date, plants contained significantly more CP than on the second. Regardless of the harvest date, on average, the highest CP content was found in plants from sites No. 1 and 7, and significantly the lowest in site No. 5. No significant differences were found between the years of the study (Table 5). CP content significantly depended on interactions Y*HT, Y*L, H*L, and Y*HT*L (Table 4, Table 6, Table 7 and Table 8).
The figures show the results of the nutritional indicators of the Melica unfilora plant material sampled from each site over the years and harvest dates.
In the first year of the study (2021), the content of CP in plants collected in July ranged from 65.4 to 136.0 g·kg−1 DM. In autumn, at the end of the growing season, the content of this component was several times lower, ranging from 12.0 to 106.4 g·kg−1. On both dates, the highest CP content was found in plants from site 1 and significantly the lowest—in plants from site 5 (Figure 3a,b). In the second year of the study (2022), CP content ranged from 62.2 to 144.7 g·kg−1 DM on the first date and from 17.0 to 86.8 g·kg-1 DM on the second date. On the first date, the highest CP content was found in plants growing in site No. 2, and on the second date, in site No. 7. The lowest content of this component, as in the previous year, was found in M. uniflora plants growing in site No. 5 (Figure 3c,d).
CA content depended on harvest date (HT) and location (L) and on interactions Y*HT, HT*L, and Y*HT*L (Table 4, Table 5, Table 6 and Table 7). This content was significantly lower on the first date of plant collection than on the second date. On average, the highest CA content was recorded in plants harvested from sites 6 and 8, while the lowest was recorded in plants harvested from sites 3 and 4 (Table 5).
In the first year of the study, the content of CA in plants on subsequent dates was: on the first date, from 74.6 to 119.3 g·kg−1 DM; and on the second, from 93.9 to 154.2 g·kg−1 DM. Indeed, the highest amount of this component was recorded in plants collected at site No. 9 on the first date and in plants from sites No. 5, 6, 7, and 8 on the second date of the harvest. The lowest CA concentration on both dates was recorded in plants from site No. 3 (Figure 4a,b). In the second year, CA content on the first date of plant collection ranged from 68.9 to 124.5 g·kg−1 DM. On the second date, it was significantly higher, ranging from 133.4 to 183.0 g·kg−1 DM. On both harvest dates, the significantly highest CA content was detected in plants growing at site No. 8. On the first harvest date, the significantly lowest content of this component was recorded in plants from site No. 4, and on the second date, in plants harvested from sites No. 4 and 10 (Figure 4c,d).
The average CL content in Melica uniflora plants was 349.5 g·kg−1 DM and depended on years (Y), harvest date (HT), and interactions Y*HT, HT*L, Y*L, and Y*HT*L (Table 4, Table 5, Table 6, Table 7 and Table 8). Significantly more CL (by 25.0 g·kg−1 DM) was detected in plants harvested in the first year and collected in October (by 55.6 g·kg−1 DM). On average, the highest content of this component, regardless of harvest date and year of study, was found in plants from site No. 5, and the lowest—from site No. 1 (Table 5).
In the first year of the study, the CL content varied—from 315.7 to 366.1 g·kg−1 DM in July and from 336.4 to 423.1 g·kg−1 DM in October. The significantly highest CL concentration was recorded in plants harvested from site No. 5. On both test dates, the lowest CL content was observed in plants from site No. 1 (Figure 5a,b). In the second year, the CL content ranged from 298.2 to 335.7 g·kg−1 DM in July and from 317.8 to 389.8 g·kg−1 in October (Figure 5c,d). On average, the highest content of this component was found in plants growing at site 10. The significantly lowest content of this component, as in the previous year, was found in Melica uniflora plants growing in site No. 1 on both dates.
The HCL content in the evaluated plant material depended only on the location (L) and interactions: Y*HTL*L (Table 4 and Table 5). Indeed, the highest average HCL content, regardless of the collection date and the year, was found in plants growing at site 4, and the lowest at sites 8 and 9 (Table 5).
In the first year of the study, HCL content ranged from 198.8 to 240.8 g·kg−1 DM on the first date and from 203.0 to 252.2 g·kg−1 DM on the second date (Figure 6a,b). In the second year, it varied from 215.2 to 258.5 DM g·kg−1 on the first date and from 181.5 to 265.0 g·kg−1 DM on the second date. In 2021, the highest content was significantly characterized by plants from site No. 5, while the lowest was from site No. 1. In the following year, plants from site No. 10 contained significantly the most HCL and the least from site No. 3 (Figure 6c,d).
The ADL content of harvested plants depended on all the factors studied and their interactions (Table 4, Table 5, Table 6, Table 7 and Table 8). Plants harvested on the first date contained significantly less ADL than on the second harvest date. Melica uniflora, regardless of harvest date and year, contained the least ADLs on the first date and the most at site 3. The difference between the extreme values was 13.9 g·kg−1 DM. The average content of the component in question in plants in the first year of the study was significantly lower than in the second year of the study (by 6% on average) (Table 5).
In the first year of the study, ADL content in plants ranged from 52.3 to 65.2 g·kg−1 DM on the first date and from 54.2 to 75.3 g·kg−1 DM on the second date of plant harvest. On the 1st date of harvest, significantly the highest content of this component was recorded in plants harvested from site 3, and the lowest from sites 1, 6, 7, and 10 (Figure 7a,b). In the second year of the study, the ADL content of the plants ranged from 44.8 to 56.0 g·kg−1 DM and 49.5 to 70.7 g·kg−1 DM on the first and 2nd dates of harvest, respectively. In that year (2022), on the first and second dates of the harvest, significantly the highest content of this component was recorded in plants harvested from site 9, and the lowest from site 1 (Figure 7a,b).
For WSC content, significant differences were found in both harvesting dates (HT), study years (Y), and site (L) and interactions between all tested factors (Table 4, Table 5, Table 6, Table 7 and Table 8). In the July term, plants contained significantly more WSC (average 30.1 g·kg−1 DM) than in the autumn harvest (21.7 g·kg−1 DM). It was lower in the first year of the study than in the second year. On average, plants harvested at sites 1 and 5 had significantly the highest WSC content, and the lowest at sites 3, 6, 7, and 9 (Table 5).
In the first year, in plants harvested on the first date, WSC contents ranged from 14.3 (site No. 3) to 37.6 g·kg−1 DM (site No. 8) and did not differ significantly between sites. In the second term, the content of WSC ranged from 11.1 to 61.8 g·kg−1 DM. The highest content was found in plants growing at site No. 2, and the lowest at sites No. 1, 3, 4, 6, 7, 8, and 9 (Figure 8a,b). In the second year of the study, on the first date of harvest, the content of WSC varied between plants collected from different sites and ranged from 8.0 (site No. 2) to 78.8 g·kg−1 DM (site No. 5). On the second date, WSC content ranged from 7.4 to 49.5 g·kg−1 DM. The highest WSC content was recorded in plants growing at site No. 1 and the lowest at sites 3, 5, 7, 8, and 9 (Figure 8c,d).

3.4. Forage Quality Parameters

The content of NDF in the plants of the studied forest grass varied between dates (HT), years (Y), and sites (L) (Table 9). On the first date, plants contained significantly less of this component than on the second date (by 44.7 g·kg−1 DM). On average, the highest NDF content was found in plants harvested at site 5 and the lowest at site 1. The year of the study also significantly differentiated the NDF content, which was significantly higher in the first year than in the second (by 25.7 g·kg−1 DM) (Table 9). It was also influenced by interactions: Y*HT and Y*HT*L (Table 4 and Table 10). There is no interaction between HT*L (Table 11) but the interaction between Y*L was observed (Table 12).
In the first year of the study, the NDF content on the first day of harvest in the harvested plants from each site ranged from 582.0 to 660.7 g·kg−1 DM. On the second harvest date, differences in the content of this component in plants from individual sites were significant. The highest content was characterized by Melica uniflora harvested from site No. 5 (750.6 g·kg−1 DM) and the lowest from site No. 1 (593.7 g·kg−1 DM) (Figure 9a,b). In the second year of the study, on the first date of harvesting, the content of this component in harvested plants at each site was similar. On the first date, plants from site 10 had the highest NDF content, and those from site 1 had the lowest (Figure 9c,d).
The ADF content varied significantly across plant harvest dates (HT) and study years (L) (Table 9). It was also dependent on interactions (Table 4, Table 10, Table 11 and Table 12). On average, plant material samples harvested on the second date contained more ADF than on the first date (by 45.1 g·kg−1 DM). Melica uniflora harvested in the first year of the study contained more of this component than in the second year. On average, the highest content of this component was characterized by plants in site No. 5, significantly the lowest in site No. 1, and the difference between them was 66.5 g·kg−1 DM (Table 9).
In the first year of the study, on the first date of harvest, the ADF content in plants ranged from 368.0 to 431.3 g·kg−1 DM, while on the second date, it was higher, ranging from 390.7 to 498.5 g·kg−1 DM. On the first date of harvest, the highest content of the component was recorded in plants harvested at sites 3 and 5. Significantly, the lowest content on both harvest dates was found in plants from site 1 (Figure 10a,b). In the second year of the study, the ADF content of plants ranged from 345.7 to 389.7 on the first date of harvest and from 367.4 to 457.3 on the second date. Plants harvested on the first date at sites 9 and 10 had the highest ADF content, and from site 1, as in the first year of the study, the lowest content of this component (Figure 10a,b).
Significant differences were found in DDM between study years (Y), harvest dates (HT), and locations (L) (Table 9). Plants harvested in the second year of the study (57.7%), as well as on the first date of harvest (57.7%), had significantly higher DDM content. Regardless of the date and year of the study, on average, grass harvested from site No. 1 had significantly the highest DDM and the lowest from sites No. 5 and No. 9 (Table 9). The DDM was also dependent on interactions (Table 4, Table 10, Table 11 and Table 12).
In the first year of the study, DDM ranged from 53.4 to 60.9% on the first date of harvest and from 48.2 to 59.3% on the second date. On both harvest dates, plants harvested from site 1 had the highest DDM. On the first date, those from sites 3 and 5 had the lowest DDM, and on the second date, the lowest DDM was found in plants from site 5 (Figure 11a,b). In the second year, the DDM of the studied forest grass species ranged from 58.0 to 62.6% on the first date and from 52.1 to 61.3% on the second date. On the first date of harvesting, the highest significant DDM was found for plants harvested from sites 1 and 7, and the lowest from sites 4, 5, 9, and 10. On the second date of harvesting, the highest significant content was found for plants harvested from site 1, and the lowest from sites 9 and 10 (Figure 11c,d).
The DMI was significantly different between locations (L), harvesting dates (HT) of Melica uniflora, and years of the study (Y) (Table 9). It was also influenced by all interactions among the studied factors (Table 4, Table 10, Table 11 and Table 12). A higher mean DMI value in harvested plants was found in the second year of the study as well as in the first. Plants from site 1 had the highest significant mean DMI value and the lowest from sites 4, 5, and 10 (Table 9).
In the first year of the study, DMI ranged from 1.82 to 2.07% on the first date and from 1.60 to 2.03% on the second harvest date. Only on the second harvest date did plants differ significantly in DMI values between sites. Plants from site No. 1 had the highest DMI, while those from site No. 5 had the lowest (Figure 12a,b). In the second year of the study, the DMI value on the first date ranged from 1.87 to 2.08%, and the DMI value on the second date ranged from 1.67 to 2.06%. As in the first year of the study, significant differences in DMI between sites were recorded only in the second term of plant harvesting. The highest DMI was recorded in plants harvested from site 1 and the lowest from site 10 (Figure 12c,d).
The RFV index of the tested plants differed significantly between years (Y), harvest dates (HT), and locations (L) (Table 9). In the second year of the study, it was significantly higher than in the first year and was within the range of the 3rd quality class. On the other hand, the RFV index for the tested grass harvested on the first date was higher than on the second harvest date. The forage obtained on the first date of harvesting could be classified in the 3rd quality class, while on the second date, it could be classified in the 4th quality class. Regardless of the years of testing and the harvest date, significantly the highest RFV index (95) was found in the grass from site No. 1, which qualifies it for the 3rd quality class. The forage harvested from site No. 7 (RFV = 87) also belongs to the same quality class. The RFV index of plants from the other sites was lower, and the forage harvested from them qualified for the 4th quality class (Table 9). The RFV was also dependent on interactions (Table 4, Table 10, Table 11 and Table 12).
In the first year of the study, the RFV index of harvested plants from individual sites ranged from 77 to 96 on the first date (quality classes 3rd and 4th) and from 62 to 91 (3rd, 4th, and 5th quality classes) on the second date of harvest. Only plants harvested on the second date were characterized by significantly different RFV, with the highest harvested from site 1 and the lowest from site 5 (Figure 13a,b). In the second year of the study, as in the first year, differences significant for the RFV index between sites were shown for plants harvested on the second date, and its value ranged from 68 to 95 (quality classes 3rd, 4th, and 5th). The highest RFV (3rd quality class) was characterized by grasses harvested from site 1, and the lowest from site 2. In contrast, in the second year of the study, the RFV index ranged from 85 to 99 (3rd and 4th quality classes) at the first harvest date (Figure 13c,d).

3.5. Correlation between Nutrients

The results of the correlation analysis of individual nutrients in Melica uniflora plants in the study years and harvest dates are shown in Figure 14. In both years and harvest dates, a significant negative relationship was found between DM content and CP and DDM; CP content and CL, NDF, ADF, and ADL; CL and HCL content and DDM; DMI and RFV index; NDF content and DDM and RFV index; ADF content and DMI and RFV index; ADL content and DDM, DMI, and RFV index. On the other hand, a significant positive relationship in both harvest dates and years of the study was found between DM content and CL and ADF, CP content and DDM, DMI, RFV index, CL content and DM, HCL, NDF, ADF, ADL, HCL content and NDF and ADF, NDF content and CL, HCL, ADF, ADL, ADF content and ADL, DDM content and DMI and RFV index, DMI content and RFV index.

4. Discussion

The study aims to identify intrapopulation variability in the nutritional status of Melica uniflora plants harvested at the full generative development stage and towards the end of the vegetation season, growing in ten natural locations in forest habitats in Poland. Forest grasses are a group of plants whose biological, chemical, and morphological properties have not yet been fully investigated and described. There are few publications on the content of assimilation pigments in the leaves of forest grasses growing in Poland [6,27,43] and on selected morphological properties [20]. However, studies on the evaluation of the nutritional value of forest grasses growing in Poland have been published by Kozłowski et al. [8]. The study included such forest grass species as Brachypodium pinnatum (L.) P.B., Brachypodium silvaticum (Huds.) P. Beauv., Bromus Benekeni (Lange) Trimen, Calamagrostis epigejos (L.) Roth, Dactylis glomerata subsp. lobata (Dactylis aschersoniana Graebn.), Deschampsia caespitosa (L) P. Beauv., Deschampsia flexuosa L., Festuca ovina agg. L., Melica nutans, Melica uniflora, Milium effusum L., Molinia coerulea L. Moench.
The most important nutrient in grasses is CP. It is crucial, especially for forest animals, for which grasses may be the only major source of this nutrient. Protein is essential for animals because it is involved in the construction of their tissues and organs [5].
Protein content depends on many factors. Most importantly, it depends on the species, harvest time, and growth stage [44]. In the studied Melica uniflora samples, the average CP content was 75.2 ± 37.4 g·kg−1 DM and related to both post-harvest time and site location. According to Kozłowski et al. [8], the CP content at the stage of full generative development of Melica uniflora was 142.4 g·kg−1. Relating the CP content of the tested grass harvested on the first date to the aforementioned value, it can be concluded that only in two sites (Nos. 2 and 7) was it at a similar level; in the other site, it was significantly lower.
An important criterion for evaluating the nutritive value of forage, besides the CP, is the content of structural and non-structural carbohydrates [45]. The main non-structural carbohydrates in temperate grasses are WSC. Its content in temperate grasses is variable and normally low [46,47]. WSCs are completely digestible and play an important role in animal nutrition because they are a primary source of the readily available energy necessary for efficient microbial fermentation in the rumen [48]. The WSC content of the Melica uniflora plants studied was lower than that of the cultivated grass species [49] and also lower than that of the Melica uniflora plants reported by Kozłowski et al. [8].
The content of structural carbohydrates, i.e., cellulose, hemicellulose, and lignin, depends on many independent factors, including, among others, plant species and their development stage during the harvest and climatic conditions, mainly the amount of rainfall [44,50,51]. The content of structural carbohydrates in forage determines its nutritional value, digestibility, and intake by animals [52,53]. The content of structural carbohydrates determines the structure and stability of shoots and their positioning, as well as the deposition of leaves on them. Structural carbohydrates and lignins also determine the ability of shoots, especially generative shoots and the clumps that form them, to persist in specific habitats, making it easier for forest grasses to cover the lower floor of the mid-forest with turf. According to Kozłowski et al. [8], Melica uniflora, compared to other forest grass species, is a grass with rather low concentrations of cellulose (295.1 g·kg−1 DM) and hemicelluloses (193.8 g·kg−1 DM) and medium lignins (27.7 g·kg−1 DM). The average content of the above-mentioned components in the plants we examined was higher, especially in those harvested on the second date.
In the analyzed samples of Melica uniflora, the content of NDF averaged 637.6 ± 52.4 g·kg−1 DM, ADF—407.5 ± 39.1 g·kg−1 DM, ADL 58.0 ± 8.0 g·kg−1 and depended on all analyzed factors. On the first test date, plants contained significantly less NDF, ADF, and ADL than on the 2nd date.
Relative feed value (RFV) is an index that combines important nutritional factors (potential intake and digestibility) into a single number, providing a quick and effective method for evaluating feed value or quality. This indicator was also used, among others, by the team of Reiné et al. [45] to evaluate plant species present in the vegetation of the Pyrenean Mountain hay meadows, as well as by Stopa W. et al. [54] to assess the quality of the first swath of meadow sward harvested at different times or to assess the quality of roughage on organic farms [55].
The value of the RFV index for Melica uniflora in this study depended on both the study year and the harvesting date. Plants harvested in the second year and on the first date, i.e., in summer, had a significantly higher value of this indicator. Significant variation between locations was also observed. On average, the values were similar to those obtained for grasses included in extensively used meadows located in the Pyrenean Mountain area [45] and to the values of some hay samples on organic farms [55] and significantly lower than the values recorded for cultivated grass species [56,57] or legumes [58]. According to the quality categories described by Linn and Martin [42], the herb Melica uniflora can be classified into forage quality classes 3–4.

4.1. Impact of the Study Year

The different pluvio–thermal conditions in the following years of the study proved to be a significant factor in shaping the content of most of the nutrients evaluated. This was due to differences in the course of weather conditions in each year of the study. According to the literature data [13,50,59,60,61,62], weather conditions during plant growth, particularly temperature, and precipitation, can significantly affect forage quality. The effect of drought on forage quality is usually low or even positive, particularly if the stress on leaf mass is not severe. But temperature usually has a greater effect on the digestibility of grasses than other environmental factors. High temperatures typically increase plant growth rates and reduce leaf/stem ratios and digestibility.
Melica uniflora plants harvested in the second year of the study, 2022, were on average characterized by higher CP, CA, ADL, and WSC contents and lower NDF and ADF fractions due to different amounts of precipitation in the two growing seasons. The weather conditions in 2021 were optimal for plant development, while 2022 was quite dry; hence, the observed differences in the chemical composition of the plants of the studied grass were the effect of moderate drought stress. According to Halim et al. [63], moderate water stress, as observed in the second year of the study, usually delays plant maturation and results in maintaining forage quality at a higher level. Therefore, if drought-related leaf loss is not severe, a water deficit may even improve forage digestibility. The results of our study are consistent with those of other forage crop studies. A reduction of fiber fractions in grasses under drought conditions was also noticed by Borawska-Jarmułowicz et al. [64]. Similar reactions of grasses to drought stress consisting of significant WSC increases and decreases of NDF and ADF were observed by Fariaszewska et al. [65], Küchenmeister et al. [66], and Turner et al. [67].

4.2. Impact of Harvest Date

Plants of Melica uniflora were harvested twice during the season: in the full season (in the phase of full flowering) and at the end of the growing season, at the moment of the plant’s transition into the winter dormancy phase. As expected [50,68,69], the timing of harvesting proved to be an important factor in shaping the chemical composition of the plants and their feed value for forest animals. On the first date, in July, plants contained significantly more CP and less structural carbohydrates (NDF, ADF), which corresponded to the contents of these components in the 1st regrowth of pasture forage at the end of flowering [49]. On the 2nd date, i.e., in late autumn, Melica uniflora plants were characterized by significantly higher DM, ash, cellulose, and lignin contents and lower CP and WSC contents. The observed changes in the chemistry of Melica plants were partly due to changes in stems and leaves [70]. In early spring, young plants have a higher proportion of leaves relative to stems. Leaves generally have a higher digestibility, a lower fiber content, and twice the CP concentration of stems. Aging plants undergo morphological changes during the growing season, involving an increase in the proportion of leaves at the expense of flowers. For example, according to Minson [71], the average decrease in crude protein concentration with advance in maturity for several forages averaged 1 g·kg−1·d−1. The stems at harvest have a lower nutritional value than the leaves, which resulted in a significant reduction in the nutritional value of Melica plants. To sum this up, the maturity of the plants at the time of sampling had a significant impact on their chemical composition and nutritional value.

4.3. Impact of Location

In addition to the year of study and harvest date, the location in which the plants were grown proved to be an important factor.
Regardless of the harvesting date, on average, the highest nutritional value was characterized by plants harvested at site No. 1 and significantly the lowest by plants taken at site No. 5.
The composition and nutritive value of forage are influenced by the availability and uptake of several essential elements. The relationship between soil fertility and forage quality is not clearly defined and depends on the availability of essential nutrients. In our study, the CP content of Melica plants was positively correlated with soil P and K abundance and negatively with Ca content, while the content of fiber fractions (NDF, ADF, and ADL) was positively correlated with soil Mg abundance and negatively with P and K abundance. A negative correlation between pH and CP abundance and a positive correlation between ADF and ADL content were also proven. According to previous studies [72], low soil pH affects forage quality and plant growth by limiting the phyto-availability of soil nutrients (K, P, Mg, Ca, or Mo) and by controlling plant interactions with beneficial microorganisms in the rhizosphere.
Sunlight may have been an important factor in modifying the growth of plants and their chemical composition, especially in forest sites. Plants living on forest understories experience a strong reduction in radiation intensity, particularly in photosynthetically active radiation (PAR, 400–700 nm) [73]. At the same time, they experience light quality changes because of wavelength-dependent light absorption and reflection by surrounding vegetation [74]. Changes in light quality include a decrease in the intensity of red to far-red light, which is detected by the phytochrome family of plant photoreceptors [75]. Shading usually reduces the total non-structural carbohydrate of grasses but has variable (positive and negative) effects on cell wall content and composition, lignin, and the in vitro digestibility of plant dry matter. Plants grown in bright light tend to have higher digestibility than plants grown in shade. Conversely, low light intensity may increase the CP content of plants.
The results of our research on the nutritional value of Melica uniflora expand our modest knowledge of this group of forest grasses. The results obtained from the study of the chemical properties of this grass give grounds for the conclusion that this species can be a valuable source of forage for forest animals. The obtained studies indicate the need to continue research on Melica uniflora in order to better understand the chemical properties of this species and the presence of biologically active substances with potentially positive effects for forest animals or humans as a potential medicinal raw material.
It is planned to continue chemical analyses in the fields of quantitative and qualitative research. In order to develop research topics that give great opportunities in the search for new pharmacopoeial sources. It is important to determine the % of antioxidant capacity and the sum of phenolic compounds. Qualitative and quantitative analyses will allow for a better understanding of the species and will make it possible to learn about the diet of forest animals and compare it to the health of species in other habitats. This will make it possible to put forward the research hypothesis that pearl barley is more valuable for the health of forest fauna than other grass species.

5. Conclusions

The chemical composition and nutritional value of Melica uniflora plants were similar to the values characteristic of grasses growing on extensively used meadows and significantly lower than the values recorded for intensively cultivated grass species.
A significant factor shaping the content of most of the evaluated nutrients turned out to be the course of weather conditions during the growing season, in particular the deficiency of precipitation (moderate drought stress in 2022), which delayed the maturation of plants and caused a reduction of fiber fractions.
The chemical composition of the plants and the resulting nutritional value varied during the season. The nutrient content of plants harvested on the first date, in July, corresponded to the content of these nutrients in the first regrowth of pasture forage at the end of flowering. The nutritional value of plants harvested in autumn was typical of the values found in meadow hay.
In addition to the year of study and harvest date, different soil conditions and light intensity in the forest conditions in which the plants were grown proved to be important factors.
The results obtained from the study of the chemical properties of Melica uniflora provide a basis for the conclusion that this species can be a valuable source of food components for forest animals during the season, as green fodder, and outside the growing season, as dry biomass.

Author Contributions

Conceptualization, A.P.-J. and B.W.; methodology, A.P.-J. and W.Z.; software, B.W., W.S. and Z.J.; validation, A.P.-J., B.W. and W.S.; formal analysis, B.W.; investigation, A.P.-J.; resources, A.P.-J.; data curation, B.W. and W.S.; writing—original draft preparation, A.P.-J., B.W., A.S.-W., W.S. and Z.J.; writing—review and editing, W.Z. and A.S.-W.; visualization, W.S. and Z.J.; supervision, B.W.; project administration, A.P.-J.; funding acquisition, A.P.-J. All authors have read and agreed to the published version of the manuscript.

Funding

This research received no external funding.

Institutional Review Board Statement

Not applicable.

Informed Consent Statement

Not applicable.

Data Availability Statement

Not applicable.

Conflicts of Interest

The authors declare no conflict of interest.

References

  1. Gabryszuk, M.; Barszczewski, J.; Wróbel, B. Characteristics of grasslands and their use in Poland. J. Water Land Dev. 2021, 51, 243–249. [Google Scholar]
  2. Packialakshmi, M.; Palani Divya, M.; Baranidharan, K.; Geetha, S.; Nalliappan Ganesan, K.; Vijayabhama, M.; Manivasakan, S.; Hemalatha, P.; Radha, P.; Tilak, M.; et al. Exploring the Nutritional Potential of Wild Grass Fodder for Mega Herbivore (Elephas maximus) in the Foothills of Western Ghats. Animals 2022, 12, 2668. [Google Scholar] [CrossRef] [PubMed]
  3. Bengtsson, J.; Bullock, J.M.; Egoh, B.; Everson, C.; Everson, T.; O’Connor, T.; O’Farrell, P.J.H.; Smith, G.; Lindborg, R. Grasslands—More important for ecosystem services than you might think. Ecosphere 2019, 10, e02582. [Google Scholar] [CrossRef]
  4. Obidziński, A.; Kiełtyk, P.; Borkowski, J.; Bolibok, L.; Remuszko, K. Autumn–winter diet overlap of fallow, red, and roe deer in forest ecosystems, Southern Poland. Open Life Sci. 2013, 8, 8–17. [Google Scholar] [CrossRef]
  5. Parker, K.L.; Barboza, P.S.; Gillingham, M.P. Nutrition integrates environmental responses of ungulates. Funct. Ecol. 2009, 23, 57–69. [Google Scholar] [CrossRef]
  6. Zielewicz, W.; Kozłowski, S. Występowanie barwników chlorofilowych i karotenowych w trawach leśnych. Grassl. Sci. Pol. 2011, 14, 161–170. [Google Scholar]
  7. Bakshi, M.P.S.; Singh, M.P.; Wadhwa, M.; Singh, B. Evaluation of forest grasses as livestock feed. Livest. Res. Rural. Dev. 2005, 17, 127. [Google Scholar]
  8. Kozłowski, S.; Zielewicz, W.; Swędrzyński, A.; Olejarnik, Ł. Właściwości chemiczne traw leśnych. Grassl. Sci. Pol. 2012, 15, 109–118. [Google Scholar]
  9. Pontes, L.D.S.; Carrere, P.; Andueza, D.; Louault, F.; Soussana, J.F. Seasonal productivity and nutritive value of temperate grasses found in semi-natural pastures in Europe: Responses to cutting frequency and N supply. Grass Forage Sci. 2007, 62, 485–496. [Google Scholar] [CrossRef]
  10. Abu-Alrub, I.; Marcum, K.B.; Kabir, N.; Ahmed, A.; Al Hammadi, M. Productivity and nutritional value of four forage grass cultivars compared to Rhodes grass irrigated with saline water. Aust. J. Crop Sci. 2018, 12, 203–209. [Google Scholar] [CrossRef]
  11. Kuklová, M.; Hniličková, H.; Hnilička, F.; Pivková, I.; Kukla, J. Impact of expressway on physiology of plants and accumulation of risk elements in forest ecosystems. Plant Soil Environ. 2019, 65, 46–53. [Google Scholar] [CrossRef] [Green Version]
  12. Kuklová, M.; Kukla, J.; Hniličková, H.; Hnilička, F.; Pivková, I. Spatial variability of nutrients in soils and plants of forest ecosystems located near the highway. Environ. Monit. Assess. 2020, 192, 534. [Google Scholar] [CrossRef] [PubMed]
  13. Wróbel, B.; Zielewicz, W.; Paszkiewicz-Jasińska, A.; Spychalski, B.; Jakubowska, Z. Effect of harvest date on structural carbohydrates and lignin content in meadow sward in different pluvio-thermal conditions. J. Water Land Dev. 2022, 55, 60–66. [Google Scholar]
  14. Andueza, D.; Picard, F.; Note, P.; Carrère, P. Relationship between the chemical composition, nutritive value and the maturity stage of six temperate perennial grasses during their first growth cycle along an altitude gradient. Eur. J. Agron. 2021, 130, 126364. [Google Scholar] [CrossRef]
  15. Cyzman, W. Uwarunkowania siedliskowe i gospodarcze kształtowania naturalnych buczyn ze związku Fagion sylvaticae na granicy zasięgu buka zwyczajnego w Polsce północnej i środkowej. Zarządzanie Ochr. Przyr. Lasach 2013, 7, 38–65. [Google Scholar]
  16. Kazimierczakowa, R.; Zarzycki, K.; Mirek, Z. Polska Czerwona Księga Roślin: Paprotniki i rośliny Kwiatowe; Instytut Ochrony Przyrody Polskiej Akademii Nauk: Krakow, Poland, 2014. [Google Scholar]
  17. Szczesniak, E.; Krukowski, M.; Podlaska, M. Zanikanie perłówki siedmiogrodzkiej Melica transsilvanica Schur. w Sudetach polskich. Przyr. Sudet. 2018, 21, 9–22. [Google Scholar]
  18. Szczepaniak, M.; Cieslak, E. Genetic and morphological differentiation between Melica ciliata L. and M. transsilvanica Schur (Poaceae) in Europe reveals the non-presence of M. ciliata in the Polish flora. Acta Soc. Bot. Pol. 2011, 8, 301–313. [Google Scholar] [CrossRef] [Green Version]
  19. Biblioteka Cyfrowa UMSC (The Maria Curie-Skłodowska University). Available online: http://87.246.207.98/dlibra/docmetadata?id=16598&from=publication (accessed on 3 March 2023).
  20. Zielewicz, W.; Wróbel, B. Ocena wybranych cech morfologicznych perłówki zwisłej (Melica nutans) i perłówki orzęsionej (Melica ciliata). Grassl. Sci. Pol. 2019, 22, 107–121. [Google Scholar]
  21. Encyklopedia Leśna. Available online: https://www.encyklopedialesna.pl/haslo/perlowka/ (accessed on 3 March 2023).
  22. Mirek, Z.; Piękoś-Mirkowa, H. Trawy gór. In Księga Polskich Traw; Frey, L., Ed.; Instytut Botaniki im. W. Szaffera, PAN: Krakow, Poland, 2007; pp. 203–228. [Google Scholar]
  23. Ádám, R.; Ódor, P.; Bölöni, J. The effects of stand characteristics on the understory vegetation in Quercus petraea and Q. cerris dominated forests. Community Ecol. 2013, 14, 101–109. [Google Scholar] [CrossRef] [Green Version]
  24. Matuszkiewicz, W. Przewodnik do oznaczania zbiorowisk roślinnych Polski. In Vademecum Geobotanicum; Faliński, J.B., Ed.; Wyd. Nauk. PWN: Warszawa, Poland, 2007; Volume 3. [Google Scholar]
  25. Falkowski, M. Trawy Polskie; Państwowe Wydawnictwo Rolnicze i Leśne (PWRiL): Warszawa, Poland, 1982. [Google Scholar]
  26. Badridze, G.; Kacharava, N.; Chkhubianishvili, E.; Rapava, L.; Kikvidze, M.; Chigladze, L.; Chanishvili, S. Content of antioxidants in leaves of some plants of Tbilisi environs. Bull. Georg. Natl. Acad. Sci. 2013, 7, 105–111. [Google Scholar]
  27. Zielewicz, W.; Wróbel, B.; Niedbała, G. Quantification of chlorophyll and carotene pigments content in mountain melick (Melica nutans L.) in relation to edaphic variables. Forests 2020, 11, 1197. [Google Scholar] [CrossRef]
  28. Elif, Ç.İ.L.; Türkiş, S.; Ayvaz, M.Ç.; Kasurka, C.B. In vitro biological activity evaluation of ethanolic extract of Melica uniflora leaves. Eskişehir Tek. Üniversitesi Bilim Teknol. Derg.-C Yaşam Bilim. Biyoteknoloji 2021, 10, 17–26. [Google Scholar]
  29. GUS (Central Office of Statistics). Statistical Yearbook of Forestry. Warszawa, Poland, 2021. Available online: https://stat.gov.pl/files/gfx/portalinformacyjny/pl/defaultaktualnosci/5515/13/4/1/rocznik_sstatystyczn_lesnictwa_2021.pdf (accessed on 4 March 2023).
  30. Kondracki, J. Geografia Fizyczna Polski; Wyd. Nauk. PWN: Warszawa, Poland, 2000. [Google Scholar]
  31. Majerowicz, A. Textural features and symptoms of ocean floor metamorphism in the top part of the Sleza ophiolite (SW Poland). Arch. Mineral. 1994, 50, 97–140. [Google Scholar]
  32. Majerowicz, A. Krótki Przewodnik Terenowy po Skałach Ofiolitowego Zespołu Ślęży Oraz Ich Petrologicznej i Geologicznej Historii; Wydawnictwo Uniwersytetu Wrocławskiego: Wrocław, Poland, 2006. [Google Scholar]
  33. Majerowicz, A.; Pin, C. The main petrological problems of the Mt. Sleza ophiolite complex, Sudetes, Poland. Zentralblatt Geol. Paläontologie 1992, 1, 898–1018. [Google Scholar]
  34. Pin, C.; Majerowicz, A.; Wojciechowska, I. Upper Paleozoic oceanic crust in the Polish Sudetes: Nd Sr isotope and trace element evidence. Lithos 1988, 21, 195–209. [Google Scholar] [CrossRef]
  35. Badach, B.; Orczewska, A.; Cabala, S. Struktura i regeneracja drzewostanów w zespole przyrodniczo-krajobrazowym Uroczysko Buczyna w Chorzowie [Gorny Slask]. Rocz. Dendrol. 2004, 52, 55–73. [Google Scholar]
  36. Kubiak, D.; Szczepkowski, A. Lichens of the Rogów Forests of Warsaw University of Life Sciences (2): Bukowiec and Kwaśna Buczyna reserves. Ann. WULS–SGGW For. Wood Technol. 2009, 67, 168–175. [Google Scholar]
  37. Świerkosz, K. Siedliska wymagające tworzenia specjalnych obszarów ochrony na Dolnym Śląsku. In Opracowanie Ekofizjograficzne dla Województwa Dolnośląskiego; Wojewódzkie Biuro Urbanistyczne we Wrocławiu: Wrocław, Poland, 2005; pp. 183–194. [Google Scholar]
  38. OpenWeather. Available online: https://openweathermap.org/ (accessed on 6 March 2023).
  39. Selyaninov, G.T. Methods of Agricultural Climatology. Agric. Meteorol. 1930, 22L, 4–20. [Google Scholar]
  40. PN-EN ISO 10390:2022-09; PolishStandard: Soil, Treated Biowaste and Sludge—Determination of pH. Polish Committee for Standardizations: Warsaw, Poland, 2022. (In English)
  41. Küchler, A.W. Prosta metoda kartowania roślinności. In Annals of the Association of American Geographers; IGSO PAS: Warsaw, Poland, 1955. [Google Scholar]
  42. Linn, J.G.; Martin, N.P. Forage Quality Tests and Interpretations (Revised 1989); University Minnesota, Agricultural Extension Service: Minneapolis, MN, USA, 1989; Available online: https://conservancy.umn.edu/handle/11299/207442 (accessed on 10 March 2023).
  43. Kozłowski, S.; Goliński, P.; Golińska, B. Barwniki chlorofilowe jako wskaźniki wartości użytkowej gatunków i odmian traw. Zesz. Probl. Post. Nauk. Rol. 2001, 474, 215–223. [Google Scholar]
  44. Schlegel, P.; Wyss, U.; Arrigo, Y.; Hess, H.D. Mineral concentrations of fresh herbage from mixed grassland as influenced by botanical composition, harvest time and growth stage. Anim. Feed. Sci. Technol. 2016, 219, 226–233. [Google Scholar] [CrossRef] [Green Version]
  45. Reiné, R.; Ascaso, J.; Barrantes, O. Nutritional Quality of Plant Species in Pyrenean Hay Meadows of High Diversity. Agronomy 2020, 10, 883. [Google Scholar] [CrossRef]
  46. Kagan, I.A. Water- and ethanol-soluble carbohydrates of temperate grass pastures: A review of factors affecting concentration and composition. J. Equine Vet. Sci. 2022, 110, 103866. [Google Scholar] [CrossRef] [PubMed]
  47. Niyigena, V.; Ashworth, A.J.; Nieman, C.; Acharya, M.; Coffey, K.P.; Philipp, D.; Meadors, L.; Sauer, T.J. Factors Affecting Sugar Accumulation and Fluxes in Warm- and Cool-Season Forages Grown in a Silvopastoral System. Agronomy 2021, 11, 354. [Google Scholar] [CrossRef]
  48. Jafari, A.A. Environmental and genetic variation for water soluble carbohydrate content in cool season forage grasses. In Carbohydrates—Comprehensive Studies on Glycobiology and Glycotechnology; IntechOpen: Rijeka, Croatia, 2012; pp. 373–388. [Google Scholar]
  49. Dobrowolska, D. Normy Żywienia Bydła, Owiec i Kóz. Wartość Pokarmowa Pasz dla Przeżuwaczy; Wydanie II; Instytut Zootechniki: Krakow, Poland, 1997. [Google Scholar]
  50. Buxton, D.R. Quality-related characteristics of forages as influenced by plant environment and agronomic factors. Anim. Feed. Sci. Technol. 1996, 59, 37–49. [Google Scholar] [CrossRef]
  51. Rinne, M.; Nykanen, A. Timing of primary growth harvest affects the yield and nutritive value of timothy-red clover mixtures. Agric. Food Sci. Finl. 2000, 9, 121–134. [Google Scholar] [CrossRef]
  52. Buxton, D.R.; Brasche, M.R. Digestibility of structural carbohydrates in cool-season grass and legume forages. Crop Sci. 1991, 31, 1338–1345. [Google Scholar] [CrossRef]
  53. Kuoppala, K.; Ahvenjarvi, S.; Rinne, M.; Vanhatalo, A. Effects of feeding grass or red clover silage cut at two maturity stages in dairy cows. P. 2. Dry matter intake and cell wall digestion kinetics. J. Dairy Sci. 2009, 92, 5634–5644. [Google Scholar] [CrossRef] [Green Version]
  54. Stopa, W.; Wróbel, B.; Paszkiewicz-Jasińska, A.; Zielewicz, W. The effect of the timing of harvesting the first regrowth of the swardon relative feed value. J. Res. Appl. Agric. Eng. 2022, 67, 39–44. [Google Scholar]
  55. Jankowska-Huflejt, H.; Wróbel, B. Ocena przydatności pasz z użytków zielonych do produkcji zwierzęcej w badanych gospodarstwach ekologicznych. J. Res. Appl. Agric. Eng. 2008, 54, 103–108. [Google Scholar]
  56. Truba, M.; Sosnowski, J. The effect of Tytanit on fibre fraction content in Medicago x varia T. Martyn and Trifolium pratense L. cell walls. Agriculture 2022, 12, 191. [Google Scholar] [CrossRef]
  57. Truba, M.; Jankowski, K.; Wiśniewska-Kadżajan, B.; Sosnowski, J.; Malinowska, E. The effect of soil conditioners on the quality of selected forage grasses. Appl. Ecol. Environ. Res. 2020, 18, 5123–5133. [Google Scholar] [CrossRef]
  58. McDonald, I.; Baral, R.; Min, D. Effects of alfalfa and alfalfa-grass mixtures with nitrogen fertilization on dry matter yield and forage nutritive value. J. Anim. Sci. Technol. 2021, 63, 305–318. [Google Scholar] [CrossRef] [PubMed]
  59. Dumont, B.; Andueza, D.; Niderkorn, V.; Luscher, A.; Porqueddu, C.; Picon-Cochard, C. A meta-analysis of climate change effects on forage quality in grasslands: Specificities of mountain and Mediterranean areas. Grass Forage Sci. 2015, 70, 239–254. [Google Scholar] [CrossRef]
  60. Lascano, C.E.; Schmidt, A.; Barahona, R. Forage Quality and the Environment; University of Kentucky: Lexington, KY, USA, 2021. [Google Scholar]
  61. Peterson, P.R.; Sheaffer, C.C.; Hall, M.H. Drought effects on perennial forage legume yield and quality. Agron. J. 1992, 84, 774–779. [Google Scholar] [CrossRef]
  62. Catunda, K.L.; Churchill, A.C.; Power, S.A.; Zhang, H.; Fuller, K.J.; Moore, B.D. Plant structural and nutritional responses to drought differ among common pasture species. bioRxiv 2021. [Google Scholar] [CrossRef]
  63. Halim, R.A.; Buxton, D.R.; Hattendorf, M.J.; Carlson, R.E. Water-deficit effects on alfalfa at various growth stages. Agron. J. 1989, 81, 765–770. [Google Scholar] [CrossRef]
  64. Borawska-Jarmułowicz, B.; Mastalerczuk, G.; Janicka, M.; Wróbel, B. Effect of Silicon-Containing Fertilizers on the Nutritional Value of Grass–Legume Mixtures on Temporary Grasslands. Agriculture 2022, 12, 145. [Google Scholar] [CrossRef]
  65. Fariaszewska, A.; Aper, J.; Van Huylenbroeck, J.; De Swaef, T.; Baert, J.; Pecio, Ł. Physiological and Biochemical Responses of Forage Grass Varieties to Mild Drought Stress Under Field Conditions. Int. J. Plant Prod. 2020, 14, 335–353. [Google Scholar] [CrossRef] [Green Version]
  66. Küchenmeister, K.; Küchenmeister, F.; Kayser, M.; Wrange-Monning, N.; Isselstein, J. Influence of drought stress on nutritive value of perennial forage legumes. Int. J. Plant Prod. 2013, 7, 693–710. [Google Scholar]
  67. Turner, L.R.; Holloway-Phillips, M.M.; Rawnsley, R.P.; Donaghy, D.J.; Pembleton, K.G. The morphological and physiological responses of perennial ryegrass (Lolium perenne L.), cocksfoot (Dactylis glomerata L.) and tall fescue (Festuca arundinacea Schreb. syn. Schedonorus phoenix Scop.) to variable water availability. Grass Forage Sci. 2012, 67, 507–518. [Google Scholar]
  68. Elgersma, A.; Søegaard, K. Changes in nutritive value and herbage yield during extended growth intervals in grass legume mixtures: Effects of species, maturity at harvest, and relationships between productivity and components of feed quality. Grass Forage Sci. 2018, 73, 78–93. [Google Scholar] [CrossRef]
  69. Fychan, R.; Sanderson, R.; Marley, C. Effects of harvesting red clover/ryegrass at different stage of maturity on forage yield and quality. Grassl. Sci. Eur. 2016, 21, 323–325. [Google Scholar]
  70. Barnes, R.F.; Nelson, C.J.; Collins, M.; Moore, K.J. (Eds.) Forages, Volume 1: An Introduction to Grassland Agriculture, 6th ed.; Wiley-Blackwell: Ames, IA, USA, 2003. [Google Scholar]
  71. Minson, D.J. Forage in Ruminant Nutrition; Academic Press Inc.: New York, NY, USA, 1990; pp. 150–161. [Google Scholar]
  72. Schjoerring, J.K.; Cakmak, I.; White, P.J. Plant nutrition and soil fertility: Synergies for acquiring global green growth and sustainable development. Plant Soil 2019, 434, 1–6. [Google Scholar] [CrossRef] [Green Version]
  73. Da Silveira Pontes, L.; Maire, V.; Schellberg, J.; Louault, F. Grass strategies and grassland community responses to environmental drivers: A review. Agron. Sustain. Dev. 2015, 35, 1297–1318. [Google Scholar] [CrossRef]
  74. Gommers, C.M.M.; Visser, E.J.W.; Onge, K.R.S.; Voesenek, L.A.C.J.; Ronald, P. Shade tolerance: When growing tall is not an option. Trends Plant Sci. 2013, 18, 1360–1385. [Google Scholar] [CrossRef] [PubMed]
  75. Franklin, K.A. Shade avoidance. New Phytol. 2008, 179, 930–944. [Google Scholar] [CrossRef] [PubMed]
Figure 1. Location of Melica uniflora harvesting sites. Numbers 1–10 indicate the locations of plant sampling.
Forests 14 01605 g001
Figure 2. Weather conditions during the 2021–2022 growing season.
Forests 14 01605 g002
Figure 3. CP–crude protein content in Melica uniflora plants depending on the interaction of the location and term of harvesting (a) on the 1st date in 2021, (b) on the 2nd date in 2021, (c) on the 1st date in 2022, (d) on the 2nd date in 2022. Means with the same letter do not differ significantly at p < 0.05 in Tukey’s HSD test.
Forests 14 01605 g003
Figure 4. CA–crude ash content in Melica uniflora plants depends on the interaction of the location and term of harvesting (a) on the 1st date in 2021, (b) on the 2nd date in 2021, (c) on the 1st date in 2022, (d) on the 2nd date in 2022. Means with the same letter do not differ significantly at p < 0.05 in Tukey’s HSD test.
Forests 14 01605 g004
Figure 5. CL–cellulose content in Melica uniflora plants depends on the interaction of the location and term of harvesting (a) on the 1st date in 2021, (b) on the 2nd date in 2021, (c) on the 1st date in 2022, (d) on the 2nd date in 2022. Means with the same letter do not differ significantly at p < 0.05 in Tukey’s HSD test.
Forests 14 01605 g005
Figure 6. HCL–hemicellulose content in Melica uniflora plants depends on the interaction of the location and term of harvesting (a) on the 1st date in 2021, (b) on the 2nd date in 2021, (c) on the 1st date in 2022, (d) on the 2nd date in 2022. Means with the same letter do not differ significantly at p < 0.05 in Tukey’s HSD test.
Forests 14 01605 g006aForests 14 01605 g006b
Figure 7. ADL–acid detergent lignin content in Melica uniflora plants depends on the interaction of the location and term of harvesting (a) on the 1st date in 2021, (b) on the 2nd date in 2021, (c) on the 1st date in 2022, (d) on the 2nd date in 2022. Means with the same letter do not differ significantly at p < 0.05 in Tukey’s HSD test.
Forests 14 01605 g007aForests 14 01605 g007b
Figure 8. WSC–water-soluble carbohydrates content in Melica uniflora plants depends on the interaction of the location and term of harvesting (a) on the 1st date in 2021, (b) on the 2nd date in 2021, (c) on the 1st date in 2022, (d) on the 2nd date in 2022. Means with the same letter do not differ significantly at p < 0.05 in Tukey’s HSD test.
Forests 14 01605 g008aForests 14 01605 g008b
Figure 9. NDF–neutral detergent content in Melica uniflora plants depends on the interaction of the location and term of harvesting (a) on the 1st date in 2021, (b) on the 2nd date in 2021, (c) on the 1st date in 2022, (d) on the 2nd date in 2022. Means with the same letter do not differ significantly at p < 0.05 in Tukey’s HSD test.
Forests 14 01605 g009
Figure 10. ADF–acid detergent fiber content in Melica uniflora plants depends on the interaction of the location and term of harvesting (a) on the 1st date in 2021, (b) on the 2nd date in 2021, (c) on the 1st date in 2022, (d) on the 2nd date in 2022. Means with the same letter do not differ significantly at p < 0.05 in Tukey’s HSD test.
Forests 14 01605 g010
Figure 11. DDM–digestible dry matter content in Melica uniflora plants depends on the interaction of the location and term of harvesting (a) on the 1st date in 2021, (b) on the 2nd date in 2021, (c) on the 1st date in 2022, (d) on the 2nd date in 2022. Means with the same letter do not differ significantly at p < 0.05 in Tukey’s HSD test.
Forests 14 01605 g011
Figure 12. DMI–dry matter intake content in Melica uniflora plants depends on the interaction of the location and term of harvesting (a) on the 1st date in 2021, (b) on the 2nd date in 2021, (c) on the 1st date in 2022, (d) on the 2nd date in 2022. Means with the same letter do not differ significantly at p < 0.05 in Tukey’s HSD test.
Forests 14 01605 g012
Figure 13. RFV–relative forage value index of Melica uniflora plants depending on the interaction of the location and term of harvesting (a) on the 1st date in 2021, (b) on the 2nd date in 2021, (c) on the 1st date in 2022, (d) on the 2nd date in 2022. Means with the same letter do not differ significantly at p < 0.05 in Tukey’s HSD test.
Forests 14 01605 g013
Figure 14. Correlations between nutrients in Melica uniflora plants depending on the interaction of the location and term of harvesting (a) on the 1st date in 2021, (b) on the 2nd date in 2021, (c) on the 1st date in 2022, (d) on the 2nd date in 2022. DM–dry matter; CP–crude protein; CA–crude ash; CL–cellulose; HCL–hemicellulose; NDF–neutral detergent fiber; ADF–acid detergent fiber; ADL–acid detergent lignin; WSC–water soluble carbohydrates; DDM–digestible dry matter; DMI–dry matter intake; RFV–relative forage value.
Forests 14 01605 g014
Table 1. Characteristics of Melica uniflora study sites.
Site No.Geographical CoordinatesAltitudeExpositionLocation
M
150°53′16.7″ N
16°43′56.5″ E
335N-EMount Wieżyca
(another name for Mount Kościuszko)
250°53′13.3″ N
16°43′44.4″ E
411NMount Wieżyca
350°53′13.1″ N
16°43′44.4″ E
413NMount Wieżyca
450°53′10.3″ N
16°43′43.5″ E
414SMount Wieżyca
550°53′02.5″ N
16°43′44.1″ E
381NMount Bartoszek
650°52′51.7″ N
16°43′30.0″ E
389S-WMount Bartoszek
750°52′51.4″ N
16°43′30.1″ E
390S-WMount Bartoszek
850°52′56.3″ N
16°43′47.4″ E
368S-EMount Bartoszek
950°52′′56.5″ N
16°43′49.6″ E
367S-EMount Bartoszek
1050°52′57.7″ N
16°43′55.8″ E
358S-EMount Bartoszek
Table 2. Values of the Selyaninov hydrothermal coefficient (HTC).
Year/MonthIVVVIVIIVIIIIXX
20211.62.81.11.22.00.60.2
20221.61.31.20.61.71.20.2
extremely dry HTC ≤ 0.4, very dry 0.4 < HTC ≤ 0.7, dry 0.7 < HTC ≤ 1.0, fairly dry 1.0 < HTC ≤ 1.3, optimal 1.3 < HTC ≤ 1.6, fairly wet 1.6 < HTC ≤ 2.0, wet 2.0 < HTC ≤ 2.5, very wet 2.5 < HTC ≤ 3.0, and extremely wet HTC > 3.0.
Table 3. Characteristics of soil conditions of Melica uniflora harvesting sites.
Site No.Soil ReactionNPKMgCa
pHg·100 g−1 Soilg·100 g−1 Soilg·100 g−1 Soilg·100 g−1 Soilg·100 g−1 Soil
13.60.5070.0160.0050.0130.071
24.90.6780.0300.0050.0470.334
33.80.9710.0100.0040.0160.305
44.10.3320.0210.0030.0170.044
53.90.6350.0200.0040.0200.049
62.40.7270.0270.0050.0070.019
73.50.7240.0380.0040.0110.085
85.80.7640.0140.0040.0330.379
96.10.5010.0140.0030.0370.430
103.90.2090.0110.0030.0160.019
Table 4. Effect of different study factors and their interactions on studied parameters of Melica uniflora plants.
Factors
ItemYHTLY*HTHT*LY*LY*HT*L
p-value
DM g·kg−1 FM0.043<0.0010.054<0.001<0.0010.153<0.001
CP g·kg−1 DM0.563<0.001<0.001<0.001<0.0010.005<0.001
CA g·kg−1 DM0.124<0.0010.026<0.001<0.0010.054<0.001
CL g·kg−1 DM<0.001<0.0010.002<0.001<0.001<0.001<0.001
HCL g·kg−1 DM0.4950.926<0.0010.0690.0010.002<0.001
ADL g·kg−1 DM0.014<0.001<0.001<0.001<0.001<0.001<0.001
WSC g·kg−1 DM0.0480.0130.048<0.001<0.001<0.001<0.001
NDF g·kg−1 DM0.007<0.0010.003<0.001<0.001<0.001<0.001
ADF g·kg−1 DM<0.001<0.0010.002<0.001<0.001<0.001<0.001
DDM % of DM<0.001<0.0010.002<0.001<0.001<0.001<0.001
DMI % of body weight0.007<0.0010.002<0.001<0.001<0.001<0.001
RFV0.001<0.0010.002<0.001<0.001<0.001<0.001
Y—year; HT—term of harvesting; L—location; DM—dry matter; FM—fresh matter; CP—crude protein; CA—crude ash; CL—cellulose; HCL—hemicellulose; ADL—acid detergent lignin; WSC—water-soluble carbohydrates; NDF—neutral detergent fiber; ADF—acid detergent fiber; DDM—digestible dry matter; DMI—dry matter intake; RFV—relative forage value.
Table 5. Average values of the chemical composition of Melica uniflora.
FactorsLevel of FactorsDMCPCACLHCLADLWSC
g·kg−1 FMg·kg−1 DMg·kg−1 DMg·kg−1 DMg·kg−1 DMg·kg−1 DMg·kg−1 DM
Y2021482.1 b73.2 a117.7 a362.0 b228.5 a56.2 a22.5 a
2022465.4 a77.2 a126.3 a337.0 a231.5 a59.8 b29.3 b
HTI380.8 a102.1 b97.2 a331.6 a230.2 a53.3 a30.1 b
II566.7 b48.2 a146.8 b367.4 b229.8 a62.7 b21.7 a
L1389.8 a105.0 f128.1 cd318.2 a216.2 ab50.2 a37.0 b
2472.8 a88.2 cde116.1 b349.0 abc230.2 abc60.8 cd27.9 ab
3506.8 a77.2 bcd104.3 a355.5 abc218.6 abc64.1 d20.3 a
4507.5 a70.9 bc102.8 a354.6 abc246.8 c59.6 cd24.9 ab
5491.0 a39.2 a121.2 bc373.8 c240.9 abc61.0 cd38.7 b
6409.6 a81.1 bcd134.8 de344.8 abc234.6 abc53.9 ab19.1 a
7439.6 a97.6 ef127.8 cd333.5 ab234.3 abc54.7 ab19.3 a
8499.9 a63.6 b140.0 e352.0 abc219.1 a57.8 bc27.4 ab
9512.2 a62.9 b131.0 d361.9 bc215.3 a61.2 cd19.8 a
10508.4 a65.9 b113.9 b352.0 abc244.1 bc56.9 bc24.6 ab
Average 473.875.2122.0349.5230.058.025.9
Y–year; HT–term of harvesting; L–location; DM–dry matter; FM–fresh matter; CP–crude protein; CA–crude ash; CL–cellulose; HCL–hemicellulose; ADL–acid detergent lignin; WSC–water-soluble carbohydrates. Means with the same letter do not differ significantly at p < 0.05 in Tukey’s HSD test.
Table 6. Average values of the chemical composition of Melica uniflora for the combination of the year (Y) and term of harvesting (HT).
YHTDMCPCACLHCLADLWSC
g·kg−1 FMg·kg−1 DMg·kg−1 DMg·kg−1 DMg·kg−1 DMg·kg−1 DMg·kg−1 DM
2021I393.0 a96.8 b97.7 a345.4 b223.2 a55.8 b2.20 a
II571.2 b49.6 a137.8 b378.6 c233.8 a63.9 d2.30 a
2022I368.7 a107.5 b96.8 a317.8 a237.2 a50.9 a3.82 b
II562.1 b46.8 a155.8 c356.3 b225.8 a61.6 c2.03 a
Y—year; HT—term of harvesting; DM—dry matter; FM—fresh matter; CP—crude protein; CA—crude ash; CL—cellulose; HCL—hemicellulose; ADL—acid detergent lignin; WSC—water-soluble carbohydrates. Means with the same letter do not differ significantly at p < 0.05 in Tukey’s HSD test.
Table 7. Average values of chemical composition parameters of Melica uniflora for the combination of the term of harvesting (HT) and location (L).
HTLDMCPCACLHCLADLWSC
g·kg−1 FMg·kg−1 DMg·kg−1 DMg·kg−1 DMg·kg−1 DMg·kg−1 DMg·kg−1 DM
I1337.0 a120.4 e103.5 abcde309.3 a222.1 ab48.5 a38.7 ab
2379.0 ab117.5 e88.1 ab328.9 abc239.2 ab54.7 abcd14.4 a
3454.0 bc94.6 de77.6 a342.6 abcd231.4 ab58.7 abcdef30.5 ab
4455.5 bc91.9 de77.3 a342.2 abcd249.6 b55.4 abcd27.4 ab
5376.5 ab63.8 bcd91.9 abc348.2 abcd232.8 ab53.3 abcd53.2 b
6317.5 a118.5 e107.3 bcdef325.0 abc228.8 ab51.0 ab20.7 ab
7340.5 a124.2 e100.3 abcd316.4 ab240.9 ab50.2 ab23.5 ab
8400.0 ab97.8 de119.4 cdefg330.8 abc210.6 ab53.2 abcd40.5 ab
9362.2 ab98.4 de112.0 bcdef336.1 abc207.0 ab55.3 abcd27.9 ab
10386.2 ab94.1 de95.1 abc336.5 abc239.7 ab53.1 abcd24.4 ab
II1443.0 bc89.6 de152.6 hij327.1 abc210.2 ab51.9 abc35.4 ab
2566.5 efg59.0 bcd144.1 ghij369.0 cde221.2 ab66.8 ef41.4 ab
3559.3 de59.8 bcd130.9 efgh368.4 cde205.7 a69.6 f10.1 a
4559.8 de49.8 abc128.3 defgh367.0 cde243.9 ab63.9 def22.4 ab
5605.3 fg14.5 a150.6 hij399.4 e249.1 ab68.7 f24.2 ab
6501.5 cd43.8 abc162.4 j364.5 bcde240.5 ab56.9 abcde17.5 a
7538.7 cde71.0 cd155.4 hij350.5 abcd227.7 ab59.2 abcdef15.1 a
8599.5 efg29.4 ab160.7 ij373.2 cde227.6 ab62.5 cdef14.4 a
9662.5 g27.4 ab149.9 hij387.7 de223.7 ab67.0 ef11.7 a
10630.5 fg37.7 abc132.8 fghi367.4 cde248.5 ab60.7 bcdef24.7 ab
HT—term of harvesting; L—location; DM—dry matter; FM—fresh matter; CP—crude protein; CA—crude ash; CL—cellulose; HCL—hemicellulose; ADL–acid detergent lignin; WSC—water-soluble carbohydrates. Means with the same letter do not differ significantly at p < 0.05 in Tukey’s HSD test.
Table 8. Average values of chemical composition parameters of Melica uniflora for the combination of the year (Y) and location (L).
YLDMCPCACLHCLADLWSC
g·kg−1 FMg·kg−1 DMg·kg−1 DMg·kg−1 DMg·kg−1 DMg·kg−1 DMg·kg−1 DM
20211374.5 a121.2 c120.6 ab326.0 abcd208.5 a53.3 abcd18.8 a
2535.5 a68.9 abc109.5 ab382.1 fg230.1 ab67.2 de41.2 ab
3552.0 a71.1 abc84.3 a380.5 efg229.7 ab68.7 e13.5 a
4522.5 a72.9 abc103.3 ab356.8 abcdefg237.8 ab58.8 abcde14.9 a
5517.5 a38.7 a123.2 ab393.8 g240.2 ab66.2 cde32.1 ab
6370.0 a82.3 abc126.0 ab354.1 abcdefg233.5 ab55.5 abcde15.4 a
7436.5 a83.9 abc129.2 ab354.4 abcdefg238.6 ab57.3 abcde16.8 a
8518.5 a60.3 abc126.4 ab364.2 cdefg222.0 ab59.3 abcde25.3 ab
9505.0 a59.4 abc136.3 ab366.9 defg214.1 ab58.9 abcde19.6 a
10488.8 a72.8 abc118.3 ab341.2 abcdef230.8 ab53.2 abc27.7 ab
20221405.5 a88.8 abc135.5 ab310.4 a223.8 ab47.2 a55.3 b
2410.0 a107.6 abc122.7 ab315.9 abc230.3 ab54.4 abcd14.6 a
3461.3 a83.3 abc124.3 ab330.5 abcde207.5 a59.6 abcde27.0 ab
4492.8 a68.9 abc102.3 ab352.4 abcdefg255.8 b60.4 abcde34.9 ab
5464.3 a39.6 ab119.3 ab353.9 abcdefg241.7 ab55.9 abcde45.3 ab
6449.0 a80.0 abc143.7 ab335.4 abcdef235.7 ab52.4 abc22.8 ab
7442.7 a111.3 bc126.5 ab312.5 ab230.0 ab52.1 ab21.7 ab
8481.0 a66.9 abc153.7 b339.8 abcdef216.2 ab56.4 abcde29.6 ab
9519.6 a66.3 abc125.7 ab356.8 abcdefg216.6 ab63.4 bcde20.0 a
10527.8 a58.9 abc109.6 ab362.7 bcdefg257.3 b60.5 abcde21.4 ab
Y—year; L—location; DM—dry matter; FM—fresh matter; CP—crude protein; CA—crude ash; CL—cellulose; HCL—hemicellulose; ADL—acid detergent lignin; WSC—water-soluble carbohydrates. Means with the same letter do not differ significantly at p < 0.05 in Tukey’s HSD test.
Table 9. Average values forage quality parameters of Melica uniflora plants.
FactorsLevel of FactorsNDF
g·kg−1 DM
ADF
g·kg−1 DM
DDM
%
DMI
% of Body Weight
RFVQuality Class
Y2021650.4 b421.8 b55.5 a1.86 a80 a4th
2022624.7 a393.3 a57.7 b1.93 b87 b3rd
HTI615.2 a385.0 a58.4 b1.96 b89 b3rd
II659.9 b430.1 b54.9 a1.83 a78 a4th
L1584.6 a368.4 a59.6 b2.06 b95 b3rd
2640.0 bc409.7 cde56.4 ab1.89 ab83 ab4th
3638.2 bc419.6 def55.7 ab1.89 ab82 a4th
4661.0 bc414.2 def56.1 ab1.82 a79 a4th
5675.8 c434.9 f54.5 a1.79 a76 a4th
6633.3 bc398.7 bc57.3 ab1.90 ab85 ab4th
7622.4 ab388.2 ab58.1 ab1.94 ab87 ab3rd
8629.0 abc409.9 cde56.4 ab1.92 ab84 ab4th
9638.4 bc423.0 ef55.4 a1.89 ab82 a4th
10652.9 bc408.8 cde56.5 ab1.85 a81 a4th
Average 637.6407.556.61.89834th
Y–year; HT–term of harvesting; L–location; NDF–neutral detergent fiber; ADF–acid detergent fiber; DDM–digestible dry matter; DMI–dry matter intake; RFV–relative forage value; Quality class: prime (RFV > 151), 1st (RFV = 151–125), 2nd (RFV = 124–103), 3rd (RFV = 102–87), 4th (RFV = 86–75), and 5th (RFV < 75). Means with the same letter do not differ significantly at p < 0.05 in Tukey’s HSD test.
Table 10. Average values of forage quality parameters of Melica uniflora for the combination of the year (Y) and term of harvesting (HT).
YHTNDFADFDDMDMIRFV
g·kg−1 DMg·kg−1 DM%% of Body Weight
2021I624.5 ab401.2 b57.6 b1.93 bc86 a
II676.3 c442.5 c54.4 a1.78 a76 b
2022I605.9 a368.7 a60.2 c1.99 c93 c
II643.6 b417.8 b56.4 b1.88 b82 a
Y—year; HT–term of harvesting; NDF—neutral detergent fiber; ADF—acid detergent fiber; DDM—digestible dry matter; DMI—dry matter intake; RFV—relative forage value. Means with the same letter do not differ significantly at p < 0.05 in Tukey’s HSD test.
Table 11. Average values of forage quality parameters of Melica uniflora for the combination of term of harvesting (HT) and location (L).
HTLNDFADFDDMDMIRFV
g·kg−1 DMg·kg−1 DM%% of Body Weight
I1580.0 a357.8 a61.0 f2.07 d98.1 d
2622.9 ab383.7 abcd59.0 cdef1.93 abcd88.7 bcd
3632.7 abc401.3 abcde57.6 bcdef1.90 abcd85.3 abcd
4647.1 abc397.5 abcde57.9 bcdef1.86 abcd83.6 abcd
5634.3 abc401.5 abcde57.6 bcdef1.90 abcd84.9 abcd
6604.8 ab376.0 abc59.6 def1.99 bcd92.0 cd
7607.6 ab366.6 ab60.3 ef1.98 bcd92.8 cd
8594.6 ab384.0 abcd59.0 cdef2.02 bcd92.6 cd
9598.4 ab391.4 abcd58.4 cdef2.01 bcd91.1 bcd
10629.3 abc389.6 abcd58.5 cdef1.91 abcd86.9 bcd
II1589.2 ab379.1 abcd59.4 cdef2.04 cd94.0 cd
2657.0 abc435.8 def55.0 abc1.84 abcd78.9 abc
3643.7 abc438.0 def54.8 abc1.88 abcd80.2 abc
4674.9 bc430.9 cdef55.3 abcd1.78 abc76.5 abc
5717.3 c468.2 f52.4 a1.68 a68.5 a
6661.9 abc421.4 bcdef56.1 abcde1.82 abcd79.1 abc
7637.3 abc409.7 abcdef57.0 abcdef1.89 abcd83.9 abcd
8663.3 abc435.7 def55.0 abc1.82 abcd77.6 abc
9678.3 bc454.7 ef53.5 ab1.77 ab73.6 ab
10676.5 bc428.1 cdef55.6 abcd1.78 abc77.0 abc
HT—term of harvesting; L—location; NDF–neutral detergent fiber; ADF—acid detergent fiber; DDM—digestible dry matter; DMI—dry matter intake; RFV—relative forage value. Means with the same letter do not differ significantly at p < 0.05 in Tukey’s HSD test.
Table 12. Average values of forage quality parameters of Melica uniflora for the combination of the year (Y) and location (L).
YLNDFADFDDMDMIRFV
g·kg−1 DMg·kg−1 DM%% of Body Weight
20211587.9 ab379.4 ab59.3 cd2.05 c94.2 cd
2679.3 bc449.2 cd53.9 ab1.77 ab74.3 ab
3678.9 bc449.2 cd53.9 ab1.77 ab74.2 ab
4653.3 abc415.6 abcd56.5 abcd1.84 abc80.8 abcd
5700.2 c460.0 d53.1 a1.73 a71.4 a
6643.1 abc409.6 abcd57.0 abcd1.87 abc83.0 abcd
7650.3 abc411.7 abcd56.8 abcd1.85 abc81.8 abcd
8645.6 abc423.5 bcd55.9 abc1.87 abc81.5 abcd
9639.9 abc425.9 bcd55.7 abc1.89 abc81.9 abcd
10625.2 abc394.4 abc58.2 bcd1.92 abc86.7 abcd
20221581.3 a357.5 a61.0 d2.07 c97.9 d
2600.6 ab370.3 ab60.1 cd2.00 bc93.2 cd
3597.5 ab390.0 abc58.5 bcd2.01 bc91.3 bcd
4668.7 abc412.9 abcd56.7 abcd1.80 abc79.4 abc
5651.4 abc409.8 abcd57.0 abcd1.85 abc82.0 abcd
6623.6 abc387.8 abc58.7 bcd1.93 abc88.1 abcd
7594.6 ab364.6 ab60.5 cd2.02 bc94.9 cd
8612.4 abc396.2 abcd58.0 abcd1.97 abc88.6 abcd
9636.8 abc420.2 abcd56.2 abcd1.90 abc82.8 abcd
10680.6 bc423.3 bcd55.9 abc1.77 ab77.2 abc
Y—year; L—location; NDF—neutral detergent fiber; ADF—acid detergent fiber; DDM—digestible dry matter; DMI—dry matter intake; RFV—relative forage value. Means with the same letter do not differ significantly at p < 0.05 in Tukey’s HSD test.
Disclaimer/Publisher’s Note: The statements, opinions and data contained in all publications are solely those of the individual author(s) and contributor(s) and not of MDPI and/or the editor(s). MDPI and/or the editor(s) disclaim responsibility for any injury to people or property resulting from any ideas, methods, instructions or products referred to in the content.

