Abstract
While urban green spaces (UGSs) are important places for residents’ leisure activities, studies describing the long-term daily UGS usage of residents (including the total number of activities, the types of activities, and the touring experience) have not been conducted due to difficulties in data collection. Based on social media text data (SMTD), in this study, the total number of daily activities, the intensities of optional and social activities, and the daily touring experience in 100 UGSs in Xiamen, China, were inferred based on the ERNIE 3.0 text pre-training semantic classification model. Based on this, linear regression modeling was applied to analyze the internal environmental factors of the effects of places and external urban form factors regarding daily UGS usage. The research results revealed the following. (1) A descriptive study was conducted on the total numbers, types, and touring experience of activities using SMTD, and the results were verified by line transect surveys, management statistics, and a publicly available dataset. (2) The number of human activities in UGSs was found to be significantly influenced by historical and cultural facilities, nighttime lighting, population density, and the proportion of the floating population. (3) During the daytime, optional activities were found to be significantly influenced by the park type and historical and cultural facilities, and social activities were found to be significantly influenced by historical and cultural facilities and population density. In the evening, optional activities were found to be significantly influenced by the park type, historical and cultural facilities, nighttime lighting, and the proportion of the floating population, and social activities were found to be influenced by the proportion of the floating population. (4) Regarding the touring experience, in the daytime, the park type, green space ratio, and proportion of the floating population had significant effects on the touring experience. In the evening, the park type, historical and cultural facilities, and security factors were found to have significant effects on the touring experience. The methodology and findings of this study aid in the understanding of the differences in daytime and nighttime activities, and in the discovery of planning tools to promote human leisure activities in UGSs.
1. Introduction
Urban green spaces (UGSs) are one of the most important and popular places for residents’ activities [1,2]. Not only do UGSs have the effect of purifying the air [3], but their openness and safety also make them the first choice for almost all types of outdoor sports and leisure activities [4,5,6]; thus, they indirectly enhance physical, mental, and social health conditions by attracting residents to engage in physical and social activities [6,7,8,9,10,11,12,13,14,15,16,17,18,19]. This has led to UGSs becoming an essential activity space for cities. Residents are the first users of UGSs, and the conversion of the health benefits of UGSs relies on their use by residents [20,21]. Therefore, understanding the relationship between the characteristics and usage of UGSs is of great significance to the realization of health benefits [22].
As the pace of urban life continues to accelerate, nighttime urban public life is gradually becoming a continuation of daytime urban public life, and urban life has gradually begun to display a 24 h trend [23]. Therefore, the heterogeneity of the daily activities of residents in UGSs should be taken into account. For residents, the gradual increase in working hours and the decrease in the frequency of daytime outings have changed the rhythm of life, which indirectly induces certain chronic diseases and mental illnesses [24]. Nevertheless, the night provides a comfortable atmosphere and unique landscape experience for residents to engage in various leisure activities to recover from the fatigue and stress accumulated during the day, which is called the “need for recovery” [25,26]. The space for nighttime leisure activities has become a source of social wellbeing, community building, and psychological support [27]. Some local governments are encouraging the development of nighttime activities through the construction of nighttime spaces to promote economic development [28,29]. Overall, via a multiplicity of activities, both daytime and nighttime urban spaces can be a friendly and healthy place to promote the development of a city. However, few previous studies have addressed the differences in daily usage by residents in different UGSs. According to a questionnaire study, 78.5% of the people flow in parks occurs during the day [30]. Conversely, a different study has shown that the number of people who travel at night is 78.24% of the total number of those engaging in trips [31]. Nighttime leisure activities are taking up an increasing proportion of residents’ daily lives and for longer periods [31]. Although there is no clear conclusion on the influence of daytime and nighttime on residents’ activities in UGSs, there is no doubt that it is an influencing factor. Understanding the different daily activities of residents in UGSs reflects the residents’ preferences and habits in using UGSs. Therefore, for the planning and management of UGSs, it is of great significance to study the differences in the usage of UGSs by residents from the perspective of promoting public health behavior and the economy.
On the other hand, the use and planning of UGSs have been a constant topic considered by relevant scholars. This facet of research can be categorized as studies considering the internal environmental factors of UGSs and external urban form factors [32]. Scholars have pointed out that the difference in the design factors within UGSs, such as the green area ratio, historical and cultural facilities, and hydrophilicity, may cause differences in the length of use and experience of UGSs (Table 1). Moreover, these factors can affect the number of residents present in UGSs for different activities, such as physical and social activities, thus indirectly affecting public health. Regarding external factors, the equitable and equal access to UGSs has been a planning issue of great concern in the process of rapid urbanization, and ensuring the balanced and active participation of residents in UGSs is the main goal of planning [33]. Unbalanced planning, such as that with spatial deprivation and morphological differences [8], may be responsible for the differences in daily UGS usage (Table 1).

Table 1.
The existing pathways of the promotion of the potential impacts of UGS usage.
It can be seen that the total number of activities, the types of activities, and the touring experience are the main directions of the current research on UGS planning and design. The aforementioned studies related to the promotion of UGS usage, despite attracting some attention, were limited by the difficulty of collecting data on UGS usage, thus making it difficult to draw consistent conclusions [51,71]. As reported in Table 1, most studies adopted questionnaires, few exceeded the investigation of 30 parks using 1000 questionnaires, and very few analyzed different UGSs at the citywide scale. When studying the total number of people active in UGSs, questionnaires are usually used [31], and a few studies have used mobile signal data, night lighting data, Wi-Fi probe data, etc. [18,51,71,72]. Among these methods, the survey method does not allow for the simultaneous observation of the number of people at multiple sites in a city. Moreover, the spatial resolution of nighttime lighting data and mobile signaling data is between 100 and 3000 m [18,73]; thus, it is impossible to estimate the intensity and type of activity in smaller parks. On the other hand, in previous studies investigating the types of human activities, the use of questionnaires, activity notes, pedestrian counts, etc. [74], was largely time-consuming and difficult to carry out for large-scale parks. In addition, in recent years, the touring experience of parks (visitor satisfaction) has primarily been measured via questionnaires, semi-structured interviews, and wearable sensors [35,75,76]. However, these traditional methods have obvious limitations: questionnaires are limited by small sample sizes and low temporal and spatial resolution [77] and semi-structured interviews are often time-consuming, arduous, and dependent on the level of participant cooperation. Furthermore, wearable sensors are biased and costly in terms of data collection. Therefore, these methods cannot be used to fully explore the different impacts of UGSs on the touring experience.
With the rise of social media, people can share their feelings in a timely manner almost constantly [78]. By using social media text data (SMTD), it is possible to conduct research on the total numbers, types, and touring experience of human activities, free from the difficulties of collecting large amounts of data from traditional surveys, questionnaires, and interviews. Social media tools are increasingly being used to analyze the spatial and temporal patterns of visitor activity in UGSs, and the combination of geolocation SMTD with statistical methods is an important way to obtain information about park visits [32]. In one study on the total number of human activities, the correlation coefficient between SMTD and official park statistics was found to be 0.712 [79], indicating that SMTD can provide an approximate representation of actual park visits. In research on the types of activities, the use of SMTD with geographic information allows for the collection of information on a large scale and at a low cost; SMTD can provide information about the types of activities in which people engage (e.g., eating, working out, meeting friends, etc. [80,81,82,83,84,85,86]), thus allowing for the further investigation of their interactions with urban elements [87]. In addition, the emergence of semantic analysis methods for social media has provided researchers with the idea to measure touring experience. A few studies have used SMTD to measure textual affective tendencies with the help of various neural network sentiment analysis modules to calculate mental health and public mood in specific areas [88,89], as well as the types of activities; based on this, the impacts of urban or smaller-scale human habitats on human emotions, activities, and health have been explored.
Taking Xiamen, China, as an example, the research objectives of this study are to answer the following three questions regarding UGS usage: (1) What are the daily characteristics and influencing factors of the total number of residents’ activities? (2) What are the daily characteristics and influencing factors of different types of activities? (3) What are the daily characteristics and influencing factors of residents’ touring experience? To answer these questions, the daily UGS usage in 100 UGSs was quantified based on Weibo SMTD. Eight linear regression models incorporating both internal and external UGS design and location factors were used to analyze the correlations between various built environment factors and the impact on the daily UGS usage of residents. The results aid in the understanding of the differences in daytime and nighttime UGS usage, as well as the revelation of planning and design means to promote the daily leisure activities of residents.
2. Methods and Data
At present, there are four main methods used for research on the daily UGS usage of residents: questionnaires [31], nighttime lighting [72], mobile signaling [18], and surveys (including Wi-Fi probes) [51,71,90]. However, these methods either lack precision or quantity, or lack the consideration of different types of activities. In this study, the technical process of using SMTD to estimate the total numbers of activities, the types of activities, and the touring experience of residents in UGSs included the following steps (Figure 1). Step 1 was data collection, and Steps 2 through 4 were, respectively, the analysis of the total number of activities, the types of activities, and the touring experiences. Each of these steps included validation, characterization, and correlation analyses.
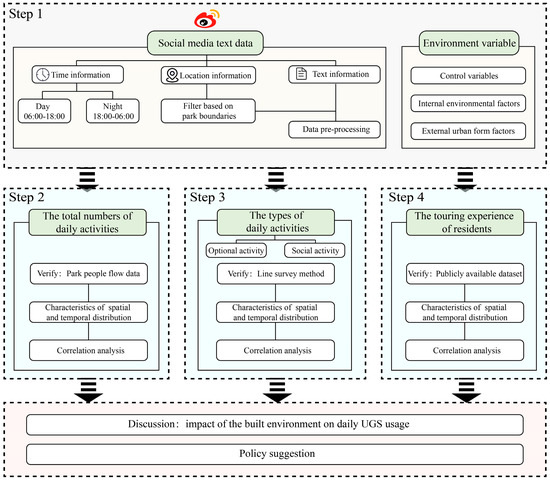
Figure 1.
Using SMTD to study the daily UGS usage of residents.
2.1. Study Area
Xiamen is a sub-provincial city in China located at the southeast end of Fujian Province, with a total land area of 1569.3 km2. Xiamen was one of the first four special economic zones in China to implement the policy of opening up to the outside world. From 2009 to 2019, Xiamen’s citywide resident population increased from 3.3 million to 4.29 million, and the built-up area of the city increased from 212 km2 to 383 km2, causing the city’s urban construction to be at the forefront of the country. Xiamen’s green space planning and construction have also reached high levels; from 2009 to 2019, the built-up area green space rate increased from 35.56% to 40.90%, and the per capita park green space area increased from 10.95 m2 to 15.60 m2. Xiamen also won the title of National Eco-Garden City in 2019, its ecological civilization index is ranked first in the country at the prefecture level and above, and it has reached an advanced level on the global scale. Xiamen’s nighttime economy also has a certain scale; Xiamen was named one of the top ten cities in terms of nighttime economy in 2019. In addition to the development of the nighttime economy, Xiamen is also committed to promoting nighttime cultural and tourism activities; it won the title of China’s Tourism Influence Annual Night Tour City. However, the process of rapid urbanization has also brought about disparities in the usage of UGSs and spatial inequities [91]. Therefore, Xiamen, a representative city, was chosen as the study area.
The UGSs of Xiamen, a total of 100 places, were extracted from the land-use map of Xiamen in 2019 and the Xiamen big data security open platform (https://data.xm.gov.cn/, accessed on 21 May 2022). (Figure 2). The data were also based on the “Xiamen City Green Space System Planning Revision and Green Line Delineation (2017–2020)” and the types of the urban parks, which included 20 comprehensive parks (CPs), 32 theme parks (TPs), 7 linear parks (LPs), and 41 roadside green spaces (RGSs).
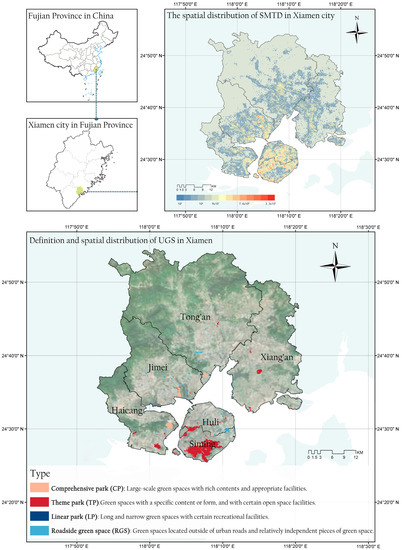
Figure 2.
The distribution of SMTD and UGSs in Xiamen in 2019.
2.2. A Method with Which to Infer the Daily UGS Usage of Residents Based on SMTD
2.2.1. Using SMTD to Identify the Number of Residents’ Daily Activities in UGSs
The SMTD were sourced from Sina Weibo, a social media networking platform with the largest number of users in China [80]. It is a location-based social network that encourages users to check in constantly and frequently, records users’ daily activity patterns and behaviors, and depicts users’ daily operations [80,81,92]. Compared with sensor sampling data sources, such as mobile signaling data and nighttime light data, SMTD, which have higher geographic accuracy, are more suitable for crowd behavior research. As an open geodatabase, Weibo text data can be used to crawl the content of texts using Python to obtain bulk public information data, such as geographic locations, generation times, text contents, and usernames [93,94]. This study utilized SMTD (363 days from 2 January to 30 December 2019 [45]) obtained by crawling through the Sina Weibo application programming interface (API) in batches in March 2020. Within the administrative boundary of Xiamen, 2,182,450 points of data were collected. The data were preprocessed via the following two steps: (1) duplicate or invalid records, such as BOM characters, plain space statements, etc., were eliminated [81], and (2) users whose registration location was not Xiamen were screened out. Finally, 67,765 points of SMTD collected over 363 days from 100 UGSs in the Xiamen area were identified, and all the information was geo-digitized.
2.2.2. Identifying the Types of Resident Activities in UGSs Using NLP Text Classification Methods
Gehl considered the series of activities that people perform in a space as the basic element that determines the vitality of urban space [95]. According to Gehl’s theory of outdoor space, activities can be classified into three types, namely necessary, optional, and social activities [95]. Necessary activities in UGSs, such as commuting to get to or from work, largely offer no choices for participants, and such activities have little to do with UGS planning and design. However, non-essential activities (optional activities, social activities) are the main activities in UGSs and the focus of this research.
Optional activities are those that occur when people have the will to participate and the external conditions are suitable and attractive, such as walking, sunbathing, and exercising. Social activities, on the other hand, are activities that depend on the participation of others in a public space. They can be called “resultant” activities, because, in most cases, they are developed from the other two types of activities; thus, social activities are of higher rank than optional activities.
Two methods were used to classify specific activities based on Gehl’s theory of outdoor space. The first method was classification based on the purpose and manner of people’s activity. If people come to a park to accomplish a certain task, such as to buy something, take their children to school, etc., then they are performing a necessary activity. If people come to a park to enjoy the outdoor environment and atmosphere of the place, such as to walk, see the scenery, etc., then they are engaging in an optional activity. If people come to a park to interact and communicate with others, such as to play games, chat, etc., then they are engaging in a social activity. The second method was classification based on the degree of people’s dependence on the physical built environment: necessary activities are not influenced by the environment, while optional and social activities are closely related to the built environment. Thus, the daily activities of residents were classified into three specific types, namely necessary, optional, and social activities (Table A1).
There were three steps for the identification of the types of resident activities in UGSs using natural language processing (NLP) classification methods. First, 10,000 SMTD were manually labeled according to the resident activity types (represented in Table A1) to form a machine learning training sample called “text-resident activity”. Later, the ERNIE 3.0 pre-training classification model was loaded with the “text-resident activity” machine learning training samples, allowing the machine to build a multi-layer NLP model and learn to automatically analyze the relationships between the potential resident activity types and the text. Finally, based on the pre-training model, the texts in the UGSs identified as described in Section 2.2.1 were predicted and were divided into optional activities, social activities, necessary activities, and non-activities, according to the recognition results. The prediction results were then saved. The study samples and code are provided at https://figshare.com/articles/dataset/Classifier_of_human_behavioral_activities/21342024, accessed on 1 February 2023. An example of the classification is provided in Table A2.
2.2.3. Identifying the Sentiments of Resident Activities in UGSs Using NLP Text Classification Methods
The quantification of the sentiments of UGS residents was performed using the Baidu ERNIE NLP deep learning classifiers. The open-access model SKEP based on ERNIE 3.0 was used to analyze the sentiments [96]. First, the pre-trained model dataset was used to build a learning platform based on sentiment knowledge. Then, 10,000 points of SMTD were manually labeled with sentiments. Machine learning based on pre-trained samples teaches computers how to quantify sentiments in SMTD [97]. Unlike scoring methods, such as sentiment dictionaries and cloud sentiment analysis [89], the localized SKEP method is similar to human subjective thinking, and the method is reproducible. The overall sentiment index of a UGS was constructed by calculating the average of the sentiment scores of the SMTD in that UGS. The advantage of this method is that the calculated sentiment of the UGS is related to each point of SMTD in the city, and any change in the data will cause a corresponding change in the average. The sentiment scores of the social media text had a range of [0, 1]. The actual meaning of the index is as follows: an increase of 0.01 indicates a 1% increase in the positive park sentiment of SMTD; the closer the value is to 1, the more positive the overall sentiment of the park [89,97]. The sentiment analysis preprocessing model has been shared at https://doi.org/10.6084/m9.figshare.21524391, accessed on 1 May 2023.
2.3. Environment Variable Collection
- (1)
- Control variables
The daily UGS usage of residents is influenced by a number of variables indirectly related to the site’s internal environmental and external urban form. Thus, it is necessary to use control variables to provide more accurate statistics on the relationships between the site’s internal environment and external urban form and the touring experience of residents’ daily activities. According to Giles-Corti et al. (2005), the area of a UGS affects the number of users (Table 1). Therefore, the area of the UGS [34] was selected as the control variable, and the data were derived from the current land-use map of Xiamen from 2019.
- (2)
- Internal environmental factors
The daily UGS usage of residents may be affected by some internal environmental factors of UGSs. According to the expected link between environmental factors within UGSs and the daily UGS usage of residents summarized in Table 1 [36,41,55], hydrophilicity [31,34,37,38,39,40,41,42,43,44], historical and cultural facilities [31,39], the green area ratio [4,36,39,43,46,47,51,52,53,54], and lighting facilities [13,31,39,41,43,52,55,56,57,58] were selected as variables that may have an impact on residents’ daily behavior. These variables quantitatively describe the internal environment of UGSs. Table 2 provides the calculation methods for these internal environmental elements of UGSs.
Table 2.
The definitions of the variables.
- (3)
- External urban form factors
Previous studies have shown that urban form inequities may cause differences in the daily UGS usage of residents [59,98]. Therefore, the possible factors linking the urban form factors of UGSs with the UGS usage of residents were screened according to Table 1. The three urban form variables of the number of public security facilities [7,19,31,53,55,59,60,61,62,63,64] within 1 km of the site [99], the proportion of the floating population [8,18,63,65,66,67,68,69,70], and the population density [32] were selected to measure whether the urban built environment is spreading and fragmented. These indicators were calculated using point-of-interest (POI) data compared to the current land-use map from 2019. Table 2 provides the calculation methods for these urban form factors. The descriptive statistics for all these variables are presented in Table 3.
Table 3.
The descriptive statistics of the variables.
2.4. Statistical Models
First, linear regression models were used to determine whether the internal environmental factors and external urban form factors significantly affect residents’ daily UGS usage. A total of eight linear regression models were used to assess the degrees of association between the total number of daily activities, daily optional and social activities, and residents’ daily touring experience (a total of eight dependent variables) and seven independent variables (four internal site environment variables and three external urban form variables). Among them, the dependent variables of the daily touring experience and the intensities of optional and social activities ensured that there were more than 20 total activities in each UGS in the daytime and nighttime. Control variables were included in the model to explain the variation unrelated to the urban form. Furthermore, the daily UGS usage of residents is not only related to factors in the UGS itself but may also be related to the type of park of the UGS; on this basis, the intra-class correlation coefficient (ICC) was calculated to test for differences in the dependent variables brought about by different park types.
3. Results of the Characterization and Correlation Analysis of UGS Usage
3.1. Total Daily Activities in UGSs
3.1.1. Feasibility Analysis of the Use of SMTD to Study the Total Daily Activities of Residents in UGSs
Real-time and month-by-month people flow data were selected to verify the reliability of the use of SMTD to study the total daily activity of residents. These data were sourced from the statistics of the management of the sampled parks. The real-time people flow (January, March, June, and September 2019) and month-by-month people flow (12 months in 2019) of the sampled parks were analyzed separately from the of number SMTD points in the UGS. The verification results reveal that the SMTD points were highly consistent with the park people flow data. The correlation between the month-by-month people flow and the number of SMTD points was R2 = 0.813, and the correlation between the real-time people flow and the number of SMTD points was R2 = 0.807. This confirms that the spatial distribution of the total daily activities of residents can be adequately speculated by using SMTD.
3.1.2. Spatial and Temporal Distribution Characteristics of the Total Daily Activities of Residents in UGSs
Based on SMTD calculation, Figure 3 and Figure 4 respectively present the estimated total daytime and nighttime activities of residents in the UGSs. In general, 59.94% of the total resident activities in the UGSs occurred during the day.
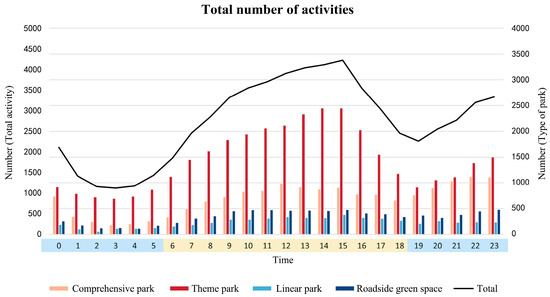
Figure 3.
The total number of activities within 24 h.
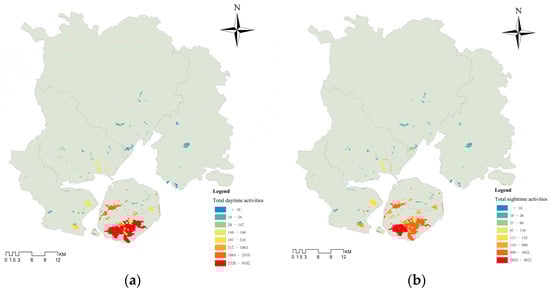
Figure 4.
The total numbers of activities in the UGSs: (a) daytime activities and (b) nighttime activities.
Regarding the effect of the park type on the total number of resident activities, during the daytime, the highest number of total resident activities was found to occur in TPs, followed by CPs and LPs. The total number of resident activities increased significantly in CPs at night, second only to that in TPs (Figure 3), and the residents had a significantly higher touring experience in integrated and specialized parks than in RGSs. The park with the highest total number of activities was found to be the Xiamen Botanical Garden (TP).
3.1.3. Effects of the Internal Environment and External Urban form Factors on the Total Daily Activities of Residents in UGSs
According to the method described in Section 2.3, the internal environment and the external urban form factors in UGSs were calculated, and the descriptive statistics are reported in Table 3. Then, according to the method described in Section 2.4, the linear regression models were found to have a significance level (p-value) of less than 0.001, indicating the predictive power of the models. After adjustment, the R2 values of all linear regression models ranged from 0.755 to 0.835. All the regression models had low multicollinearity, and the variance inflation factor (VIF) was less than 1.6 [100,101,102]. The regression model reveals that there were correlations between the internal environment and external urban form of UGSs with the total daily activities of residents in Xiamen (Table 4). Table 4 only reports the percentage changes of the variables that are significant at p < 0.05. Figure 5 shows the variables that are significant at p < 0.05 and the strengths of their effects.
Table 4.
The linear regression analysis of the built environment and the total daily activities of residents (non-standardized regression coefficient B).
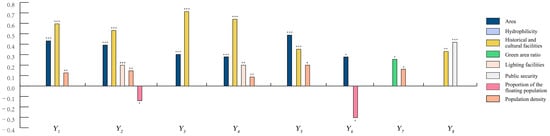
Figure 5.
The standardized coefficient values (β) and significance of the linear regression models. Note: *** represents significance at the 0.001 level; ** represents significance at the 0.01 level; * represents significance at the 0.05 level.
3.2. Types of Daily Activities
3.2.1. Feasibility Analysis of the Use of SMTD to Study the Types of Daily Activities of Residents in UGSs
To verify the reliability of the use of SMTD to identify residents’ activities, 16 UGSs were randomly selected from the 100 UGSs as a sample to conduct a sample line survey (including parks of different types, sizes, and locations to ensure the representativeness of the sample). A field survey was conducted on weekdays from 11 November to 28 November 2019, between 12:00–14:00 and 18:00–20:00, and the number of participants of optional and social activities in each UGS was recorded. The data obtained from the sample line survey were correlated with the SMTD. The validation results showed that the optional daytime and nighttime activities of residents indicated by the SMTD were consistent with the actual activity data of residents (the correlation between the number of optional activities and the number of points of SMTD for optional activities was R2 = 0.709, and the correlation between the number of social activities and the number of data points for social activities was R2 = 0.646). This confirms that the spatial distributions of different daily activities of residents can be inferred by the use of SMTD.
3.2.2. Spatial and Temporal Distribution Characteristics of the Types of Resident Daily Activities in UGSs
Based on SMTD calculation, Figure 6 and Figure 7, respectively, present the estimated intensities of the optional and social activities of residents in the UGSs. In general, 61.68% of optional activities occurred during the day, with the period of 13:00 to 14:00 having the highest intensity of optional activities at 6.32%. Moreover, 55.47% of social activities occurred at night, with the period of 22:00 to 23:00 having the highest intensity of social activities at 10.02% (Figure 6).
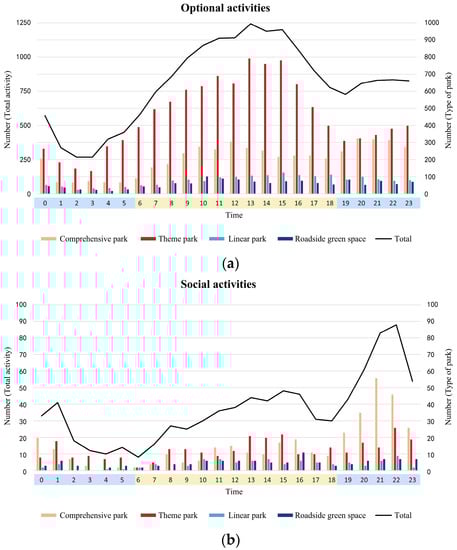
Figure 6.
The intensities of residents’ activities in the UGSs at different times of the day: (a) the intensity of optional activities within 24 h; (b) the intensity of social activities within 24 h.
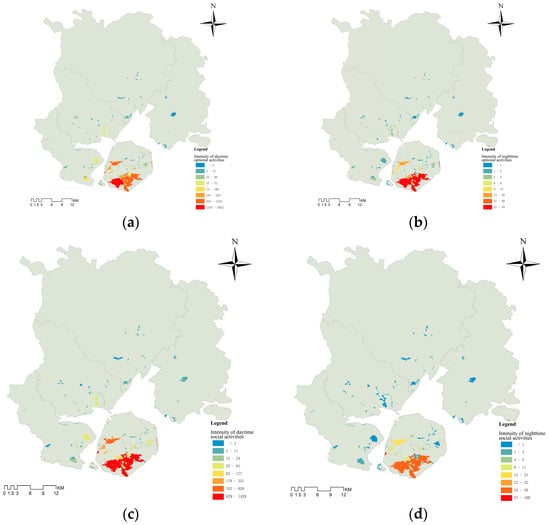
Figure 7.
The intensities of optional and social activities in the UGSs: (a) daytime optional activities; (b) nighttime optional activities; (c) daytime social activities; (d) nighttime social activities.
Regarding the park types, the Xiamen Botanical Garden (TP) had the highest intensities of optional and social activities during the daytime, as well as the highest intensity of optional activities at night. The park with the highest intensity of social activities at night was found to be Haiwan Park (CP).
3.2.3. Effects of the Internal Environment and External Urban form Factors on the Types of Resident Daily Activities in UGSs
As in Section 3.1.3, the linear regression models were validated with p-values of less than 0.001, indicating the predictive power of the models. After adjustment, the R2 values of all the linear regression models ranged from 0.100 to 0.851. All the regression models had low multicollinearity, and the VIF was less than 1.6 [100,101,102]. The regression model shows that there were correlations between the internal environment and external urban form of UGSs and the types of daily activities of residents in Xiamen (Table 5). The ICC results indicate that the intensity of the daily spontaneous activity of residents varied greatly between park types. Table 5 only reports the percentage changes of the variables that are significant at p < 0.05. Figure 5 shows the variables that are significant at p < 0.05 and the strengths of their effects.
Table 5.
The linear regression analysis of the built environment and the types of resident daily activities (non-standardized regression coefficient B).
3.3. Daily Touring Experience
3.3.1. Feasibility Analysis of the Use of SMTD to Study the Daily Touring Experience of Residents in UGSs
To verify whether using SMTD to study the touring experience of residents in UGSs is reliable, a publicly available dataset was first used to verify whether the ERNIE NLP classification method accurately identified the evaluated sentiment in texts. The results of the comparison with the manually annotated public Chinese corpus (https://console.bce.baidu.com/ai/#/ai/nlp/sentiment/dict/list, accessed on 24 May 2022.) show that the classification accuracy of the localized SKEP model was 95.8%. The accuracy and recall of positive sentiment classification were 95.7 and 96.4%, respectively, and the accuracy and recall of negative sentiment classification were 96% and 95.1%, respectively. This indicates that the sentiment classification results are reliable.
3.3.2. Spatial and Temporal Distribution Characteristics of the Daily Touring Experience of Residents in UGSs
Based on SMTD calculation, Figure 8 and Figure 9 respectively present the estimated total touring experience of residents in UGSs. Overall, there were large fluctuations in residents’ touring experiences throughout the day; the experience of visiting a UGS was higher at 03:00 and worse at 19:00–20:00. In terms of park types, residents had a significantly higher touring experience in CPs and TPs than in RGSs. the park with the best resident mood during the day was Xueling Park (TP), while that with the worst resident mood was the green space on the east side of Guanxunxi Road (RGS). The park with the best resident mood at night was Yanwei Mountain Ecological Park (TP), while that with the worst mood was the green space on the west side of Xin’ao Road (RGS).
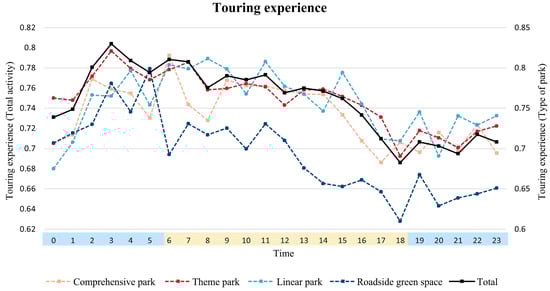
Figure 8.
The touring experience of residents in the UGSs at different times of the day.
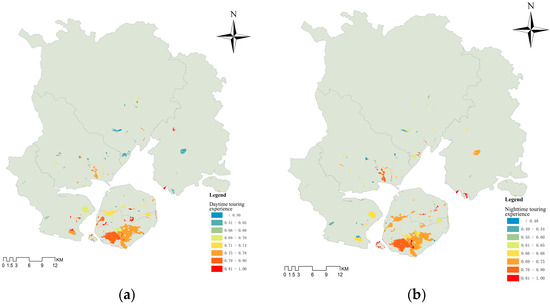
Figure 9.
The daily touring experience of residents in the UGSs: (a) daytime touring experience and (b) nighttime touring experience.
3.3.3. Effects of the Internal Environment and External Urban Form Factors on the Daily Touring Experience of Residents in UGSs
As in Section 3.1.3, the linear regression models were validated with p-values of less than 0.001, indicating the predictive power of the models. After adjustment, the R2 values of all linear regression models ranged from 0.169 to 0.212. All the regression models had low multicollinearity, and the VIF was less than 1.6 [100,101,102]. The regression model shows that there were correlations between the internal environment and external urban form of UGSs and the daily touring experience of residents in Xiamen (Table 6). The ICC results indicate that the daily touring experience of residents varied greatly between park types. Table 6 only reports the percentage changes of the variables that are significant at p < 0.05. Figure 5 shows the variables that are significant at p < 0.05 and the strengths of their effects.
Table 6.
The linear regression analysis of the built environment and the daily touring experience of residents (non-standardized regression coefficient B).
4. Discussion
4.1. Using SMTD to Study Daily UGS Usage
Traditional daily UGS usage research has been difficult to carry out due to the limitation of data acquisition. The data used in previous studies either had low spatial resolution (or fuzzy classification) or lacked high-resolution information. For example, the use of questionnaires to survey residents’ activities [31] can incur high costs and face problems associated with sample size limitations. While Yu et al. (2021) studied changes in the intensity of residents’ activities via changes in the brightness of nighttime light [72], it is difficult to separate lighting data from many unrelated light source areas, such as highways. Xiao et al. (2019) used mobile signaling data to survey resident activity; however, due to the distance limitations of signal base station erection and signal reception, if a UGS is small and a neighborhood has both residential homes and commercial facilities, the base station may not be able to accurately distinguish whether the user is in the UGS, and can only consider UGSs larger than 10 hectares [18]. Shen and Hu (2020) used Wi-Fi probe data to study resident activity. Although this approach could and did meet the need for high accuracy in small-scale UGSs, it required the acquisition of data from a single park by building a self-designed LAN environment [51,71]. To address these issues, the present study proposed a new data collection method to analyze the daily UGS usage of residents in UGSs by using location-based SMTD. A dataset of the distribution of the daily activities of Xiamen residents was constructed using SMTD and a pre-trained model based on ERNIE 3.0, a machine learning-based text classification method. The method has the advantage of being able to accurately characterize the spatial and temporal distributions of daily UGS usage via large-scale access to SMTD that record spatial and temporal information about users. Based on the accuracy validation, the proposed method can be used to characterize the spatial and temporal patterns of the distribution of residents’ daily UGS usage and can reveal the factors that influence the intensities, types, and touring experience of activities. Taking Xiamen as an example, the proposed method was used to find the different characteristics of residents’ activities in UGSs. The total number of activities peaked at 15:00 during the day and began to increase again at 19:00 at night. Regarding the activity type, optional activities peaked earlier at 13:00 and varied significantly by park type, and social activities increased sharply at 18:00 and peaked at 22:00. In terms of the touring experience, the peak of residents’ touring experience in a day was found to be at 03:00 at night, and the experience in RGSs was the worst.
In combination with ICC, the intensity of the daily activities of residents in TPs was found to be higher than that in the other three types of parks, especially during the daytime. At night, the intensity of the activities of residents in CPs increased significantly. This is because TP attractions, such as the Xiamen Botanical Garden, Shuzhuang Garden, and Sunlight Rock Park, are closed at night, and most tourist attractions close by 18:00, which limits nighttime leisure behavior [1]. In contrast, most of the CPs, LPs, and RGSs are open 24 h a day, which allows them to attract more residents at night. It was also found that the touring experiences of residents in CPs and TPs were significantly higher than those of residents in RGSs. The main reason for this may be the differences in the function and quality of different types of parks [35]. In contrast to CPs, TPs, and LPs, which are high-grade parks in cities with high investments, long histories, rich content, and good facilities for residents to start various outdoor activities, RGSs are located next to urban road sites; thus, it is difficult for them to provide better experiences and positive emotions for residents, both during the day and at night.
4.2. Impact of the Built Environment on Daily UGS Usage
4.2.1. Total Daily Activities
It was found that the total daily activities of residents in UGSs were significantly influenced by historical and cultural facilities, as well as population density. Sites with more historical and cultural facilities inside the premises have a stronger cultural atmosphere and are more likely to enhance residents’ interest in participating in activities [39]. It was also found that historical and cultural facilities are the explanatory variable for environmental factors with the greatest impact on UGS usage other than the control variables; for every standard deviation increase in historical and cultural facilities, there is an increase of 0.60 standard deviations in the total number of resident activities during the daytime, and an increase of 0.53 standard deviations in the total number of resident activities at nighttime. Moreover, population density was found to have a significant effect on the promotion of the total number of residents’ daily activities, as a denser population around the venue has the effect of attracting people to enter [32].
In addition, nighttime lighting and the proportion of the floating population have significant impacts on the total number of residential activities at night. Nighttime lighting plays a significant role in promoting residents’ activities at night, and having sufficient lighting facilities in a place not only enhances the aesthetics of the landscape at night [31] but also increases residents’ sense of security [55]. In contrast, the settlement space of the floating population is not conducive to promoting nighttime activities in UGSs, and the urban life of the floating population is, to some extent, centered around work, which is more monotonous and characterized by fewer recreational activities [65].
4.2.2. Optional and Social Activities
The built environment impacts of the types of activities, especially optional activities, are essentially the same as those of the total number of activities. Based on the type of resident activity, during the daytime, optional activities were significantly influenced by historical and cultural facilities, and social activities were significantly influenced by historical and cultural facilities and population density. It was found that for every standard deviation increase in historical and cultural facilities, there is an increase of 0.71 standard deviations in daytime optional activities and an increase of 0.35 standard deviations in daytime social activities. Moreover, social activities were found to be significantly affected by population density; places where people gather tend to attract more commercial and entertainment venues, which can enrich people’s social activities and thus increase the attractiveness of the venue [32,103].
Regarding nighttime activities, not only are optional activities influenced by historical and cultural facilities, but nighttime lighting and the proportion of the floating population also play a role. Nighttime lighting plays a significant role in promoting residents’ optional activities at night. It was found that nighttime lighting is second only to historic and cultural facilities in its impact on nighttime optional activities, with each additional standard deviation increasing nighttime optional activities by 0.20 standard deviations. However, nighttime social activities are not influenced by the intensity of nighttime lighting. In addition, the proportion of the floating population is the only environmental factor explanatory variable that was found to influence nighttime optional activities; each one standard deviation increase in the proportion of the floating population was found to decrease the nighttime optional activity by 0.30 standard deviations. It is worth noting that unlike during the day, historical and cultural facilities do not have a significant effect on nighttime social activities. This is probably because, at night, historical and cultural facilities are in a dimmer environment, thus making it difficult for people to experience the cultural atmosphere and reducing the motivation to engage in social activities.
4.2.3. Touring Experience
Residents’ touring experience during the daytime was found to be influenced by the green area ratio and the proportion of the floating population. These results are in line with those of previous research [45], which found that a higher green space ratio within a site facilitates the touring experience of daytime residents. The experience of nature promotes a high level of well-being [45]; residents are happier with more green space in their living environment [48,49], and plant elements have a significant positive effect on residents’ physical and mental recovery [50]. It was also found that floating population settlement spaces have a negative effect on the daytime touring experience of residents in UGSs, which may be because these spaces are commonly found on the outskirts of suburban and central urban areas. Moreover, floating populations often choose to live in low-cost locations where UGSs have low construction funds and poor quality, making it difficult for them to meet the recreational needs of residents [97]. The proportion of the floating population was found to be the only external urban form factor explanatory variable affecting the daytime touring experience, with each one standard deviation increase decreasing the daytime touring experience by 0.30 standard deviations.
The touring experience of residents in the evening was found to be influenced only by historical and cultural facilities and public security factors. Historical and cultural facilities promote residents’ touring experience at night, and UGSs can create a good cultural atmosphere that is conducive to improving residents’ touring experience. The public security around a site can have a significant impact on the promotion of the nighttime touring experience of residents; the overall security of the environment increases the security of residents’ activities, and a good security environment can also prolong the amount of time for which residents use the UGS [64]. However, it is interesting to note that a higher green space ratio was found to have no significant effect on the nighttime touring experience, which may be because higher greenness increases the sense of danger at night [46], dense vegetation is not conducive to identifying potential dangers in the environment, and open spaces are safer for activities in UGSs at night.
5. Conclusions
Studies on residents’ daily UGS usage (including the total number of activities, the types of activities, and the touring experience) have been difficult to carry out due to the difficulty of data collection. This study proposed a method for the analysis of the total numbers, types, and touring experience of daily activities in UGSs inferred based on SMTD and the ERNIE 3.0 text pre-training semantic classification model and used Xiamen as an example. Based on this, regression models were used to analyze the internal environmental factors and external urban form factors of UGSs that influence the daily UGS usage of residents. The research results revealed the following. (1) A study was conducted on the total numbers, types, and touring experience of the activities of residents using SMTD, and the results were verified by line transect surveys, management statistics, and a publicly available dataset. (2) The number of human activities in UGSs was found to be significantly influenced by historical and cultural facilities, nighttime lighting, population density, and the proportion of the floating population. (3) During the daytime, optional activities are facilitated by the park type and historical and cultural facilities, and social activities are facilitated by historical and cultural facilities and population density. In the evening, optional activities are promoted by the park type, historical and cultural facilities, and nighttime lighting, while the proportion of the floating population inhibits optional activities, and the proportion of the floating population inhibits social activities. (4) Regarding the touring experience, in the daytime, the park type and green space ratio have facilitating effects on the touring experience, while the proportion of the floating population has an inhibiting effect. In the evening, the park type, historical and cultural facilities, and public security factors all have significant facilitating effects on residents’ touring experience.
The methodology and findings of this study can aid in the discovery of planning tools to promote the daily leisure activities of residents. Under the influence of the concept of healthy city construction and planning justice, observing and deeply understanding the different effects of various built environments on the daily UGS usage of residents in UGSs are of great significance for building a livable environment that promotes activities, and should be a focus of attention for intervention to residents’ physical and mental health. To promote residents’ participation in daily activities in UGSs, planning and construction should consider the needs of the different types of parks and activities of residents, and should optimize and improve the built environment. Moreover, attention should be paid to the planning and construction of historical and cultural facilities, the green space ratio, and nighttime lighting, as well as the quality of UGSs around public rental housing. These are of great significance for the improvement of residents’ social communication and the promotion of their health. In the future, research on the influence of long time series and more types of residents’ activities should be continued, and new research technologies and frameworks of the urban planning and environmental management of UGSs for residents’ daily activities should also be constantly improved.
Author Contributions
Conceptualization, C.F.; Methodology, Y.L.; Software, S.L., Y.L., C.J. and Y.G.; Validation, S.L., L.Z. and Z.G.; Formal analysis, C.J.; Investigation, Z.G.; Resources, L.Z. and R.L.; Data curation, Y.G.; Writing—original draft, S.L.; Supervision, C.F. and B.Q.; Project administration, C.F. and B.Q.; Funding acquisition, C.F. All authors have read and agreed to the published version of the manuscript.
Funding
This research was funded by the National Natural Science Foundation of China (31971721 and 51908309) and Beijing Outstanding Young Scientist Program (JJWZYJH01201910003010).
Data Availability Statement
The python UGS activities classification model is available at here: https://figshare.com/articles/dataset/Classifier_of_human_behavioral_activities/21342024. The python UGS touring experience (sentiment analysis) model is available at https://doi.org/10.6084/m9.figshare.21524391.
Conflicts of Interest
The authors declare no conflict of interest.
Appendix A
Table A1.
The relationship between the types of residents’ activities and SMTD.
Table A1.
The relationship between the types of residents’ activities and SMTD.
| Types of Residents’ Daily Activities in UGSs | Text Behavior Example |
|---|---|
| Optional activities | Fitness, cycling, jogging or running, sports, walking, etc. |
| Drawing, watching movies, reading books, etc. | |
| Seaside tours, sunset observation (nighttime viewing), flower viewing, enjoying the scenery, getting fresh air, etc. | |
| Going shopping at night markets, etc. | |
| Social activities | Playing badminton or table tennis, square dancing, sports competitions, group sports, etc. |
| Partying, playing cards, chatting, children playing, discussions, jokes and greeting each other, greetings and conversations, being with children or family, meeting friends, etc. | |
| Dining together, playing board games, eating BBQ, etc. | |
| Necessary activities, other activities, non-activities | Activities other than the above, such as commuting, shopping for necessities, working, going to school, etc.; inactive text (such as emotions, experience exchanges, various news comments, etc.) |
Table A2.
Examples of text-activity classification.
Table A2.
Examples of text-activity classification.
| Number | Text | Classification Result |
|---|---|---|
| 6095 | “一个人逛街一个人爬山感觉真不错” A person feeling really good about shopping and climbing a mountain. | Optional activity |
| 13,375 | “一个人走走停停” Walking alone and stopping. | Optional activity |
| 12,648 | “一个人的旅游观音寺” A person’s travel to Guanyin Temple. | Optional activity |
| 17,039 | “没人像我这么拼,大中午来爬山吧” No one is as hardworking as me, come to climb the mountain in the middle of the day. | Optional activity |
| 19,081 | “美哉!海沧大屏山公园” Beautiful! Haicang Daping Mountain Park. | Optional activity |
| 12,590 | “带着妈妈去旅行” Take Mom on a trip. | Social activity |
| 11,879 | “和朋友出去散散心,和家人聊聊天,抓住眼前的幸福” Go out for a walk with friends, chat with family, and seize the happiness in front of you. | Social activity |
| 22,221 | “和朋友跑步跑到海沧,好爽” Running with friends to Haicang, so cool. | Social activity |
| 9825 | “和你一起逛情人谷,感觉真独特啊哈哈” It’s so unique to visit Lover’s Valley with you, haha. | Social activity |
| 21,156 | “闺蜜出行,开心之旅…” Girlfriend trip, happy trip... | Social activity |
| 9370 | “上学是一种乐趣” Going to school is a pleasure. | Necessary activity |
| 42,528 | “阳光很灿烂,上班也不错” The sun is shining and it’s nice to go to work. | Necessary activity |
| 249,259 | “上医院,坐公交,挤地铁” Go to the hospital, take the bus, take the subway. | Necessary activity |
References
- Liu, J.P.; Deng, Y.; Wang, Y.; Huang, H.S.; Du, Q.Y.; Ren, F. Urban Nighttime Leisure Space Mapping with Nighttime Light Images and POI Data. Remote Sens. 2020, 12, 541. [Google Scholar] [CrossRef]
- Ngesan, M.R.; Zubir, S.S. Place Identity of Nighttime Urban Public Park in Shah Alam and Putrajaya. Procedia-Soc. Behav. Sci. 2015, 170, 452–462. [Google Scholar] [CrossRef]
- Jim, C.Y.; Chen, W.Y. Assessing the ecosystem service of air pollutant removal by urban trees in Guangzhou (China). J. Environ. Manag. 2008, 88, 665–676. [Google Scholar] [CrossRef] [PubMed]
- Wang, M.; Qiu, M.; Chen, M.; Zhang, Y.; Zhang, S.; Wang, L. How does urban green space feature influence physical activity diversity in high-density built environment? An on-site observational study. Urban For. Urban Green. 2021, 62, 127129. [Google Scholar] [CrossRef]
- Luo, S.X.; Xie, J.; Furuya, K. “We Need such a Space”: Residents’ Motives for Visiting Urban Green Spaces during the COVID-19 Pandemic. Sustainability 2021, 13, 6808. [Google Scholar] [CrossRef]
- Collins, C.A.; Haase, D.; Heiland, S.; Kabisch, N. Urban green space interaction and wellbeing—Investigating the experience of international students in Berlin during the first COVID-19 lockdown. Urban For. Urban Green. 2022, 70, 127543. [Google Scholar] [CrossRef]
- Ngesan, M.R.; Karim, H.A.; Zubir, S.S. Relationship between Nighttime Leisure Behaviour and Urban Park Setting in Shah Alam. Asian J. Behav. Stud. 2018, 3, 173–181. [Google Scholar] [CrossRef]
- Kabisch, N.; Haase, D. Green justice or just green? Provision of urban green spaces in Berlin, Germany. Landsc. Urban Plan. 2014, 122, 129–139. [Google Scholar] [CrossRef]
- Konijnendijk, C.C.; Annerstedt, M.; Nielsen, A.B.; Maruthaveeran, S. Benefits of Urban Parks A Systematic Review. A Report for IFPRA. 2013. Available online: https://worldurbanparks.org/images/Newsletters/IfpraBenefitsOfUrbanParks.pdf (accessed on 23 April 2023).
- Ward Thompson, C.; Aspinall, P.; Roe, J.; Robertson, L.; Miller, D. Mitigating Stress and Supporting Health in Deprived Urban Communities: The Importance of Green Space and the Social Environment. Int. J. Environ. Res Public Health 2016, 13, 440. [Google Scholar] [CrossRef]
- Miles, R.; Coutts, C.; Mohamadi, A. Neighborhood urban form, social environment, and depression. J. Urban Health 2012, 89, 1–18. [Google Scholar] [CrossRef]
- Yeh, C.T.; Cheng, Y.Y.; Liu, T.Y. Spatial Characteristics of Urban Green Spaces and Human Health: An Exploratory Analysis of Canonical Correlation. Int. J. Environ. Res Public Health 2020, 17, 3227. [Google Scholar] [CrossRef] [PubMed]
- Kruize, H.; van der Vliet, N.; Staatsen, B.; Bell, R.; Chiabai, A.; Muinos, G.; Higgins, S.; Quiroga, S.; Martinez-Juarez, P.; Yngwe, M.A.; et al. Urban Green Space: Creating a Triple Win for Environmental Sustainability, Health, and Health Equity through Behavior Change. Int. J. Environ. Res. Public Health 2019, 16, 4403. [Google Scholar] [CrossRef] [PubMed]
- Roe, J.J.; Aspinall, P.A.; Thompson, C.W. Coping with Stress in Deprived Urban Neighborhoods: What Is the Role of Green Space According to Life Stage? Front. Psychol. 2017, 8, 1760. [Google Scholar] [CrossRef] [PubMed]
- Besenyi, G.M.; Kaczynski, A.T.; Stanis, S.A.W.; Bergstrom, R.D.; Lightner, J.S.; Hipp, J.A. Planning for health: A community-based spatial analysis of park availability and chronic disease across the lifespan. Health Place 2014, 27, 102–105. [Google Scholar] [CrossRef]
- Li, M. Review of Research on Health Impact of the Urban Built Environmen. J. Beijing Union Univ. (Nat. Sci.) 2017, 31, 37–43. (In Chinese) [Google Scholar] [CrossRef]
- Yin, C. Influence of the Urban Built Environment on Residents’ Health and Its Pathways: Evidence from Shanghai. Ph.D. Thesis, East China Normal University, Shanghai, China, 2020. (In Chinese). [Google Scholar]
- Xiao, Y.; Wang, D.; Fang, J. Exploring the disparities in park access through mobile phone data: Evidence from Shanghai, China. Landsc. Urban Plan. 2019, 181, 80–91. [Google Scholar] [CrossRef]
- Talal, M.L.; Santelmann, M.V. Visitor access, use, and desired improvements in urban parks. Urban For. Urban Green. 2021, 63, 127216. [Google Scholar] [CrossRef]
- Wolff-Hughes, D.L.; Fitzhugh, E.C.; Bassett, D.; Cherry, C.R. Greenway siting and design: Relationships with physical activity behaviors and user characteristics. J. Phys. Act. Health 2014, 11, 1105–1110. [Google Scholar] [CrossRef]
- Lindsey, G. Sustainability and Urban Greenways: Indicators in Indianapolis. J. Am. Plan. Assoc. 2003, 69, 165–180. [Google Scholar] [CrossRef]
- Zhu, Z.; Huang, C.; Liu, L.; Liu, X. Influence of Built Environment on Urban Greenway Use from the Perspective of Greenway-Neighborhood Relationships: A Case Study of Guangzhou, China. Trop. Geogr. 2019, 39, 247–253. (In Chinese) [Google Scholar] [CrossRef]
- Liu, L. A preliminary study on the design method of the exterior environment of nighttime urban commercial lots. J. Qiqihar Univ. (Philos. Soc. Sci.) 2010, 186, 185–187. (In Chinese) [Google Scholar] [CrossRef]
- Zapata-Diomedi, B.; Veerman, J.L. The association between built environment features and physical activity in the Australian context: A synthesis of the literature. BMC Public Health 2016, 16, 484. [Google Scholar] [CrossRef] [PubMed]
- Bakker, A.B.; Demerouti, E.; Oerlemans, W.; Sonnentag, S. Workaholism and daily recovery: A day reconstruction study of leisure activities. J. Organ Behav. 2013, 34, 87–107. [Google Scholar] [CrossRef]
- Korpela, K.; Kinnunen, U. How Is Leisure Time Interacting with Nature Related to the Need for Recovery from Work Demands? Testing Multiple Mediators. Leis. Sci 2011, 33, 1–14. [Google Scholar] [CrossRef]
- Nofre, J. Nightlife as a source of social wellbeing, community-building and psychological mutual support after the COVID-19 pandemic. Ann. Leis. Res. 2021, 26, 1–9. [Google Scholar] [CrossRef]
- Lin, V.S.; Qin, Y.; Ying, T.Y.; Shen, S.J.; Lyu, G.M. Night-time economy vitality index: Framework and evidence. Tour. Econ. 2022, 28, 665–691. [Google Scholar] [CrossRef]
- Ministry of Culture and Tourism of the People’s Republic of China. Notice of the Ministry of Culture and Tourism on the Announcement of the Second Batch of National Night Culture and Tourism Consumption Agglomeration Areas. 2022. Available online: http://www.gov.cn/zhengce/zhengceku/2022-08/25/content_5706733.htm (accessed on 23 April 2023). (In Chinese)
- Wan, Y.; Zhang, Y.; Xie, W.; Ding, Y.; Tao, Y.; Zhu, X. Research on spatiotemporal activity characteristics of tourists in scenic spots of Beijing based on mobile phone data. Beijing Surv. Mapp. 2022, 36, 386–393. (In Chinese) [Google Scholar] [CrossRef]
- Li, X.; Liao, Z.; Zhou, L.; Chang, H.; Li, F. The behavior characteristics and satisfaction of night activities in urban riverside parks— Taking the Fuzhou Min Jiang South Park as a case. J. Fujian Agric. For. Univ. (Philos. Soc. Sci.) 2018, 21, 89–94. (In Chinese) [Google Scholar] [CrossRef]
- Chuang, I.-T.; Benita, F.; Tunçer, B. Effects of urban park spatial characteristics on visitor density and diversity: A geolocated social media approach. Landsc. Urban Plan. 2022, 226, 104514. [Google Scholar] [CrossRef]
- Mumm, O.; Zeringue, R.; Dong, N.N.; Carlow, V.M. Green Densities: Accessible Green Spaces in Highly Dense Urban Regions-A Comparison of Berlin and Qingdao. Sustainability 2022, 14, 1690. [Google Scholar] [CrossRef]
- Giles-Corti, B.; Broomhall, M.H.; Knuiman, M.; Collins, C.; Douglas, K.; Ng, K.; Lange, A.; Donovan, R.J. Increasing walking—How important is distance to, attractiveness, and size of public open space? Am. J. Prev. Med. 2005, 28, 169–176. [Google Scholar] [CrossRef] [PubMed]
- Kong, L.; Liu, Z.; Pan, X.; Wang, Y.; Guo, X.; Wu, J. How do different types and landscape attributes of urban parks affect visitors’ positive emotions? Landsc. Urban Plan. 2022, 226, 104482. [Google Scholar] [CrossRef]
- Wang, L.; Zhang, Y.; Qiu, M.; Wang, M. Improvement Strategy of Urban Green Space Design for the Diversity of Physical Activity. Chin. Landsc. Archit. 2019, 35, 56–61. (In Chinese) [Google Scholar] [CrossRef]
- Lu, S.; Oh, W.; Ooka, R.; Wang, L. Effects of Environmental Features in Small Public Urban Green Spaces on Older Adults’ Mental Restoration: Evidence from Tokyo. Int. J. Environ. Res. Public Health 2022, 19, 5477. [Google Scholar] [CrossRef]
- Akpınar, A.; Cankurt, M. How are characteristics of urban green space related to levels of physical activity: Examining the links. Indoor Built Environ. 2017, 26, 1091–1101. [Google Scholar] [CrossRef]
- Chen, F.; Lin, J.; Zhu, X. Landscape Activity Evaluation of Elder’s in Winter City Base on the Methods of EAPRS and NGST. Chin. Landsc. Archit. 2015, 31, 100–104. (In Chinese) [Google Scholar] [CrossRef]
- Koohsari, M.J.; Mavoa, S.; Villanueva, K.; Sugiyama, T.; Badland, H.; Kaczynski, A.T.; Owen, N.; Giles-Corti, B. Public open space, physical activity, urban design and public health: Concepts, methods and research agenda. Health Place 2015, 33, 75–82. [Google Scholar] [CrossRef]
- Schipperijn, J.; Bentsen, P.; Troelsen, J.; Toftager, M.; Stigsdotter, U.K. Associations between physical activity and characteristics of urban green space. Urban For. Urban Green. 2013, 12, 109–116. [Google Scholar] [CrossRef]
- Phillips, A.; Canters, F.; Khan, A.Z. Analyzing Spatial Inequalities in Use and Experience of Urban Green Spaces. Urban For. Urban Green. 2022, 74, 127674. [Google Scholar] [CrossRef]
- Rakonjac, I.; Zorić, A.; Rakonjac, I.; Milošević, J.; Marić, J.; Furundžić, D. Increasing the Livability of Open Public Spaces during Nighttime: The Importance of Lighting in Waterfront Areas. Sustainability 2022, 14, 6058. [Google Scholar] [CrossRef]
- Kaczynski, A.T.; Potwarka, L.R.; Saelens, B.E. Association of park size, distance, and features with physical activity in neighborhood parks. Am. J. Public Health 2008, 98, 1451–1456. [Google Scholar] [CrossRef]
- Wan, C.K.B.; Shen, G.Q.; Choi, S. Eliciting users’ preferences and values in urban parks: Evidence from analyzing social media data from Hong Kong. Urban For. Urban Green. 2021, 62, 127172. [Google Scholar] [CrossRef]
- Lis, A.; Pardela, U.; Iwankowski, P.; Haans, A. Are trees and shrubs unsafe hiding places? Impact of plant forms on the perception of danger in urban green spaces in crime hot spots. Landsc. Online 2021, 91, 1–14. [Google Scholar] [CrossRef]
- Lo, A.Y.H.; Jim, C.Y. Citizen attitude and expectation towards greenspace provision in compact urban milieu. Land Use Policy 2012, 29, 577–586. [Google Scholar] [CrossRef]
- Kim, D.; Jin, J. Does happiness data say urban parks are worth it? Landsc. Urban Plan. 2018, 178, 1–11. [Google Scholar] [CrossRef]
- Ambrey, C.L.; Fleming, C.M. Public Greenspace and Life Satisfaction in Urban Australia. Urban Stud. 2014, 51, 1290–1321. [Google Scholar] [CrossRef]
- Deng, L.; Li, X.; Hao, L.; Fu, E.; Ma, J.; Sun, L.; Zhuo, H.; Shizhen, C.; Jia, Y. Empirical study of landscape types, landscape elements and landscape components of the urban park promoting physiological and psychological restoration. Urban For. Urban Green. 2020, 48, 126488. [Google Scholar] [CrossRef]
- Shen, P.; Hu, X. Park Recreation Preference Analysis and Optimization Based on WiFi Probe Technology. J. Chin. Urban For. 2020, 18, 57–60. (In Chinese) [Google Scholar] [CrossRef]
- Yang, C.; Lyu, C.; Yao, Z.; Liu, M. Study on the Differences of Day and Night Behavior in Urban Waterfront Public Space Based on Multi-agent Behavior Simulation. CAADRIA Proc. 2021, 2, 559–568. [Google Scholar] [CrossRef]
- Zhang, H.; Chen, B.; Sun, Z.; Bao, Z.Y. Landscape perception and recreation needs in urban green space in Fuyang, Hangzhou, China. Urban For. Urban Green. 2013, 12, 44–52. [Google Scholar] [CrossRef]
- Palliwoda, J.; Banzhaf, E.; Priess, J.A. How do the green components of urban green infrastructure influence the use of ecosystem services? Examples from Leipzig, Germany. Landsc. Ecol. 2020, 35, 1127–1142. [Google Scholar] [CrossRef]
- Xie, X.H.; Zhou, H.Z.; Gou, Z.H.; Yi, M. Spatiotemporal Patterns of the Use of Green Space by White-Collar Workers in Chinese Cities: A Study in Shenzhen. Land 2021, 10, 1006. [Google Scholar] [CrossRef]
- Gidlow, C.J.; Ellis, N.J. Neighbourhood green space in deprived urban communities: Issues and barriers to use. Local Environ. 2011, 16, 989–1002. [Google Scholar] [CrossRef]
- Chang, P.; Pang, X.; He, X.; Zhu, Y.; Zhou, C. Exploring the Spatial Relationship between Nighttime Light and Tourism Economy: Evidence from 31 Provinces in China. Sustainability 2022, 14, 7350. [Google Scholar] [CrossRef]
- Ngesan, M.R.; Karim, H.A.; Zubir, S.S. Human Behaviour and Activities in Relation to Shah Alam Urban Park during Nighttime. Procedia-Soc. Behav. Sci. 2012, 68, 427–438. [Google Scholar] [CrossRef]
- VanDyck, D.; Cerin, E.; Conway, T.L.; De Bourdeaudhuij, I.; Owen, N.; Kerr, J.; Cardon, G.; Frank, L.D.; Saelens, B.E.; Sallis, J.F. Associations between perceived neighborhood environmental attributes and adults’ sedentary behavior: Findings from the USA, Australia and Belgium. Soc. Sci. Med. 2012, 74, 1375–1384. [Google Scholar] [CrossRef] [PubMed]
- Maas, J.; Spreeuwenberg, P. Is Green Space in the Living Environment Associated with People’s Feelings of Social Safety? Environ. Plan. A Econ. Space 2009, 41, 1763–1777. [Google Scholar] [CrossRef]
- Wende, H.E.W.; Zarger, R.K.; Mihelcic, J.R. Accessibility and usability: Green space preferences, perceptions, and barriers in a rapidly urbanizing city in Latin America. Landsc. Urban Plan. 2012, 107, 272–282. [Google Scholar] [CrossRef]
- Ngesan, M.R.; Karim, H.A.; Zubir, S.S.; Ahmad, P. Urban Community Perception on Nighttime Leisure Activities in Improving Public Park Design. Procedia-Soc. Behav. Sci. 2013, 105, 619–631. [Google Scholar] [CrossRef]
- Gupta, K.; Roy, A.; Luthra, K.; Maithani, S. GIS based analysis for assessing the accessibility at hierarchical levels of urban green spaces. Urban For. Urban Green. 2016, 18, 198–211. [Google Scholar] [CrossRef]
- Yao, X.; Leng, H. Study on satisfaction of park recreation space based on structural equation model: A Case Study of Chang Chun. Archit. J. 2017, S1, 32–37. (In Chinese) [Google Scholar]
- Lin, S.N.; Gaubatz, P. Socio-spatial segregation in China and migrants’ everyday life experiences: The case of Wenzhou. Urban Geogr. 2017, 38, 1019–1038. [Google Scholar] [CrossRef]
- Wolch, J.R.; Byrne, J.; Newell, J.P. Urban green space, public health, and environmental justice: The challenge of making cities ‘just green enough’. Landsc. Urban Plan. 2014, 125, 234–244. [Google Scholar] [CrossRef]
- Wu, J.Y.; He, Q.S.; Chen, Y.W.; Lin, J.; Wang, S.T. Dismantling the fence for social justice? Evidence based on the inequity of urban green space accessibility in the central urban area of Beijing. Environ. Plan. B Urban Anal. City Sci. 2020, 47, 626–644. [Google Scholar] [CrossRef]
- Zhang, T.Z.; Zeng, Y.X.; Zhang, Y.J.; Song, Y.; Li, H.X. Dynamic and Heterogeneous Demand for Urban Green Space by Urban Residents: Evidence from the Cities in China. Sustainability 2020, 12, 9384. [Google Scholar] [CrossRef]
- Jiang, J.Y.; Chen, M.; Zhang, J.H. How does residential segregation affect the spatiotemporal behavior of residents? Evidence from Shanghai. Sustain. Cities Soc. 2021, 69, 102834. [Google Scholar] [CrossRef]
- Laszkiewicz, E.; Kronenberg, J.; Marcinczak, S. Microscale socioeconomic inequalities in green space availability in relation to residential segregation: The case study of Lodz, Poland. Cities 2021, 111, 103085. [Google Scholar] [CrossRef]
- Hu, X.Y.; Shen, P.Y.; Shi, Y.; Zhang, Z.H. Using Wi-Fi probe and location data to analyze the human distribution characteristics of green spaces: A case study of the Yanfu Greenland Park, China. Urban For. Urban Green. 2020, 54, 126733. [Google Scholar] [CrossRef]
- Yu, B.; Wang, C.; Gong, W.; Chen, Z.; Shi, K.; Wu, B.; Hong, Y.; Li, Q.; Wu, J. Nighttime light remote sensing and urban studies:Data, methods, applications, and prospects. J. Remote Sens. 2021, 25, 342–364. (In Chinese) [Google Scholar] [CrossRef]
- Chai, Y.W. Space-Time Behavior Research in China: Recent Development and Future Prospect. Ann. Assoc. Am. Geogr. 2013, 103, 1093–1099. [Google Scholar] [CrossRef]
- Veitch, J.; Ball, K.; Rivera, E.; Loh, V.H.Y.; Deforche, B.; Best, K.; Timperio, A. What entices older adults to parks? Identification of park features that encourage park visitation, physical activity, and social interaction. Landsc. Urban Plan. 2022, 217, 104254. [Google Scholar] [CrossRef]
- Sun, Y.; Shao, Y. Measuring visitor satisfaction toward peri-urban green and open spaces based on social media data. Urban For. Urban Green. 2020, 53, 126709. [Google Scholar] [CrossRef]
- Benita, F.; Bansal, G.; Tunçer, B. Public spaces and happiness: Evidence from a large-scale field experiment. Health Place 2019, 56, 9–18. [Google Scholar] [CrossRef] [PubMed]
- Luhmann, M. Using Big Data to study subjective well-being. Curr. Opin. Behav. Sci. 2017, 18, 28–33. [Google Scholar] [CrossRef]
- Martín, A.; Julián, A.B.A.; Cos-Gayón, F. Analysis of Twitter messages using big data tools to evaluate and locate the activity in the city of Valencia (Spain). Cities 2019, 86, 37–50. [Google Scholar] [CrossRef]
- Shen, Y.; Sun, F.; Che, Y. Public green spaces and human wellbeing: Mapping the spatial inequity and mismatching status of public green space in the Central City of Shanghai. Urban For. Urban Green. 2017, 27, 59–68. [Google Scholar] [CrossRef]
- Chen, D.; Long, X.; Li, Z.; Liao, C.; Xie, C.; Che, S. Exploring the Determinants of Urban Green Space Utilization Based on Microblog Check-In Data in Shanghai, China. Forests 2021, 12, 1783. [Google Scholar] [CrossRef]
- Ullah, H.; Wan, W.; Ali Haidery, S.; Khan, N.U.; Ebrahimpour, Z.; Luo, T. Analyzing the Spatiotemporal Patterns in Green Spaces for Urban Studies Using Location-Based Social Media Data. ISPRS Int. J. Geo-Inf. 2019, 8, 506. [Google Scholar] [CrossRef]
- Pak, A.; Paroubek, P. Twitter as a Corpus for Sentiment Analysis and Opinion Mining. In Proceedings of the Seventh International Conference on Language Resources and Evaluation (LREC’10), Valletta, Malta, 19–21 May 2010; pp. 1320–1326. [Google Scholar]
- Bertrand, K.Z.; Bialik, M.; Virdee, K.; Gros, A.; Bar-Yam, Y. Sentiment in New York City: A High Resolution Spatial and Temporal View. arXiv 2013, arXiv:1308.5010. [Google Scholar]
- Becker, H.; Naaman, M.; Gravano, L. Beyond Trending Topics: Real-World Event Identification on Twitter. In Proceedings of the International AAAI Conference on Web and Social Media, Barcelona, Spain, 17–21 July 2011; pp. 438–441. [Google Scholar]
- Steiger, E.; Resch, B.; Zipf, A. Exploration of spatiotemporal and semantic clusters of Twitter data using unsupervised neural networks. Int. J. Geogr. Inf. Sci. 2016, 30, 1694–1716. [Google Scholar] [CrossRef]
- Sakaki, T.; Okazaki, M.; Matsuo, Y. Earthquake shakes Twitter users: Real-time event detection by social sensors. In Proceedings of the 19th International Conference on World Wide Web, Raleigh, NC, USA, 26–30 April 2010; pp. 851–860. [Google Scholar]
- Huang, W.; Xu, S.; Yan, Y.; Zipf, A. An exploration of the interaction between urban human activities and daily traffic conditions: A case study of Toronto, Canada. Cities 2019, 84, 8–22. [Google Scholar] [CrossRef]
- Gao, Y.; Chen, Y.; Mu, L.; Gong, S.; Zhang, P.; Liu, Y. Measuring urban sentiments from social media data: A dual-polarity metric approach. J. Geogr. Syst. 2022, 24, 199–221. [Google Scholar] [CrossRef]
- Tan, M.-J.; He, G.C. Are people happier in locations of high property value? Spatial temporal analytics of activity frequency, public sentiment and housing price using twitter data. Appl. Geogr. 2021, 132, 102474. [Google Scholar] [CrossRef]
- Zhao, C.; Yang, B.; Liu, D. PSPL Survey: The Evaluation Method for Quality of Public Space and Public Life—The Study on Jan Gehl’s Theory and Method for Public Space Design (Part 3). Chin. Landsc. Archit. 2012, 28, 34–38. (In Chinese) [Google Scholar] [CrossRef]
- Stefano, P.; Mitchell, R. Social integration as a determinant of inequalities in green space usage: Insights from a theoretical agent-based model. Health Place 2022, 73, 102729. [Google Scholar] [CrossRef]
- Wu, C.; Ye, X.Y.; Ren, F.; Du, Q.Y. Check-in behaviour and spatio-temporal vibrancy: An exploratory analysis in Shenzhen, China. Cities 2018, 77, 104–116. [Google Scholar] [CrossRef]
- Widener, M.J.; Li, W.W. Using geolocated Twitter data to monitor the prevalence of healthy and unhealthy food references across the US. Appl. Geogr. 2014, 54, 189–197. [Google Scholar] [CrossRef]
- Zhu, F.; Ning, Y.; Chen, X.C.; Zhao, Y.B.; Gang, Y.N. On removing potential redundant constraints for SVOR learning. Appl. Soft Comput. 2021, 102, 106941. [Google Scholar] [CrossRef]
- Gehl, J. Life between Buildings; Van Nostrand Reinhold: New York, NY, USA, 1987; Volume 23. [Google Scholar]
- Xu, L.; Li, L.; Jiang, Z.; Sun, Z.; Wen, X.; Shi, J.; Sun, R.; Qian, X. A Novel Emotion Lexicon for Chinese Emotional Expression Analysis on Weibo: Using Grounded Theory and Semi-Automatic Methods. IEEE Access 2021, 9, 92757–92768. [Google Scholar] [CrossRef]
- Gai, Z.; Fan, C.; Shen, S.; Ge, Y.; Shi, Z.; Li, S.; Zhang, Y.; Cao, Y. Using Social Media Data to Explore Urban Land Value and Sentiment Inequality: A Case Study of Xiamen, China. Wirel. Commun. Mob. Comput. 2022, 2022, 1456382. [Google Scholar] [CrossRef]
- Sallis, J.; Cerin, E.; Conway, T.L. Physical activity in relation to urban environments in 14 cities worldwide: A cross-sectional study. Lancet 2016, 387, 2198. [Google Scholar] [CrossRef] [PubMed]
- Mouratidis, K. COVID-19 and the compact city: Implications for well-being and sustainable urban planning. Sci. Total Environ. 2022, 811, 152332. [Google Scholar] [CrossRef]
- Oliveira, S.; Pereira, J.M.C.; San-Miguel-Ayanz, J.; Lourenço, L. Exploring the spatial patterns of fire density in Southern Europe using Geographically Weighted Regression. Appl. Geogr. 2014, 51, 143–157. [Google Scholar] [CrossRef]
- Bereitschaft, B.; Debbage, K. Urban Form, Air Pollution, and CO2 Emissions in Large U.S. Metropolitan Areas. Prof. Geogr. 2013, 65, 612–635. [Google Scholar] [CrossRef]
- Yuan, M.; Song, Y.; Huang, Y.; Hong, S.; Huang, L. Exploring the Association between Urban Form and Air Quality in China. J. Plan. Educ. Res. 2017, 38, 413–426. [Google Scholar] [CrossRef]
- Mowen, A.J.; Orsega-Smith, E.; Payne, L.L.; Ainsworth, B.E.; Godbey, G.C. The role of park proximity and social support in shaping park visitation, physical activity, and perceived health among older adults. J. Phys. Act. Health 2007, 4, 167–179. [Google Scholar] [CrossRef] [PubMed]
Disclaimer/Publisher’s Note: The statements, opinions and data contained in all publications are solely those of the individual author(s) and contributor(s) and not of MDPI and/or the editor(s). MDPI and/or the editor(s) disclaim responsibility for any injury to people or property resulting from any ideas, methods, instructions or products referred to in the content. |
© 2023 by the authors. Licensee MDPI, Basel, Switzerland. This article is an open access article distributed under the terms and conditions of the Creative Commons Attribution (CC BY) license (https://creativecommons.org/licenses/by/4.0/).