Article

A Tree Point Cloud Simplification Method Based on FPFH Information Entropy

1
College of Mechanical and Electronic Engineering, Nanjing Forestry University, Nanjing 210037, China
2
College of Mechanical Engineering, Anhui Science and Technology University, Fengyang 233100, China
*
Author to whom correspondence should be addressed.
Forests 2023, 14(7), 1507; https://doi.org/10.3390/f14071507
Submission received: 27 June 2023 / Revised: 17 July 2023 / Accepted: 21 July 2023 / Published: 24 July 2023
(This article belongs to the Section Forest Inventory, Modeling and Remote Sensing)

Abstract

:
LiDAR technology has been widely used in forest survey and research, but the high-resolution point cloud data generated by LiDAR equipment also pose challenges in storage and computing. To address this problem, we propose a point cloud simplification method for trees, which considers both higher similarity to the original point cloud and the area of the tree point cloud. The method first determines the optimal search neighborhood using the standard deviation of FPFH information entropy. Based on FPFH information entropy and Poisson disc sampling theory, the point cloud is partitioned and sampled. By optimizing the separation thresholds of significant feature points and less significant feature points using a genetic algorithm with the Hausdorff distance and point cloud area as the objective function, the final simplified point cloud is obtained. Validation with two point cloud data sets shows that the proposed method achieves good retention of the area information of the original point cloud while ensuring point cloud quality. The research provides new approaches and techniques for processing large-scale forest LiDAR scan point clouds, reducing storage and computing requirements. This can improve the efficiency of forest surveys and monitoring.

1. Introduction

LiDAR technology has been increasingly used in forest survey and research [1]. LiDAR scanning can generate high-precision and high-fidelity three-dimensional point clouds of forests [2], which is important for growth monitoring, unmanned aerial vehicle spray route planning, and prescription map generation [3].
With the continuous development of laser radar technology, scanning resolution has also been significantly improved [4]. However, high-resolution devices also produce a large amount of data points, which brings tremendous challenges to point cloud data storage, computation, and transmission. Meanwhile, existing simplification methods focus on improving the similarity between the simplified point cloud and the original point cloud. However, forest point clouds need to retain information like leaf area for applications such as pest control and biomass monitoring, which is not considered by current simplification methods.
Point cloud simplification is understood as a process of reducing the level of detail, the main purpose of which is to remove some specified points while ensuring that the simplified point cloud still retains important features [5]. Point cloud simplification has been extensively studied [6,7]. Simple simplification methods such as uniform simplification and grid simplification effectively reduce the storage space occupied by point clouds [8,9]. However, these methods do not consider the global impact of key points on the point cloud, resulting in decreased accuracy and a loss of final model features [10]. Curvature simplification methods consider local changes in point clouds and surfaces [11]. More specifically, fewer points are retained in areas with flat curvature, while more points are retained in areas with changing curvature. This method can ensure the retention of certain features in the point cloud. However, it is not easy to determine the retention of points in large flat areas [11,12].
Feature-preserving point cloud refinement methods have become a hot topic in current research [13,14]. The selection of feature points is mainly determined by parameters such as normals and curvatures [7]. Han et al. [15] proposed a method based on normal vectors to determine and retain edge points based on octrees, and establish the topological relationship of points in space, achieving high point cloud simplification performance. Shi et al. [6] clustered the feature point set by mean clustering and used refinement methods to ensure that the simplified point cloud can retain more points in areas with flat curvature and avoid the imbalanced distribution of the simplified point set. Leal et al. [16] used the high area ratio of point cloud data as feature points and selected points to be retained using mean curvature so that the point cloud simplification result retains the original geometric features. Yuan et al. [17] first clustered the point cloud using K-d trees and then traversed all clusters using principal component analysis to find feature points, reducing point cloud simplification errors. In addition, based on changes in point cloud curvature, Markovic et al. [18] proposed a curvature-sensitive point cloud simplification method that applies support vector machines to distinguish high-curvature areas and flat areas. This method can effectively detect point sets in sharp areas and simplify the point cloud. Sometimes, feature points are determined by considering a combination of multiple parameters [19]. In this case, various studies combine the concept of entropy with these parameters as the basis for determining features, and a higher entropy represents richer information [11,20].
The above methods propose some solutions for point cloud simplification. By optimizing parameters such as the Hausdorff distance and average error, they remove high-frequency information from the original point cloud to ensure a higher similarity between the simplified point cloud and the original point cloud, so as to facilitate high-precision three-dimensional reconstruction of the point cloud [21,22,23]. However, these methods are not suitable for simplifying forest point clouds because forest point clouds have some unique characteristics and requirements [24]. In the process of controlling plant diseases and insect pests, it is often necessary to obtain the leaf area information of forests, which is an important reference index for the precision operation of spraying machinery [25]. If the simplified point cloud cannot retain this information, it will affect the biomass monitoring of forests and the effect of variable spray.
To address this problem, this study considers the quality and area of the point cloud simplification of trees. Based on FPFH information entropy and the Poisson disc sampling theory, the point cloud is partitioned and sampled. By optimizing the separation thresholds of significant feature points and less-significant feature points using a genetic algorithm with the point cloud simplification quality and area as the objective function, the final simplified point cloud is obtained.
To address this issue, this study segmented and sampled the point cloud based on FPFH information entropy and the Poisson disk sampling theory. By using a genetic algorithm to optimize the separation threshold between important and unimportant feature points with point cloud simplification quality and the area as the objective function, the final simplified point cloud was obtained. This research considered both the quality and area of tree point cloud simplification, while reducing the storage demand of the point cloud, which is helpful for improving the efficiency of forest survey and monitoring.

2. Related Works

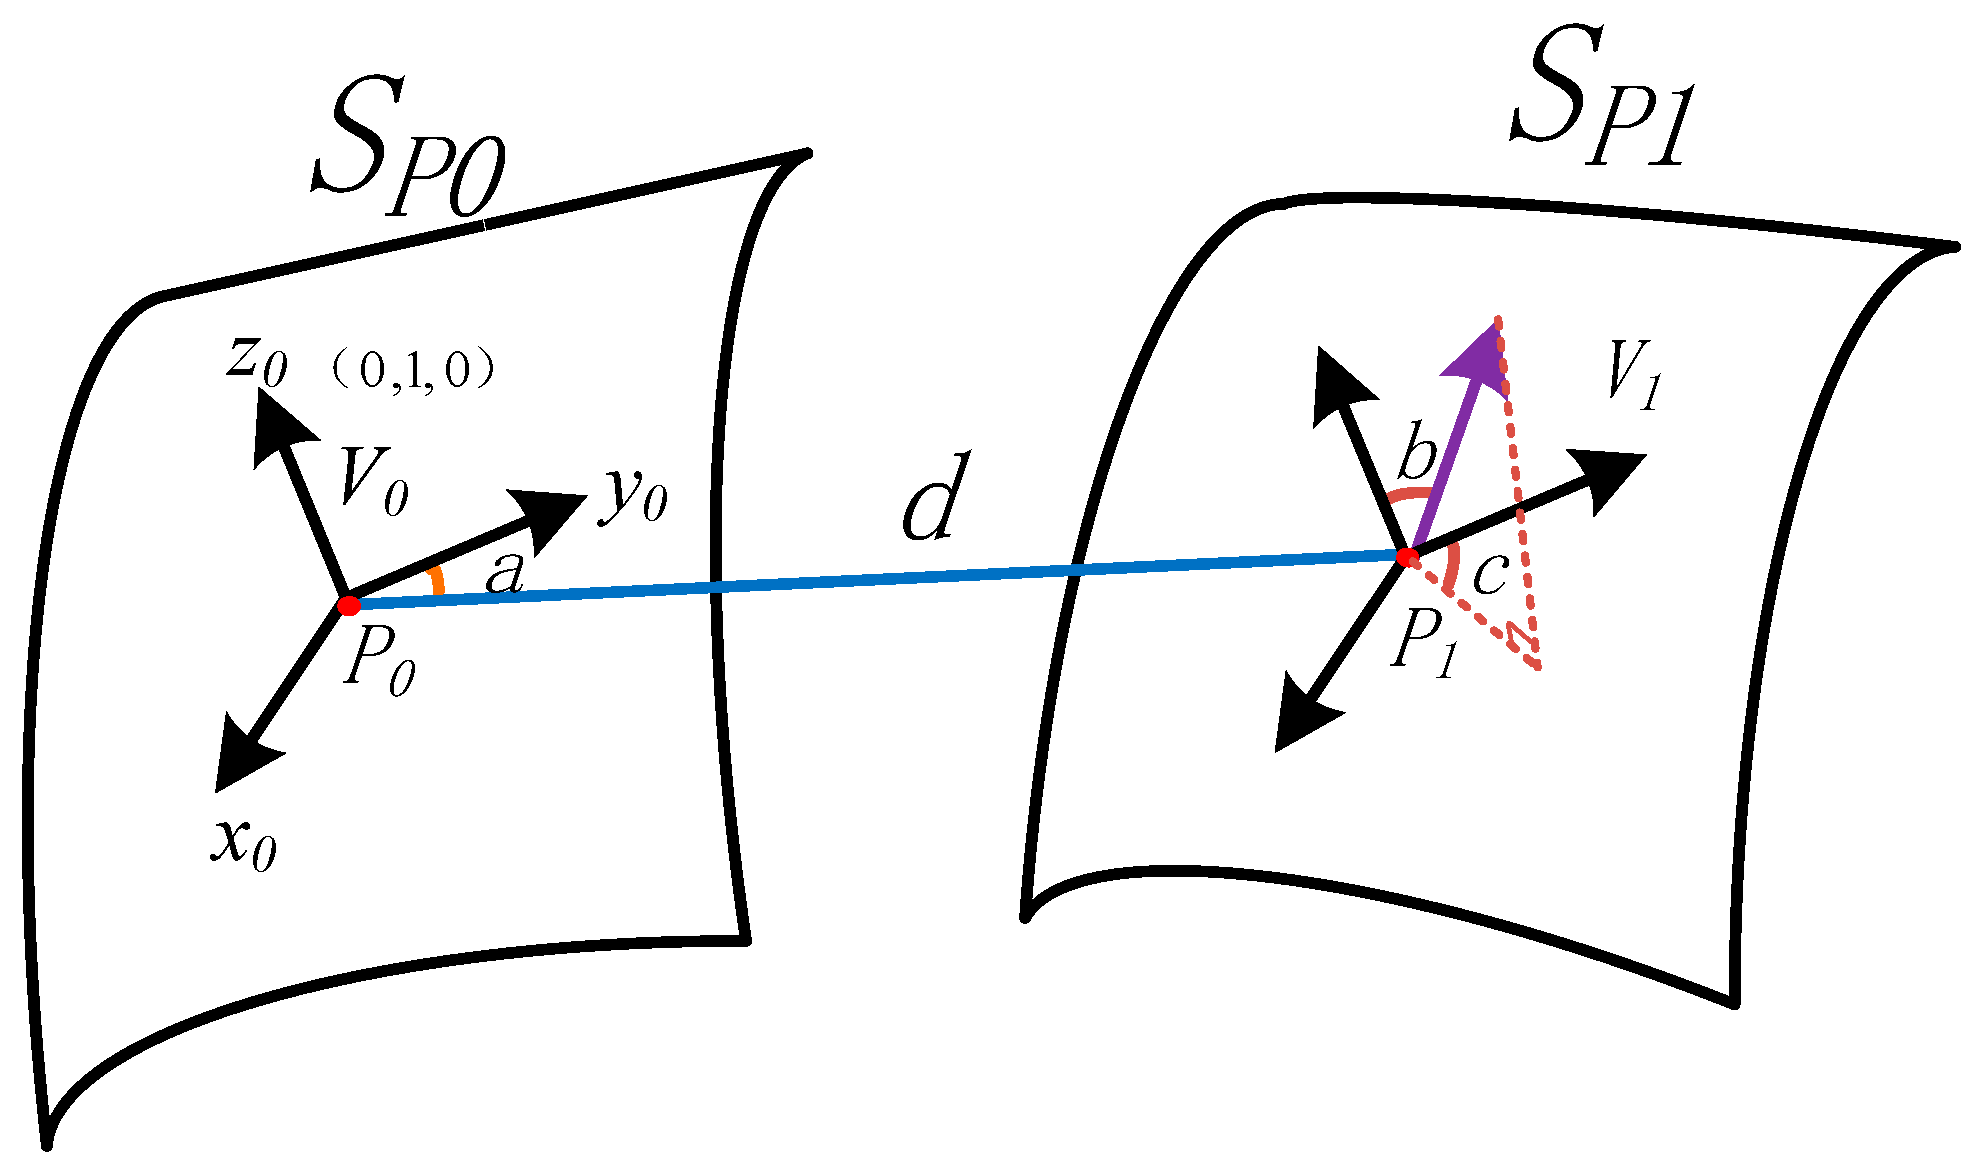
2.1. Fast Point Feature Histograms Principle

Fast Point Feature Histograms (FPFH) is a local feature. FPFH is an improved version of PFH (Point Feature Histograms), which are feature descriptors calculated based on the local geometric features of points [26,27]. Compared with PFH, FPFH weighs the relationships between neighbors during the calculation to obtain a more discriminating feature descriptor. Specifically, when calculating the SPFH (Simplified Point Feature Histogram), the FPFH takes the weighted average of the SPFH values of each neighbor to consider the relationship between neighbors. Therefore, compared with the PFH, the FPFH has a higher pose invariance and discrimination ability. In addition, the computational complexity of the FPFH is lower than that of the PFH, and the calculation speed is faster.
According to the different neighboring-point search methods, FPFH can be divided into two types: KNN search FPFH and radius search FPFH. The solution method of KNN search FFPH is as follows:
The simple point feature histograms (SPFH) are first developed. A local coordinate system x0y0z0 (cf. Figure 1) is then established for P0 and P1. Afterwards, the number of neighborhood points of the two points is determined, and the corresponding vectors (V0 and V1) according to the fitting surfaces of P0 and P1 (SP0, SP1) are obtained. The normal vector deviation between the two points can be expressed in terms of a, b, and c:
{ a = ar cos ( y 0 · P 1 P 0 | | P 1 P 0 | | ) b = ar cos ( V 0 · V 1 ) c = a r c tan V 1 · x 0 V 1 · y 0
As shown in Figure 1, d is the Euclidean distance from P0 to P1:
d = | | P 1 P 0 | |
SPFH(Pq) is a parameterization of the surface normal relative position of a point and its neighbors, and the SPFH features of point P0 can be expressed as:
S P F H ( P 0 ) = [ a , b , c ]
After obtaining the SPFH(P0) of the specified point and the SPFH of the neighborhood points, the inverse wi of the Euclidean distance between the specified point and the k neighborhood points is used as the weight to obtain the FPFH of point P0. For any point (Pq) in the point cloud, the FPFH(Pq) can be computed as
F P F H ( P q ) = S P F H ( P q ) + 1 k i = 1 k w i · S F P H ( P i )
where
w i = 1 | | P q P i | |
Figure 2 shows the FPFH calculation of the query points, where the black line indicates that the points in the connection line should be computed twice.
The method of obtaining the FPFH by KNN search is similar to that of the radius search FPFH. The only difference is the neighbor points selected in the surface fitting stage. The radius search method sets a specific radius around a point and chooses all neighboring points within that radius as neighbors. The KNN search method calculates the distance between a point and its neighboring points in the point cloud, sorts them in ascending order, and considers the closest points to be neighbors. However, for other steps, there is no difference in the calculation methods between the two. This paper adopts the KNN search method to establish FPFH.
Compared with the radius search method, the KNN search FPFH method adaptively determines the number of neighbor points according to the local density of the point cloud. In sparse areas, more neighbor points are selected, while in dense areas, fewer neighbor points are selected. This avoids selecting too many or too few neighbor points due to the fixed search radius. Therefore, the FPFH descriptor obtained by the KNN search method can better reflect the local geometric characteristics of the point cloud and has higher recognition and discrimination ability.
In summary, the KNN search FPFH method chooses neighbors more adaptively based on the density of local points in the point cloud, so the final FPFH feature descriptor can better reflect the geometric features of the local point cloud. This paper adopts the KNN search method to calculate the FPFH feature descriptor.

2.2. The Proposed Method

2.2.1. Determination of FPFH Neighborhood Searching Ranges

According to FPFH theory, for different numbers of searched neighbor points, the fitted surface and normal vector of the same point are different, and the components of FPFH in each interval will also change [26,28]. When the search radius is too small (k = 2), there will be more empty values in the FPFH components (as shown in Figure 3). When the search radius is too large, as shown in Figure 3 (k = 50), the differences between the FPFH features of each point will become smaller and smaller. At such a search radius, no matter any point in the point cloud, the distribution of its FPFH components is more uniform, which is also not conducive to finding feature point clouds based on the differences of FPFH. In order to obtain the most suitable number of neighbor points, we used information entropy [29] to measure the differences of FPFH of each point.
For a point cloud dataset P which has N points, the information entropy is expressed as
H ( i ) = e F P F H ( P i ) p ( e ) ln ( p ( e ) + Δ )
where i ∈ [ 1, 2, , N ] and p(e) represent the probability that the feature is e, and Δ is a minimal value in order to avoid the appearance that p is 0.
Typically used in the optimization of system equations, information entropy is a key indicator of system information quantification. The change in FPFH information entropy is strongly related to the number of search neighbors. To maximize the feature difference between points and find the most appropriate number of neighbors, the standard deviation of information entropy, cov(H), is used to represent the dispersion of FPFH features at each point:
c o v ( H ) = i = 1 N ( H ( i ) a v e ( H ) ) 2 N
The maximum cov(H) is then chosen to obtain the search number k of optimized FPFH neighbors as:
k = arg max ( cov ( H ) )

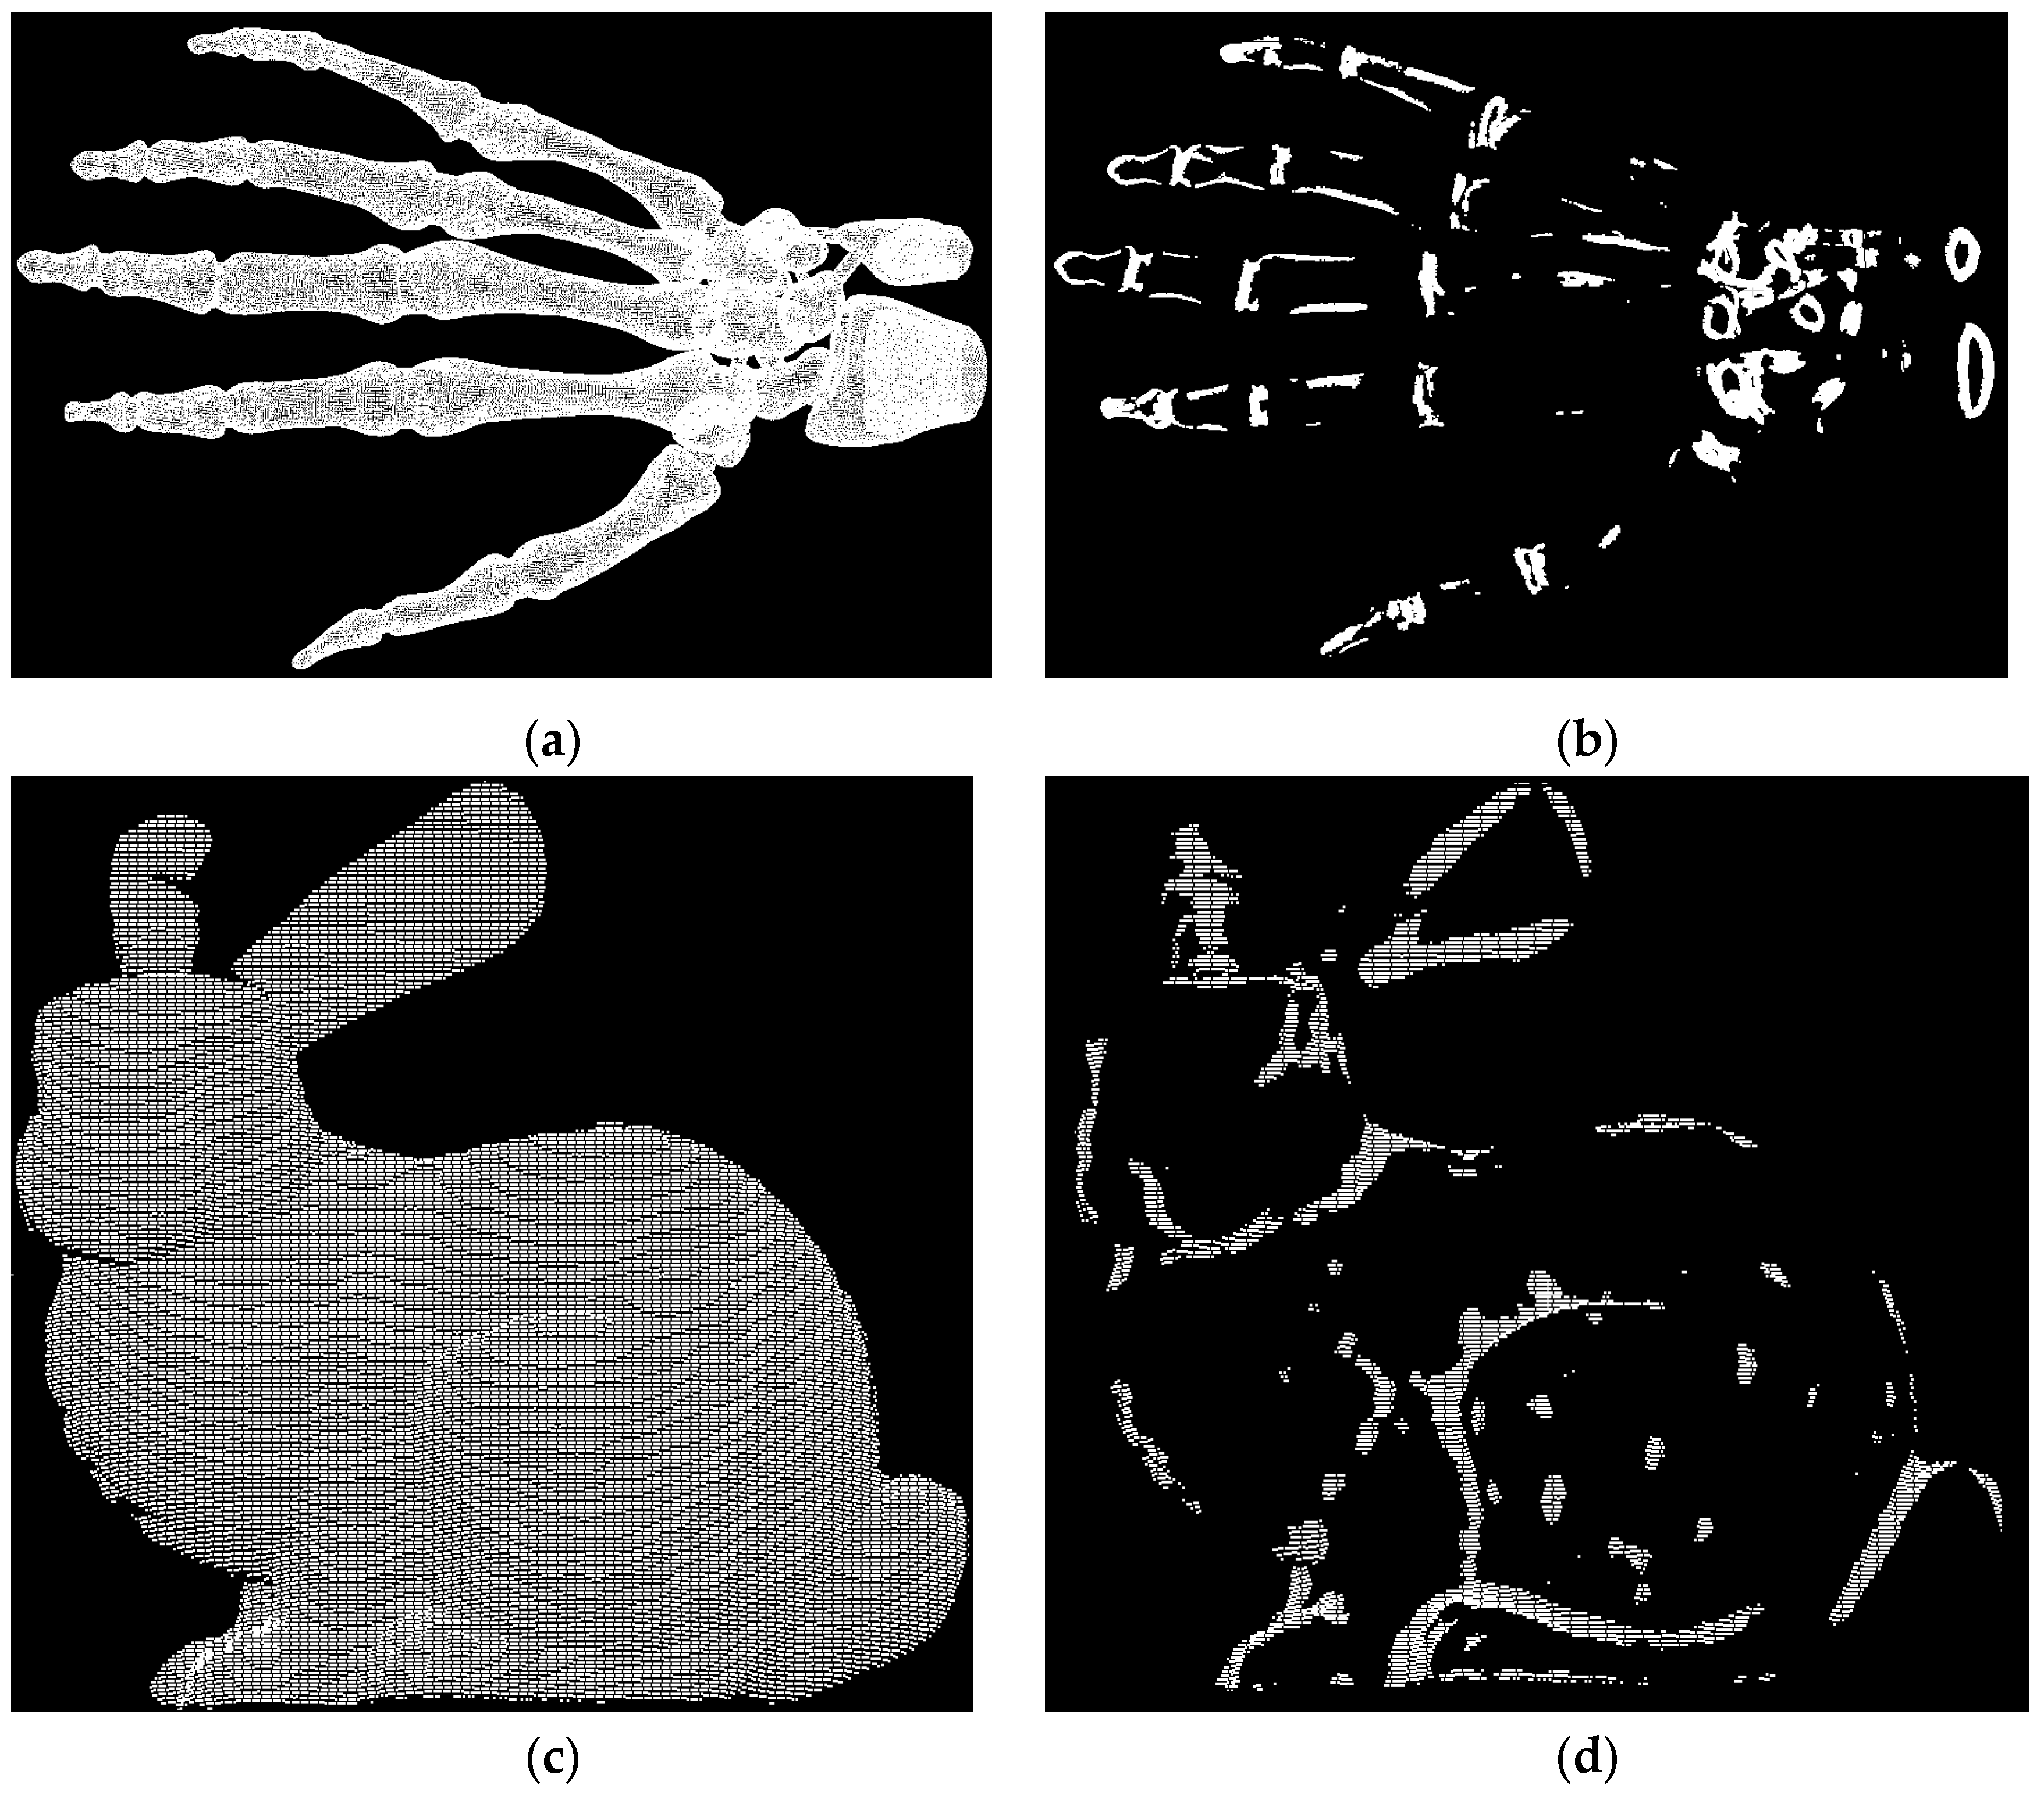
2.2.2. Extraction of Feature Points

FPFH can be used to distinguish different planes [26]. For spheres and cylinders, the histogram of FPFH features has peaks at the center; for edges and corners, the histogram of FPFH features has peaks at the edges and corners; for planes, the histogram of FPFH features has a similar distribution in all directions. Therefore, points with larger information entropy are concentrated at edges, sharp areas and high-curvature areas. Figure 4 shows the point clouds obtained by extracting 10% of the points with the maximum information entropy from the point cloud files (hand and bunny) in the Stanford model library, according to the FPFH information entropy.
Specifically, for the point clouds of hand and bunny, the FPFH feature descriptor of each point is first calculated, and then the information entropy of each point is calculated according to Formula (6). The points with the top 10% information entropy are extracted as significant feature points Pd. As can be seen from Figure 4, these significant feature points are mainly distributed at the edge of the model, which reflects the geometric features of the model. We call these points significant feature points Pd. These points need to be retained in the point cloud simplification process.
Pd contributes abundant detail features, but retaining only these points will lead to the clustering of point clouds and a large number of voids. Therefore, we introduced less significant feature points Pl in the simplified point cloud to fill the visual gaps. Pl is obtained from the point set by Poisson disc sampling. The Poisson disc sampling algorithm uses a uniform grid to divide the point cloud space. Combined with random point sampling and minimum distance constraints, it can ensure that the sampled points are neither too far nor too close [30]. Pd and Pl constitute the simplified point cloud Ps. Their relationship satisfies Equation (9):
P s = P d + P l
Pd and Pl constitute the simplified point cloud. However, different combinations between them will still affect the final result of point cloud simplification. For this reason, we set a threshold ratio T to define the boundary between Pd and Pl. T satisfies Equation (9):
T = n d n s
where T [ 0 , 1 ] , nd is the number of Pd points and ns is the number of Ps points.
The selection of T should consider the target features of the point cloud. This study used two target features. The first is the point cloud area deviation Δs. The point cloud area determines the leaf area. The smaller Δs is, the smaller the leaf area deviation. After triangulating the point cloud using the rolling ball algorithm, the point cloud is divided into multiple non-intersecting triangles. If the vertex coordinates of the triangle are p1, p2, and p3, respectively, let:
a 1 = p 1 p 2 2 a 2 = p 3 p 2 2 a 3 = p 1 p 3 2 h = a 1 + a 2 + a 3 2
The area of the triangle can be obtained by using Heron’s formula:
s = h ( h a 1 ) ( h a 2 ) ( h a 3 )
The area S of the entire point cloud can be expressed as
S = i = 1 n s i
After calculating the area SP of the original point cloud, and the area SPs of the simplified point cloud are obtained, Δs is then expressed as
Δ s = | S P S P s |
Secondly, the simplified point cloud needs to ensure the maximum similarity to the original point cloud. The Hausdorff distance refers to the maximum of all Euclidean distances from a point in one set to the nearest point in another set. It can represent the degree of similarity between two point clouds. The smaller the Hd, the higher the similarity between the two. For the point clouds P and Ps before and after processing, the Hd between them is defined as:
H d ( P , P s ) = max { sup p P i n f p s P s d ( p , p s ) , sup p s P s i n f p P ( p , p s ) }
Then, the objective function of point cloud simplification is expressed as
f ( T ) = λ × Δ s + ( 1 λ ) × H d , λ ( 0 , 1 )
When the objective function reaches its minimum value, the allocation of Pd and Pl is optimal. At the same time, the effect of point cloud simplification is the best. In order to obtain the optimal point cloud simplification effect, we used a genetic algorithm to optimize the value of T. The genetic algorithm is an optimization algorithm based on natural selection and metaheuristics. It simulates the natural evolution process to solve optimization problems. The specific solution steps are as follows:
  • Encoding: Each chromosome is represented by a real number in the range (0, 1).
  • Initialize the population: Randomly generate n real numbers as the initial population, where n is the population size.
  • Evaluate fitness: Calculate the objective function value corresponding to each chromosome, and set the fitness of the chromosome with the smaller value higher.
  • Selection: Use the roulette wheel selection method to select chromosomes to generate the next generation population. The probability of selecting a chromosome with higher fitness is greater.
  • Crossover: Use two-point crossover, randomly select two parent chromosomes and exchange the middle part to generate two offspring chromosomes. The crossover probability is pc.
  • Mutation: Randomly select a gene of a chromosome, add a small random value, and the mutation probability is pm.
  • Repeat Steps 3 to 6 until the maximum number of generations is reached.
  • Select the chromosome with the highest fitness from the last generation as the optimal solution.
The convergence curve obtained using the genetic algorithm is shown in Figure 5:
As the number of generations increases, the objective function value gradually decreases and finally stabilizes near the minimum value, indicating that the optimal solution has been found. The optimal T value can be obtained from the chromosome with the highest fitness in the final population. By using this T value, the optimal allocation of significant feature points Pd and less significant feature points Pl can be obtained, and the best point cloud simplification effect can be achieved.
In summary, the genetic algorithm is used to search for the optimal T value by optimizing the objective function. By maximizing the fitness, the T value corresponding to the minimum objective function value can be obtained, so as to achieve the optimal allocation of Pd and Pl and the best point cloud simplification effect.

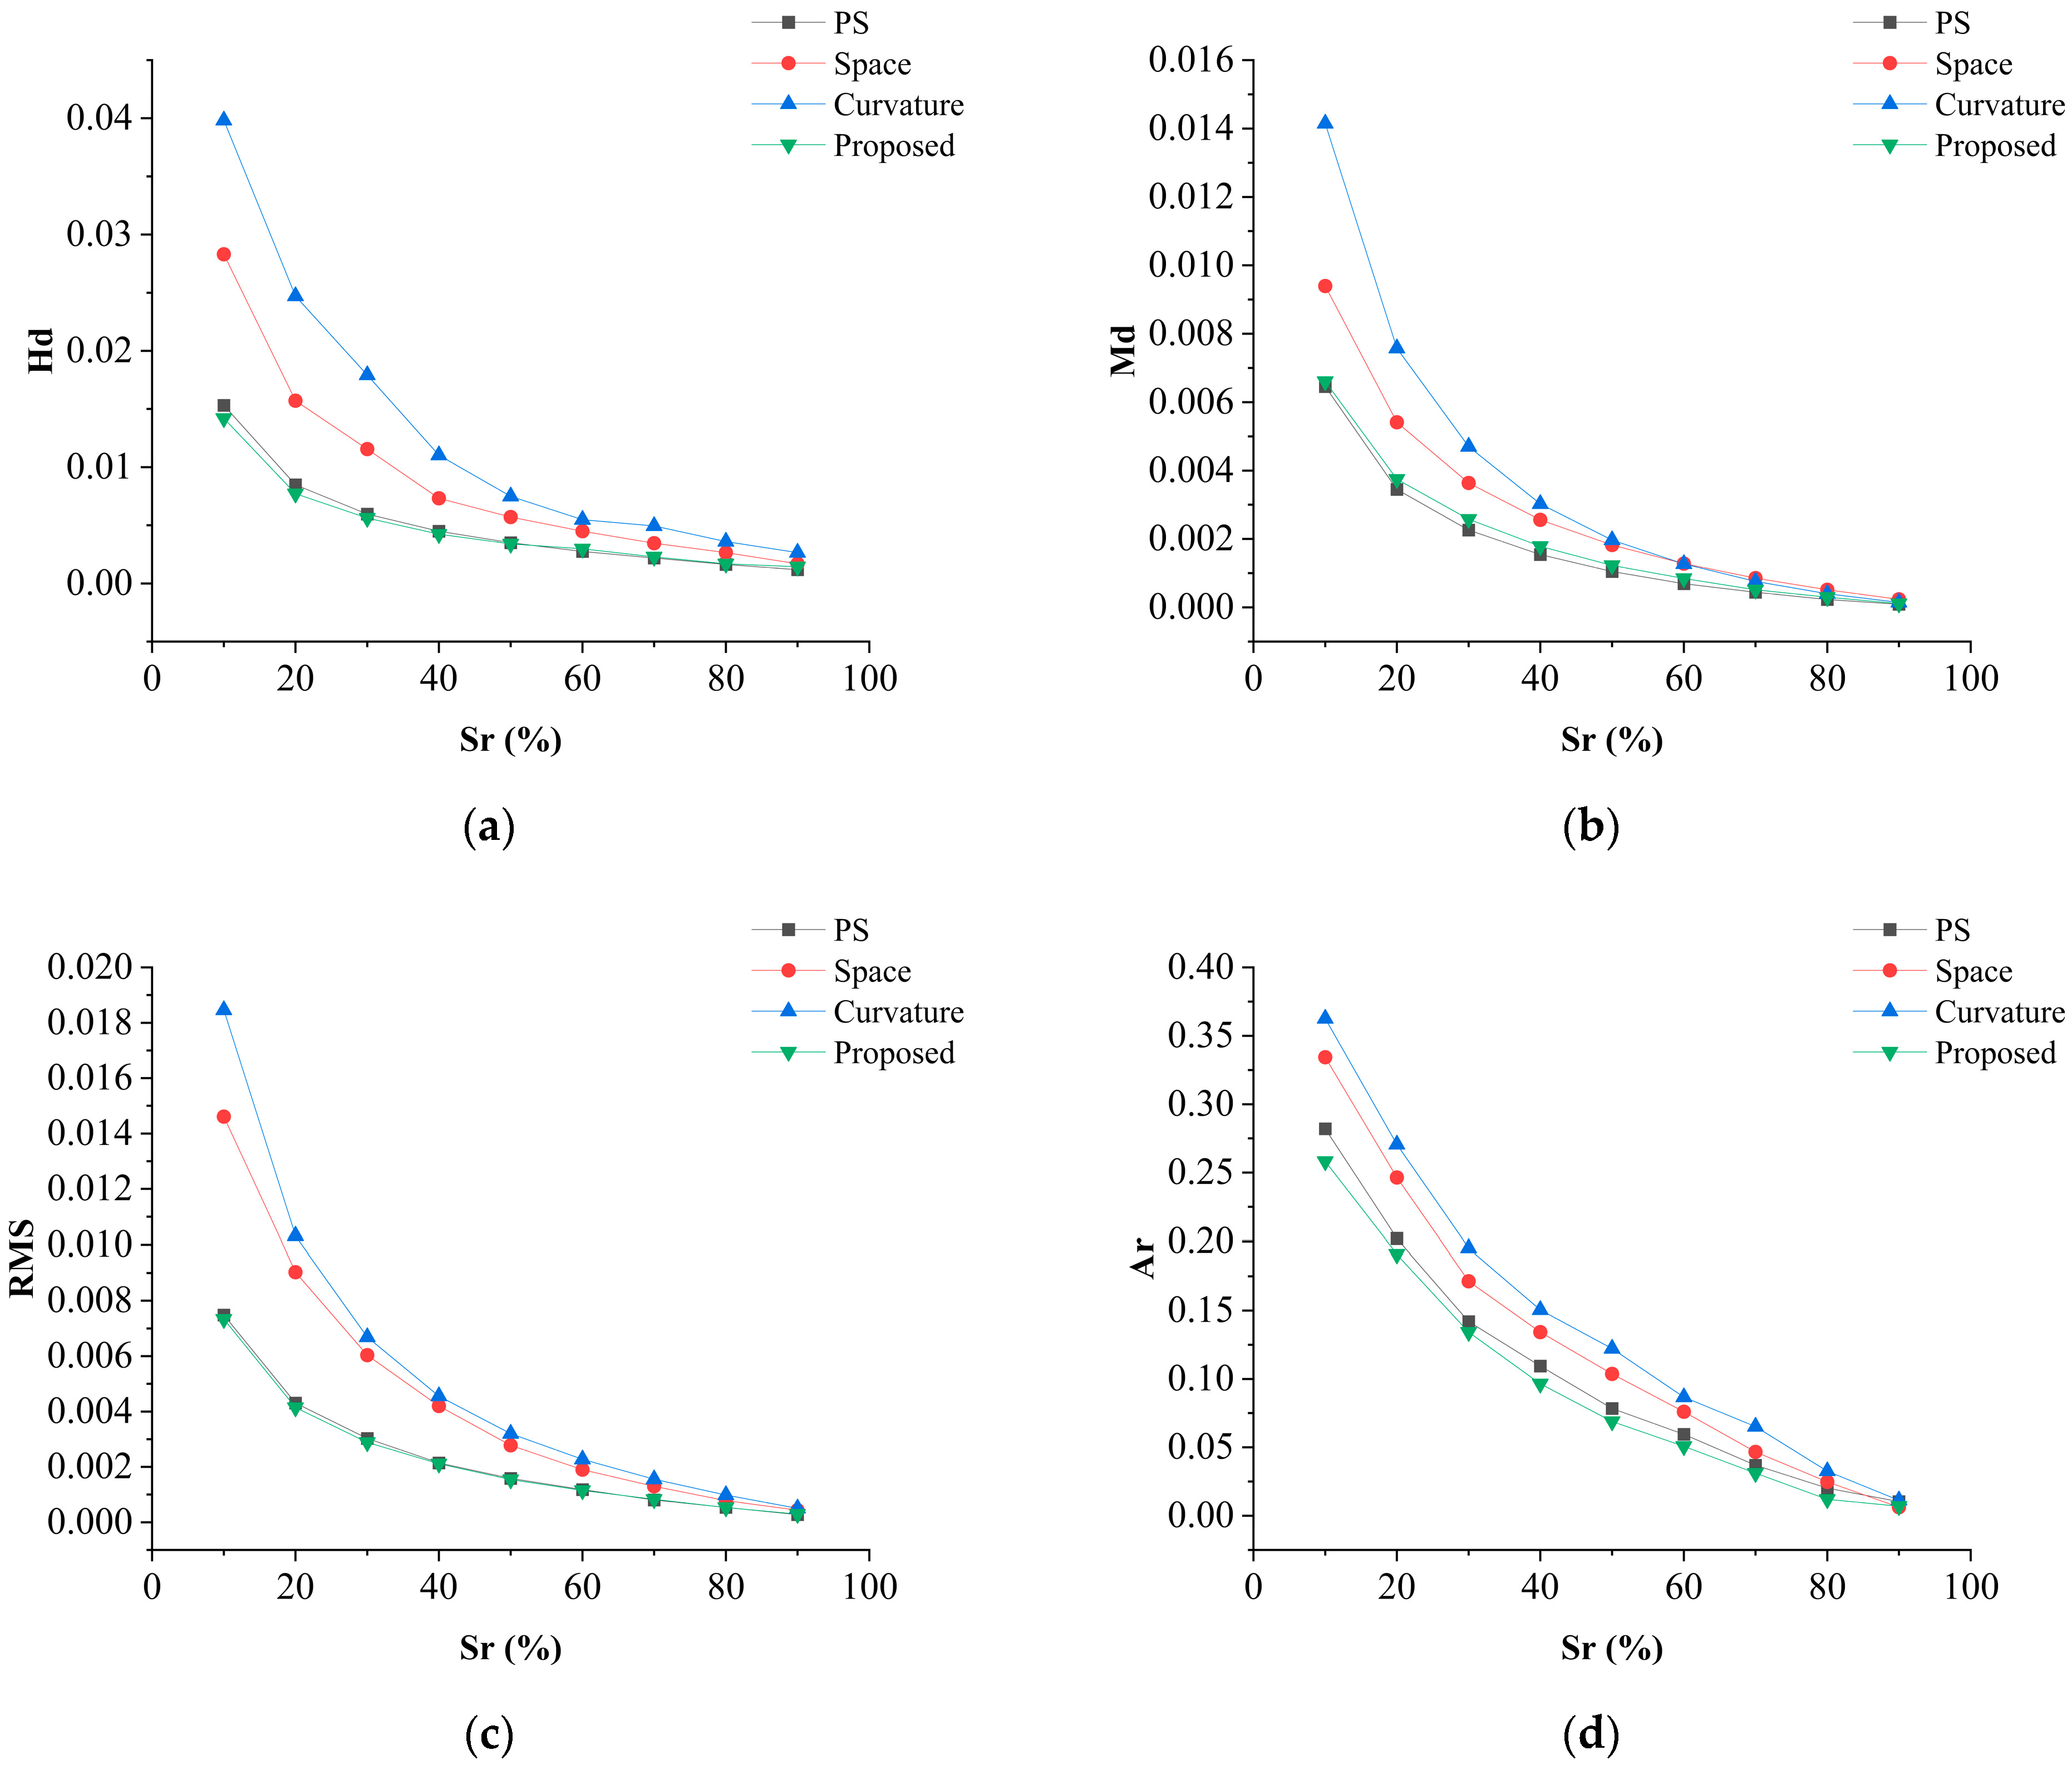
2.3. Evaluation Metrics of Simplification

By comparing the simplified point cloud with the original point cloud through some quantitative indicators, the quality of point cloud simplification can be intuitively seen [31]. The geometric error is obtained by calculating the Euclidean distance between the sampling point and its projection point on the simplified point cloud. For the original point cloud P and the simplified point cloud Ps, the average geometric error Md between P and Ps is defined as
M d = ( P , P s ) = 1 | | P | | p P d ( p , P s )
To evaluate the balance of the proposed method, we also use the root-mean-square error (RMS) mentioned in [13] to evaluate the simplification result of the point cloud. RMS estimates the error by comparing the side lengths of the triangular meshes generated from the point clouds. It is defined as
R M S = 1 n 1 i = 1 n ( l i l ¯ )
where li is the length of the i-th triangle side, and l ¯ is the average triangle side length.
Md and RMS quantify the error between the simplified point cloud and the original point cloud. The smaller the values, the better the simplification effect.

2.4. Platforms and Software

All experiments in the article were conducted on a Windows 10 operating system. The computer CPU was AMD 5600X with 32 GB of running memory. The code compilation and running environment was Matlab R2021b. The point cloud model display and comparison software were CloudCompare v2.12 and MeshLab v1.3.4.
CloudCompare v2.12 is a powerful open-source software for point cloud and 3D mesh processing. It supports various point cloud and 3D mesh formats, and provides point cloud registration, segmentation, simplification, filtering and other preprocessing tools, as well as measurement, CAD model fitting, geographic location annotation and other functions. The software is simple and easy to use, and is often used for point cloud data visualization, analysis and preprocessing.
MeshLab v1.3.4 is an open source 3D mesh processing system that supports most 3D mesh formats. It provides a wealth of 3D mesh processing tools, including mesh repair, segmentation, foldover drawing, measurement, texture mapping, smoothing, etc. The software is widely used in cultural-relic digital protection, medical image processing, Internet content creation and other fields. In the experiment of this paper, CloudCompare was selected to visualize the point cloud data, and its built-in point cloud simplification tool Space was used as one of the comparison methods. MeshLab was used to calculate errors and visualize error visualization.

2.5. Test Data Set and Process

To test the applicability and performance of the method proposed in this paper, we obtained two sets of point cloud data (referred to as Dataset 1 and Dataset 2, respectively) using the acquisition equipment (FARO Focus, FOCUSS 70).
We selected three other point cloud simplification algorithms for comparison: Space, implemented by CloudCompare; Curvature, a simplification method based on curvature [32]; and Partition Simplification (PS) [13]. We used these methods to simplify the two sets of point cloud data to the same simplification ratio Sr (simplification ratio) and compared the simplification results of the four methods. Sr represents the degree of point cloud simplification and is expressed as
S r = N N
where N′ is the number of points in the simplified point cloud, and N is the number of points in the original point cloud.
We first simplified Dataset 1 using four methods. Due to space limitations, we show the simplification effects at Sr = 20% and 80%, as can be seen from Table 1.
To further quantitatively verify the method proposed in this paper, we used Dataset 2 with a larger data volume to compare the performance of the four methods. We selected Hd, Md, RMS and area deviation ratio Ar (Δs/SP) to compare the point cloud simplification results of the four methods. The comparison results are shown in Table 2. Table 2 shows the error maps at Sr = 20%, 50% and 80%. Red represents small errors and green represents large errors.

3. Results

Dataset 1 includes four trees (longitude 118.8121528316, latitude 32.0811017391), containing 1,559,395 points in total (see Figure 6a). Dataset 2 is the point cloud data of the plantation (longitude 119.0106180107, latitude 32.3553524651), containing 3,253,332 points in total (see Figure 6b).
When Sr = 20%, it can be clearly observed that in the tree leaf area, due to the large change in the point cloud normal vector in this part, the simplification result of Curvature has an obvious point cloud missing. There are no obvious differences between the other three methods. In the tree trunk area, PS, Curvature and the proposed method retain detail features, but Curvature has voids at the trunk position. The simplification result of Space does not highlight geometric features, and the points are distributed uniformly. When Sr = 80%, more points are retained at this time, and the visual differences between the four methods are small.
From the comparison results of the evaluation indicators (Figure 7), it can be seen that for all methods, Hd, Md and RMS will decrease with the increase in Sr, and finally tend to 0. Among the four methods, Curvature performed the worst; as can be observed from Table 1, Curvature always has the most green. This is because Curvature simplifies based on the curvature characteristics of points, resulting in voids during simplification, so the performance is poor. Space performed better than Curvature. PS and the proposed method have better simplification effects. It can be seen from the comparison of Hd that when Sr ≤ 50%, the Hd of our method is the smallest. When Sr > 50%, the proposed method performs slightly worse than PS. In the comparison of Md, PS had the best effect. In the RMS results, PS and the proposed method performed very similarly. Combined with the error comparison map (Table 2), PS and the proposed method have very similar colors, and we can also observe the same error distribution. In the comparison of Ar, the proposed method has the best score at any Sr. This shows that the proposed method maintains the area of the point cloud while ensuring the quality of the point cloud.
Specifically, with the increase in Sr, the Hd, Md and RMS of all methods decrease, indicating that the simplification degree is increasing. However, compared with other methods, the proposed method and PS have the smallest decrease in these indicators, indicating that it can achieve the highest similarity with the original point cloud under the same simplification ratio. Curvature has the largest decrease, indicating the loss of more details. In the comparison of Ar, the proposed method has the smallest decrease, indicating that it retains the most area information of the original point cloud.
PS and the proposed method achieved good simplification effects. Compared with PS, the proposed method has certain advantages in retaining area information. It can achieve better area retention under the same simplification ratio.

4. Discussion

Point cloud simplification is a very important preprocessing step in point cloud processing. It can greatly improve the efficiency of point cloud analysis and understanding. For tree point clouds, the area of the point cloud is a very important index that determines the leaf area of the tree. Based on the theory of FPFH information entropy and Poisson disc sampling, this paper realizes the simplification of tree point clouds while maintaining the area parameters of the original point cloud through the genetic optimization of Pl and Pd.

4.1. FPFH and Neighborhood Search

Compared to using convex hull algorithms to extract boundary points and normal estimation to detect high-curvature regions, using FPFH entropy is more convenient and efficient. However, FPFH is quite sensitive to the point cloud density, while most point clouds do not have uniform density. Improper selection of the neighborhood size may lead to erroneous feature point extraction.
It is known from FPFH theory that different neighborhood selections can have significant impacts on the FPFH results. In point cloud research, neighborhood selection is an age-old topic. Demantké et al. [33] also used information entropy based on three-dimensional features to determine the search neighborhood. The optimized search neighborhood enhanced the variation of dimensional features, providing useful clues for subsequent segmentation and classification algorithms [34]. This gives us some inspiration. As a local feature descriptor, the FPFH calculates the differences between a point and its neighboring points in each dimension. Points in different regions exhibit different FPFH distributions. Using this trait, points on edges and high-curvature areas can be extracted. We used the cov(H) of th FPFH information entropy to calculate the optimal neighborhood size, to ensure maximum differences in the FPFH between points, while avoiding erroneously classifying some unsuitable points as P.

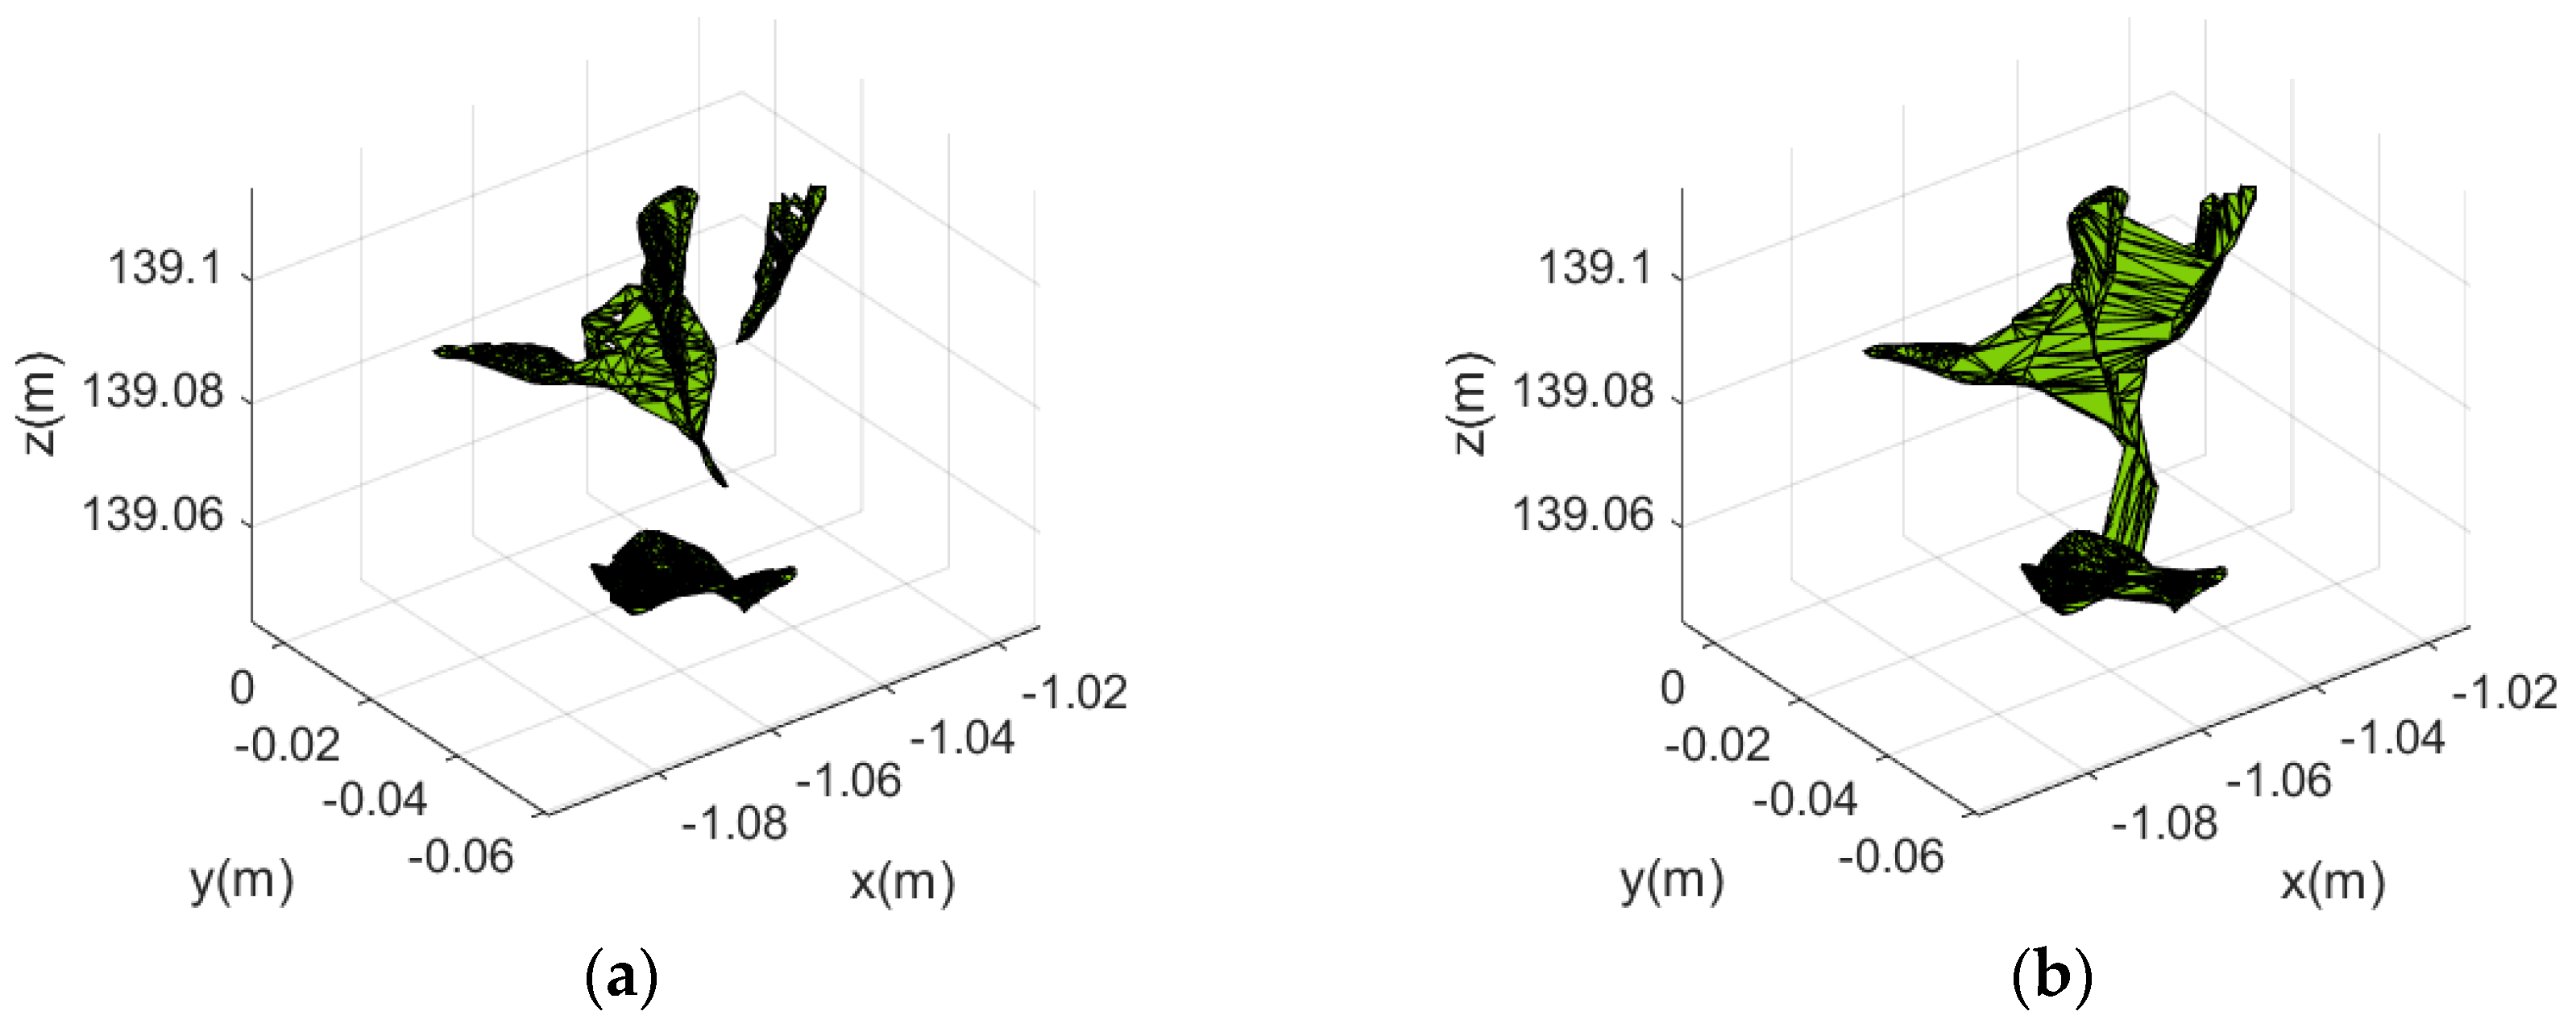
4.2. Key Points and Area of Point Cloud

The rolling ball algorithm is used to generate a triangular mesh from a point cloud by using a fixed radius ball. By accumulating the area of each triangle in the triangular mesh, the total area of the point cloud can be obtained. However, this method has some limitations:
(1)
Boundary points and high-curvature feature points have a greater impact on the area. Ignoring or missing these points during simplification will cause a large change in the calculated area.
(2)
In the acquired point cloud, the point density near the center is larger, while the point density far away becomes sparse. The final point cloud cannot guarantee a uniform point density at each position.
(3)
If the points in Pl are too sparse, it will also have a great impact on the area calculation result, resulting in the overestimation or underestimation of the area.
To solve these problems, this paper selects Poisson disc sampling to generate less significant points Pl. By combining the boundary points, high-curvature feature points Pd and Pl, a simplified point cloud Ps that retains the overall shape and area information of the original point cloud can be obtained. Poisson disc sampling can generate uniformly distributed points to fill in the sparse areas and avoid redundant points in dense areas.

4.3. Density of Point Cloud and Sr

In the Ar comparison results of Dataset 2, when Sr < 50%, the Ar of the four methods all exceeded 0.1, which means that the area deviation of the point cloud is increasing. When Sr or the density of the point cloud is large, the triangular mesh calculated by the rolling ball algorithm correctly covers every point. At this time, the area of the triangular mesh is the leaf area (Figure 8a). However, when Sr or the density of the point cloud is small, the division of the triangular mesh is not accurate (Figure 8b). At this time, the calculated area is not meaningful.
Specifically, when calculating the area of point clouds with different densities using the rolling ball algorithm, the following situations may occur:
(1)
When the point density is high, the generated triangular mesh can accurately cover all points, and the calculated area is close to the actual area.
(2)
When the point density is low, the generated triangular mesh cannot cover all points, resulting in an inaccurate area calculation result. Some areas are overestimated while some areas are missing.
(3)
When the Sr is small and the point density is high, although the number of points after simplification is small, the density is still high. The generated triangular mesh can still cover the overall shape of the point cloud, and the calculated area is still close to the actual situation.
(4)
When the Sr is small and the point density is low, the number of points after simplification is small and the density is lower, resulting in a large error in the calculated area.
In summary, a higher point density helps to obtain a more accurate area calculation result under the same Sr. When the point density is low, a larger Sr is required to ensure calculation accuracy. Therefore, the minimum Sr that can be achieved depends on the density of the original point cloud. For point clouds with high density, a small Sr can meet the needs. For point clouds with low density, a larger Sr is required.

5. Conclusions and Future Work

This study proposes a point cloud simplification method for forests based on FPFH information entropy and the Poisson disk sampling theory. This method first partitions and samples the point cloud using FPFH information entropy and the Poisson disk sampling theory. It takes point cloud simplification quality and area as the objective function and optimizes the thresholds of significant feature points and less-significant feature points through genetic algorithms to obtain the final simplified point cloud.
The experimental results show that the proposed method has the best performance in comprehensive evaluation indicators such as similarity, simplification degree and area retention. Compared with Curvature and Space, the proposed method and PS can achieve higher-quality simplification results. Compared with PS, the proposed method has certain advantages in retaining area information. It can achieve a better balance between simplification degree and area retention.
The results verify that the proposed point cloud simplification method based on information entropy and Poisson disc sampling can achieve higher-quality simplification while ensuring area retention. This helps to obtain a simplified point cloud that retains the original geometric features as much as possible. This can benefit applications like biomass monitoring and precision spraying.
In summary, the proposed method can better meet the needs of forest point cloud simplification. Compared with existing point cloud simplification methods, the main contributions of this study are as follows:
(1)
A method for determining the optimal search neighborhood based on the standard deviation of FPFH information entropy is proposed, providing a basis for subsequent sampling and optimization;
(2)
The FPFH features and the Poisson disk sampling theory are used to partition and sample each point cloud to retain the geometric features of the point cloud;
(3)
The point cloud simplification quality and area are taken as the objective function, and genetic algorithms are used to optimize the thresholds of significant feature points and less-significant feature points to control point cloud simplification quality and area.
It should be noted that this study did not investigate the relationship between point cloud density, Sr and simplification quality, and the size of the point cloud datasets currently used is still relatively small. In future work, we will consider obtaining the relationship between point cloud density, Sr and simplification quality, and designing density-adaptive simplification algorithms. In addition, optimization algorithms more suitable for point cloud processing will be adopted to replace genetic algorithms, which can further improve and increase the computational speed of this method. We will also select point cloud data containing more tree types to verify the algorithm.

Author Contributions

Conceptualization, C.H.; data curation, J.X. and Y.Z.; formal analysis, J.L.; funding acquisition, Y.R.; investigation, J.X. and Y.Z.; methodology, C.H.; project administration, Y.R.; software, C.H.; supervision, S.F., H.Z., G.X. and G.F.; validation, C.H. and S.F.; writing—original draft, C.H.; writing—review and editing, Y.R. All authors have read and agreed to the published version of the manuscript.

Funding

This project was financially supported by the National Key Research and Development Program (No. 2022YFD2202105).

Data Availability Statement

Data available on request from the corresponding author.

Acknowledgments

The authors would like to thank the Co-Innovation Center of Efficient Processing and Utilization of Forest Resources, Nanjing Forestry University.

Conflicts of Interest

The authors declare no conflict of interest.

References

  1. Tompalski, P.; Coops, N.C.; White, J.C.; Goodbody, T.R.H.; Hennigar, C.R.; Wulder, M.A.; Socha, J.; Woods, M.E. Estimating Changes in Forest Attributes and Enhancing Growth Projections: A Review of Existing Approaches and Future Directions Using Airborne 3D Point Cloud Data. Curr. For. Rep. 2021, 7, 1–24. [Google Scholar] [CrossRef]
  2. Tao, W.; Lei, Y.; Mooney, P. Dense point cloud extraction from UAV captured images in forest area. In Proceedings of the 2011 IEEE International Conference on Spatial Data Mining and Geographical Knowledge Services, Fuzhou, China, 29 June–1 July 2011; pp. 389–392. [Google Scholar]
  3. Zhang, H.; Wang, L.; Jin, X.; Bian, L.; Ge, Y. High-throughput phenotyping of plant leaf morphological, physiological, and biochemical traits on multiple scales using optical sensing. Crop J. 2023, in press. [CrossRef]
  4. Li, Q.; Xue, Y. Real-time detection of street tree crowns using mobile laser scanning based on pointwise classification. Biosyst. Eng. 2023, 231, 20–35. [Google Scholar] [CrossRef]
  5. Luebke, D.P. A developer’s survey of polygonal simplification algorithms. IEEE Comput. Graph. Appl. 2001, 21, 24–35. [Google Scholar] [CrossRef]
  6. Shi, B.-Q.; Liang, J.; Liu, Q. Adaptive simplification of point cloud using k-means clustering. Comput.-Aided Des. 2011, 43, 910–922. [Google Scholar] [CrossRef]
  7. Li, M.; Nan, L. Feature-preserving 3D mesh simplification for urban buildings. ISPRS J. Photogramm. Remote Sens. 2021, 173, 135–150. [Google Scholar] [CrossRef]
  8. Ji, C.; Li, Y.; Fan, J.; Lan, S. A Novel Simplification Method for 3D Geometric Point Cloud Based on the Importance of Point. IEEE Access 2019, 7, 129029–129042. [Google Scholar] [CrossRef]
  9. Potamias, R.A.; Bouritsas, G.; Zafeiriou, S. Revisiting Point Cloud Simplification: A Learnable Feature Preserving Approach. arXiv 2021, arXiv:2109.14982. [Google Scholar]
  10. Nurunnabi, A.; West, G.; Belton, D. Outlier detection and robust normal-curvature estimation in mobile laser scanning 3D point cloud data. Pattern Recognit. 2015, 48, 1404–1419. [Google Scholar] [CrossRef]
  11. Wang, G.; Wu, L.; Hu, Y.; Song, M. Point cloud simplification algorithm based on the feature of adaptive curvature entropy. Meas. Sci. Technol. 2021, 32, 065004. [Google Scholar] [CrossRef]
  12. Mahdaoui, A.; Sbai, E.H. 3D Point Cloud Simplification Based on k-Nearest Neighbor and Clustering. Adv. Multimed. 2020, 2020, 8825205. [Google Scholar] [CrossRef]
  13. Wang, S.; Hu, Q.; Xiao, D.; He, L.; Liu, R.; Xiang, B.; Kong, Q. A New Point Cloud Simplification Method with Feature and Integrity Preservation by Partition Strategy. Measurement 2022, 197, 111173. [Google Scholar] [CrossRef]
  14. Xu, X.; Li, K.; Ma, Y.; Geng, G.; Wang, J.; Zhou, M.; Cao, X. Feature-preserving simplification framework for 3D point cloud. Sci. Rep. 2022, 12, 9450. [Google Scholar] [CrossRef] [PubMed]
  15. Han, H.; Han, X.; Sun, F.; Huang, C. Point cloud simplification with preserved edge based on normal vector. Opt. Int. J. Light Electron Opt. 2015, 126, 2157–2162. [Google Scholar] [CrossRef]
  16. Leal, N.; Leal, E.; German, S.-T. A linear programming approach for 3D point cloud simplification. IAENG Int. J. Comput. Sci. 2017, 44, 60–67. [Google Scholar]
  17. Yuan, X.; Wu, L.; Chen, H. Feature preserving point cloud simplification. Opt. Precis. Eng. 2015, 23, 2666–2676. [Google Scholar] [CrossRef]
  18. Markovic, V.; Jakovljevic, Z.; Miljkovic, Z. Feature sensitive three-dimensional point cloud simplification using support vector regression. Teh. Vjesn. 2019, 26, 985–994. [Google Scholar] [CrossRef] [Green Version]
  19. Ding, X.; Lin, W.; Chen, Z.; Zhang, X. Point Cloud Saliency Detection by Local and Global Feature Fusion. IEEE Trans. Image Process. 2019, 28, 5379–5393. [Google Scholar] [CrossRef]
  20. Zhang, K.; Qiao, S.; Wang, X.; Yang, Y.; Zhang, Y. Feature-Preserved Point Cloud Simplification Based on Natural Quadric Shape Models. Appl. Sci. 2019, 9, 2130. [Google Scholar] [CrossRef] [Green Version]
  21. Zhu, L.L.; Kukko, A.; Virtanen, J.P.; Hyyppa, J.; Kaartinen, H.; Hyyppa, H.; Turppa, T. Multisource Point Clouds, Point Simplification and Surface Reconstruction. Remote Sens. 2019, 11, 2659. [Google Scholar] [CrossRef] [Green Version]
  22. Tian, D.; Ochimizu, H.; Feng, C.; Cohen, R.; Vetro, A. Geometric distortion metrics for point cloud compression. In Proceedings of the 2017 IEEE International Conference on Image Processing (ICIP), Beijing, China, 17–20 September 2017; pp. 3460–3464. [Google Scholar]
  23. Pan, Y.; Dong, Y.; Wang, D.; Chen, A.; Ye, Z. Three-Dimensional Reconstruction of Structural Surface Model of Heritage Bridges Using UAV-Based Photogrammetric Point Clouds. Remote Sens. 2019, 11, 1204. [Google Scholar] [CrossRef] [Green Version]
  24. Xiaoyi, L.; Ting, Y.; Lianfeng, X.; Qiangfa, X.; Lin, C. Effective Feature Extraction and Identification Method Based on Tree Laser Point Cloud. Chin. J. Lasers 2019, 5, 0510002. [Google Scholar] [CrossRef]
  25. Nan, Y.; Zhang, H.; Zheng, J.; Yang, K.; Ge, Y. Low-volume precision spray for plant pest control using profile variable rate spraying and ultrasonic detection. Front. Plant Sci. 2022, 13, 1042769. [Google Scholar] [CrossRef] [PubMed]
  26. Rusu, R.B.; Blodow, N.; Beetz, M. Fast Point Feature Histograms (FPFH) for 3D registration. In Proceedings of the 2009 IEEE International Conference on Robotics and Automation, Kobe, Japan, 12–17 May 2009; pp. 3212–3217. [Google Scholar]
  27. Rusu, R.B.; Blodow, N.; Marton, Z.C.; Beetz, M. Aligning point cloud views using persistent feature histograms. In Proceedings of the 2008 IEEE/RSJ International Conference on Intelligent Robots and Systems, Nice, France, 22–26 September 2008; pp. 3384–3391. [Google Scholar]
  28. Zhao, M.; Cao, L.; Song, T.; Liu, S.; Luo, Y.; Yang, X. Independent Method for Selecting Radius of FPFH Neighborhood in 3D Point Cloud Registration. Laser Optoelectron. Prog. 2021, 58, 610002. [Google Scholar] [CrossRef]
  29. Shannon, C.E. A mathematical theory of communication. Bell Syst. Tech. J. 1948, 27, 623–656. [Google Scholar] [CrossRef]
  30. Corsini, M.; Cignoni, P.; Scopigno, R. Efficient and Flexible Sampling with Blue Noise Properties of Triangular Meshes. IEEE Trans. Vis. Comput. Graph. 2012, 18, 914–924. [Google Scholar] [CrossRef] [Green Version]
  31. Cignoni, P.; Rocchini, C.; Scopigno, R. Metro: Measuring Error on Simplified Surfaces. Comput. Graph. Forum 1998, 17, 167–174. [Google Scholar] [CrossRef] [Green Version]
  32. Miao, Y.; Pajarola, R.; Feng, J. Curvature-aware adaptive re-sampling for point-sampled geometry. Comput.-Aided Des. 2009, 41, 395–403. [Google Scholar] [CrossRef]
  33. Demantké, J.; Mallet, C.; David, N.; Vallet, B. Dimensionality based scale selection in 3d lidar point clouds. ISPRS Int. Arch. Photogramm. Remote Sens. Spat. Inf. Sci. 2012, 3812, 97–102. [Google Scholar] [CrossRef] [Green Version]
  34. Weinmann, M.; Jutzi, B.; Hinz, S.; Mallet, C. Semantic point cloud interpretation based on optimal neighborhoods, relevant features and efficient classifiers. ISPRS J. Photogramm. Remote Sens. 2015, 105, 286–304. [Google Scholar] [CrossRef]
Figure 1. Fitting surface and local coordinate system.
Forests 14 01507 g001
Figure 2. FPFH query domain.
Forests 14 01507 g002
Figure 3. Variation of FPFH features for different search neighborhoods.
Forests 14 01507 g003
Figure 4. Point cloud of hand and bunny with key points of FPFH entropy extraction. (a) Hand. (b) Hand with 10% maximum information entropy of points. (c) Bunny. (d) Bunny with 10% maximum information entropy of points.
Forests 14 01507 g004
Figure 5. Convergence curve of the objective function.
Forests 14 01507 g005
Figure 6. Point cloud data for testing (Colored with height). (a) Dataset 1. (b) Dataset 2.
Forests 14 01507 g006
Figure 7. Comparison of the simplification effects of the four methods at different Sr. (a) The variation curve of Hd with Sr. (b) The variation curve of Md with Sr. (c) The variation curve of RMS with Sr. (d) The variation curve of Ar with Sr.
Forests 14 01507 g007
Figure 8. Triangular meshing results for different Sr. (a) Triangular meshing results for Sr = 80%. (b) Triangular meshing results for Sr = 20%.
Forests 14 01507 g008
Table 1. Comparison of visual effects of simplification results.
Method
PSSpaceCurvatureProposed
Sr = 20%Forests 14 01507 i001Forests 14 01507 i002Forests 14 01507 i003Forests 14 01507 i004
Forests 14 01507 i005Forests 14 01507 i006Forests 14 01507 i007Forests 14 01507 i008
Sr = 80%Forests 14 01507 i009Forests 14 01507 i010Forests 14 01507 i011Forests 14 01507 i012
Forests 14 01507 i013Forests 14 01507 i014Forests 14 01507 i015Forests 14 01507 i016
Table 2. Comparison of errors under different Sr in Meshlab.
MethodSr = 20%Sr = 50%Sr = 80%
PSForests 14 01507 i017Forests 14 01507 i018Forests 14 01507 i019
ProposedForests 14 01507 i020Forests 14 01507 i021Forests 14 01507 i022
SpaceForests 14 01507 i023Forests 14 01507 i024Forests 14 01507 i025
CurvatureForests 14 01507 i026Forests 14 01507 i027Forests 14 01507 i028
Disclaimer/Publisher’s Note: The statements, opinions and data contained in all publications are solely those of the individual author(s) and contributor(s) and not of MDPI and/or the editor(s). MDPI and/or the editor(s) disclaim responsibility for any injury to people or property resulting from any ideas, methods, instructions or products referred to in the content.

