Abstract
Identifying the main climatic controls of productivity differences in different forest ecosystems is beneficial for revealing the patterns of carbon cycle changes in terrestrial ecosystems. Moreover, exploring the differences in their productivity responses to temperature and precipitation at interannual and inter-monthly scales is conducive to identifying the mechanisms of carbon cycle changes in forest ecosystems, which can enhance the study of the forest ecosystem carbon cycle. In addition, the effect of climate factor changes on the net primary productivity (NPP) of typical forest types in subtropical areas remains unclear. Here, we simulated the dynamic changes in the NPP of four typical forest types (evergreen needleleaf forest (ENF), evergreen broadleaf forest (EBF), bamboo forest (BF), and evergreen needleleaf–broadleaf mixed forest (ENBMF)) in the Poyang Lake Basin from 1970 to 2021 using the Biome-BGC model where its parameters were adjusted according to the ecophysiological characteristics of forest types in this study. Then, the correlation between the NPP of the four typical forest types and climate factors was examined at interannual and inter-monthly scales; the response of the NPP of four typical forest types to future temperature and precipitation changes was explored. The results revealed that NPP showed a fluctuating downward trend after 2000 in ENF, EBF, and ENBMF. The NPP of the ENF was primarily driven by precipitation at the interannual and inter-monthly levels (p < 0.01). The impact of precipitation and accumulated temperature (AT) on NPP of EBF is not significant interannually; the NPP of BF demonstrated a minor correlation with AT and no significant correlation with precipitation. However, the NPP variation of EBF and BF was significantly affected by the temperature at the inter-monthly scale (p < 0.01), with R2 of 0.85 and 0.92, respectively. At the interannual scale, the NPP of ENBMF was mainly driven by precipitation (p < 0.01); at the inter-monthly scale, it was driven by precipitation (p < 0.01) and AT (p < 0.01), with R2 of 0.74 and 0.62, respectively. Under designed climate scenarios, the precipitation changes will have a greater impact on NPP of ENF; the NPP changes in the EBF, BF, and ENBMF will be mainly controlled by temperature increase, and only a 10% change in precipitation leads to its smaller impact on their NPP changes.
1. Introduction
Terrestrial ecosystems are significant carbon dioxide (CO2) sinks that absorbed approximately 30% of the anthropogenic CO2 emissions between 2010 and 2019 [1,2]. About two-thirds of the carbon in terrestrial ecosystems is fixed by forest ecosystems, which play a vital role in the global carbon cycle as the mainstay body of terrestrial ecosystems [3,4]. Net primary productivity (NPP) is a core component of the ecosystem carbon cycle and one of the critical indicators of ecosystem function [5]. NPP represents the capacity of vegetation to absorb atmospheric CO2 and is vital in the global carbon cycle [6].
IPCC AR6 indicates that the global mean surface air temperature (GSAT) will rise by 0.2–4.8 °C, and precipitation will change by −0.2%–12.9% [7]. Extreme climate changes affect the carbon cycle of terrestrial ecosystems [8]. For example, sustained climate warming affects terrestrial NPP directly by altering the carbon uptake capacity of leaves and indirectly affects the dynamics of vegetation NPP by altering soil water availability and extending the growing season [9]. However, the response of NPP to climate factors varies across vegetation types and geographic locations, contributing to the uncertainty in global forest carbon balance assessments under climate change [10,11,12]. Hence, in the context of climate change, the effects of temperature and precipitation on NPP of different forest types are worth discussing.
Subtropical forests in the East Asian monsoon region have a high CO2 absorption capacity, which has an important impact on the current global carbon cycle [13]. The Poyang Lake Basin has a comprehensive watershed system of “mountain-river-lake” and special climatic, geomorphological, and hydrological characteristics, highly representative of the humid regions in China [14]. The basin has abundant water, heat conditions, and diverse forest types (including evergreen needleleaf forest (ENF), evergreen broadleaf forest (EBF), bamboo forest (BF), and evergreen needleleaf–broadleaf mixed forest (ENBMF)); however, temperature and precipitation vary significantly on inter-month scales. To date, few studies have been conducted on the NPP of forest ecosystems in the Poyang Lake Basin at an interannual scale; studies have been based on the spatial heterogeneity of NPP [14] and short-term simulation of the NPP of a single forest type [15,16]. However, the mechanisms underlying carbon cycle changes in forest ecosystems in subtropical regions remain unclear. Notably, the patterns of NPP variability on inter-monthly scales over multi-year in typical forest ecosystems of the area and the relationship between NPP and climatic factors at interannual and inter-monthly scales require further study. In addition, the different responses of NPP to climatic factors in the context of future climate warming require further exploration. Therefore, identifying long-term interannual and inter-monthly trends of NPPs in typical forest types in the region and exploring the different responses of their NPPs to climate factors at interannual and inter-monthly scales are conducive to revealing the patterns of carbon balance changes in forest ecosystems in the region, which can enrich the study of carbon cycling in forest ecosystems in the subtropical region.
Ecological process models can quantitatively describe the role of changes in different factors, such as vegetation physiological parameters and climate factors, on forest NPP and can predict forest ecosystem carbon fluxes by simulating future climate change [17,18,19,20]. However, model parameters can be localized and corrected by field sampling and field measurements of NPP, simulating long-term NPP more accurately [21,22]. The common remote sensing data estimation of NPP is mainly for a large area, and the estimation of NPP at the site scale is not very accurate; the inventory method is limited by the discontinuity of the measured data which is difficult to reveal the NPP change pattern and make the scenario prediction of NPP. The Biome-BGC model is highly representative of ecological process models, with a time step of daily, which has the characteristics of high simulation accuracy, good extensibility, and flexible simulation time and is currently extensively used in terrestrial ecosystem carbon cycle research [23,24,25]. Therefore, it is more applicable to simulate the long-time series NPP of different forest types by using the Biome-BGC model at the site scale.
In this study, the Biome-BGC model was employed to simulate the interannual and inter-monthly variation in NPP in four typical forest types (ENF, EBF, BF, and ENBMF) in the Poyang Lake Basin in the subtropical region. The correlations between the NPP, temperature, and precipitation of different forest types were explored at two time scales (interannual and inter-monthly), and the changes in the NPP of different forest types were predicted under future warming, precipitation, and combined scenarios. The objectives of this study were (1) to reveal the differences in temporal variability (especially at inter-monthly scales) of NPP among typical forest types in the region, (2) to reveal the differences in the level of NPP response to AT and precipitation at interannual and inter-monthly scales among forest types, and (3) to quantitatively assess the differences in NPP responses to future climate factors among the four typical forest types.
2. Materials and Methods
2.1. Study Area and Study Sites
The Poyang Lake Basin is located in the southeast of the middle and lower reaches of the Yangtze River (Figure 1), surrounded by mountains on three sides and forming an integrated watershed system of “mountain-river-lake”. Its unique climatic, geomorphological, and hydrological characteristics represent the subtropical region of China [14]. The total area of the Poyang Lake Basin is 162,225 km2, which consists of five sub-basins, namely Xiushui, Ganjiang, Fuhe, Xinjiang and Raohe, and the Poyang Lake area [26].
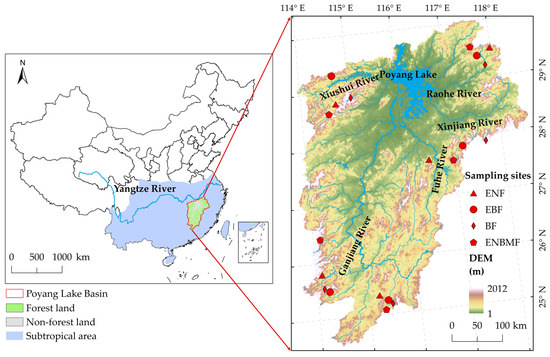
Figure 1.
Location of Poyang Lake Basin and sampling sites. DEM, digital elevation model; ENF, evergreen needleleaf forest; EBF, evergreen broadleaf forest; BF, bamboo forest; ENBMF, evergreen needleleaf–broadleaf mixed forest.
Poyang Lake Basin is a typical humid basin with a subtropical monsoon climate, an average annual temperature of 18 °C, and an average annual precipitation of 1680 mm [27]; the coldest month in the region is January, with an average temperature of 6.4 °C, and the warmest month is July, with an average temperature of 28.9 °C. Based on the abundant water and heat conditions, the forest types in the Poyang Lake Basin are diverse, and EBF is a zonal vegetation type. Owing to variations in latitude and elevation, forest types such as evergreen and deciduous broadleaf mixed forests, needleleaf and broadleaf mixed forests, and cold-temperate evergreen needleleaf forests are interspersed in the region. In addition, from the 1950s to the 1970s, the region suffered three severe deforestation events, and the forest cover decreased to 33.1% in 1978 [27]. Since the 1990s, local governments have gradually increased the forest cover of the basin through a series of ecological measures, such as artificial planting, air seeding of horsetail pine, and vigorous development of the BF industry [26,28]. Currently, the main vegetation types in the region include evergreen needleleaf, evergreen broadleaf, bamboo, and mixed forest. Among them, the dominants of ENF are the Pinus massoniana forest and Cunninghamia lanceolata forest; the dominants of EBF are the Castanopsis sclerophylla forest, Castanopsis fargesii forest, Machilus thunbergii forest, and Schima superba Gardner & Champ. forest; the dominant of BF is the Phyllostachys pubescens forest; the dominants of ENBMF are the mixed forest of Pinus massoniana forest, Cunninghamia lanceolata forest and many kinds of broadleaved trees.
There were five groups of sample sites, each with four typical forest types (ENF, EBF, BF, and ENBMF); the sample sites were 20 in total. Five groups of sample sites were distributed in the main mountain ranges of the basin uniformly throughout the Poyang Lake Basin and each sub-basin, representing typical forest communities in the Poyang Lake Basin. All sample sites were located in the typical forest communities in the region, and each site was located in a continuous forest without any human interference. The sites tended to be uniform, contributing to the study of NPP response to AT and precipitation in different forest types.
2.2. Model Description and Parameterization
2.2.1. Model Description
The Biome-BGC V4.2 model (developed at the University of Montana) is a biogeochemical model that estimates carbon, nitrogen, and water storage and fluxes in terrestrial ecosystems [29]. NPP was calculated by subtracting autotrophic respiration from gross primary production (GPP), according to the Farquhar photosynthesis procedure [30]. Autotrophic respiration is involved in maintenance and growth. Maintenance respiration was calculated as a function of the tissue nitrogen concentration [31,32]. Growth respiration is a function of the amount of carbon assigned to different plant compartments (leaves, roots, and stems) [33].
The input parameters of the model were divided into three types, (1) simulated site information, including latitude, longitude, elevation, soil depth, soil texture, interannual variation in atmospheric CO2 concentration, and vegetation type, (2) meteorological data in steps of days, including daily maximum temperature, daily minimum temperature, daily average temperature, daily precipitation, daily water vapor pressure difference, and daily solar radiation, and (3) 44 physiological ecological parameters which define the ecophysiological characteristics of the different vegetation types being simulated, including C: N of leaves, C: N of fine roots, maximum stomatal conductance, canopy light extinction coefficient, canopy average specific leaf area, and the fraction of leaf N in Rubisco et cetera.
2.2.2. Site Characteristics
The simulated site information included site elevation, longitude, latitude, slope, slope direction, effective soil depth, and soil texture (sand, loam, and clay content). Site data and vegetation samples were obtained from field sampling and field measurements during the 2022 vegetation growing season (July–September). The laser particle size meter was adopted to measure the soil texture.
2.2.3. Meteorological Data
Seven daily meteorological factors were required to drive the model: maximum temperature, minimum temperature, average temperature, precipitation, average daily vapor pressure deficit (VPD), average solar shortwave radiation, and day length. Maximum and minimum temperatures and precipitation data were obtained from the ERA5-Land reanalysis dataset. This dataset includes dynamic data at hourly, monthly, and annual scales, characterizing 50 indicators of temperature, precipitation, evapotranspiration and runoff, wind speed, and vegetation; in addition, it accurately describes past climate conditions [19]. For each sample point, the daily maximum temperature, minimum temperature, and precipitation history data of the corresponding grid point were extracted according to latitude and longitude. The four meteorological factors of the daily average temperature, average daily VPD, average solar shortwave radiation, and day length were calculated using the MTCLIM 43 model based on the measured daily maximum and minimum temperatures and precipitations [34,35]. Historical CO2 concentration data were obtained from the observational dataset of the Mauna Loa Observatory, Hawaii, USA (https://gml.noaa.gov/obop/mlo/, accessed on 21 May 2023).
2.2.4. Ecophysiological Parameters
Vegetation physiological parameters are the data describing the ecophysiological characteristics of vegetation in the model, which has 43 input physiological parameters. Table S1 summarizes the physiological parameters of the four vegetation types in this research. We conducted field measurements of physiological parameters that significantly affect vegetation NPP, such as the C: N of leaves and fine roots and canopy average specific leaf area (SLA). The SLA was calculated as the ratio of the field-sampled scanned leaf area to the dry weight of the leaves after drying. The carbon and nitrogen contents of the plants were measured using a SmartChem 2000 automated analyzer. The new fine root C: new leaf C and canopy water interception coefficient of EBF were set to 1.2 and 0.01, respectively, with reference to the study by Ichii et al. [36]; the canopy light extinction coefficient was according to the study by Huang et al. [37], and the maximum stomatal conductance was from the study by Kelliher et al. [38]. The annual leaf and fine root turnover fractions of BF were obtained from the study by Mao et al. [39]. The default parameters obtained from the study by White et al. [40] were used for other parameters.
The Biome-BGC model did not provide physiological parameters for the mixed forests; therefore, by the method of Kang et al. [41], we used the physiological parameters of EBF and ENF to simulate them separately and then converted them according to the proportion of EBF and ENF at this sample site to obtain the NPP of ENBMF.
2.3. Modeling Procedures
In this paper, we adopted the Biome-BGC v4.2 model to simulate the NPP of four typical vegetation types. Generally, this is preceded by an initialization simulation in which the model achieves equilibrium (i.e., the carbon input and output are balanced) in local ecoclimatic conditions through a spin-up phase [40]; the formal simulation phase of the model uses the carbon/nitrogen state variable initialization parameter output from the spin-up phase.
2.4. Climate Scenarios
According to IPCC AR6, compared to 1995–2014, the GSAT during 2081–2100 varies from 0.2 to 4.8 °C under different scenarios, and precipitation varies from −0.2 to 12.9% [7]. Under Shared Socioeconomic Pathways (SSPs), the range of temperature change in the study area will be 1.1–5.9 °C and precipitation change will be 4.1%–11.2% by 2100 compared to the base period (1995–2014) [42]. In this study, three scenarios, namely, warming, precipitation, and their combination, were set according to the amplitude of temperature and precipitation variation globally and in the study area, as shown in Table 1.

Table 1.
Future climatic scenarios design.
2.5. Field-Based Estimation of NPP
Based on empirical field survey data, this research used a biomass regression model as an estimation method for forest biomass calculations [43] with the following equation:
where B is the biomass of the forest type. DBH is the diameter of the tree trunk at 1.3 m; H is the height of the tree, and a and b are parameters of the different tree species in the model.
BF biomass was calculated as follows [44]:
where B is the aboveground biomass of the bamboo. DBH is the diameter at the breast height of the bamboo.
Forest carbon stock is the biomass of each tree species multiplied by its carbon content factor, and the average annual NPP is the carbon stock divided by the average tree age.
2.6. Statistical Analysis
The relationship between forest productivity and its influencing factors is an interesting research direction for academia [45]. In this study, simple linear fits between NPP, temperature, and precipitation were analyzed for the four forest types at inter-month and interannual scales. The vegetation in the subtropics has a temperature-loving characteristic, and most vegetation can grow actively when the average daily temperature rises steadily above 10 degrees C. Therefore, the correlation between vegetation productivity and temperature can be explored more appropriately by using ≥10 degrees C accumulated temperature (AT). All statistical analyses were performed using SPSS 23.
3. Results
3.1. Model Validation
Overall, the NPPs simulated by the model matched those measured at the site (Figure 2) with an RMSE of 78.38 g C m−2, indicating that the model better simulates forest NPP after parameter localization.
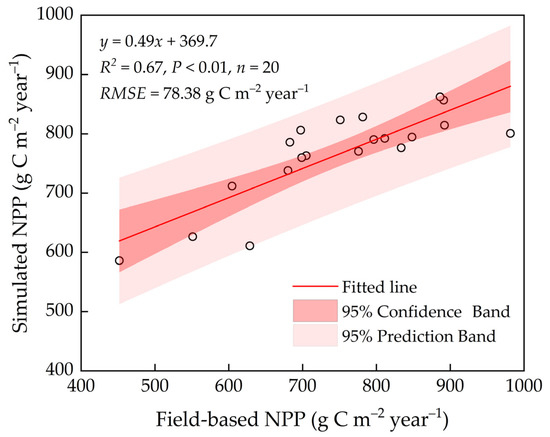
Figure 2.
Comparison between simulated NPP and field-based NPP in 20 sampling sites.
As shown in Table 2, the simulated forest NPP range was similar to the results of other studies. The simulated NPP of ENF was in the range of 234.27–1031.3 g C m−2 year−1, however, the previous study indicated a relatively small range, with a range of 262.93–906.42 g C m−2 year−1. The simulated minimum value of NPP in the EBF was slightly lower than that reported in other studies; the simulated maximum value of NPP in the BF was similar to the results of other studies, and the minimum value was slightly lower. The simulated NPP of ENBMF was very close to that of the neighboring provinces.
Table 2.
Comparison of the annual NPPs among typical forest types in subtropical China.
3.2. NPP Changes in Four Typical Forest Types
3.2.1. Interannual Variation of NPP
Figure 3 shows the interannual NPP trends for the four typical forest types from 1970 to 2021. Among them, the NPP of ENF and ENBMF exhibited a more significant fluctuation trend, and their NPP fluctuations were in the range of 487.15–873.59 g C m−2 year−1 and 623.09–895.22 g C m−2 year−1, respectively. The NPP fluctuation trend was minute in EBF and BF, and their NPP ranges were 711.36–908.18 g C m−2 year−1 and 725.72–861.12 g C m−2 year−1, respectively. The average annual NPP in the four typical forest types was ranked as EBF (838.25 g C m−2 year−1) > BF (795.29 g C m−2 year−1)~ENBMF (790.1 g C m−2 year−1) > ENF (707.75 g C m−2 year−1). Regarding the time series, the trend of interannual NPP fluctuations in ENF, EBF, and ENBMF increased after 2001, and there was a significant downward trend in interannual NPP. However, the ≥10 degrees C AT increased significantly during this period, and precipitation decreased significantly. In contrast, the carbon use efficiency of BF did not decrease significantly compared to the other types owing to the overall low AT level and high precipitation level. Furthermore, the variation curves of NPP in ENF and ENBMF were similar to the precipitation variation curves at the interannual scale, and they had a slightly opposite trend to AT variation in some stages.
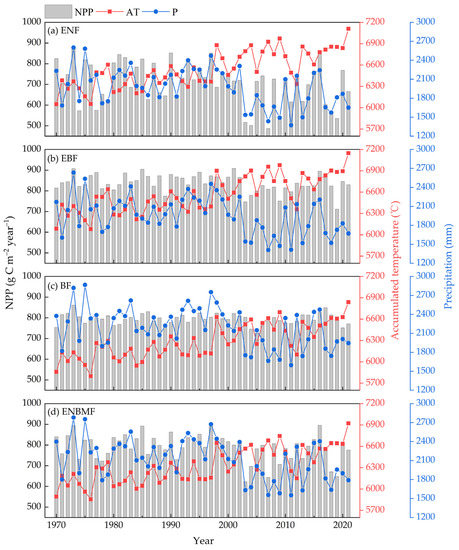
Figure 3.
Interannual variation of NPP in four typical forest types, ≥10 degrees C AT, and precipitation. AT, accumulated temperature; P, precipitation; the same as below.
3.2.2. Inter-Month Variation of NPP
Figure 4 shows the average inter-monthly variation in NPP over 52 years for the four typical forest types. The highest NPP in the ENF and ENBMF was in May, April, and June, with the monthly NPP ranging from 70 to 90 g C m−2 month−1. It should be noted that the NPP variation curves of the two forest types were consistent with the precipitation curves. The highest NPP in EBF and BF was from April to October, with monthly NPP ranging from 70 to 90 g C m−2 month−1 and 75 to 95 g C m−2 month−1, respectively. During this period, precipitation decreases rapidly after June, and the AT is at its highest value in a year; NPP does not decline with precipitation, and the inter-month NPP curves of these two forest types are similar to the ≥10 degrees C AT curves. Moreover, the NPP of the four forest types reached approximately 40 g C m−2 month−1 in January, February, and December due to the relatively abundant hydrothermal conditions in the Poyang Lake Basin.
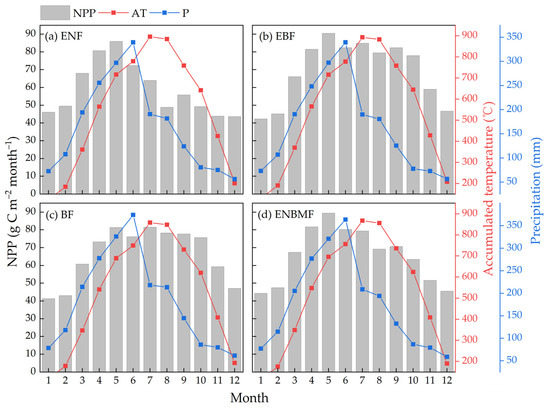
Figure 4.
Inter-monthly variation of NPP in four typical forest types, ≥10 degrees C AT and precipitation.
3.3. Correlation between NPP and Climate Factors
3.3.1. Correlations between NPP and Climate Factors on Interannual Scales
In the EBF and ENBMF, NPP exhibited a relatively significant (p < 0.01) positive correlation with precipitation (Figure 5a,d), with R2 of 0.33, which is consistent with the similarity of the interannual variation curves of NPP with precipitation for both types (Figure 3a,d). The NPP of ENF increased significantly with increasing precipitation, and the NPP of ENBMF increased slowly with increasing precipitation. In this region, the effect of precipitation on NPP accumulation is not major in the EBF. Meanwhile, the correlation between NPP and precipitation is not significant in the BF.
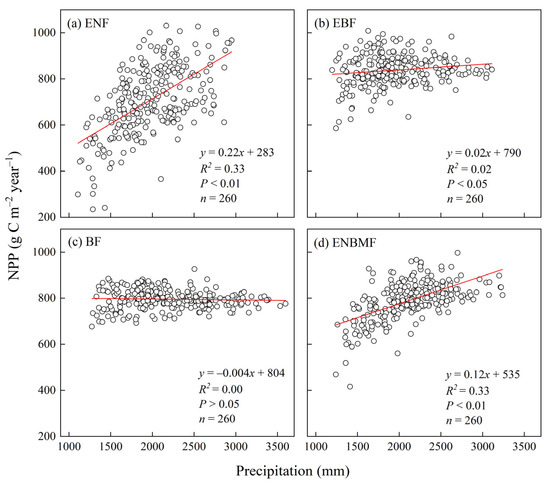
Figure 5.
Interannual fitting of NPP and precipitation in four typical forest types.
There was a negative correlation between NPP and AT in ENF, EBF, and ENBMF (Figure 6a,b,d), i.e., NPP decreased with increasing AT. Among the forest types, the NPP of ENF exhibited a significant decreasing trend with decreasing AT, especially when AT > 6660 degrees C year−1; the fitted relationship between NPP and AT was significantly enhanced (R2 = 0.23), i.e., the trend of decreasing NPP with the increasing AT was significantly enhanced. However, the NPP of the EBF and ENBMF slowly decreased with increasing AT; the NPP of BF exhibited a positive correlation with AT, i.e., the NPP of BF decreased slowly with increasing AT. The trend of increase in the NPP of BF with increasing AT was significantly enhanced when the AT was not abundant in the current year (AT < 6030 degrees C year−1) (Figure 6c).
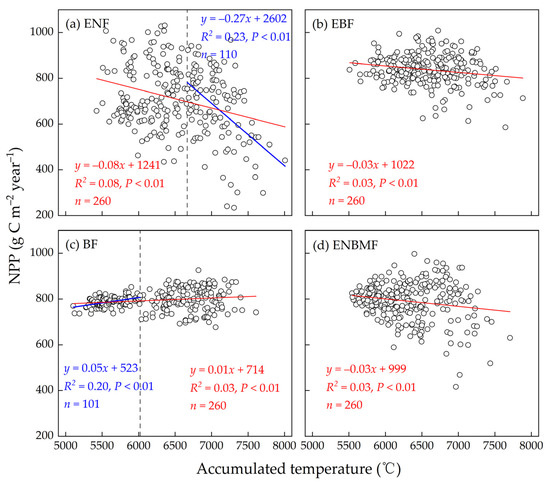
Figure 6.
Interannual fitting of NPP and ≥10 degrees C AT in the four typical forest types.
In conclusion, the fitted relationship between NPP, precipitation, and AT at the interannual level is not apparent, which could be due to the fluctuating tendency of precipitation and AT with monthly change (Figure 4), significantly affecting the change in forest NPP at the inter-monthly scale. Therefore, the timescale must be extended to an inter-monthly level to gain insight into the correlation between NPP and climatic factors.
3.3.2. Correlations between NPP and Climate Factors on an Inter-Monthly Scale
On a monthly scale, NPP in ENF demonstrated a strong fit with precipitation (R2 = 0.78, p < 0.01) (Figure 7a) and did not elicit a significant correlation with AT (Figure 8a), indicating that NPP in ENF was primarily dominated by precipitation variation at the inter-month scale. The NPP of the EBF was driven by AT (R2 = 0.85, p < 0.01); it demonstrated a correlation with precipitation (R2 = 0.44, p < 0.05). The relationships between NPP, AT, and precipitation in the BF were similar to those in the EBF. The NPP in the ENBMF was driven by AT and precipitation on an inter-monthly scale (Figure 7d and Figure 8d).
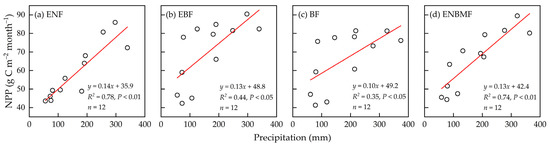
Figure 7.
Fitting of mean monthly NPP and precipitation from 1970 to 2021 in the four typical forest types.
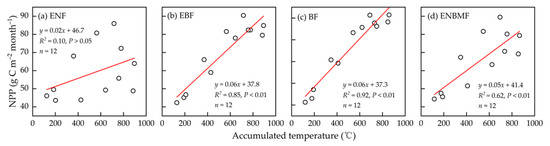
Figure 8.
Fitting of mean monthly NPP and ≥10 degrees C AT from 1970 to 2021 in the four typical forest types.
3.4. Simulation of NPP under Future Climate Change Scenarios
The changes in the NPP of the four typical vegetation types under the warming, precipitation, and combined scenarios relative to the normal conditions are shown in Figure 9. Warming scenarios (T1P0, T3P0, T6P0): The NPP of all four typical forest types increased to different degrees under the T1P0 scenario. Among them, the NPP of EBF and BF increased significantly; in the T3P0 scenario, the NPP of all forest types except ENF increased to different degrees. In the T6P0 scenario, the NPP of all three forest types except BF decreased significantly, with a decrease of 13.8%, 8.3%, and 6.7%.
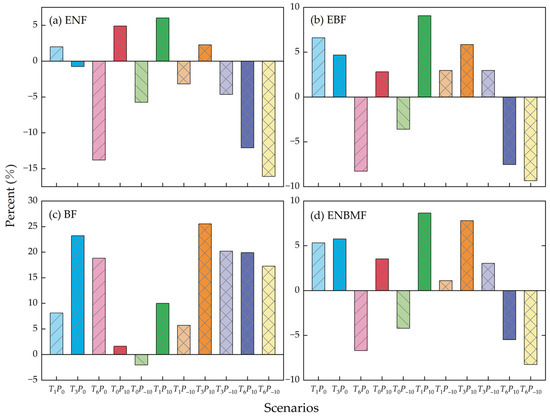
Figure 9.
Changes in NPP of the four typical forest types under climate change scenarios. The histograms represent the mean values of [(Scenarioi − T0P0)/T0P0] × 100 for the years studied.
Precipitation scenarios (T0P10, T0P−10): In the T0P10 scenario (i.e., a 10% increase in precipitation), there was an increase in the NPP of four typical forest types; the NPP in the T0P−10 scenario (i.e., a 10% decrease in precipitation), showed a decreasing trend (Figure 9). The NPP of BF demonstrated a minor effect on the precipitation scenario, and the NPP of the other three forest types responded relatively more to the precipitation scenarios.
Combined scenarios (T1P10, T1P−10, T3P10, T3P−10, T6P10, T6P−10): In the T1P10, T1P−10 scenarios (i.e., a 1 °C temperature increase and a 10% increase or decrease in precipitation), the NPP of EBF, BF, and ENBMF demonstrated an increasing trend (Figure 9b–d). However, when precipitation decreased by 10%, the NPP of the ENF decreased significantly (Figure 9a). The NPP of the four forest types showed similar changes in the T3P10 and T3P−10 scenarios as those in the T1P10 and T1P−10 scenarios; the NPP of the BF increased significantly under T3P10, T3P−10 scenarios compared to T1P10, T1P−10 scenarios. The NPP of the other three forest types decreased under the T3P10 scenario compared to the T1P10 scenario, and NPP decreased under T3P−10 scenario compared to T1P−10 scenario. In addition, except for the BF, the NPP of the other three forest types decreased significantly under the T6P10, T6P−10 scenarios (i.e., a 6 °C rise of temperature and a 10% increase or decrease in precipitation).
4. Discussion
4.1. Uncertainty of NPP Simulations
The simulated NPP is close to the measured NPP, but not exactly equal (Figure 2); this may be due to the model’s shortcomings in the lack of parameters specific to subtropical forests. Although field measurements of some parameters were conducted in this study, some errors were due to region-specific environmental effects. In addition, the model had some errors in simulating the interannual scale NPP due to the lack of necessary flux towers.
There are few studies on NPP estimation of diverse forest types in the Poyang Lake Basin; meanwhile, we have summarized the NPP estimation results for the study area and adjacent subtropical forest areas (Table 2). The results show that the ranges of the highest and lowest values of the NPP simulations of ENF are slightly larger than those of Ma et al. [15] and Zeng et al. [16] for the Poyang Lake Basin; this may be because their study site was located in the middle of the Poyang Lake Basin, in other words, the hydrothermal conditions were slightly lower than those in the south and higher than those in the north. Second, their studies have a smaller number of study sites and a shorter study period than those of this study. The multiyear average NPPs of EBF and BF in this study were 838 g C m−2 year−1 and 795 g C m−2 year−1, respectively, which were higher than the simulated NPPs in adjacent provinces [46]. However, the multiyear NPP range of the EBF was similar to the NPP range of the EBF simulated by Feng et al. [47] in the same region in 2001. Furthermore, the NPP of BF was similar to that reported by Chen et al. [46] in a subtropical region. In addition, the NPP of the ENBMF ranged from 415.95 to 997.15 g C m−2 year−1, with a multiyear mean of 790.07 g C m−2 year−1. This result is consistent with the NPP of 784.5 g C m−2 year−1 simulated by Zhang et al. [49] for adjacent provinces. In summary, the simulated NPP range was similar to the results of adjacent subtropical forest areas. Therefore, the simulated NPP results in this study have some credibility.
4.2. Applicability of Dynamic Analysis of Forest NPP at the Site Scale
Without considering the localization of vegetation physiological parameters at the site scale and field measurements of NPP, it is difficult to accurately reveal the patterns of NPP variation and its response relationships with climate factors. However, several studies have used remote sensing data to simulate and analyze NPP variation patterns over large areas, and the spatial resolution of remote sensing data can reach the grid scale. Notably, there are few studies on the dynamics of NPP in the four typical forest ecosystems in subtropical China [13]. Moreover, remote sensing data are susceptible to spatial identification accuracy, which makes it difficult to accurately reveal interannual and inter-monthly differences in NPP responses to climate factors in different forest types in the region.
At the interannual scale, precipitation significantly affects NPP variation of the ENF; at the inter-monthly scale, the influence of precipitation on NPP was more significant than that of AT; the results agree with those of Zeng et al. [16] for the Poyang Lake Basin based on multiyear empirical data. Furthermore, this indirectly confirms the reliability of the results of this study; prior to this study, the NPP response to climatic factors of the other three typical forest types (i.e., EBF, BF, and ENBMF) in the Poyang Lake Basin was yet to be revealed. Our study showed that AT mainly dominated the NPP of the EBF and BF at the inter-monthly scale, and the NPP of the ENBMF was driven by AT and precipitation at the inter-monthly scale (Figure 7d and Figure 8d).
4.3. Interannual and Inter-Monthly Variation of NPP
The NPP of ENF, EBF, and ENBMF showed a trend of fluctuating decline after 2000, especially ENF (Figure 3a). Simultaneously, we discovered a trend of fluctuating decreasing precipitation curves and increasing AT during this period, which could lead to enhanced autotrophic respiration and decreased carbon use efficiency of vegetation; this is consistent with the frequent occurrence of extreme and flash droughts over the last 20 years. These climatic phenomena can significantly decrease vegetation productivity [50,51]. In addition, the increasing age of the forests in the sample site area may also have contributed to the different degrees of decline in forest NPP. We discovered that NPP changes in forests followed precipitation changes, especially in the ENF and ENBMF, and the change curve of NPP was almost the same as the precipitation curve, a result similar to those of Zhang et al. [52] and Fang et al. [53]. Notably, their results indicated a strong correlation between the NPP and precipitation in subtropical China [53]. The fluctuation in NPP declined after 2010; however, NPP increased compared to 2000–2010, primarily due to the fluctuating decrease in AT and the relative increase in precipitation in the region during this period. This corresponds to the findings of Chen et al. [54], who reported that the NPP of Chinese vegetation increased after 2010 due to climate change. In addition, the fluctuation in NPP in BF was relatively small compared to that in other forest types; this may be due to the uncertainty resulting from the selection of the study sample sites. Individual BF sample sites were located in areas with lower AT than those in other sample sites, avoiding decreased productivity due to frequent droughts.
On an inter-monthly scale, the highest NPP in the ENF was from April to June, with a significant decreasing trend in July and August (Figure 4a), which is consistent with the conclusion of inter-monthly trends in the ENF NPP derived by Xie et al. [55] in the Hengyang–Shaoguan Basin in the subtropical region. Notably, this is because the April–June period is between the spring and summer when precipitation is most abundant. The is a strong correlation between NPP and precipitation in the ENF in subtropical regions, while AT has not reached its annual peak (Figure 4a), resulting in fewer drought conditions. The NPP trends in the ENBMF and ENF were similar. The highest NPP in EBF and BF occurred from May to July, consistent with the findings of Kang et al. [56]. However, that study showed that the NPP from August to October was significantly lower than that from May to July, and the average NPP from August to October in this study over 52 years was slightly lower than that from May to July; this may be because the study years (2003, 2008, 2014, and 2014) were primarily within the last two decades, and extreme droughts from July to October have been more frequent in recent years, decreasing vegetation productivity in these months [51]. The NPP of each forest type reached 40 g C m−2 year−1 in winter (December, January, and February), which corresponds to the results of Kang et al. [56] and Xie et al. [55].
4.4. Correlation between NPP and AT and Precipitation
Ji et al. [57] showed that changes in forest NPP in China are primarily driven by changes in precipitation. However, compared with precipitation, the correlation between NPP and temperature is significant in the Yangtze River Basin forests [58]. Our study showed there was a strong positive correlation between NPP and precipitation and a relatively weak negative correlation between NPP and AT in ENF at the interannual scale (Figure 5a), which agrees with the findings of Zeng et al. [16] in the Qianyanzhou area of the Poyang Lake Basin. Notably, the negative correlation between temperature and NPP is significantly enhanced at AT >6660 degrees C year−1. The correlations among NPP, AT, and precipitation in the ENBMF were similar to those in the ENF. The NPP of the EBF showed a positive correlation with precipitation and a negative correlation with AT; however, the effect of AT or precipitation was not major on NPP in this region. The correlation among NPP, AT, and precipitation in the BF was opposite to that in the EBF, and the positive correlation between NPP and AT was enhanced when the AT was <6030 °C year−1; this is because when the temperature is lower, increasing the air temperature can enhance photosynthesis through metabolism, while accelerating the breakdown of nutrients and increasing their availability, to promote NPP growth [11]. These findings demonstrated the complex interactions between forest NPP and climatic factors.
The NPP of ENF had a strong positive correlation with precipitation and no significant correlation with AT at the inter-monthly scale (Figure 5a and Figure 6a), causing the NPP to decline with precipitation from July to August for many years. The NPP of BF and EBF exhibited the greatest positive correlation with AT; therefore, their NPP did not follow a significant decrease in precipitation from July to August. The NPP of the ENBMF was driven by temperature and precipitation; therefore, the inter-month NPP variation was between those of ENF and EBF.
4.5. NPP Response to Future Climate Change
In the Biome-BGC model, a temperature rise increased NPP and extended the growing season by metabolically enhancing photosynthesis and decreasing NPP by heightening plant respiration [59]. The NPP increased in all forest types when the temperature rose by 1 °C (Figure 9) in the warming scenarios; when the temperature rose by 3 °C, the NPP increased in all forest types except the ENF. This is because the increase in NPP through enhanced photosynthesis and accelerated nutrient decomposition was more significant than the decrease in NPP due to enhanced plant respiration due to increased temperatures [43]. There was a strong positive correlation between the NPP of ENF and precipitation (Figure 5a and Figure 7a). When the temperature increased by 6 °C, the NPP of ENF decreased due to the decline in soil moisture and heightened plant respiration, therefore, in this case, NPP in ENF, EBF, and ENBMF decreased significantly. The increase in NPP of BF was due to its high positive correlation with temperature (Figure 5c and Figure 7c) and the relative sensitivity of the BF-specific physiological parameters to temperature.
Under the precipitation scenarios, there was a minor increase in NPP for all forest types when the precipitation increased by 10% (Figure 9); a moderate increase in precipitation helps alleviate water stress on plant growth, positively affecting NPP during water-deficient months. Conversely, when precipitation decreases by 10%, the water deficit inhibits vegetation photosynthesis [60]; therefore, the NPP decreases in the four typical forest types.
Under the combined scenarios, the NPP of ENF was controlled more by precipitation, such that when precipitation decreased, the NPP decreased (Figure 9a). When the temperature increased by 1 °C or 3 °C and precipitation increased by 10%, vegetation photosynthesis was significantly enhanced, causing an increase in NPP of the four typical forest types. When the temperature rose by 1 degree C or 3 degrees C and the precipitation declined by 10%, the NPP of the other three typical forest types, except the ENF, increased slightly (Figure 9b–d); this is because the increase in their NPP due to the rise of temperature is more significant than the decrease in their NPP due to the decline of precipitation. When the temperature increased by 6 °C and precipitation increased or decreased by 10%, NPP decreased significantly in all types except BF; a 10% decrease in precipitation enhanced this phenomenon. The NPP of BF increased in all combined scenarios because of its high sensitivity to temperature (Figure 9c). The responses of the NPP of different forest types to changes in climatic factors suggest that forest vegetation growth is controlled by several genes that respond to changing natural environmental conditions [10,11].
5. Conclusions
In this study, the Biome-BGC model, with adjustment to its parameters according to the ecophysiological characteristics of forest types, was employed to simulate the NPP dynamics of four typical forest types in the Poyang Lake Basin in the subtropical region from 1970 to 2021. Furthermore, we revealed the differences in NPP responses to temperature and precipitation in different forest types; the results indicated that the average annual NPP in four typical forest types was ranked as EBF (838.25 g C m−2 year−1) > BF (795.29 g C m−2 year−1)~ENBMF (790.1 g C m−2 year−1) > ENF (707.75 g C m−2 year−1). There was a stable fluctuation trend in the NPP of the four typical forest types from 1970 to 2000, with the NPPs demonstrating different degrees of fluctuating decline after 2000. The NPP of the ENF was primarily controlled by precipitation at both interannual (p < 0.01) and inter-monthly (p < 0.01) scales, with the R2 of 0.33 and 0.78, respectively, and the NPP change curve was similar to that of precipitation. At the interannual scale, the NPP of EBF and BF was less influenced by precipitation and temperature; at the inter-monthly scale, AT was the dominant factor for their NPPs (p < 0.01), with R2 of 0.85 and 0.92, respectively. The NPP of the ENBMF and BF was primarily driven by precipitation (R2 = 0.33, p < 0.01) at the interannual scale and by precipitation (R2 = 0.74, p < 0.01) and AT (R2 = 0.62, p < 0.01) at the inter-monthly scale. In future scenarios, precipitation changes will have a greater impact on the NPP of ENF; the NPP changes in the other three forest types will be mainly controlled by temperature, and only a 10% change in precipitation leads to its smaller impact on their NPP changes.
Supplementary Materials
The following supporting information can be downloaded at: https://www.mdpi.com/article/10.3390/f14071474/s1, Table S1. Ecophysiological parameters of the forest types used in the model.
Author Contributions
Conceptualization, X.S. and B.Z.; methodology, X.S.; software, X.S. and W.W.; validation, X.S., F.H. and L.X.; formal analysis, X.S.; investigation, X.S.; resources, B.Z.; data curation, X.S., F.H. and L.X.; writing—original draft preparation, X.S. and W.W.; writing—review and editing, X.S., W.W., H.W. and Z.L.; visualization, X.S. and W.W.; supervision, B.Z.; project administration, W.W.; funding acquisition, B.Z. All authors have read and agreed to the published version of the manuscript.
Funding
This research was funded by the Key Research and Development Program of Jiangxi Province (grant numbers 20223BBG74S01; 20223BBG71013).
Data Availability Statement
Not applicable.
Conflicts of Interest
The authors declare no conflict of interest.
References
- Friedlingstein, P.; O’Sullivan, M.; Jones, M.W.; Andrew, R.M.; Hauck, J.; Olsen, A.; Peters, G.P.; Peters, W.; Pongratz, J.; Sitch, S.; et al. Global Carbon Budget 2020. Earth Syst. Sci. Data 2020, 12, 3269–3340. [Google Scholar] [CrossRef]
- Piao, S.; He, Y.; Wang, X.; Chen, F. Estimation of China’s terrestrial ecosystem carbon sink: Methods, progress and prospects. Sci. China Earth Sci. 2022, 65, 641–651. [Google Scholar] [CrossRef]
- Dixon, R.K.; Solomon, A.M.; Brown, S.; Houghton, R.A.; Trexier, M.C.; Wisniewski, J. Carbon pools and flux of global forest ecosystems. Science 1994, 263, 185–190. [Google Scholar] [CrossRef]
- Li, T.; Li, M.; Ren, F.; Tian, L. Estimation and Spatio-Temporal Change Analysis of NPP in Subtropical Forests: A Case Study of Shaoguan, Guangdong, China. Remote Sens. 2022, 14, 2541. [Google Scholar] [CrossRef]
- Wang, Y.; Dai, E.; Wu, C. Spatiotemporal heterogeneity of net primary productivity and response to climate change in the mountain regions of southwest China. Ecol. Indic. 2021, 132, 108273. [Google Scholar] [CrossRef]
- Le Quéré, C.; Raupach, M.R.; Canadell, J.G.; Marland, G.; Bopp, L.; Ciais, P.; Conway, T.J.; Doney, S.C.; Feely, R.A.; Foster, P.; et al. Trends in the sources and sinks of carbon dioxide. Nat. Geosci. 2009, 2, 831–836. [Google Scholar] [CrossRef]
- IPCC. Climate change 2021: The physical science basis. In Future Global Climate: Scenario-42 Based Projections and Near-Term Information; Lee, J.Y., Marotzke, J., Bala, G., Cao, L., Corti, S., Dunne, J.P., Engelbrecht, F., Fischer, E., Fyfe, J.C., Jones, C., et al., Eds.; Cambridge University Press: Cambridge, UK, 2021; pp. 1–195. [Google Scholar]
- Park Williams, A.; Allen, C.D.; Macalady, A.K.; Griffin, D.; Woodhouse, C.A.; Meko, D.M.; Swetnam, T.W.; Rauscher, S.A.; Seager, R.; Grissino-Mayer, H.D.; et al. Temperature as a potent driver of regional forest drought stress and tree mortality. Nat. Clim. Chang. 2012, 3, 292–297. [Google Scholar] [CrossRef]
- Piao, S.L.; Friedlingstein, P.; Ciais, P.; Peylin, P.; Zhu, B.; Reichstein, M. Footprint of temperature changes in the temperate and boreal forest carbon balance. Geophys. Res. Lett. 2009, 36, L07404. [Google Scholar] [CrossRef]
- Law, B.E.; Turner, D.; Campbell, J.; Sun, O.J.; Van Tuyl, S.; Ritts, W.D.; Cohen, W.B. Disturbance and climate effects on carbon stocks and fluxes across Western Oregon USA. Glob. Chang. Biol. 2004, 10, 1429–1444. [Google Scholar] [CrossRef]
- Ouyang, S.; Wang, X.; Wu, Y.; Jianxin Sun, O. Contrasting responses of net primary productivity to inter-annual variability and changes of climate among three forest types in northern China. J. Plant Ecol. 2014, 7, 309–320. [Google Scholar] [CrossRef]
- Han, Q.; Wang, T.; Jiang, Y.; Fischer, R.; Li, C. Phenological variation decreased carbon uptake in European forests during 1999–2013. For. Ecol. Manag. 2018, 427, 45–51. [Google Scholar] [CrossRef]
- Yu, G.R.; Chen, Z.; Piao, S.L.; Peng, C.H.; Ciais, P.; Wang, Q.F.; Li, X.R.; Zhu, X.J. High carbon dioxide uptake by subtropical forest ecosystems in the East Asian monsoon region. Proc. Natl. Acad. Sci. USA 2014, 111, 4910–4915. [Google Scholar] [CrossRef] [PubMed]
- Liu, F.-H.; Xu, C.-Y.; Yang, X.-X.; Ye, X.-C. Controls of Climate and Land-Use Change on Terrestrial Net Primary Productivity Variation in a Subtropical Humid Basin. Remote Sens. 2020, 12, 3525. [Google Scholar] [CrossRef]
- Ma, Z.; Liu, Q.; Wang, H.; Li, X.; Zeng, H.; Xu, W. Observation and modeling of NPP for Pinus elliottii plantation in subtropical China. Sci. China Ser. D Earth Sci. 2008, 51, 955–965. [Google Scholar] [CrossRef]
- Zeng, H.; Liu, Q.; Feng, Z.; Wang, X.; Ma, Z. GPP and NPP study of Pinus elliottii forest in red soil hilly region based on BIOME-BGC model. Acta Ecol. Sin. 2008, 28, 5314–5321. (In Chinese) [Google Scholar]
- Field, C.B.; Behrenfeld, M.J.; Randerson, J.T.; Falkowski, P. Primary production of the biosphere: Integrating terrestrial and oceanic components. Science 1998, 281, 237–240. [Google Scholar] [CrossRef]
- Piao, S.L.; Fang, J.Y.; Ciais, P.; Peylin, P.; Huang, Y.; Sitch, S.; Wang, T. The carbon balance of terrestrial ecosystems in China. Nature 2009, 458, 1009–1013. [Google Scholar] [CrossRef]
- Zhao, F.; Yang, P.; Li, R.; Shang, H.; Xia, L.; Hu, M.; Xu, M. Spatio-temporal assessing of natural vegetation regulation on SO2 absorption coupling ecosystem process model and OMI satellite data. Environ. Res. Lett. 2022, 17, 034044. [Google Scholar] [CrossRef]
- Ye, J.-S.; Reynolds, J.F.; Li, F.-M. A mechanistic–bioclimatic modeling analysis of the potential impact of climate change on biomes of the Tibetan Plateau. Ecology 2014, 95, 2109–2120. [Google Scholar] [CrossRef]
- Li, C.; Sun, H.; Wu, X.; Han, H. An approach for improving soil water content for modeling net primary production on the Qinghai-Tibetan Plateau using Biome-BGC model. Catena 2020, 184, 104253. [Google Scholar] [CrossRef]
- Mao, F.; Du, H.; Li, X.; Ge, H.; Cui, L.; Zhou, G. Spatiotemporal dynamics of bamboo forest net primary productivity with climate variations in Southeast China. Ecol. Indic. 2020, 116, 106505. [Google Scholar] [CrossRef]
- Li, C.; Sun, H.; Liu, L.; Dou, T.; Zhou, M.; Li, W.; Wu, X. The importance of permafrost in the steady and fast increase in net primary production of the grassland on the Qinghai–Tibet Plateau. Catena 2022, 211, 105964. [Google Scholar] [CrossRef]
- Yan, M.; Tian, X.; Li, Z.; Chen, E.; Li, C.; Fan, W. A long-term simulation of forest carbon fluxes over the Qilian Mountains. Int. J. Appl. Earth Obs. Geoinf. 2016, 52, 515–526. [Google Scholar] [CrossRef]
- Han, Q.; Li, C.; Zhao, C.; Zhang, Y.; Li, S. Grazing decreased water use efficiency in Central Asia from 1979 to 2011. Ecol. Model. 2018, 388, 72–79. [Google Scholar] [CrossRef]
- Fan, X.; Liu, Y.; Tao, J.; Wang, Y.; Zhou, H. MODIS detection of vegetation changes and investigation of causal factors in Poyang Lake basin, China for 2001–2015. Ecol. Indic. 2018, 91, 511–522. [Google Scholar] [CrossRef]
- Ye, X.; Zhang, Q.; Liu, J.; Li, X.; Xu, C.-Y. Distinguishing the relative impacts of climate change and human activities on variation of streamflow in the Poyang Lake catchment, China. J. Hydrol. 2013, 494, 83–95. [Google Scholar] [CrossRef]
- Huang, L.; Shao, Q.; Liu, J. Forest restoration to achieve both ecological and economic progress, Poyang Lake basin, China. Ecol. Eng. 2012, 44, 53–60. [Google Scholar] [CrossRef]
- Running, S.; Hunt, E. Generalization of a Forest Ecosystem Process Model for Other Biomes, BIOME-BGC, and an Application for Global-Scale Models. In Scaling Physiological Processes; Ehleringer, J.R., Field, C.B., Eds.; Scaling Physiological Processes: Leaf to Globe; Academic Press: San Diego, CA, USA, 1993; pp. 141–158. [Google Scholar]
- Farquhar, G.D.; Caemmerer, S.V.; Berry, J.A. A biochemical model of photosynthetic CO2 assimilation in leaves of C3 species. Planta 1980, 149, 78–90. [Google Scholar] [CrossRef]
- Ryan, M.G. Effects of Climate Change on Plant Respiration. Ecol. Appl. 1991, 1, 157–167. [Google Scholar] [CrossRef]
- Yan, M.; Tian, X.; Li, Z.; Chen, E.; Wang, X.; Han, Z.; Sun, H. Simulation of Forest Carbon Fluxes Using Model Incorporation and Data Assimilation. Remote Sens. 2016, 8, 567. [Google Scholar] [CrossRef]
- Petritsch, R.; Hasenauer, H.; Pietsch, S.A. Incorporating forest growth response to thinning within biome-BGC. For. Ecol. Manag. 2007, 242, 324–336. [Google Scholar] [CrossRef]
- Thornton, P.E.; Running, S.W. An improved algorithm for estimating incident daily solar radiation from measurements of temperature, humidity, and precipitation. Agric. For. Meteorol. 1999, 93, 211–228. [Google Scholar] [CrossRef]
- Running, S.W.; Nemani, R.R.; Hungerford, R.D. Extrapolation of synoptic meteorological data in mountainous terrain and its use for simulating forest evapotranspiration and photosynthesis. Can. J. For. Res. 1987, 17, 472–483. [Google Scholar] [CrossRef]
- Ichii, K.; Suzuki, T.; Kato, T.; Ito, A.; Hajima, T.; Ueyama, M.; Sasai, T.; Hirata, R.; Saigusa, N.; Ohtani, Y.; et al. Multi-model analysis of terrestrial carbon cycles in Japan: Limitations and implications of model calibration using eddy flux observations. Biogeosciences 2010, 7, 2061–2080. [Google Scholar] [CrossRef]
- Huang, Q.; Yang, D.; Shen, Y.; Qiu, G. Studies on the Primary Productivity of Bamboo (Phyllostachys pubescens) Grove. For. Res. 1993, 6, 5. (In Chinese) [Google Scholar]
- Kelliher, F.M.; Leuning, R.; Raupach, M.R.; Schulze, E.D. Maximum Conductances for Evaporation from Global Vegetation Types. Agric. For. Meteorol. 1995, 73, 1–16. [Google Scholar] [CrossRef]
- Mao, F.; Li, P.; Zhou, G.; Du, H.; Xu, X.; Shi, Y.; Mo, L.; Zhou, Y.; Tu, G. Development of the BIOME-BGC model for the simulation of managed Moso bamboo forest ecosystems. J. Environ. Manag. 2016, 172, 29–39. [Google Scholar] [CrossRef] [PubMed]
- White, M.A.; Thornton, P.E.; Running, S.W.; Nemani, R.R. Parameterization and Sensitivity Analysis of the BIOME–BGC Terrestrial Ecosystem Model: Net Primary Production Controls. Earth Interact. 2000, 4, 1–84. [Google Scholar] [CrossRef]
- Kang, S.; Kimball, J.S.; Running, S.W. Simulating effects of fire disturbance and climate change on boreal forest productivity and evapotranspiration. Sci. Total Environ. 2006, 362, 85–102. [Google Scholar] [CrossRef]
- Yang, C.; Wang, Y.; Su, B.; Pu, Y.; Wang, Y.; Jiang, T. Runoff variation trend of Ganjiang River basin under SSP “Double Carbon” path. Clim. Chang. Res. 2022, 18, 177–187. (In Chinese) [Google Scholar]
- Peng, S.; Zhao, C.; Chen, Y.; Xu, Z. Simulating the productivity of a subalpine forest at high elevations under representative concentration pathway scenarios in the Qilian Mountains of northwest China. Scand. J. Forest Res. 2016, 32, 166–173. [Google Scholar] [CrossRef]
- Li, H.; Lei, Y.; Zeng, W. Forest Carbon Storage in China Estimated Using Forestry Inventory Data. Sci. Silv. Sin. 2011, 47, 6. (In Chinese) [Google Scholar]
- Bonan, G.B. Forests and Climate Change: Forcings, Feedbacks, and the Climate Benefits of Forests. Science 2008, 320, 1444–1449. [Google Scholar] [CrossRef] [PubMed]
- Chen, S.; Jiang, H.; Jin, J.; Wang, Y. Changes in net primary production in the Tianmu Mountain Nature Reserve, China, from 1984 to 2014. Int. J. Remote Sens. 2016, 38, 211–234. [Google Scholar] [CrossRef]
- Feng, X.; Liu, G.; Chen, J.M.; Chen, M.; Liu, J.; Ju, W.M.; Sun, R.; Zhou, W. Net primary productivity of China’s terrestrial ecosystems from a process model driven by remote sensing. J. Environ. Manag. 2007, 85, 563–573. [Google Scholar] [CrossRef]
- Chen, S.; Jiang, H.; Cai, Z.; Zhou, X.; Peng, C. The response of the net primary production of Moso bamboo forest to the On and Off-year management: A case study in Anji County, Zhejiang, China. For. Ecol. Manag. 2018, 409, 1–7. [Google Scholar] [CrossRef]
- Zhang, J.; Chu, Z.; Ge, Y.; Zhou, X.; Jiang, H.; Chang, J.; Peng, C.; Zheng, J.; Jiang, B.; Zhu, J.; et al. TRIPLEX model testing and application for predicting forest growth and biomass production in the subtropical forest zone of China’s Zhejiang Province. Ecol. Model. 2008, 219, 264–275. [Google Scholar] [CrossRef]
- Deng, Y.; Wang, X.; Wang, K.; Ciais, P.; Tang, S.; Jin, L.; Li, L.; Piao, S. Responses of vegetation greenness and carbon cycle to extreme droughts in China. Agric. For. Meteorol. 2021, 298, 108307. [Google Scholar] [CrossRef]
- Zhang, M.; Yuan, X. Rapid reduction in ecosystem productivity caused by flash droughts based on decade-long FLUXNET observations. Hydrol. Earth Syst. Sci. 2020, 24, 5579–5593. [Google Scholar] [CrossRef]
- Zhang, L.; Ren, X.; Wang, J.; He, H.; Wang, S.; Wang, M.; Piao, S.; Yan, H.; Ju, W.; Gu, F.; et al. Interannual variability of terrestrial net ecosystem productivity over China: Regional contributions and climate attribution. Environ. Res. Lett. 2019, 14, 014003. [Google Scholar] [CrossRef]
- Fang, J.Y.; Piao, S.L.; Tang, Z.Y.; Peng, C.H.; Wei, J. Interannual variability in net primary production and precipitation. Science 2001, 293, 1723. [Google Scholar] [CrossRef] [PubMed]
- Chen, Y.; Feng, X.; Tian, H.; Wu, X.; Gao, Z.; Feng, Y.; Piao, S.; Lv, N.; Pan, N.; Fu, B. Accelerated increase in vegetation carbon sequestration in China after 2010: A turning point resulting from climate and human interaction. Glob. Chang. Biol. 2021, 27, 5848–5864. [Google Scholar] [CrossRef] [PubMed]
- Xie, M.; Zhu, Y.; Liu, S.; Deng, D.; Zhu, L.; Zhao, M.; Wang, Z. Simulating the Impacts of Drought and Warming in Summer and Autumn on the Productivity of Subtropical Coniferous Forests. Forests 2022, 13, 2147. [Google Scholar] [CrossRef]
- Kang, F.F.; Li, X.J.; Du, H.Q.; Mao, F.J.; Zhou, G.M.; Xu, Y.X.; Huang, Z.H.; Ji, J.Y.; Wang, J.Y. Spatiotemporal Evolution of the Carbon Fluxes from Bamboo Forests and their Response to Climate Change Based on a BEPS Model in China. Remote Sens. 2022, 14, 366. [Google Scholar] [CrossRef]
- Ji, Y.; Zhou, G.; Luo, T.; Dan, Y.; Zhou, L.; Lv, X. Variation of net primary productivity and its drivers in China’s forests during 2000–2018. For. Ecosyst. 2020, 7, 15. [Google Scholar] [CrossRef]
- Zhang, F.; Zhang, Z.; Kong, R.; Chang, J.; Tian, J.; Zhu, B.; Jiang, S.; Chen, X.; Xu, C.-Y. Changes in Forest Net Primary Productivity in the Yangtze River Basin and Its Relationship with Climate Change and Human Activities. Remote Sens. 2019, 11, 1451. [Google Scholar] [CrossRef]
- Golinkoff, J. Biome BGC Version 4.2: Theoretical Framework of Biome-BGC. Terradynamic Simulation Group Modeling and Monitoring Ecosystem Function at Multiple Scales. Biome-BGC. Available online: http://www.ntsg.umt.edu/project/biome-bgc (accessed on 21 May 2023).
- Miyashita, K.; Tanakamaru, S.; Maitani, T.; Kimura, K. Recovery responses of photosynthesis, transpiration, and stomatal conductance in kidney bean following drought stress. Environ. Exp. Bot. 2005, 53, 205–214. [Google Scholar] [CrossRef]


Disclaimer/Publisher’s Note: The statements, opinions and data contained in all publications are solely those of the individual author(s) and contributor(s) and not of MDPI and/or the editor(s). MDPI and/or the editor(s) disclaim responsibility for any injury to people or property resulting from any ideas, methods, instructions or products referred to in the content. |
© 2023 by the authors. Licensee MDPI, Basel, Switzerland. This article is an open access article distributed under the terms and conditions of the Creative Commons Attribution (CC BY) license (https://creativecommons.org/licenses/by/4.0/).