Article

The Early- to Latewood Transition Phenology Is Asynchronous between the Different Parts of Abies forrestii var. smithii in Jiaozi Mountain, Yunnan, China

School of Ecology and Environmental Science, Yunnan University, Kunming 650500, China
*
Author to whom correspondence should be addressed.
These authors contributed equally to the study.
Forests 2023, 14(7), 1456; https://doi.org/10.3390/f14071456
Submission received: 14 June 2023 / Revised: 11 July 2023 / Accepted: 14 July 2023 / Published: 16 July 2023
(This article belongs to the Section Forest Ecology and Management)

Abstract

:
Phenological synchronicity of different tree parts and habitats can provide valuable insights into the physiological relationships and regulatory factors of different phenologies. The earlywood (EW) to latewood (LW) transition of the xylem is a critical process closely related to the key functions and physiological processes of trees. This study investigated the phenology phase of the EW–LW transition in branches and stems of Smith fir (Abies forrestii var. smithii Viguié & Gaussen) along an altitude gradient (3600 m, 3800 m, and 4000 m) in Jiaozi Mountain, Yunnan, China, in 2021. The study aimed to test the hypothesis that branches transition earlier than stems, but the elevation does not affect the transition time. We monitored the EW–LW transition dates weekly using microcores and then correlated them to the climatic conditions and developmental processes. Our findings revealed that the EW–LW transition timing varied among the different parts of the tree but was synchronized across the different elevations. Furthermore, the transition always occurred earlier in branches than in the stem, but the difference narrowed with increasing altitude. The EW–LW transition was mainly influenced by photoperiod, which plays a crucial role as a signaling factor. Additionally, the tree crown was more sensitive to environmental changes than the stem. The transition time of stems was less sensitive to environmental factors than that of branches. Therefore, our results suggest that the earlywood to latewood transition is regulated by developmental factors, and the photoperiod may indirectly regulate the developmental process of trees as a signaling factor, thus regulating the earlywood to latewood transition time. Our study provides new insights into the developmental regulation and climate sensitivity of tree ring formation.

1. Introduction

The conifer tree ring structure occurs due to the seasonal periodicity of growth processes and is characterized by a transition from wide, thin-walled earlywood cells to narrow, thick-walled latewood cells [1]. The structure is found in all conifer species under mild environmental conditions [2,3], although it is an important phenotypic plasticity trait of trees to adapt to environmental changes [4,5]. However, it is still unclear whether the changes in ring density are caused by physical limitations to growth, seasonal changes in carbon availability, or the tree’s strategy to anticipate future environmental limitations [6].
The mechanism involved in the earlywood–latewood transition of temperate forest conifers is still a contested question [6]. Early investigators concluded that photoperiod shortening induced latewood formation and was associated with apical and needle growth cessation [7,8,9]. However, the effects of light conditions on radial growth are indirect, being mediated by photosynthates or phytohormones [10]. The formation of the typical conifer tree ring structure under normal climatic conditions is only marginally driven by the climate, suggesting a strong developmental regulation of xylogenesis [10]. However, the impact of climatic factors on tree ring formation is complex and depends on the physiology of the tree, which is also affected by the environment [11]. Therefore, the extent to which tree anatomical changes relate to climatic constraints or developmental control is still unclear [12].
Remarkably, the wood formation process can generate various wood forms in response to developmental or environmental constraints [13]. Therefore, trees from different sites may exhibit contrasting wood anatomy due to temperature and humidity differences [14,15]. Fundamental subprocesses include the duration and rate of cell enlargement, secondary cell wall deposition and lignification, shape xylem cell dimensions, and the resulting tree ring structure [16]. However, most studies have investigated the intra-annual tree ring at breast height only [17,18,19,20], necessitating additional studies on the earlywood to latewood transition of the different tree parts under varying environmental conditions [21].
This study aimed to investigate the effect of developmental and climatic factors on the earlywood to latewood transition time by comparing the transition time of branches and stems under different environmental conditions. The study intended to address two research questions: (1) Is the earlywood to latewood transition time consistent among branches and stems under different environmental conditions? (2) What factors are associated with the timing of the earlywood to latewood transition? We hypothesized a significant difference in the transition time between branches and stems under different environmental conditions and that temperature may influence the transition time difference. To test the hypothesis, we collected weekly microcores and hourly in situ climate data at different elevations along the elevation gradient of the Smith fir (Abies forrestii var. smithii) forest on the Jiaozi Mountain, Yunnan. We quantified the cell development kinetics and the resulting cell dimensions along the Smith fir tree rings.
This study provides insights into the extent to which developmental and climatic factors influence the earlywood to latewood transition. The findings may improve the understanding of tree adaptations to different environmental conditions and the prediction of tree responses to future climate changes.

2. Materials and Methods

2.1. Study Area

The study area was situated in the Jiaozi Mountain National Nature Reserve, Yunnan Province, China, with the coordinates of 102.80°–102.97° E and 26.00°–26.18° N (Figure 1). The reserve has an elevation range of 1100 m to 4344 m, with a vertical zone exhibiting distinct dry and wet seasons and a plateau monsoon climate. Moreover, the annual precipitation of the area ranges from 1600 to 1800 mm, with the highest precipitation occurring from July to September and the lowest from November to February [22]. Due to its complex topography, the reserve has diverse natural environments and vegetation types, including the Smith fir forest, which is dominated by the Pinaceae species. The Smith fir forest is distributed in the alpine and subalpine areas of northwestern Yunnan, southwestern Sichuan, and southeastern Tibet in the Hengduan Mountains. The forest provides important timber tree species unique to China and a significant vegetation type for the southwestern mountains of China [22,23].
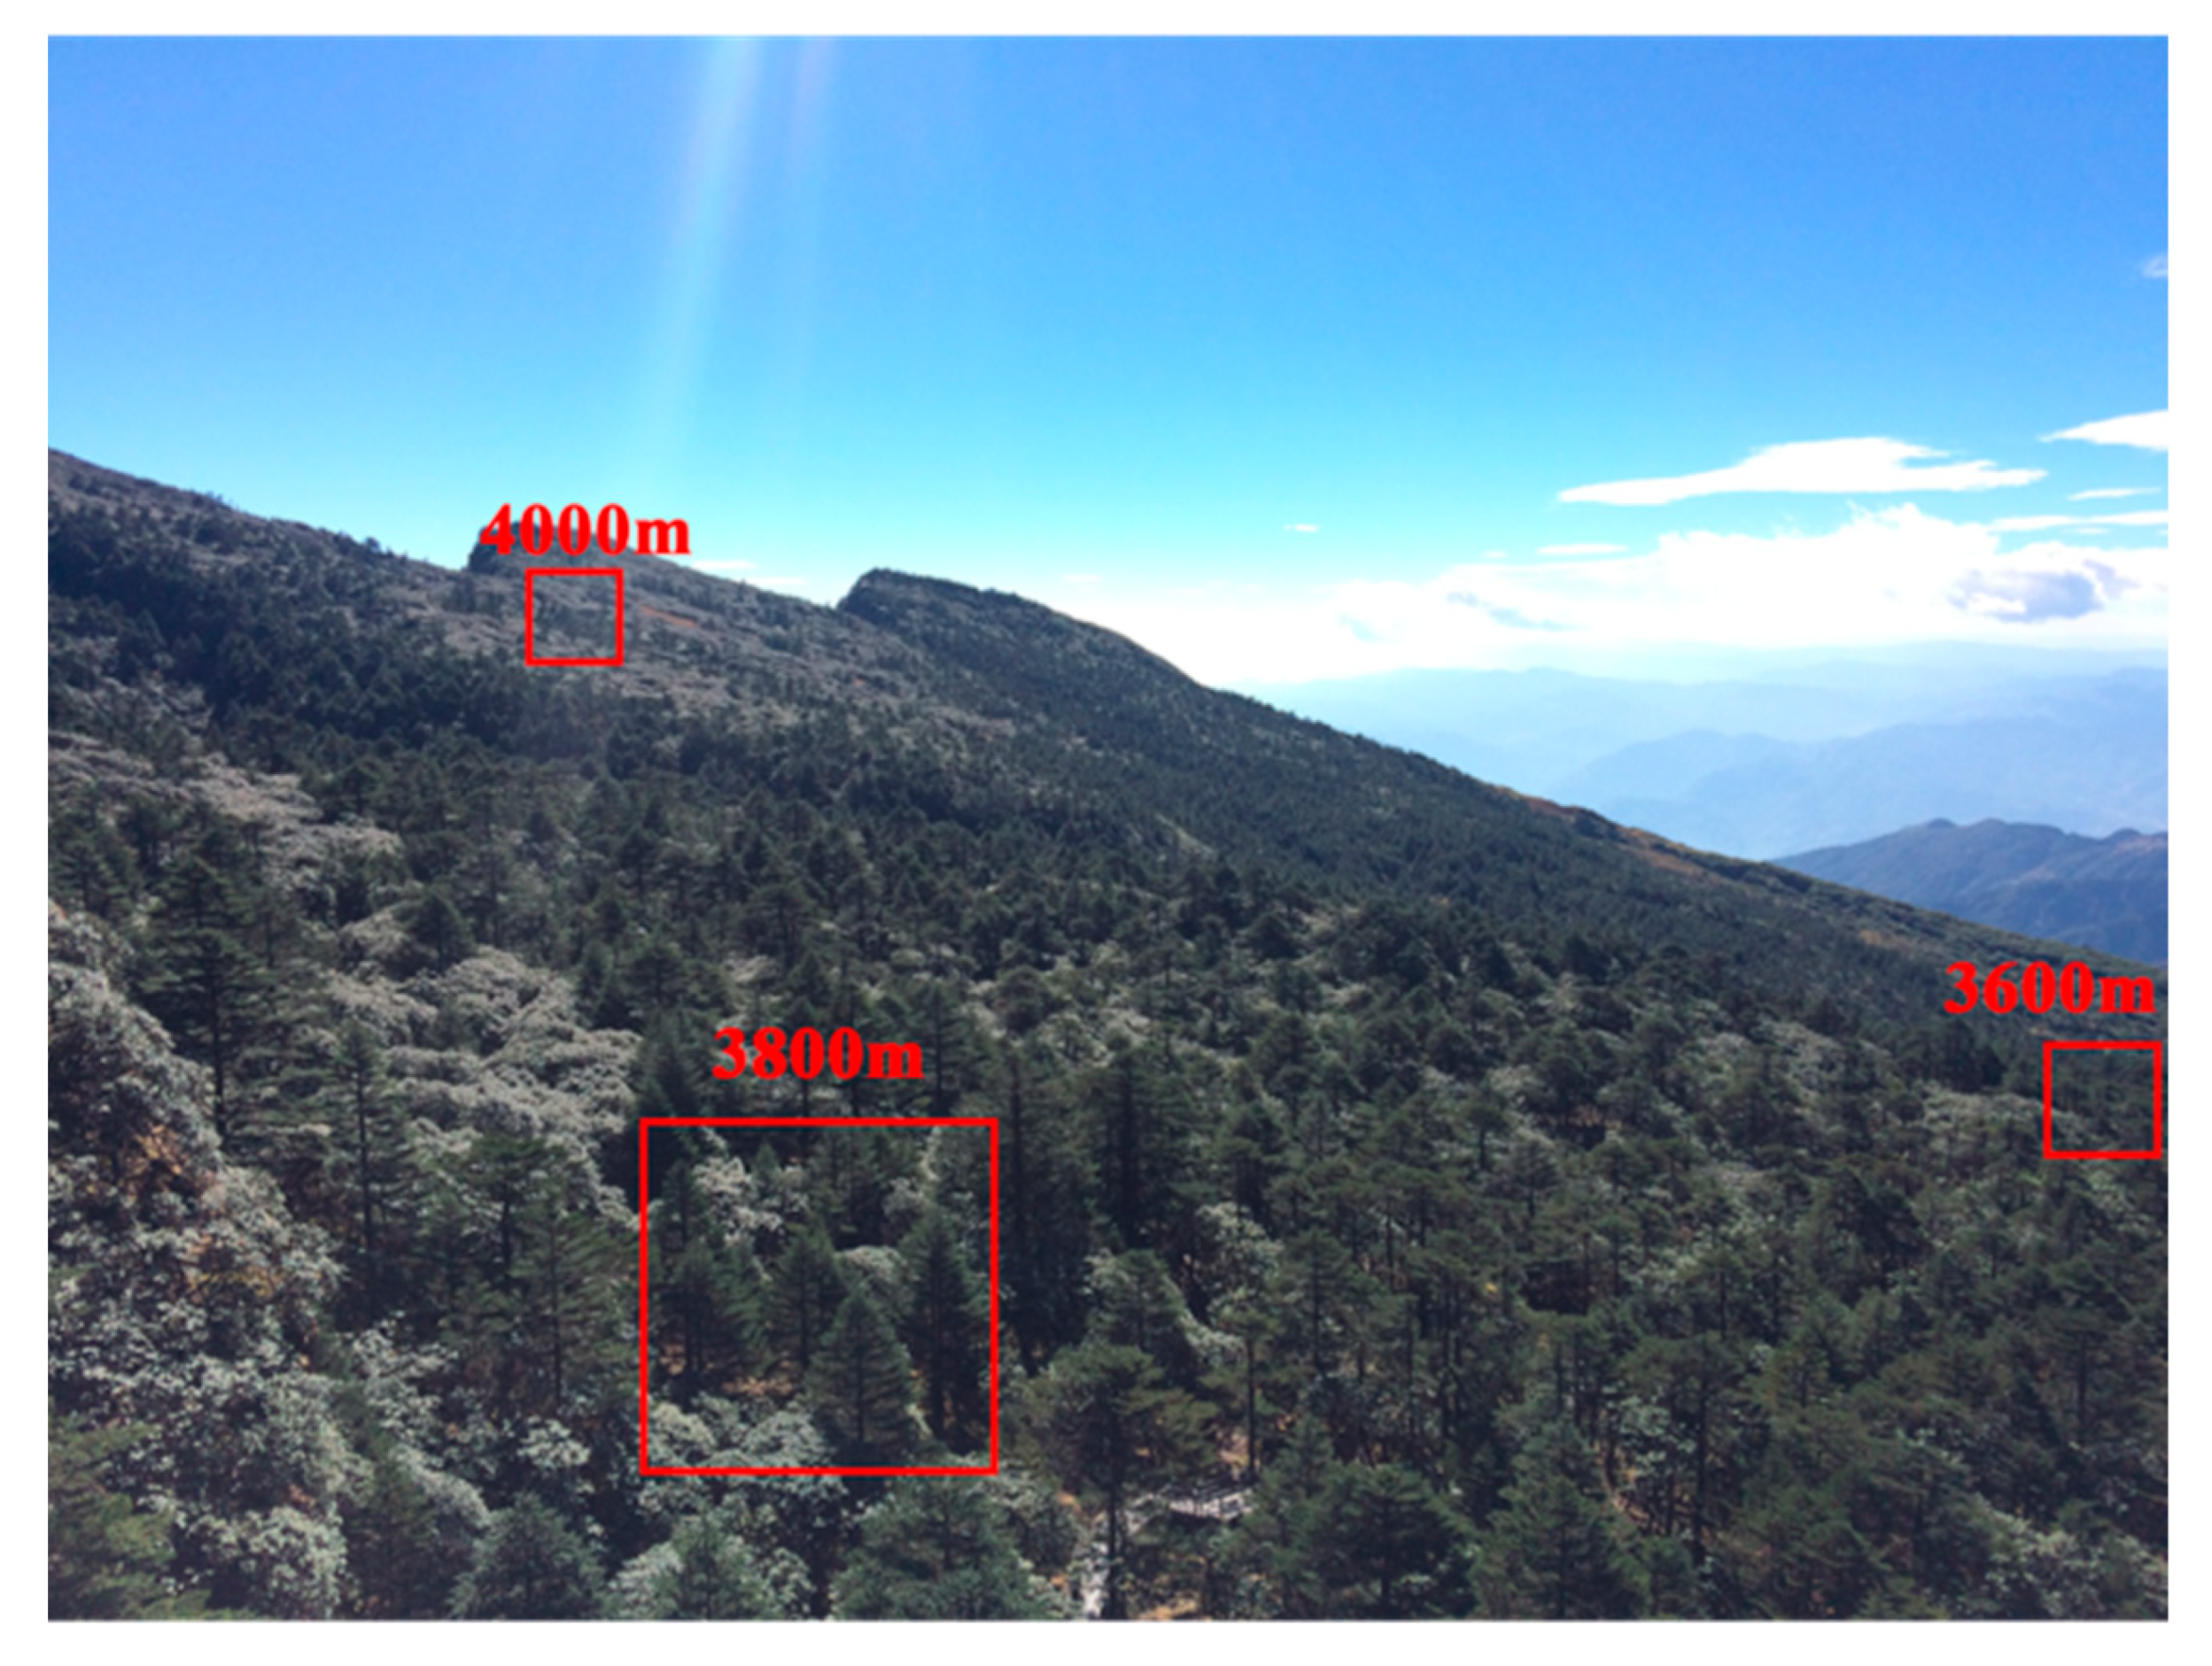
In order to investigate the Smith fir forest, we selected a vertical transect facing northwest in the crisscross zone of the Smith fir treeline. The transect was characterized by brown coniferous forest soils. Subsequently, we established three fixed monitoring plots, each measuring 30 m by 30 m, at intervals of 200 m within the transect. These plots were situated at elevations of 3600 m, 3800 m, and 4000 m (Figure 2). From each of these sample plots, five mature trees demonstrating similar age, healthy growth, and freedom from diseases and insects were randomly selected. Thus, a total of 15 trees were included in the study. The characteristics of these sample trees are shown in Table 1. In situ thermometers (TiviT-v2, ONSET, Cape Cod, Massachusetts) were then installed in each sample plot to measure local air temperature and humidity.

2.2. Sampling and Microscopic Observations of the Developing Xylem

Weekly branches and stem microcore samples were then collected from the five trees in each sample plot from March to November 2021. Three samples, approximately 1 cm in length, were collected from the middle and upper section of the branches, each taken from different directions within the tree canopy. It was necessary to replace the branches on a weekly basis. The collection of the very tip branches, which are often too young and small, was avoided due to the difficulty in observing cambium activity and xylem differentiation. During the branch sampling process, it was crucial to apply uniform force to ensure that the cambium and xylem of the branch samples remained intact. This uniformity of force minimized the risk of separation, enabling easier slicing and observation. Three microcores (1.5 mm long and 2 mm diameter) were collected per tree using the Trephor microcore sampler at a breast height (1.3 m above ground level) of the stem [24]. Samples were collected from the bast, formative layer, and xylem (with the xylem containing at least the first 3–5 years of annual rings). Dead bark was removed from the stem before sampling, and the bast was collected without injuries to avoid affecting the sample quality. Moreover, the sample collection was performed in a “Z” pattern to prevent the effect of sampling on tree growth. Samples were immersed in 50% ethanol and transferred to a laboratory, where they were stored at 4 °C for subsequent sectioning. The samples were fixed using small wooden blocks and hot-melt glue and cut into 8–12 µm sections using an ERMA paddle-walk slicer. The sections were stained with senna-solid green and permanently sealed using neutral gum. The cytoarchitecture of the branch and stem sections was then observed and photographed at different magnifications under a microscope. The images were processed and analyzed using ImageJ software. The cells were counted and normalized to account for the growth rate variations among trees.
To investigate how the earlywood to latewood transition relates to temperature and humidity, we measured and collected the local canopy temperature and humidity in each fixed sample plot using two in situ temperature meters. The meters recorded temperature data at 1 h intervals.

2.3. Criteria for Judging Earlywood, Transition Wood, and Latewood

The demarcation between earlywood (EW), transition wood (TW), and latewood (LW) is generally based on the wall–lumen size of the cells. Mork’s criterion (MC), which has long been used in wood anatomy [25], suggests dividing a tree ring if the index value (=4 × CW/CL × 100; where CW and CL represent the cell wall and cell lumen widths, respectively) exceeds a threshold of 100. Mature tracheids were classified into three wood types based on Mork’s criterion (MC) [25]: EW (MC ≤ 0.5), TW (0.5 ≤ MC ≤ 1), and LW (MC ≥ 1) [10]. The Smith fir and Norway spruce species belong to the same genus and have similar tree ring structures. Therefore, since Norway spruce trees have a smooth transition from EW to LW, the cells of each Smith fir tree ring were grouped into three intra-ring zones, namely EW, LW, and TW, using the same judgment criteria for Norway spruce trees [26].

2.4. Measurement of Wood Anatomical and Structural Characteristics

Wood anatomical and structural characteristics were measured and analyzed. Digital images of the selected tree rings were analyzed using ImageJ software to measure the cell diameters (CL) and the double cell wall thickness (2 × CW) along at least three radial files. For each tree, five well-preserved sections of the entirely formed tree ring were selected to analyze the dimensions of the ring cells produced during the year. The relative position of each cell within the tree ring was calculated relative to the total cells, and the first cell in a radial cell file was set as 1%, while the last one was set as 100% of the intra-ring position. The cellular structures of the five tree rings were averaged to generate a unique tree ring structure for each tree, depending on the relative position of each cell within the tree ring. The relative positions of cells within the tree ring during the earlywood to latewood transition were determined using the formula MC = 4 × CW/CL. The obtained results provide information on the occurrence point but not the timing of the earlywood to latewood transition within the tree ring.

2.5. Gompertz Curve Fitting for Dynamic Changes in Xylem Cell Number

To obtain temporal information on the transition timing, we fitted the changes in cell numbers of the tree rings using Gompertz growth curves based on the following equation [27]:
y = A e x p [ e ] β k t
where y denotes daily growth, t denotes the number of days (counted from 1st of January of each year), A denotes the asymptote (constant for annual growth), while β and K are constants denoting the intercept and rate of change in the x axis, respectively. Growth dynamics simulations were performed using the Origin software (OriginLab Corporation, Northampton, MA, USA).

2.6. Relationship between the Earlywood to Latewood Transition and Environmental Factors

To better characterize the relationship between the earlywood to latewood transition and environmental factors, we estimated the cell expansion duration and cell wall deposition rate. The cell expansion duration ( C d i ) was calculated using the Gompertz growth curve, where the time required to produce each cell represented the cell expansion duration ( C d i ). The wall area ( S i ) of each cell ( i ) was estimated using the area of a circle, lumen length, and wall thickness of each cell, as follows:
S i = π × [   C L i 2 + C W i   2 C L i 2 2 ]
The cell wall deposition rate ( V i ) was calculated as the ratio of cell wall area to the duration of cell expansion ( C d i ):
V i = S i × 1 / C d i
These dynamic developmental processes of earlywood to latewood transition are more closely associated with changes in environmental factors than in the tree structure.

3. Results

3.1. Seasonal Cycles of the Environmental Factors

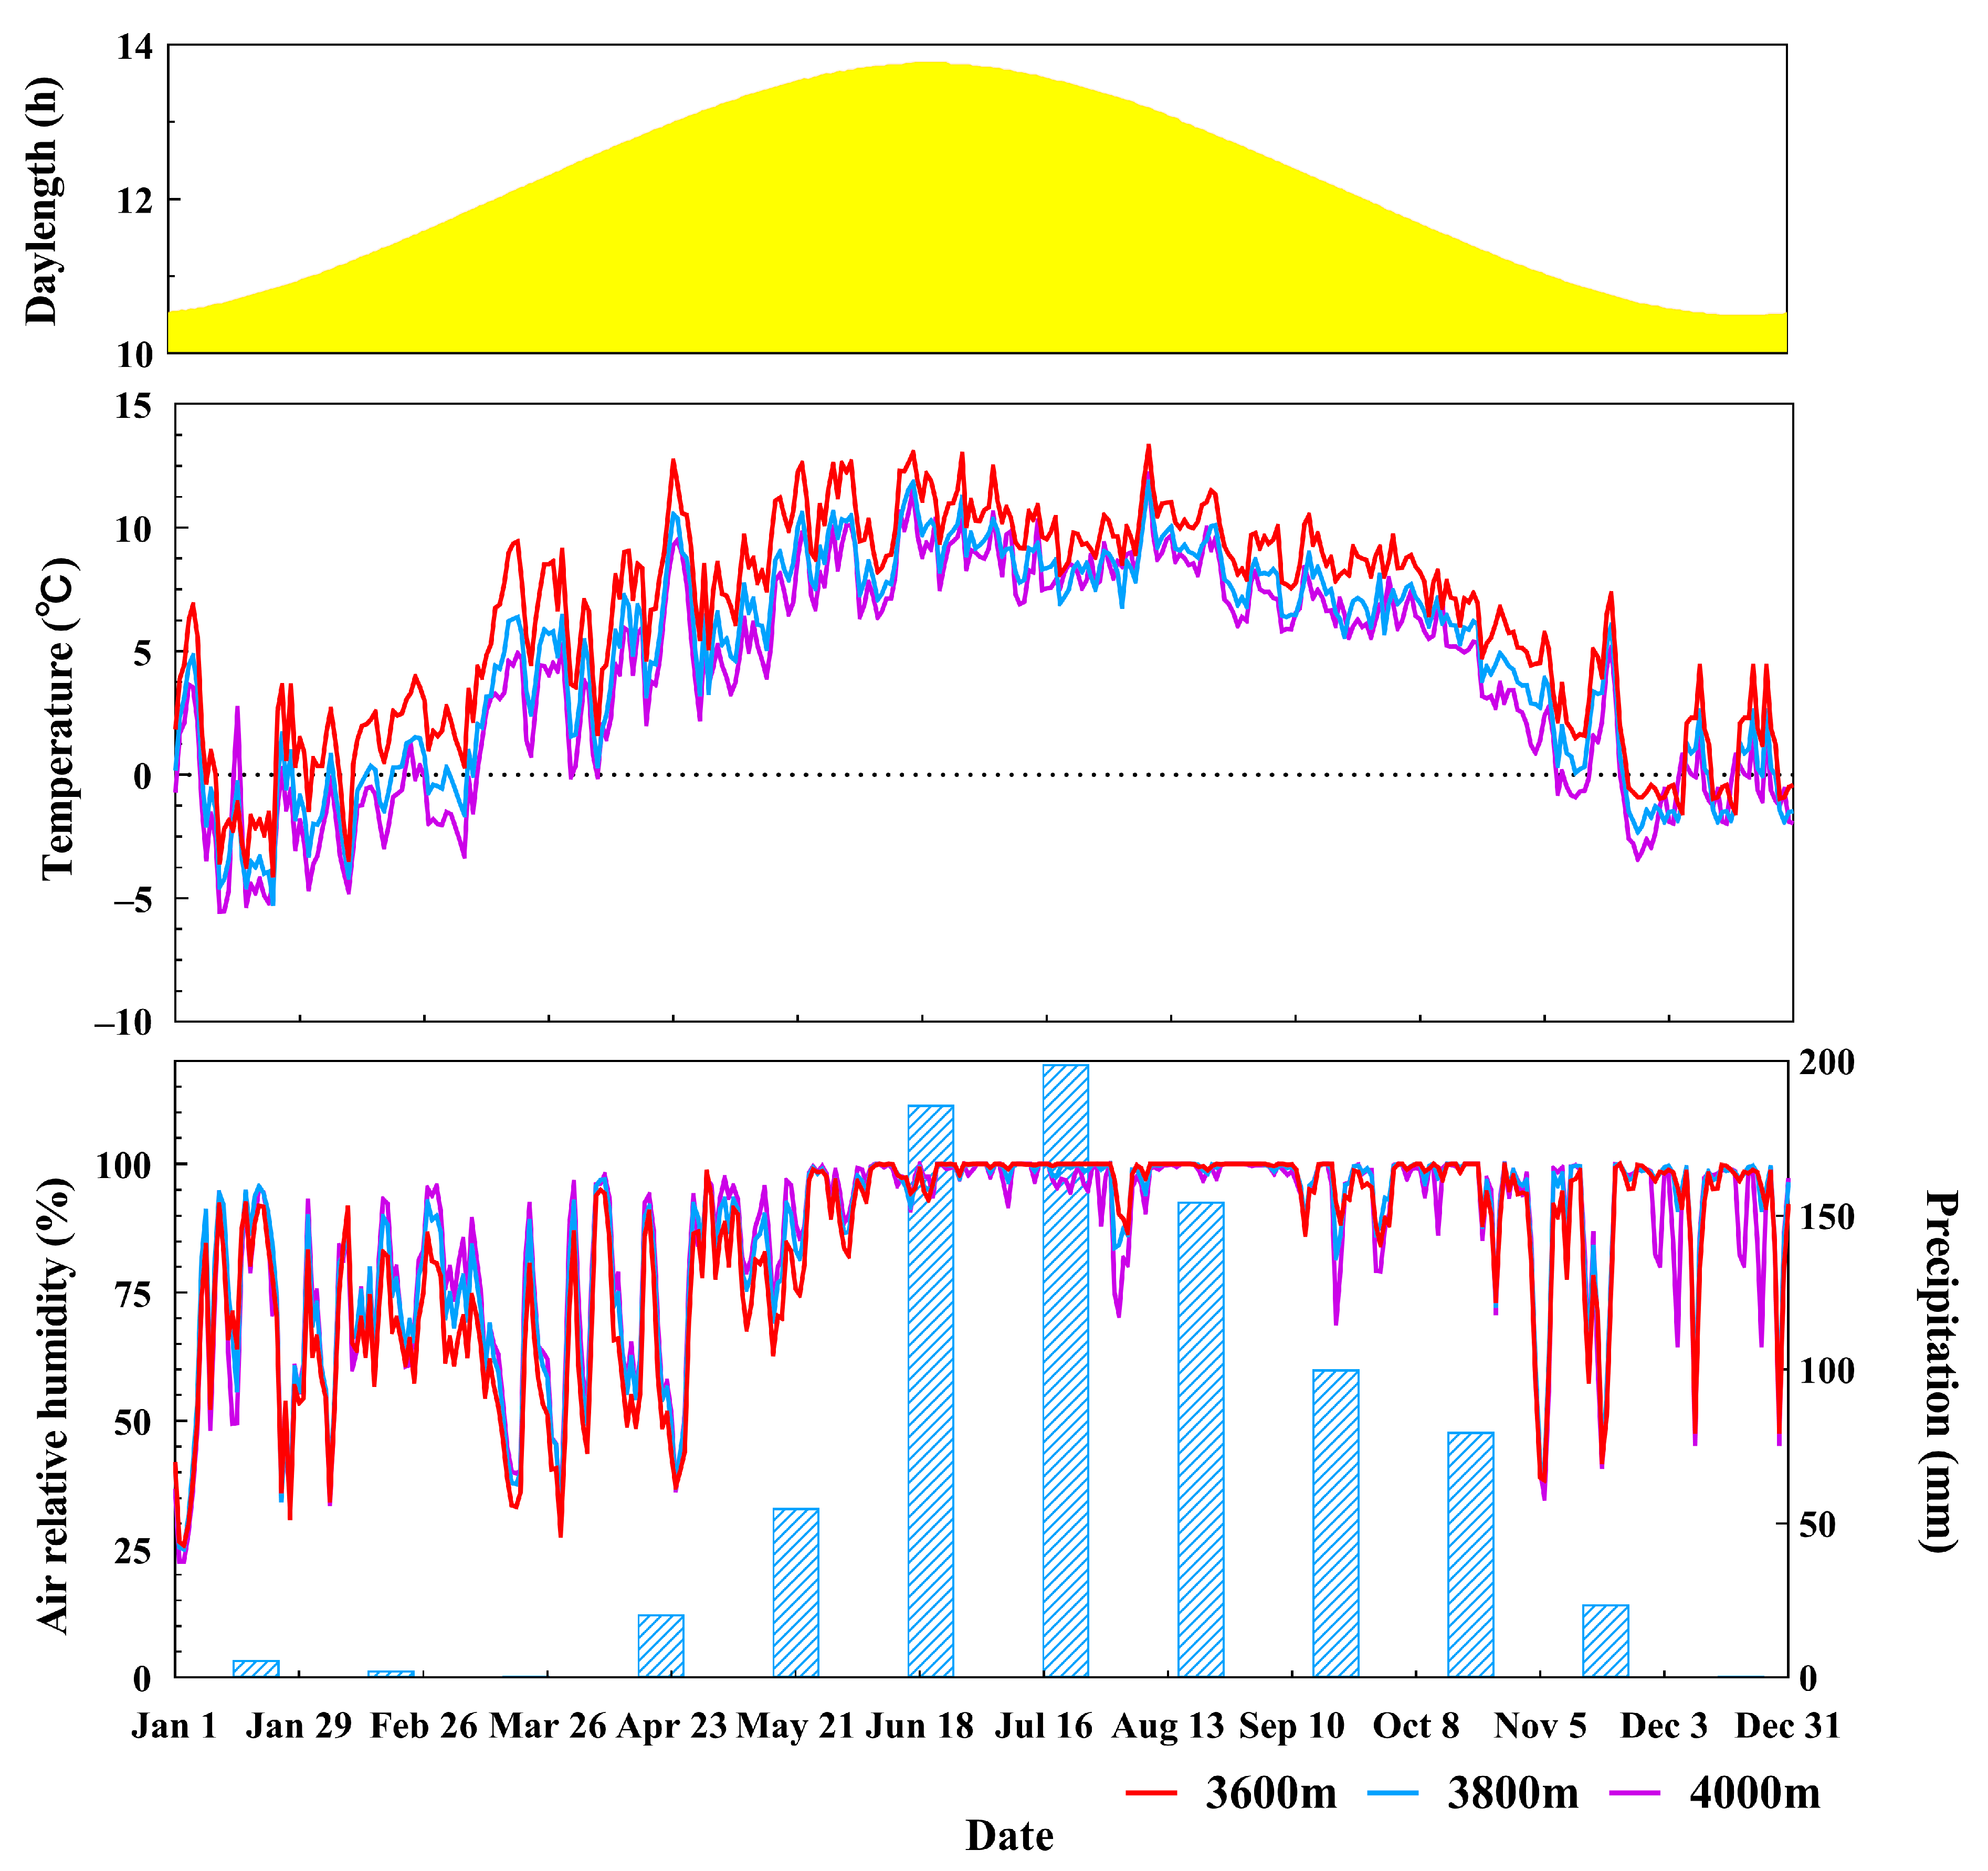
The climatic conditions of the studied area followed seasonal patterns representative of a cool and temperate climate. The day length of the study area followed a symmetric bell curve, reaching a maximum of about 14 h during the summer solstice (the 21st of June) and a minimum of 11 h during the winter solstice (the 21st of December). The change trends of the canopy air temperature of the three altitude sample plots were the same (Figure 3). However, the daily air temperatures exhibited a bell curve slightly skewed to the right, peaking at 25 °C ± 2.4 °C during summer (July–August) and dropping to −9 °C ± 1.3 °C during winter (December–January). The average and minimum air temperature decreased with the increase in altitude (Table 2). Precipitation was regularly distributed over the year, with two slightly drier periods before May and after October. Due to the abundant and regular rains in the growing season, the relative humidity (RH) was usually high.

3.2. The Earlywood to Latewood Transition Timing

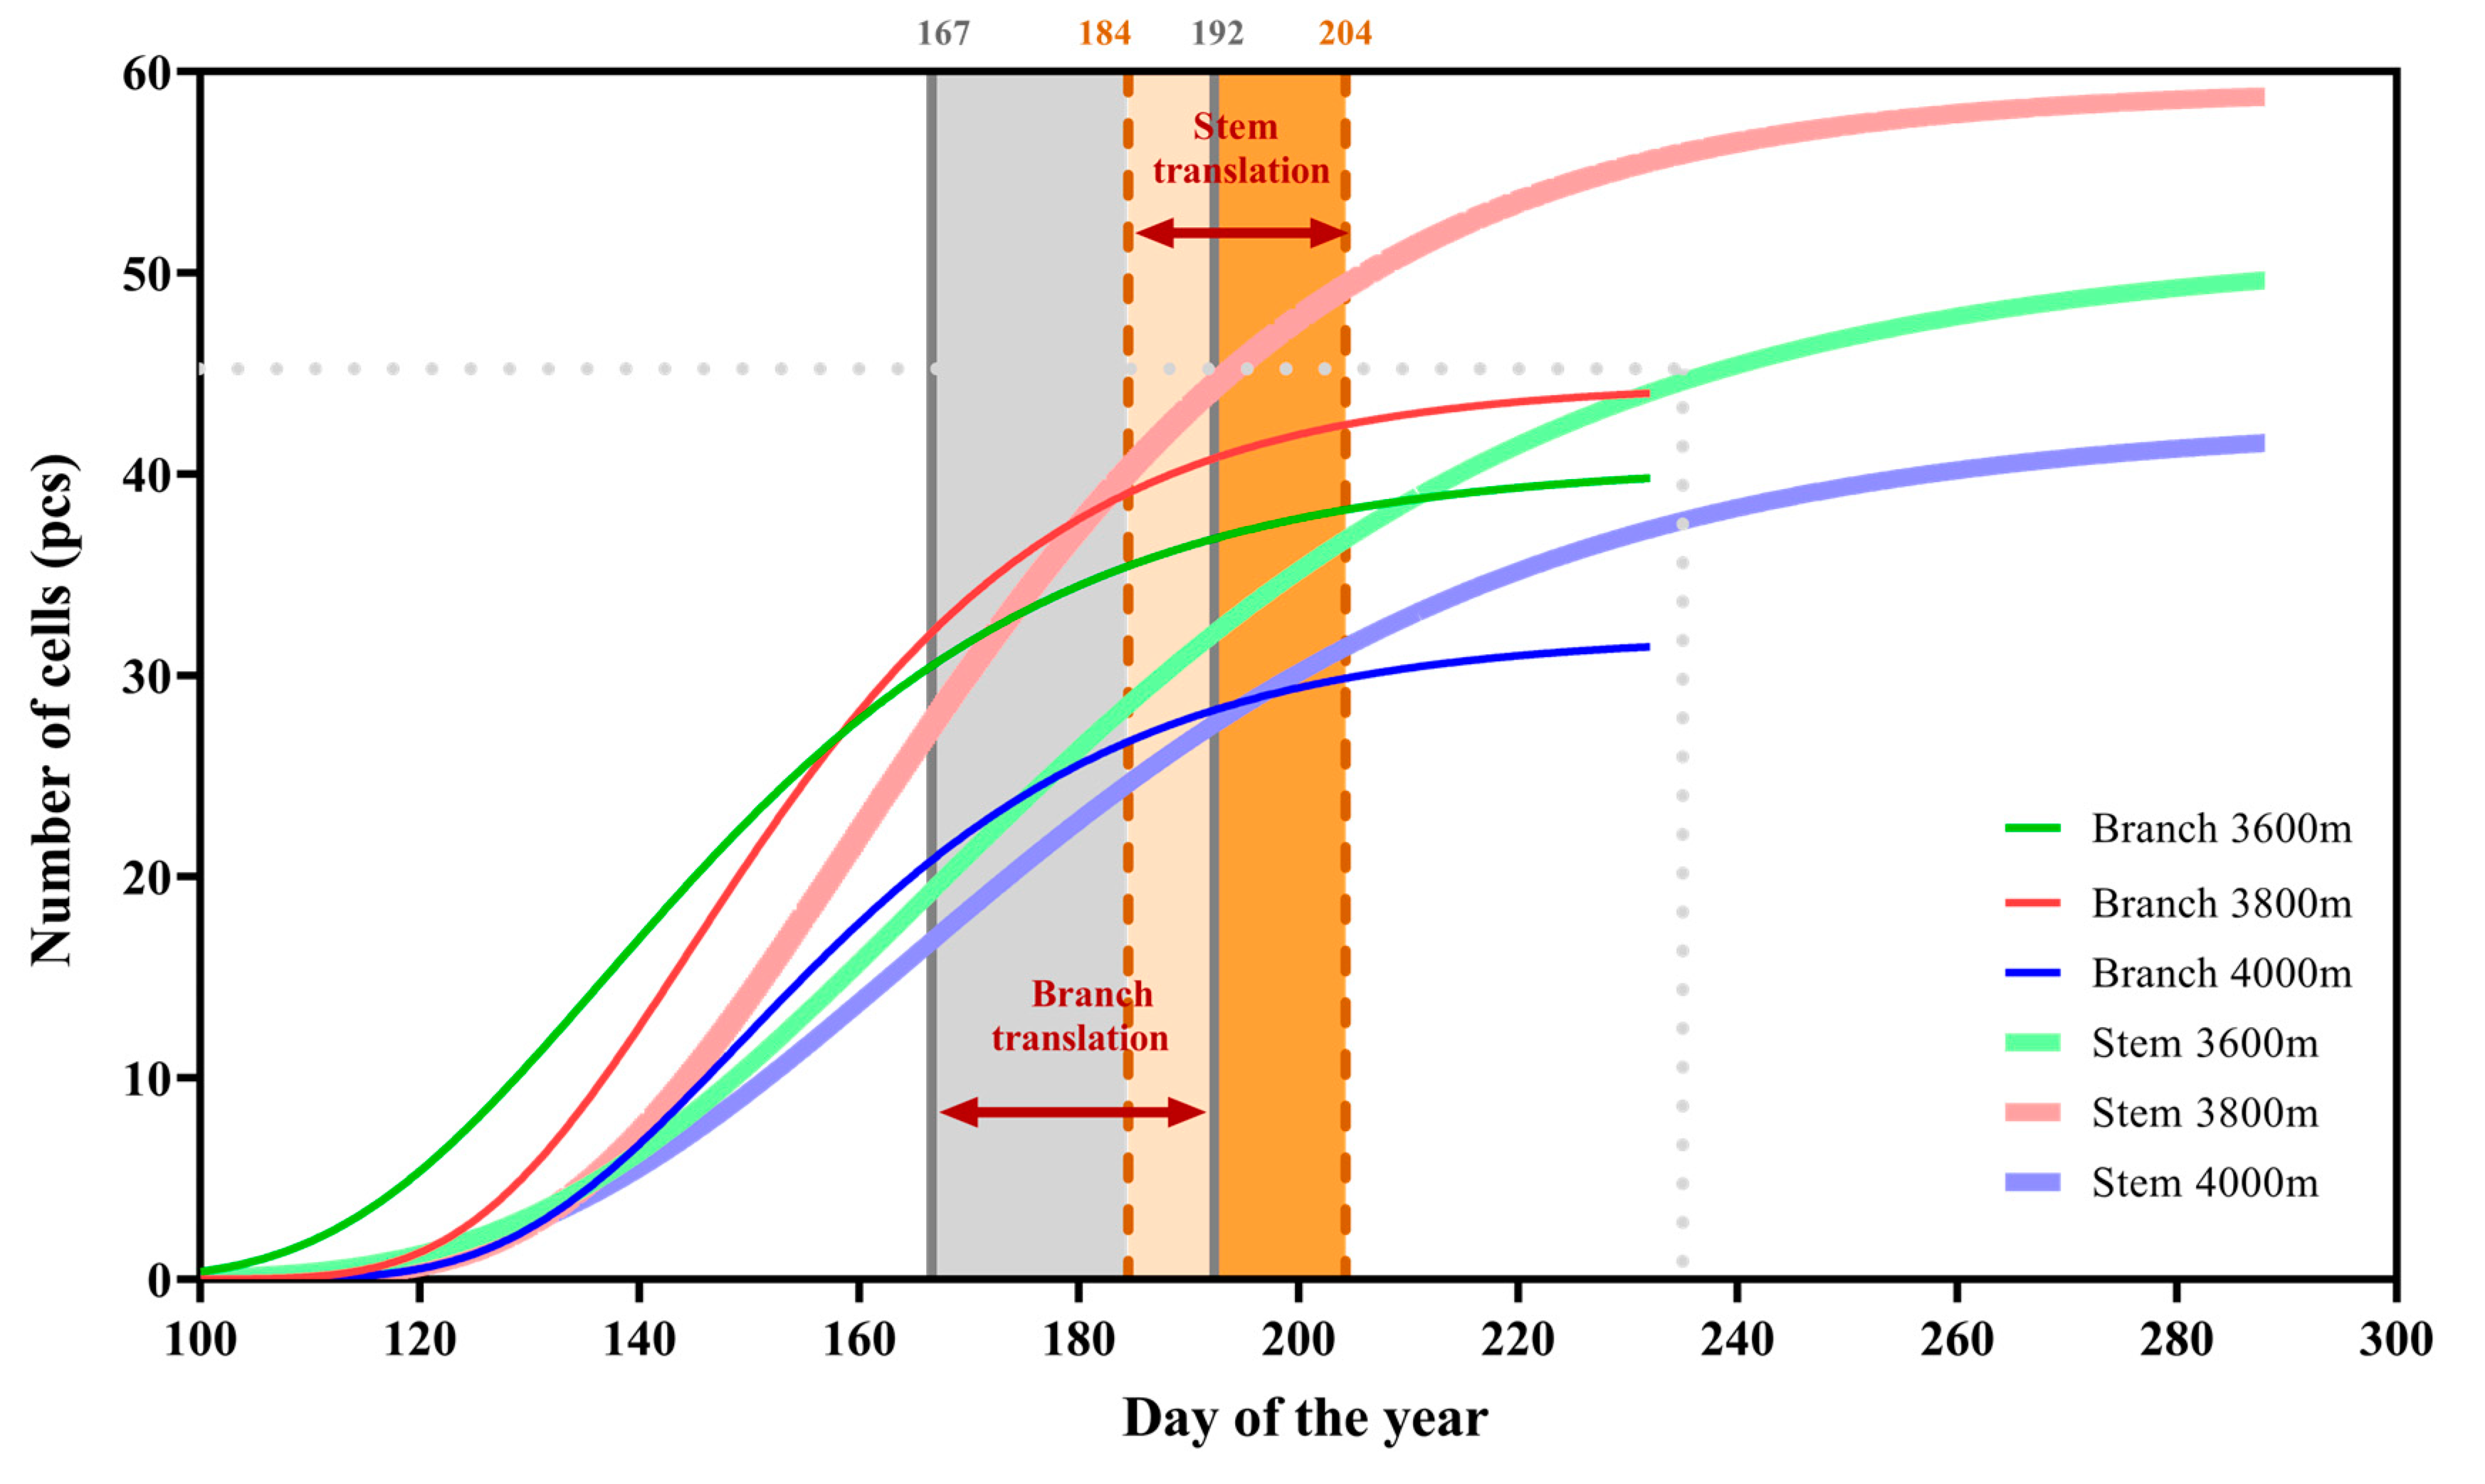
This study aimed to investigate the differences in the timing of tree ring phenological events between the branches and stems at different altitudes. The results showed that the growing season and wood transition of branches started and ended earlier than in stems, meaning that the growing season and wood transition duration was longer for stems (Figure 4 and Table 3). Elevation did not affect the transition from earlywood to latewood in branches and stems, indicating that the transition was independent of altitude changes (Table 3). Moreover, the wood transition of branches and stems was not significantly different between the altitudes. These findings showed differences in the timing and duration of the growing season and wood transition between branches and stems. Specifically, branches have shorter growing seasons than stems, but their transition duration is longer. Therefore, these results provide insights into the phenological differences between branches and stems and their relationship with altitude changes. The findings also provide valuable insights into the growth patterns of trees, which can contribute to our understanding of forest ecology.
As shown in Table 3, elevation did not impact the transition from earlywood to latewood in branches and stems. The transition onset in branches and stems was not significantly different at all altitudes, except for 4000 m (p = 0.201 > 0.05), while its end time only differed significantly at 3800 m (p = 0.037 < 0.05). Therefore, our hypothesis that elevation change is not a regulating factor of earlywood to latewood transition was confirmed. There was no significant difference in the start and end time of the earlywood to latewood transition at different altitudes (p > 0.05).

3.3. Kinetics of Tracheid Development and Tree Ring Structure

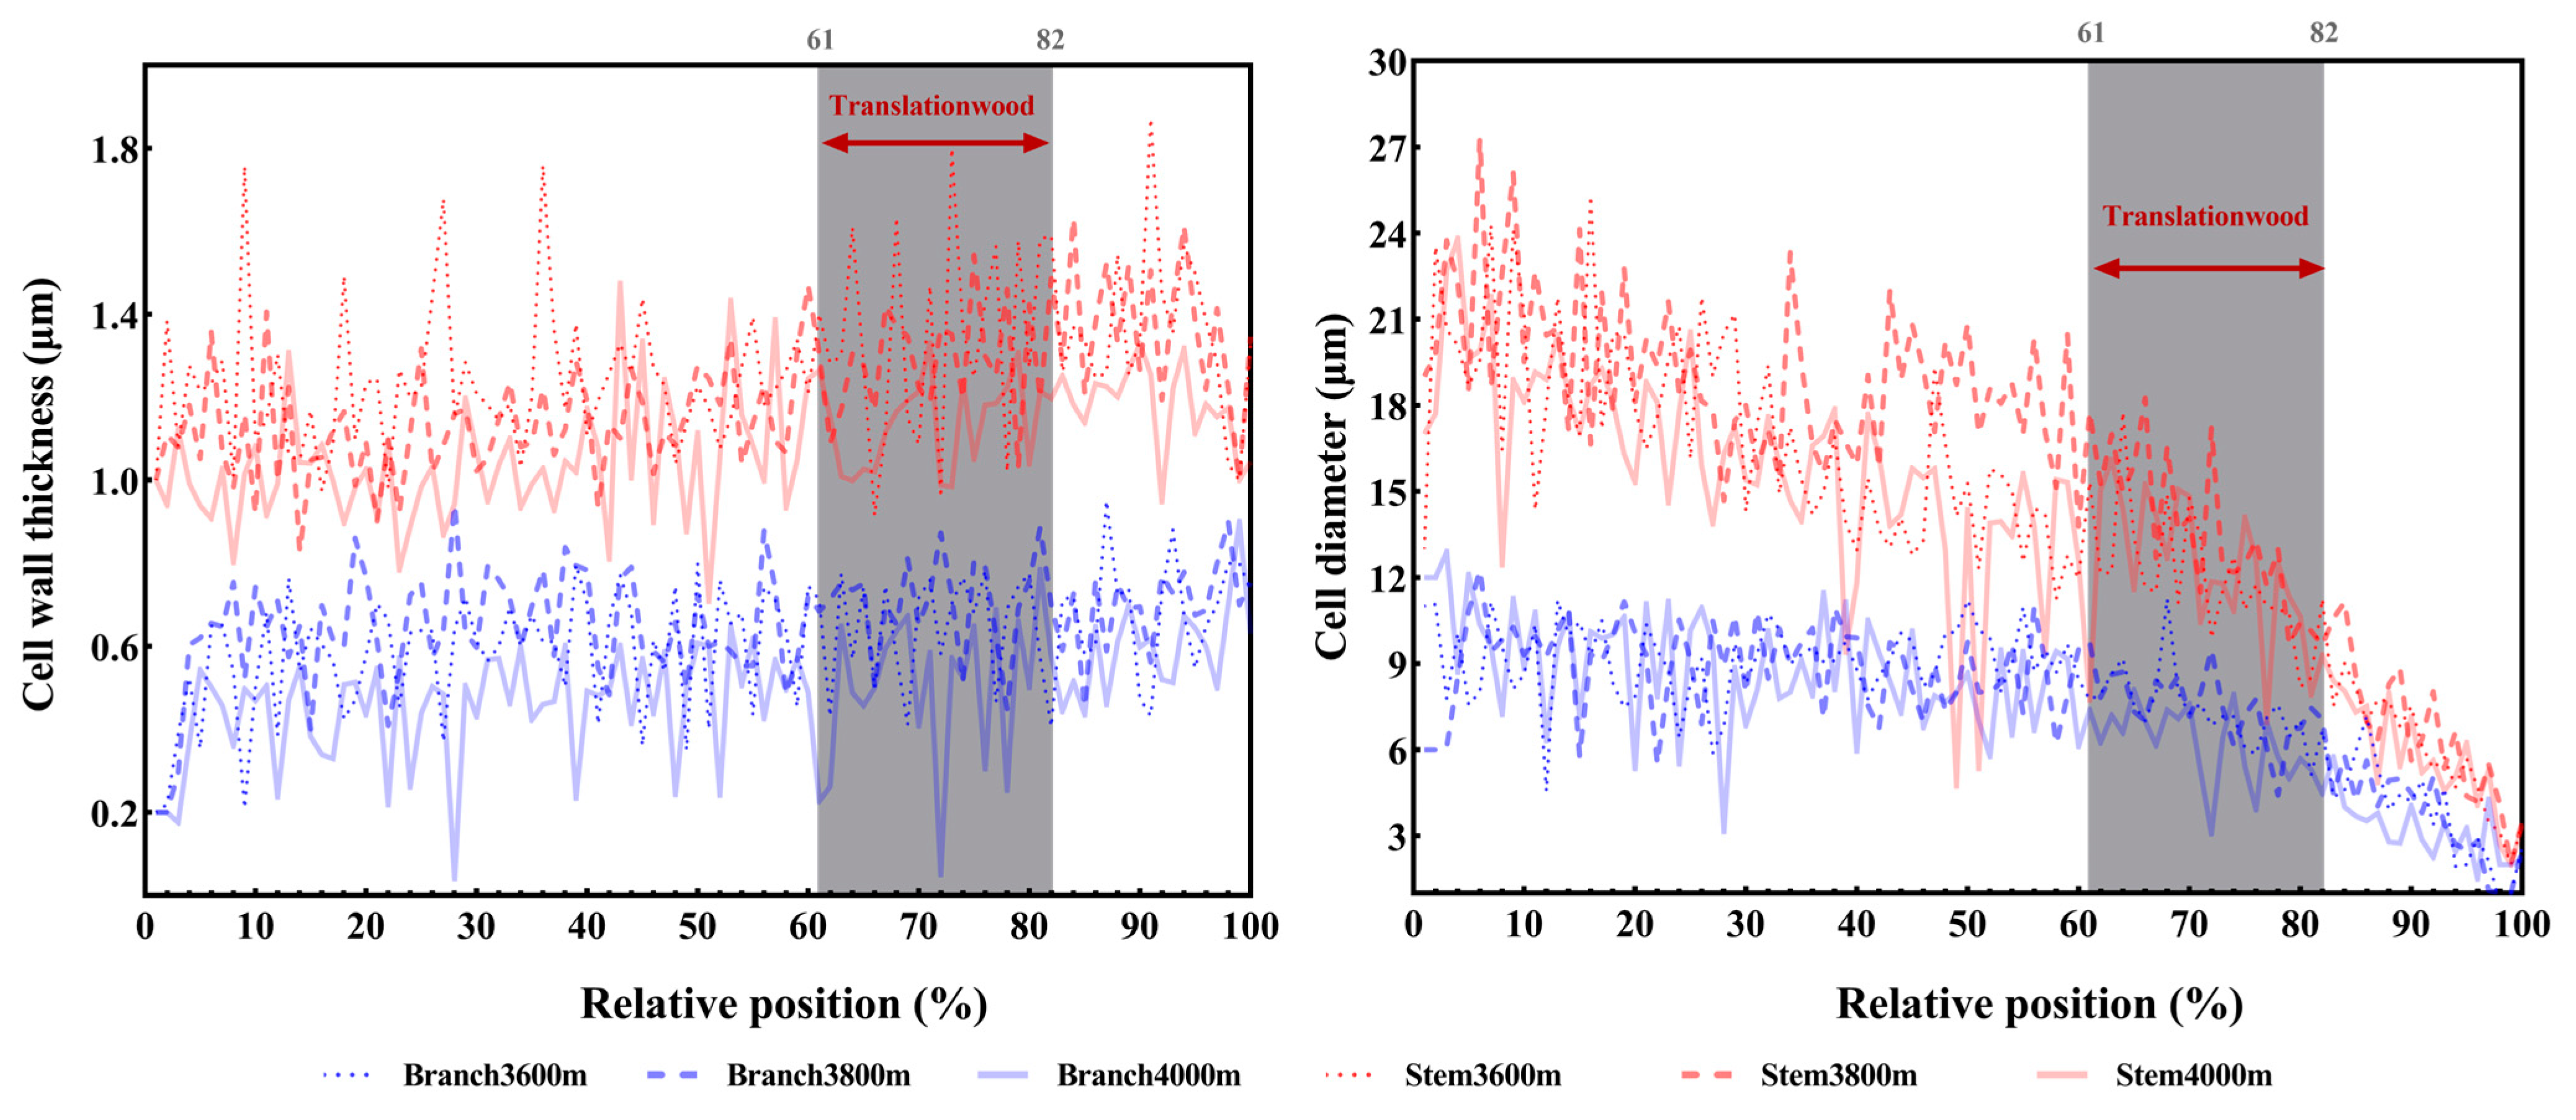
We found significant anatomical differences between the branches and stems regarding cell wall thickness and cell lumen diameter (Figure 5 and Figure 6, Table 4). The cell wall of stems was thicker than that of branches, and their cell lumen diameter was larger than that of branches. The earlywood to latewood transition occurred in 60% of the total annual cells, regardless of the elevation. The cell expansion duration did not differ significantly between the branches and stems at different altitudes. However, the cell wall deposition rate of stems was higher than that of branches, but the rate was highest at 3800 m and lowest at 4000 m for both branches and stems. These findings provide insights into the kinetics of tracheid development and tree ring structure, which could implicate the understanding of tree growth and adaptation to different environments.

3.4. Effect of Light, Temperature, and Humidity on the Earlywood to Latewood Transition

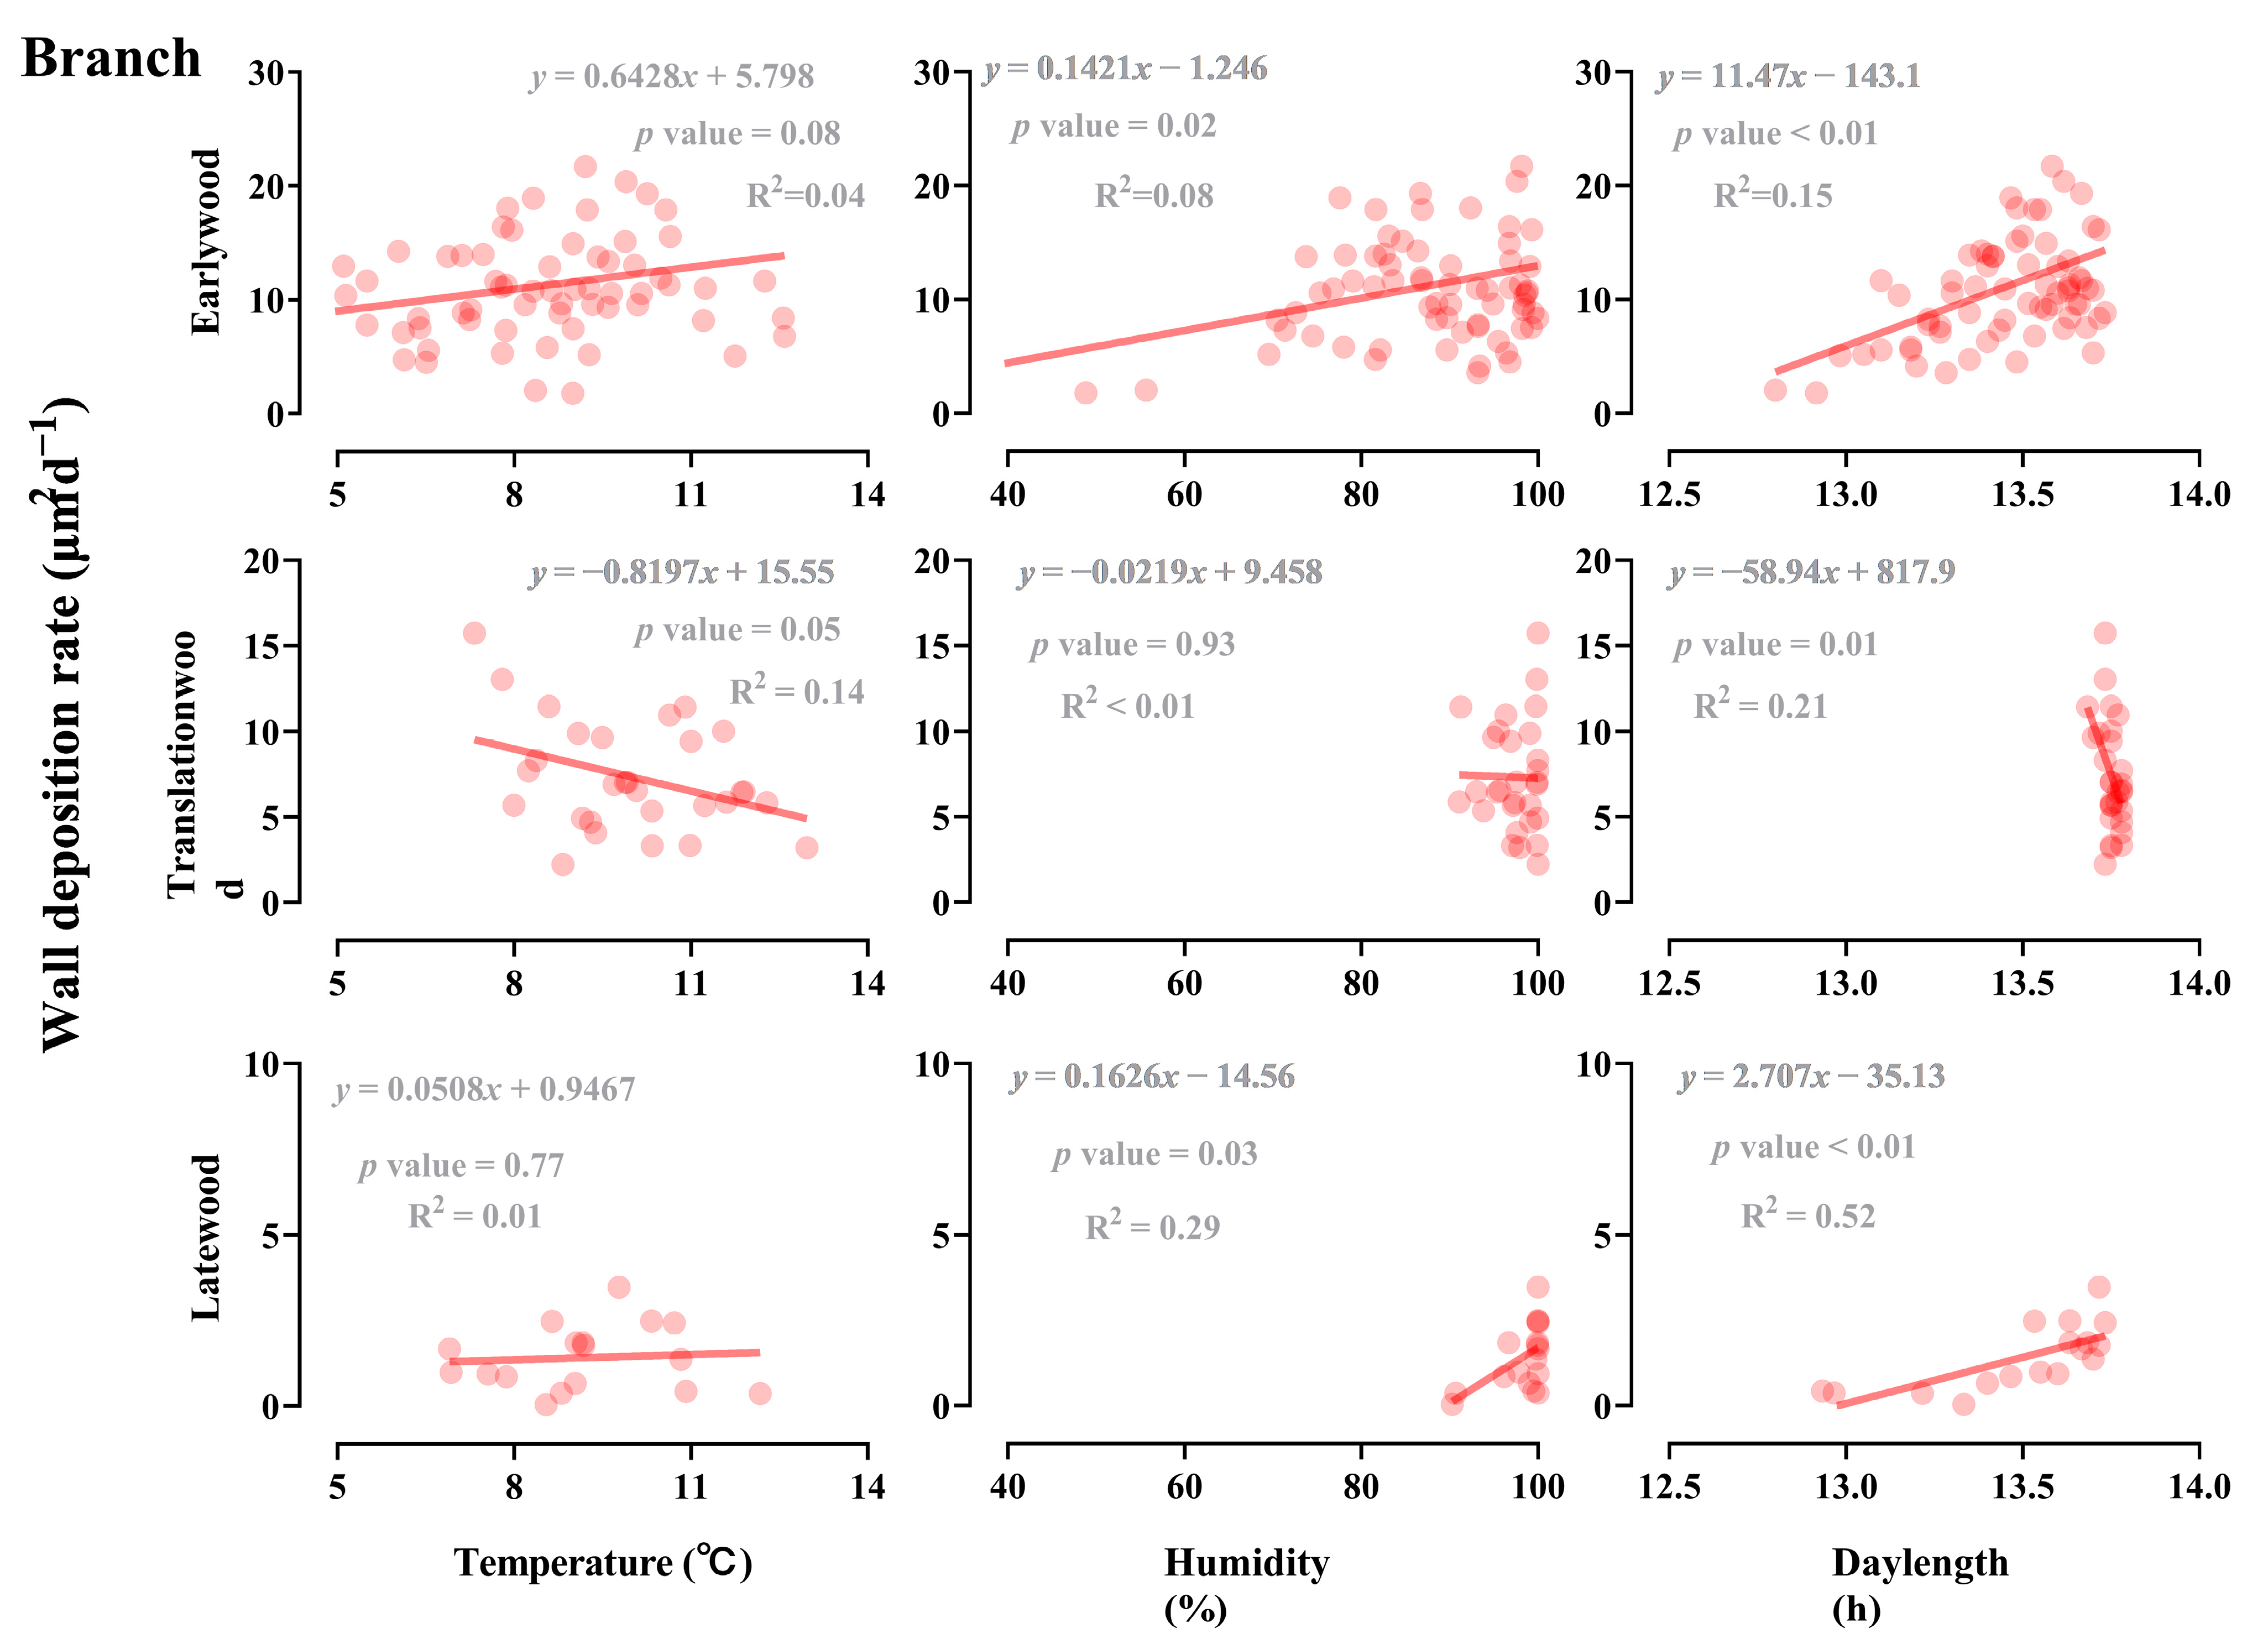
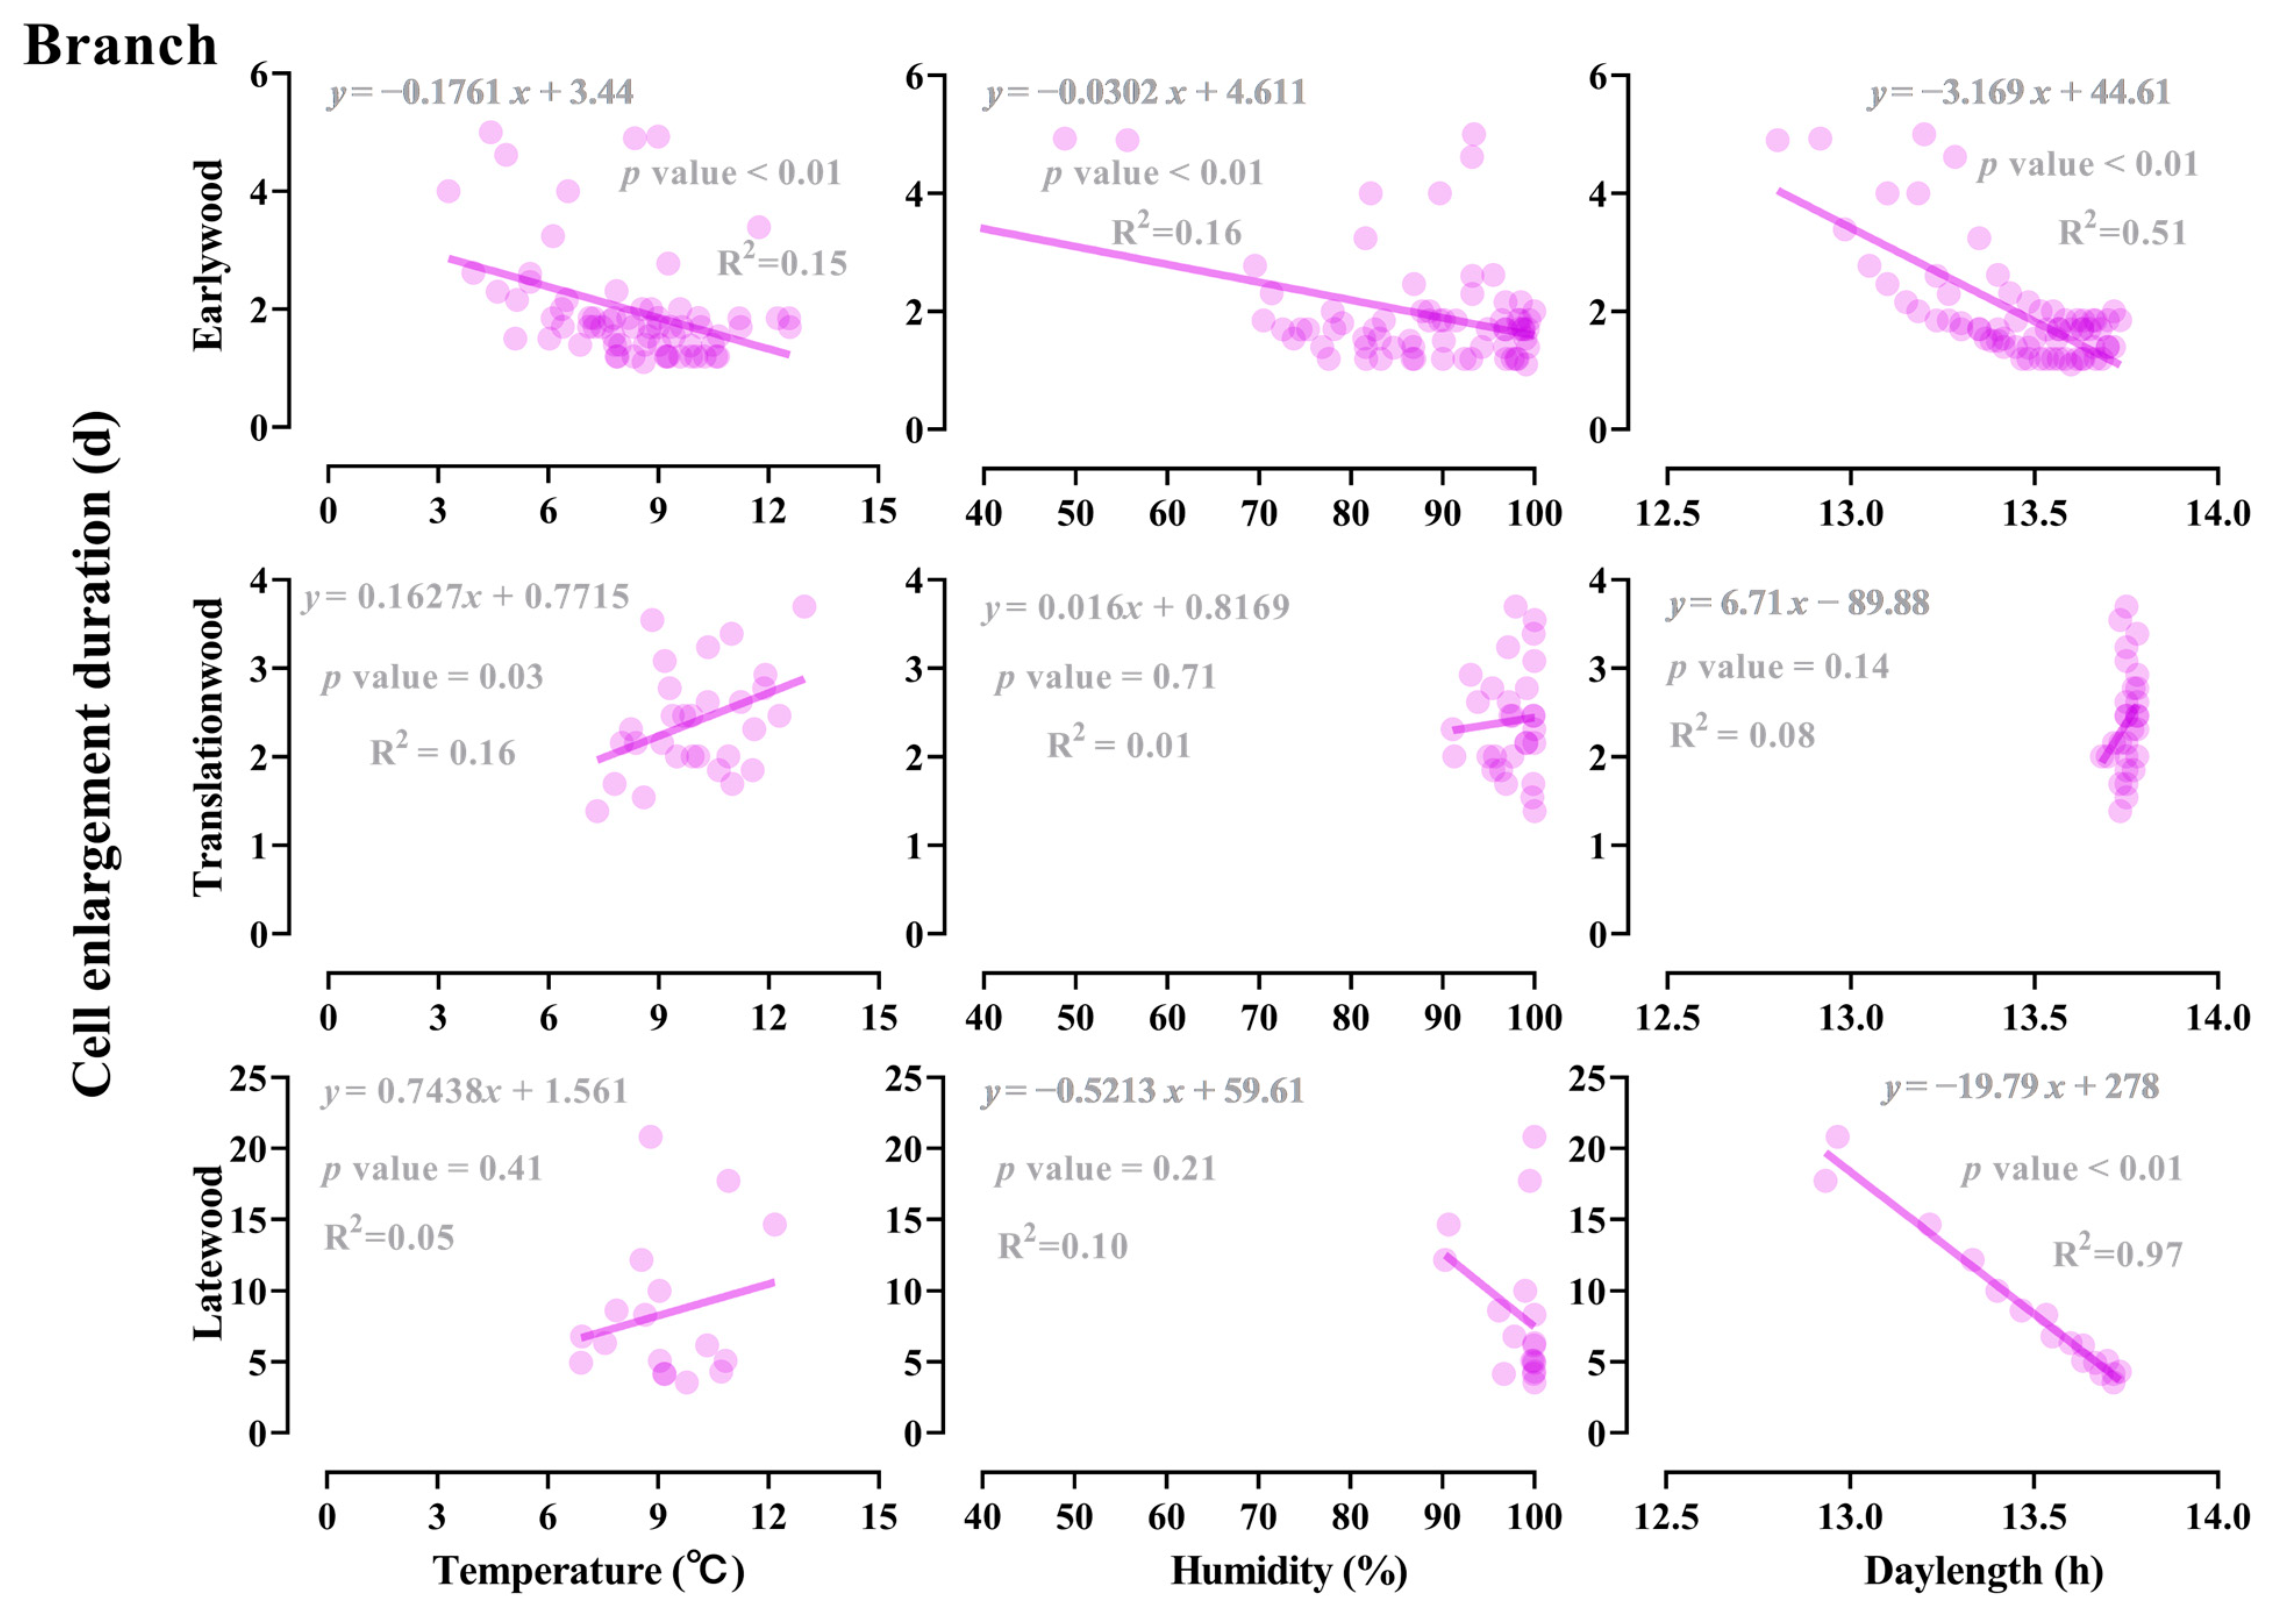
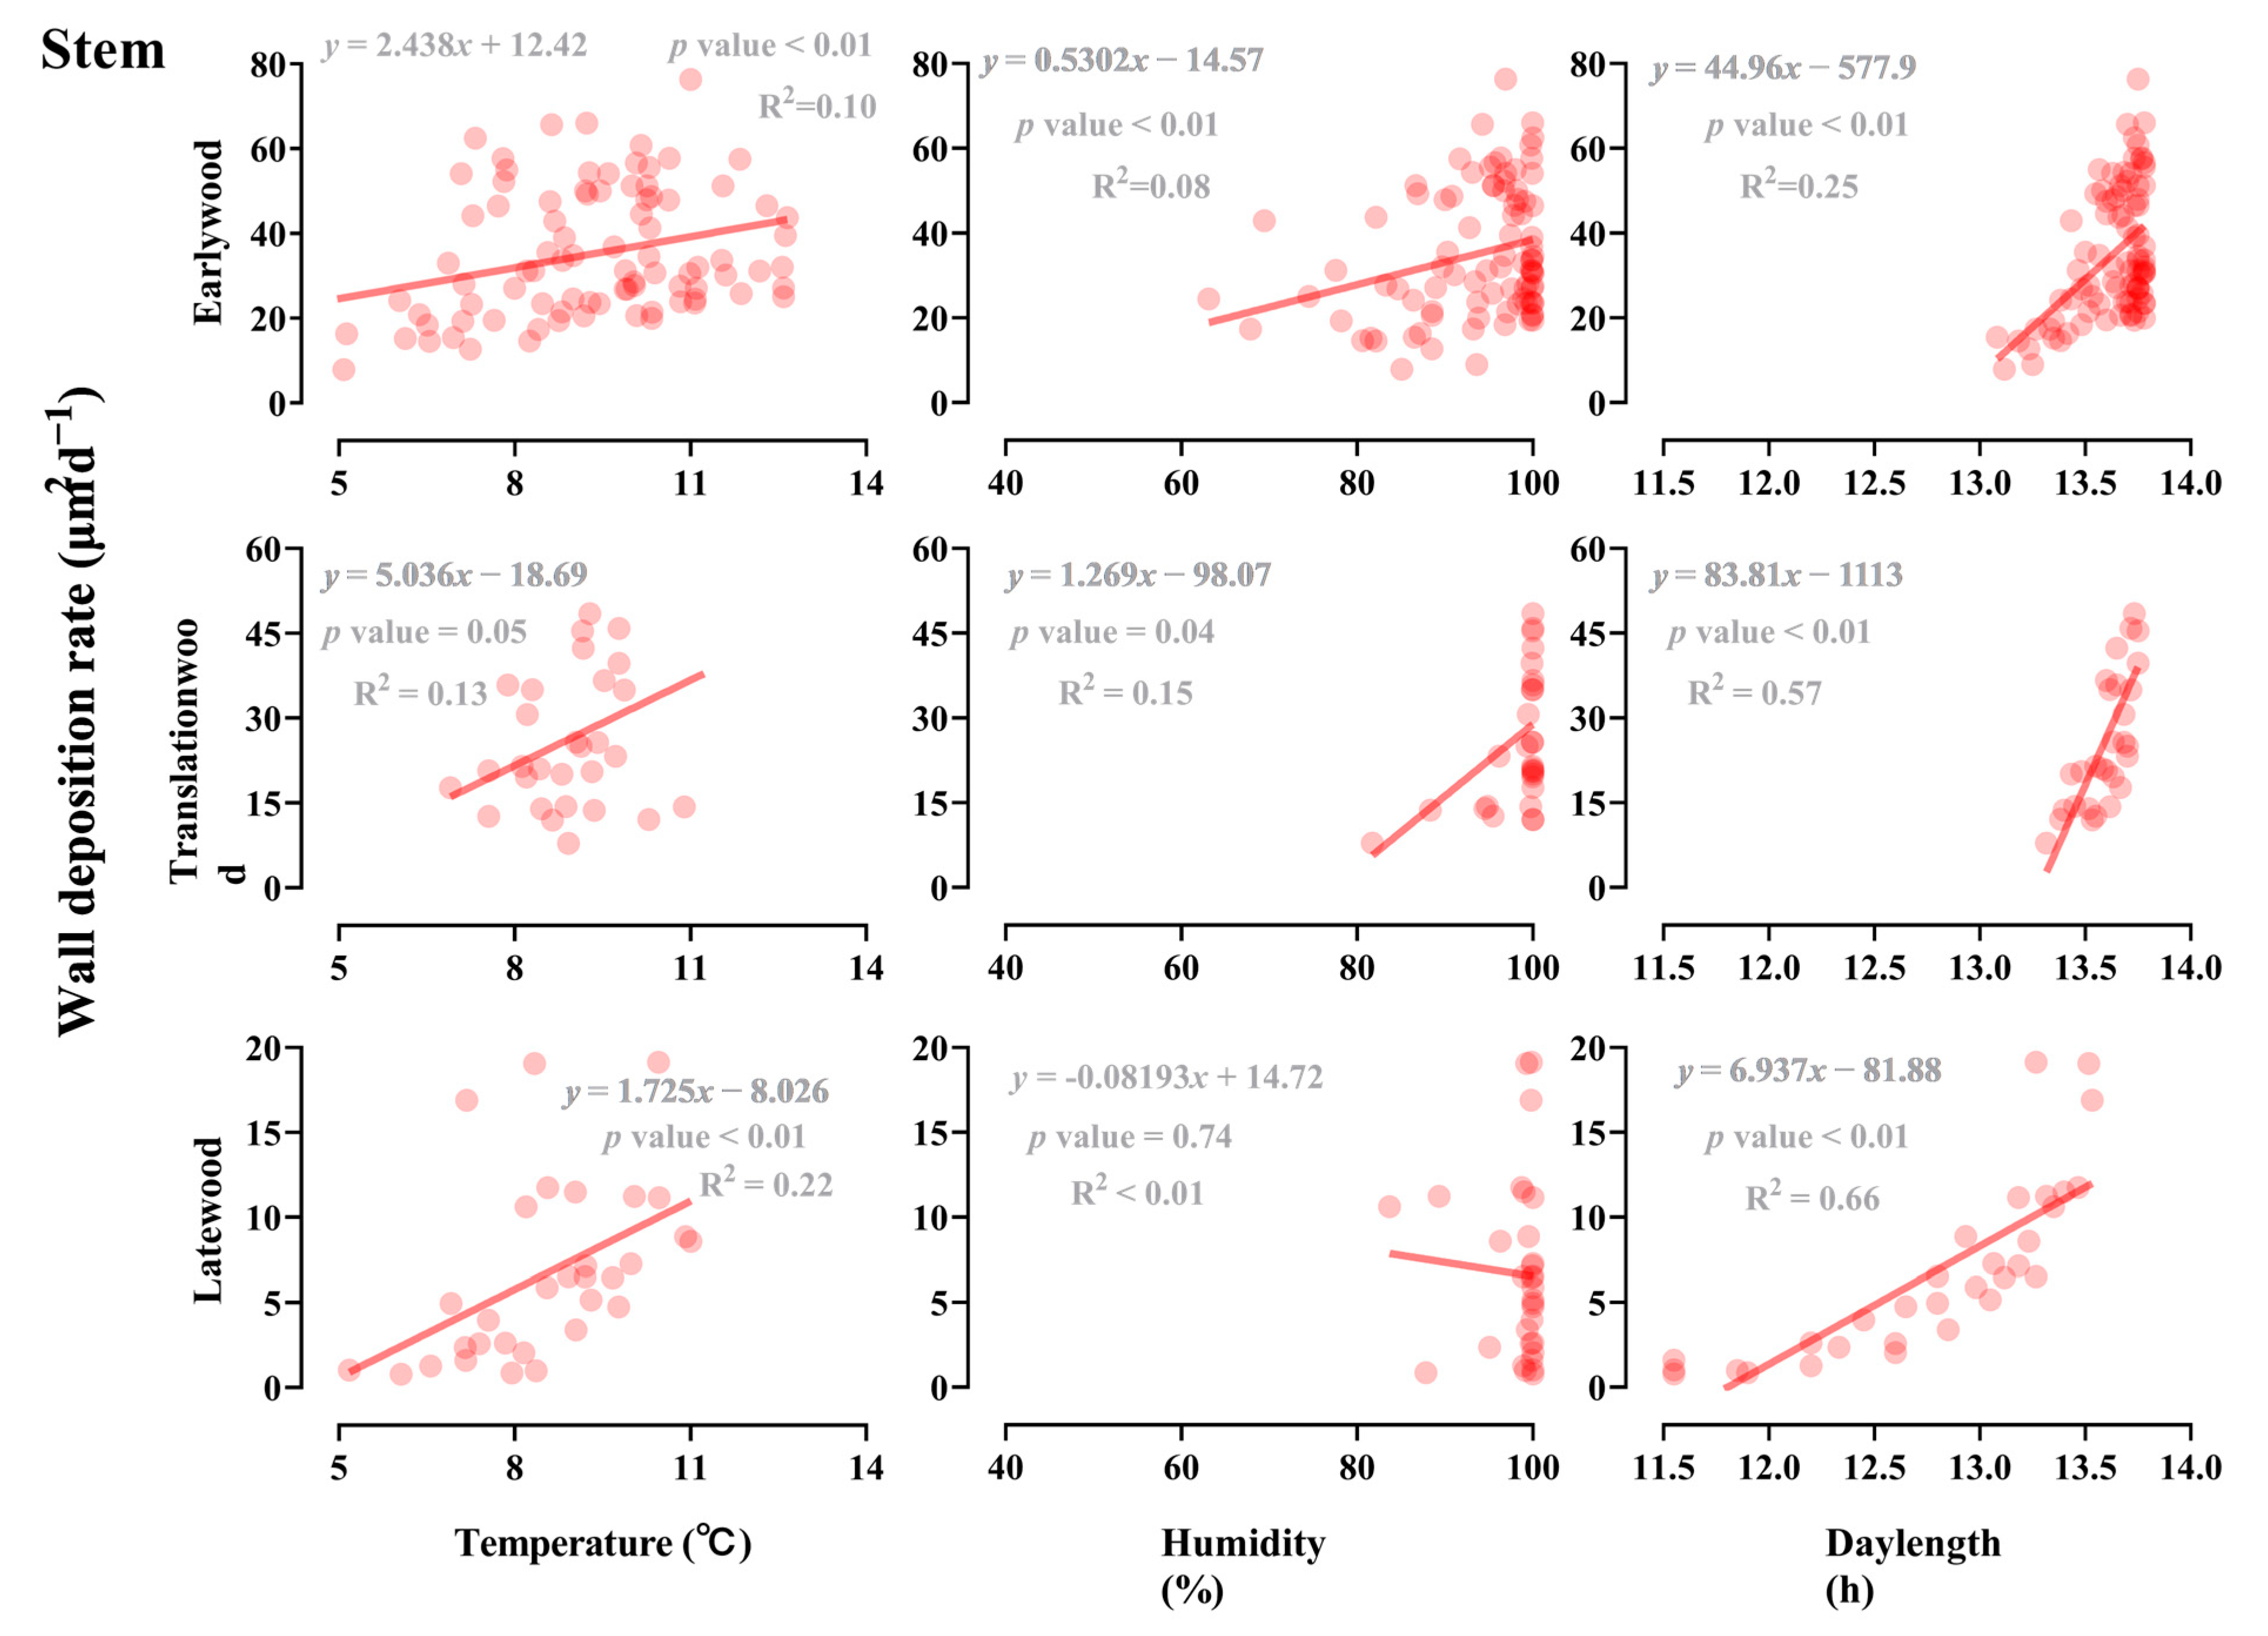
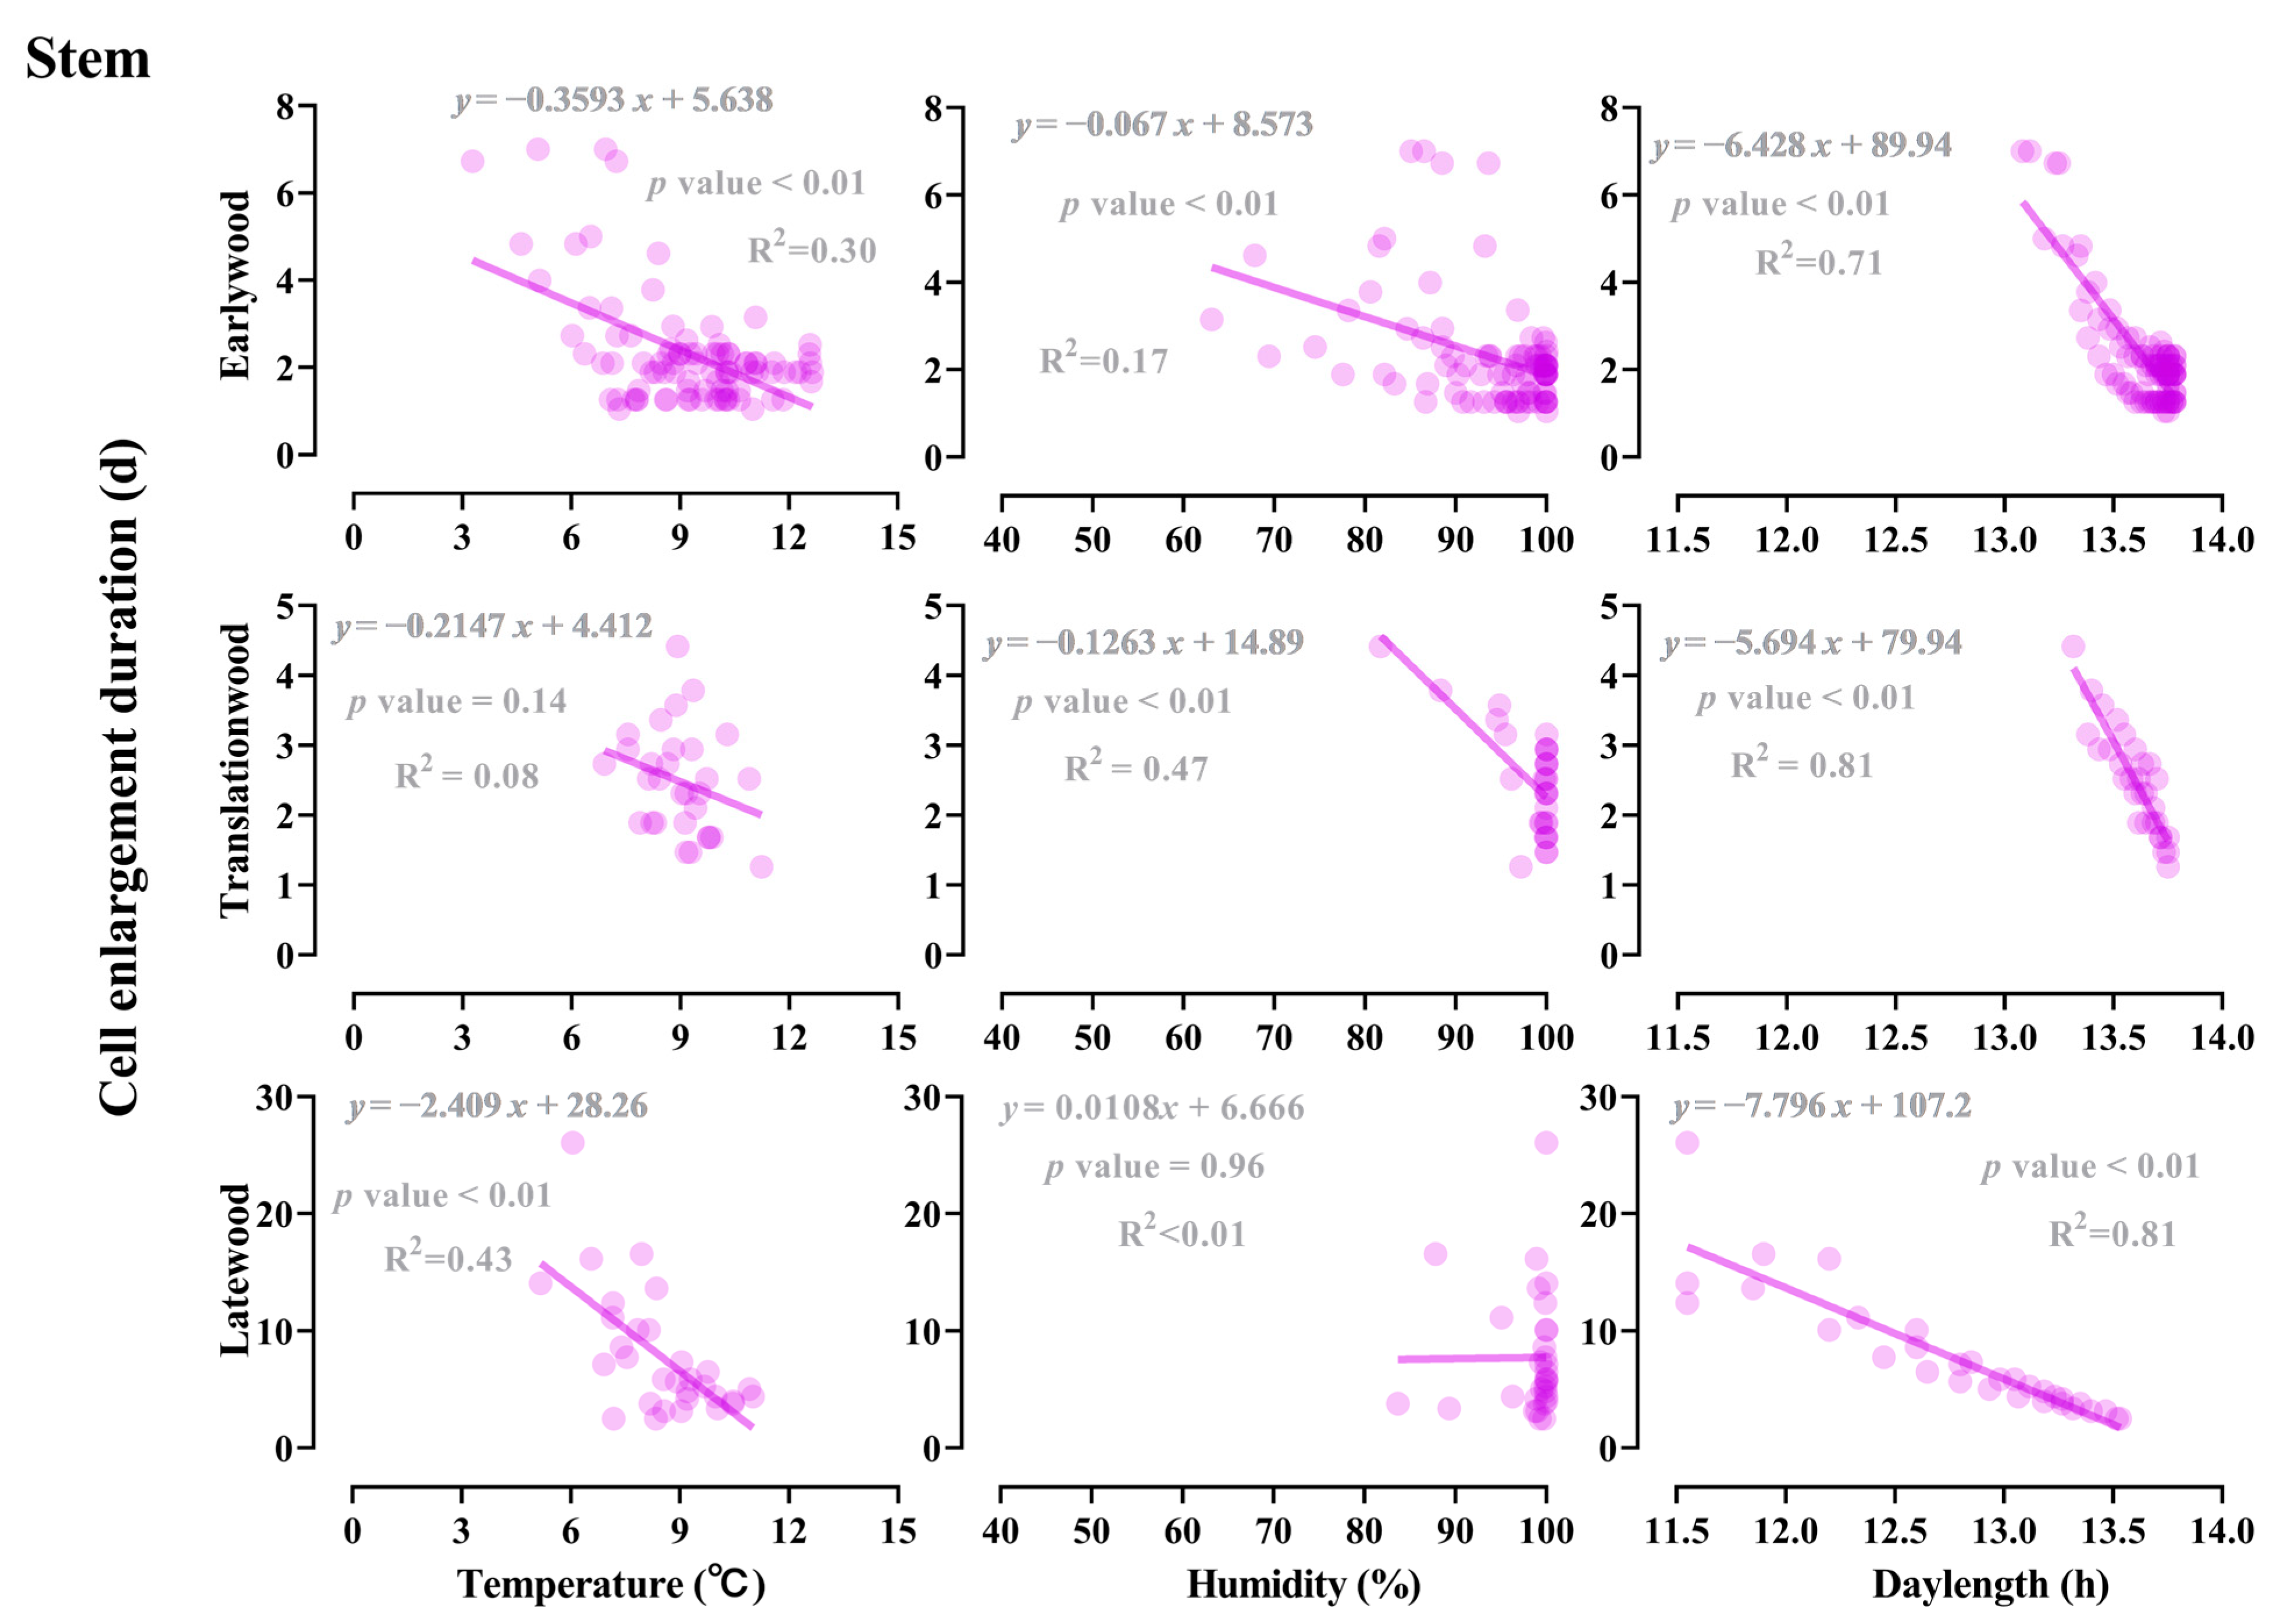
Light, temperature, and humidity had varying degrees of impact on shoot and stem development. Day length had the greatest impact on the cell wall deposition rate and cell enlargement duration of branches and stems, followed by temperature and humidity (Figure 7 and Figure 8). The longer the light duration, the higher the cell wall deposition rate and the shorter the time required for cell lumen expansion (Figure 7 and Figure 8). Similarly, the higher the temperature, the higher the cell wall deposition rate of stem transitional wood and latewood, and the shorter the time required for the cell lumen expansion of stem earlywood and latewood (Figure 9 and Figure 10). The higher the humidity, the higher the cell wall deposition rate in late-branch timber and the shorter the duration of cell lumen enlargement in early-branch timber (Figure 7 and Figure 8). These findings provide important insights into the factors influencing the growth and development of trees and can help inform forest management practices.

3.5. Influence of Developmental and Climate Factors on the Earlywood to Latewood Transition

We assessed the impact of various environmental factors, including light duration, temperature, and humidity, on the earlywood to latewood transition in stems and branches. Our findings indicated that these environmental factors significantly influenced the earlywood to latewood transition (p < 0.01, Table 5). Interestingly, changes in light duration (OR stand for odds ratio, ORBranch = 12.44, ORStem = 79.49) had a much stronger effect on the earlywood to latewood transition compared to temperature (ORBranch = 0.60, ORStem = 0.80) and humidity (ORBranch = 0.87, ORStem = 0.90).
Furthermore, we observed that developmental events occurred earlier in branches than in stems. Using a generalized linear model, we assessed the impact of branch developmental processes on the transition from early to late stem material. We found that the cell expansion duration and cell wall deposition rate of branches significantly influenced the transition (p < 0.05) (Table 6). Notably, the cell wall deposition rate (OR = 1.03) had a greater effect on the transition from early to late stem material compared to the cell expansion duration (OR = 0.59) (Table 6).

4. Discussion

4.1. The Earlywood to Latewood Transition Time Is the Same along the Altitude Gradient

We investigated the effect of elevation on the transition time from earlywood to latewood formation and found that the transition time was consistent along the elevational gradient. There was no significant effect of the elevation on the transition time. Similarly, previous studies on Norway spruce also found consistent transition dates among trees within the same region, despite the different transition times in different regions [28]. However, the transition time of the phloem is delayed with increasing altitude, probably due to the temperature regulation of the formation layer activity [29].
Several studies on different altitudes found a consistent delay in the spring activation of the cambium at higher altitudes [30,31,32]. The cell formation along the elevational gradient is influenced by the non-linear effect of temperature, which is important for the cambial onset [33]. However, the earlywood to latewood transition timing in the xylem was consistent across different elevation gradients, suggesting that the transition events are largely independent of environmental factors.
Our investigation showed that the average timing of xylem transition among the three sites was the 5th of July (DOY 186), similar to the enlargement onset documented for the first latewood cells of Norway spruce in the Vosges mountains of France [1]. The timing also matches almost exactly the 18th of July, identified for ponderosa pine in two subsequent years in the Mojave Desert of Nevada in the USA [34]. This similarity in transition dates could suggest a considerable influence of the photoperiod, which is necessary for cell maturation for each latewood tracheid [35,36,37].

4.2. Photoperiod Is Closely Related to the Cell Development Process

Photoperiod plays a crucial role in regulating plant growth and dormancy induction [38,39]. The light duration is closely related to the cell wall deposition rate and cell expansion duration [40,41]. Therefore, the changes in photoperiod length can lead to corresponding shifts in external plant morphology and internal biosynthesis to cope with the ensuing environmental conditions, such as low temperatures [42,43]. Photoperiod changes affect the expression of endogenous genes, which is an adaptive response capable of adjusting the plant’s growth to a specific level [44,45,46]. Additionally, light quality signals can indirectly affect the induction and release of plant dormancy through plant physiological and metabolic processes [47,48]. Phytohormones are involved in the induction or release of plant winter dormancy and thus regulate plant adaptation to the environment [49].
The effect of temperature on the developmental process of early- and latewood was not as strong as that of the light duration changes, especially in branches [50]. The cell wall deposition rate in stem latewood was strongly related to temperature, probably because lignification is highly temperature-sensitive, especially during latewood formation [51]. Moreover, the effect of humidity on the development of early- and latewood on both branches and stems was minimal and had no clear pattern [52].
The findings of our study highlight the importance of the photoperiod in regulating plant growth and dormancy induction, and the complexity of temperature effects on wood development.

4.3. The Earlywood to Latewood Transition Occurs Earlier in Branches Than in Stems

The early- to latewood transition time of branches preceded that of stems, independent of altitude. This may be due to the gradient in hormone concentration [53]. Plant growth hormones play crucial roles in activating the cambium, inducing xylem and silique production, and regulating the rate and duration of xylemogenesis [54,55]. With the top–down transport of growth hormones, the periphytic division of the formative layer also starts from the branch base expanding downward toward the stem. Therefore, it can be inferred that branch terminal and lateral meristems are closely related, and the top–down hormone transport may result in delayed stem-forming layer activity than the branch terminal meristems.
A study also found that a hormonal signal induces latewood formation in temperate regions [56]. Toward the end of the growing season, a signal from the crown induced the formation of narrow latewood cells by decreasing the enlargement rate of tree rings. Day length-driven signals are necessary for trees to anticipate temperature changes that could hinder growth or damage immature cells in temperate regions. This allows some tree developmental processes to be completed before unfavorable conditions emerge.
We observed that the intra-annual cell growth rate of branches and stems differed significantly. The cell growth rate of branches rapidly decreased with the increase in altitude, and the decrease was the largest at the treeline. In essence, trees and their organs with fewer cells become smaller. Plant organ size changes related to adverse conditions are related to cell number rather than size. Hence, cell size is strongly regulated by genetics compared to organ size. Since branches are more sensitive to environmental changes, they sense the changes and transmit the signals down to the stem, causing a difference in transition time.

4.4. Factors Regulating the Earlywood to Latewood Transition in Different Parts of Trees

The earlywood to latewood transition in trees is influenced by multiple environmental factors, not just a single factor [57]. The tree branches are especially sensitive to environmental changes and play a crucial role in sensing these changes [41]. Previous studies found no significant effects of environmental factors on the earlywood to latewood transition, possibly because the studies focused on the stem, which is less influenced by the environment [58,59]. The earlywood to latewood transition is likely an integrated process resulting from the synergistic effects of multiple factors [57].
Various factors are involved in the formation of tree rings, including physical factors and environmental limitations such as water stress caused by drought or wet seasons [60]. An earlywood–latewood pattern may be absent in low- and mid-latitude regions or diffuse-porous angiosperms [6]. However, narrow wood cells are formed periodically in areas with frequent drought periods, resulting in tree rings attributed to precipitation [60]. Environmental limitations such as drought and wet seasons can cause patterns similar to high- and mid-latitude earlywood and latewood [6].
Furthermore, developmental regulation partially suppresses climatic effects, but complex interactions can occur between developmental and environmental factors, particularly in stressful environments [61]. For example, water availability strongly influences cell enlargement and cell diameter under harsh conditions, and the intra-annual density fluctuations have been attributed to unusual hydric conditions, notably drought [61]. However, the drastic reduction in cell size along tree rings does not necessarily result from the changing water conditions [52].

5. Conclusions

Our study systematically demonstrated the transition time pattern of the branches and stems along an elevation gradient and evaluated the impact of environmental factors on the earlywood to latewood transition time. The results showed that the earlywood to latewood transition time varies significantly among the different tree parts but remains consistent across the elevation gradient. Furthermore, the transition time of branches is more sensitive to environmental factors compared to that of stems. Based on these findings, we can conclude that (1) branches transition earlier than stems, and the duration between early to late timber transformation in branches and stems remains constant across different altitudes; (2) temperature and humidity significantly impact the transition time from early to late timber, and photoperiod serves as a signaling factor regulating the onset of early and late timber transformation; and (3) developmental processes determine the time of early and late timber transformation from branches to stems. Thus, our results provide new insights into the developmental regulation of tree ring formation and its sensitivity to climate.

Author Contributions

W.W. and L.L. conceived the study. M.Z., F.Y. and Z.Y. performed the experiments and collected the samples. W.W. and M.Z. analyzed the data and wrote the manuscript. W.W., M.Z. and L.L. revised the draft. All authors have read and agreed to the published version of the manuscript.

Funding

This work was supported by the National Natural Science Foundation of China (grant. no. 32160354 and no. 31500174).

Data Availability Statement

Not applicable.

Acknowledgments

We would like to express our gratitude to Yu-Long She and Cheng-Cai Xiao (Yunnan University) for their valuable assistance with the paddle-walk experiments. We also thank Tong-Xing Zhao (Yunnan University) for his help with data analyses and Chun-Xiang Hu (Jiaozishan National Nature Reserve) for his assistance with the sampling. We extend our special thanks to the Jiaozishan National Nature Reserve for granting our sampling application and kindly supporting our study in the reserve.

Conflicts of Interest

The authors declare no conflict of interest.

References

  1. Cuny, H.E.; Rathgeber, C.B.K.; Frank, D.; Fonti, P.; Fournier, M. Kinetics of tracheid development explain conifer tree-ring structure. New Phytol. 2014, 203, 1231–1241. [Google Scholar] [CrossRef] [PubMed]
  2. Sheldon, J. Microscopic wood anatomy. Structural variability of stems and twigs in recent and subfossil woods from central Europe. J. Archaeol. Sci. 1979, 6, 394–396. [Google Scholar] [CrossRef]
  3. Schoch, W.; Heller, I.; Schweingruber, F.H.; Kienast, F. Wood Anatomy of Central European Species; Swiss Federal Institute for Forest: Birmensdorf, Switzerland, 2004. [Google Scholar]
  4. Samusevich, A.; Lexa, M.; Vejpustková, M.; Altman, J.; Zeidler, A. Comparison of methods for the demarcation between earlywood and latewood in tree rings of Norway spruce. Dendrochronologia 2020, 60, 125686. [Google Scholar] [CrossRef]
  5. Zhu, L.; Liu, S.; Arzac, A.; Cooper, D.J.; Jin, Y.; Yuan, D.; Zhu, Y.; Zhang, X.; Li, Z.; Zhang, Y.; et al. Different response of earlywood vessel features of Fraxinus mandshurica to rapid warming in warm-dry and cold-wet areas. Agric. For. Meteorol. 2021, 307, 108523. [Google Scholar] [CrossRef]
  6. Eckes-Shephard, A.H.; Ljungqvist, F.C.; Drew, D.M.; Rathgeber, C.B.K.; Friend, A.D. Wood Formation Modeling—A Research Review and Future Perspectives. Front. Plant Sci. 2022, 13, 837648. [Google Scholar] [CrossRef] [PubMed]
  7. Richardson, S.D.; Dinwoodie, J.M. Studies on the physiology of xylem development. Int. Wood Prod. J. 1960, 3–11. [Google Scholar]
  8. Larson, P.R. The indirect effect of drought on tracheid diameter in red pine. For. Sci. 1963, 9, 52–62. [Google Scholar]
  9. Gordon, J.C.; Larson, P.R. Seasonal Course of Photosynthesis, Respiration, and Distribution of 14C in Young Pinus resinosa Trees as Related to Wood Formation. Plant Physiol. 1968, 43, 1617–1624. [Google Scholar] [CrossRef] [Green Version]
  10. Cuny, H.E.; Rathgeber, C.B.K.; Cuny, H.E.; Rathgeber, C.B.K. Xylogenesis: Coniferous Trees of Temperate Forests Are Listening to the Climate Tale during the Growing Season but Only Remember the Last Words! Plant Physiol. 2016, 171, 306–317. [Google Scholar] [CrossRef] [Green Version]
  11. Denne, M.P.; Dodd, R.S. The Environmental Control of Xylem Differentiation. In Xylem Cell Development; Castle House Publications Ltd.: Tunbridge Wells, UK, 1981; pp. 236–255. [Google Scholar]
  12. Vaganov, E.A.; Anchukaitis, K.J.; Evans, M.N. How well understood are the processes that create dendroclimatic records? A mechanistic model of the climatic control on conifer tree-ring growth dynamics. In Dendroclimatology: Progress and Prospects; Hughes, M.K., Swetnam, T.W., Diaz, H.F., Eds.; Developments in Paleoenvironmental Research; Springer: Dordrecht, The Netherlands, 2011; pp. 37–75. ISBN 978-1-4020-5725-0. [Google Scholar]
  13. Plomion, C.; Leprovost, G.; Stokes, A. Wood Formation in Trees. Plant Physiol. 2001, 127, 1513–1523. [Google Scholar] [CrossRef]
  14. Cuny, H.E.; Fonti, P.; Rathgeber, C.B.K.; Von Arx, G.; Peters, R.L.; Frank, D.C. Couplings in cell differentiation kinetics mitigate air temperature influence on conifer wood anatomy. Plant Cell Environ. 2019, 42, 1222–1232. [Google Scholar] [CrossRef] [PubMed]
  15. Jasińska, A.K.; Alber, M.; Tullus, A.; Rahi, M.; Sellin, A. Impact of elevated atmospheric humidity on anatomical and hydraulic traits of xylem in hybrid aspen. Funct. Plant Biol. 2015, 42, 565–578. [Google Scholar] [CrossRef]
  16. Fonti, P.; Solomonoff, N.; García-González, I. Earlywood vessels of Castanea sativa record temperature before their formation. New Phytol. 2007, 173, 562–570. [Google Scholar] [CrossRef]
  17. Dolezal, J.; Kopecky, M.; Dvorsky, M.; Macek, M.; Rehakova, K.; Capkova, K.; Borovec, J.; Schweingruber, F.; Liancourt, P.; Altman, J. Sink limitation of plant growth determines tree line in the arid Himalayas. Funct. Ecol. 2019, 33, 553–565. [Google Scholar] [CrossRef]
  18. Jochner, M.; Bugmann, H.; Nötzli, M.; Bigler, C. Tree growth responses to changing temperatures across space and time: A fine-scale analysis at the treeline in the Swiss Alps. Trees 2018, 32, 645–660. [Google Scholar] [CrossRef]
  19. Li, X.; Liang, E.; Gričar, J.; Rossi, S.; Čufar, K.; Ellison, A.M. Critical minimum temperature limits xylogenesis and maintains treelines on the southeastern Tibetan Plateau. Sci. Bull. 2017, 62, 804–812. [Google Scholar] [CrossRef] [PubMed]
  20. Rossi, S.; Simard, S.; Deslauriers, A.; Morin, H. Wood formation in Abies balsamea seedlings subjected to artificial defoliation. Tree Physiol. 2009, 29, 551–558. [Google Scholar] [CrossRef]
  21. De Micco, V.; Aronne, G. Morpho-anatomical traits for plant adaptation to drought. In Plant Responses to Drought Stress: From Morphological to Molecular Features; Aroca, R., Ed.; Springer: Berlin/Heidelberg, Germany, 2012; pp. 37–61. ISBN 978-3-642-32653-0. [Google Scholar]
  22. Du, X.; Du, F.; Zeng, H.; Chen, Y.; Yao, Y.; Zhang, H.; Li, Z. A study on the community of Abies George var. smithii in Jiaozi Mountain Nature Reserve. J. Yunnan Univ. (Nat. Sci. Ed.) 2010, 32, 358–364. [Google Scholar]
  23. Li, Z.; Liu, K.; Chen, Y.; Yao, Y.; Du, X.; Zhang, H. Studies on the vegetation form and distribution characteristics in Jiaozishan Nature Reserve. Shandong For. Sci. Technol. 2010, 40, 32–35. [Google Scholar]
  24. Rossi, S.; Anfodillo, T.; Menardi, R. Trephor: A New Tool for Sampling Microcores from tree stems. IAWA J. 2006, 27, 89–97. [Google Scholar] [CrossRef] [Green Version]
  25. Denne, M.P. Definition of Latewood According to Mork (1928). IAWA J. 1989, 10, 59–62. [Google Scholar] [CrossRef]
  26. Park, Y.-I.; Spiecker, H. Variations in the tree-ring structure of Norway spruce (Picea abies) under contrasting climates. Dendrochronologia 2005, 23, 93–104. [Google Scholar] [CrossRef]
  27. Deslauriers, A.; Morin, H.; Begin, Y. Cellular phenology of annual ring formation of Abies balsamea in the Quebec boreal forest (Canada). Can. J. For. Res. 2003, 33, 190–200. [Google Scholar] [CrossRef] [Green Version]
  28. Gričar, J.; Čufar, K.; Eler, K.; Gryc, V.; Vavrčík, H.; de Luis, M.; Prislan, P. Transition Dates from Earlywood to Latewood and Early Phloem to Late Phloem in Norway Spruce. Forests 2021, 12, 331. [Google Scholar] [CrossRef]
  29. Miller, T.W.; Stangler, D.F.; Larysch, E.; Seifert, T.; Spiecker, H.; Kahle, H.-P. Plasticity of seasonal xylem and phloem production of Norway spruce along an elevational gradient. Trees 2020, 34, 1281–1297. [Google Scholar] [CrossRef]
  30. Moser, L.; Fonti, P.; Büntgen, U.; Esper, J.; Luterbacher, J.; Franzen, J.; Frank, D. Timing and duration of European larch growing season along altitudinal gradients in the Swiss Alps. Tree Physiol. 2010, 30, 225–233. [Google Scholar] [CrossRef] [PubMed]
  31. Prislan, P.; Gričar, J.; de Luis, M.; Smith, K.T.; Čufar, K. Phenological variation in xylem and phloem formation in Fagus sylvatica from two contrasting sites. Agric. For. Meteorol. 2013, 180, 142–151. [Google Scholar] [CrossRef]
  32. Gričar, J.; Prislan, P.; Gryc, V.; Vavrčík, H.; De Luis, M.; Čufar, K. Plastic and locally adapted phenology in cambial seasonality and production of xylem and phloem cells in Picea abies from temperate environments. Tree Physiol. 2014, 34, 869–881. [Google Scholar] [CrossRef] [Green Version]
  33. DesLauriers, A.; Rossi, S.; Anfodillo, T.; Saracino, A. Cambial phenology, wood formation and temperature thresholds in two contrasting years at high altitude in southern Italy. Tree Physiol. 2008, 28, 863–871. [Google Scholar] [CrossRef] [Green Version]
  34. Ziaco, E. A phenology-based approach to the analysis of conifers intra-annual xylem anatomy in water-limited environments. Dendrochronologia 2020, 59, 125662. [Google Scholar] [CrossRef]
  35. Körner, C.; Basler, D. Phenology Under Global Warming. Science 2010, 327, 1461–1462. [Google Scholar] [CrossRef] [PubMed]
  36. Renninger, H.J.; Gartner, B.L.; Grotta, A.T. No Correlation between Latewood Formation and Leader Growth in Douglas-Fir Saplings. IAWA J. 2006, 27, 183–191. [Google Scholar] [CrossRef]
  37. Rossi, S.; Deslauriers, A.; Anfodillo, T.; Morin, H.; Saracino, A.; Motta, R.; Borghetti, M. Conifers in cold environments synchronize maximum growth rate of tree-ring formation with day length. New Phytol. 2006, 170, 301–310. [Google Scholar] [CrossRef] [PubMed] [Green Version]
  38. Cai, F.; Jin, X.; Tian, Y.; Huang, Z.; Wang, X.; Zhang, Y.; Sun, Y.; Shao, C. Molecular regulation of bud dormancy in perennial plants. Plant Growth Regul. 2023. [Google Scholar] [CrossRef]
  39. Huang, J.-G.; Ma, Q.; Rossi, S.; Biondi, F.; Deslauriers, A.; Fonti, P.; Liang, E.; Mäkinen, H.; Oberhuber, W.; Rathgeber, C.B.K.; et al. Photoperiod and temperature as dominant environmental drivers triggering secondary growth resumption in Northern Hemisphere conifers. Proc. Natl. Acad. Sci. USA 2020, 117, 20645–20652. [Google Scholar] [CrossRef]
  40. Falcioni, R.; Moriwaki, T.; de Oliveira, D.M.; Andreotti, G.C.; de Souza, L.A.; dos Santos, W.D.; Bonato, C.M.; Antunes, W.C. Increased Gibberellins and Light Levels Promotes Cell Wall Thickness and Enhance Lignin Deposition in Xylem Fibers. Front. Plant Sci. 2018, 9, 1391. [Google Scholar] [CrossRef] [Green Version]
  41. Körner, C. Alpine Treelines: Functional Ecology of the Global High Elevation Tree Limits; Springer: Basel, Switzerland, 2012; ISBN 978-3-0348-0396-0. [Google Scholar]
  42. Davik, J.; Kjersti Bakken, A.; Holte, K.; Blomhoff, R. Effects of genotype and environment on total anti-oxidant capacity and the content of sugars and acids in strawberries (Fragaria × ananassa Duch.). J. Hortic. Sci. Biotechnol. 2006, 81, 1057–1063. [Google Scholar] [CrossRef]
  43. Jaakola, L.; Hohtola, A. Effect of latitude on flavonoid biosynthesis in plants. Plant Cell Environ. 2010, 33, 1239–1247. [Google Scholar] [CrossRef] [PubMed]
  44. Hyde, P.T.; Setter, T.L. Long-day photoperiod and cool temperature induce flowering in cassava: Expression of signaling genes. Front. Plant Sci. 2022, 13, 973206. [Google Scholar] [CrossRef]
  45. Osnato, M.; Cota, I.; Nebhnani, P.; Cereijo, U.; Pelaz, S. Photoperiod Control of Plant Growth: Flowering Time Genes Beyond Flowering. Front. Plant Sci. 2022, 12, 805635. [Google Scholar] [CrossRef]
  46. Siemann, J.K.; Williams, P.; Malik, T.N.; Jackson, C.R.; Green, N.H.; Emeson, R.B.; Levitt, P.; McMahon, D.G. Photoperiodic effects on monoamine signaling and gene expression throughout development in the serotonin and dopamine systems. Sci. Rep. 2020, 10, 15437. [Google Scholar] [CrossRef] [PubMed]
  47. Boöhlenius, H.; Huang, T.; Charbonnel-Campaa, L.; Brunner, A.M.; Jansson, S.; Strauss, S.H.; Nilsson, O. CO/FT Regulatory Module Controls Timing of Flowering and Seasonal Growth Cessation in Trees. Science 2006, 312, 1040–1043. [Google Scholar] [CrossRef] [Green Version]
  48. Olsen, J.E.; Junttila, O.; Nilsen, J.; Eriksson, M.E.; Martinussen, I.; Olsson, O.; Sandberg, G.; Moritz, T. Ectopic expression of oat phytochrome A in hybrid aspen changes critical daylength for growth and prevents cold acclimatization. Plant J. 1997, 12, 1339–1350. [Google Scholar] [CrossRef]
  49. Rohde, A.; Bhalerao, R.P. Plant dormancy in the perennial context. Trends Plant Sci. 2007, 12, 217–223. [Google Scholar] [CrossRef] [PubMed]
  50. Rossi, S.; Deslauriers, A.; Morin, H. Application of the Gompertz equation for the study of xylem cell development. Dendrochronologia 2003, 21, 33–39. [Google Scholar] [CrossRef]
  51. Zheng, Z.; Fang, K.; Chen, Y.; Dong, Z.; Zhou, F.; Li, Y. Is the Pinus massoniana Lamb. Tree-Ring Latewood Formation Influenced by the Diurnal Temperature Range in Humid Subtropical China? Forests 2022, 13, 1439. [Google Scholar] [CrossRef]
  52. Fritts, H. Tree Rings and Climate; Elsevier: Amsterdam, The Netherlands, 1976; ISBN 978-0-323-14528-2. [Google Scholar]
  53. Traversari, S.; Giovannelli, A.; Emiliani, G. Wood Formation under Changing Environment: Omics Approaches to Elucidate the Mechanisms Driving the Early-to-Latewood Transition in Conifers. Forests 2022, 13, 608. [Google Scholar] [CrossRef]
  54. Jang, G.; Yoon, Y.; Choi, Y.D. Crosstalk with Jasmonic Acid Integrates Multiple Responses in Plant Development. Int. J. Mol. Sci. 2020, 21, 305. [Google Scholar] [CrossRef] [Green Version]
  55. Lindsey, K. Peptides: New signalling molecules in plants. Trends Plant Sci. 2002, 7, 78–83. [Google Scholar] [CrossRef]
  56. Rossi, S.; Anfodillo, T.; Čufar, K.; Cuny, H.E.; Deslauriers, A.; Fonti, P.; Frank, D.; Gričar, J.; Gruber, A.; King, G.M.; et al. A meta-analysis of cambium phenology and growth: Linear and non-linear patterns in conifers of the northern hemisphere. Ann. Bot. 2013, 112, 1911–1920. [Google Scholar] [CrossRef]
  57. Bouriaud, O.; Leban, J.-M.; Bert, D.; Deleuze, C. Intra-annual variations in climate influence growth and wood density of Norway spruce. Tree Physiol. 2005, 25, 651–660. [Google Scholar] [CrossRef] [PubMed] [Green Version]
  58. Cartenì, F.; Deslauriers, A.; Rossi, S.; Morin, H.; De Micco, V.; Mazzoleni, S.; Giannino, F. The Physiological Mechanisms Behind the Earlywood-To-Latewood Transition: A Process-Based Modeling Approach. Front. Plant Sci. 2018, 9, 1053. [Google Scholar] [CrossRef] [PubMed] [Green Version]
  59. Cregg, B.M.; Dougherty, P.M.; Hennessey, T.C. Growth and wood quality of young loblolly pine trees in relation to stand density and climatic factors. Can. J. For. Res. 1988, 18, 851–858. [Google Scholar] [CrossRef]
  60. Lebourgeois, F.; Bréda, N.; Ulrich, E.; Granier, A. Climate-tree-growth relationships of European beech (Fagus sylvatica L.) in the French Permanent Plot Network (RENECOFOR). Trees 2005, 19, 385–401. [Google Scholar] [CrossRef]
  61. Deslauriers, A.; Rossi, S.; Anfodillo, T. Dendrometer and intra-annual tree growth: What kind of information can be inferred? Dendrochronologia 2007, 25, 113–124. [Google Scholar] [CrossRef] [Green Version]
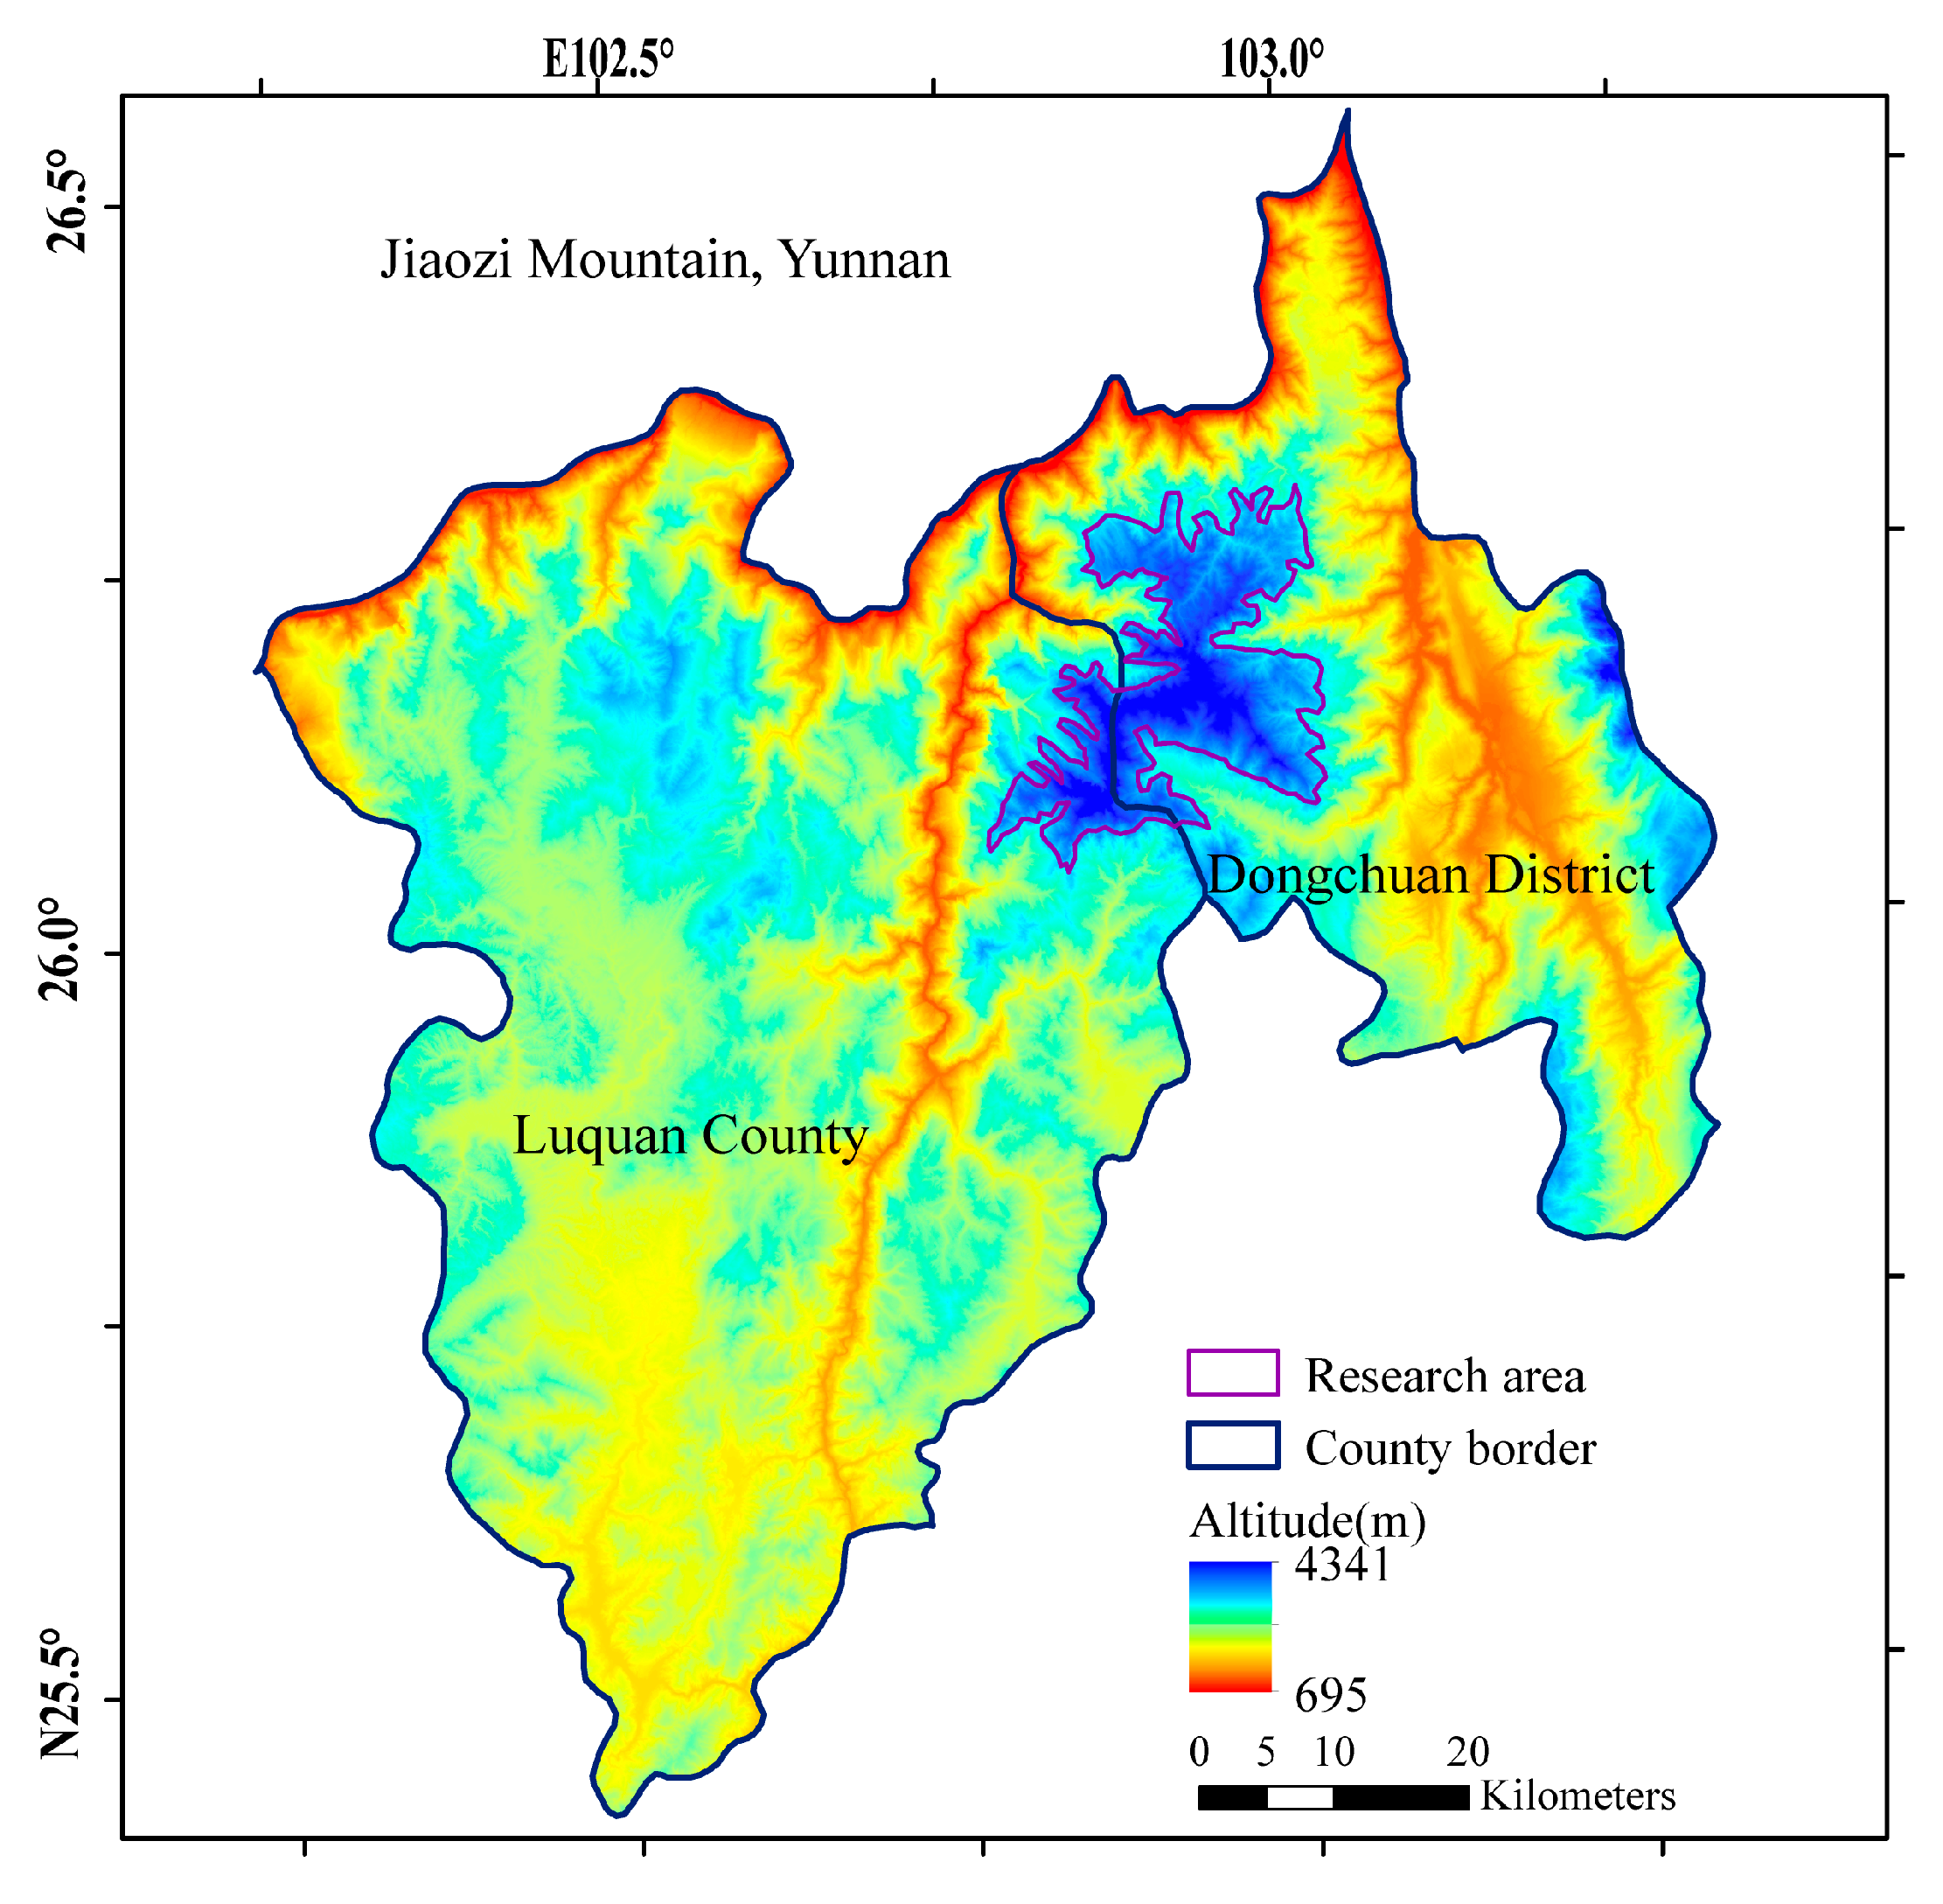
Figure 1. Schematic representation of the study area.
Forests 14 01456 g001
Figure 2. Locations of the three sample sites in Jiaozi Mountain.
Forests 14 01456 g002
Figure 3. The annual environmental factors at different elevations of Jiaozi Mountain, Yunnan, China, in 2021.
Forests 14 01456 g003
Figure 4. Intra-annual dynamics of the wood growth ring formation represented by Gompertz growth curve fitted using the weekly wood increments of Smith fir trees at 3600 m, 3800 m, and 4000 m. The gray linear area represents the temporal range of branch and stem transition material, while the orange dashed area shows the relative position of the transition material within the tree ring.
Forests 14 01456 g004
Figure 5. Intra-ring profile of cell wall thickness and diameter. The cell relative position was calculated relative to total cells, and the first cell in a radial cell file was set at 1%, while the last one was set at 100% of the intra-ring position. Each point on the curve represents the mean value of the five trees in each sample plot.
Forests 14 01456 g005
Figure 6. Intra-ring profile of cell enlargement duration and cell wall deposition rate. The cell relative position was calculated relative to total cells, and the first cell in a radial cell file was set at 1%, while the last one was set at 100% of the intra-ring position. Each point on the curve represents the mean value of the five trees in each sample plot.
Forests 14 01456 g006
Figure 7. A one-dimensional linear correlation between the cell wall deposition rate of branches and the climate factors. The p-value represents the significance level of the relationship between the cell wall deposition rate of branches and climate factors. A p-value less than 0.05 indicates statistical significance, while a p-value less than 0.01 indicates a higher degree of statistical significance. The R² value indicates the explanatory power of climate factors in relation to the variation in the cell wall deposition rate of branches. It ranges from 0 to 1, where a value closer to 1 indicates a better ability of the linear regression model to explain the variation in the cell wall deposition rate of branches. Conversely, a value closer to 0 suggests a weaker ability of the model to explain the cell wall deposition rate of branches.
Forests 14 01456 g007
Figure 8. A one-dimensional linear correlation between the cell enlargement duration of branches and the climate factors. The p-value represents the significance level of the relationship between the cell enlargement duration of branches and climate factors. A p-value less than 0.05 indicates statistical significance, while a p-value less than 0.01 indicates a higher degree of statistical significance. The R² value indicates the explanatory power of climate factors in relation to the variation in the cell enlargement duration of branches. It ranges from 0 to 1, where a value closer to 1 indicates a better ability of the linear regression model to explain the variation in the cell enlargement duration of branches. Conversely, a value closer to 0 suggests a weaker ability of the model to explain the cell enlargement duration of branches.
Forests 14 01456 g008
Figure 9. A one-dimensional linear correlation between the cell wall deposition rate of stems and the climate factors. The p-value represents the significance level of the relationship between the cell wall deposition rate of stems and climate factors. A p-value less than 0.05 indicates statistical significance, while a p-value less than 0.01 indicates a higher degree of statistical significance. The R² value indicates the explanatory power of climate factors in relation to the variation in the cell wall deposition rate of stems. It ranges from 0 to 1, where a value closer to 1 indicates a better ability of the linear regression model to explain the variation in the cell wall deposition rate of stems. Conversely, a value closer to 0 suggests a weaker ability of the model to explain the cell wall deposition rate of stems.
Forests 14 01456 g009
Figure 10. A one-dimensional linear correlation between the cell enlargement duration of stems and the climate factors. The p-value represents the significance level of the relationship between the cell enlargement duration of stems and climate factors. A p-value less than 0.05 indicates statistical significance, while a p-value less than 0.01 indicates a higher degree of statistical significance. The R² value indicates the explanatory power of climate factors in relation to the variation in the cell enlargement duration of stems. It ranges from 0 to 1, where a value closer to 1 indicates a better ability of the linear regression model to explain the variation in the cell enlargement duration of stems. Conversely, a value closer to 0 suggests a weaker ability of the model to explain the cell enlargement duration of stems.
Forests 14 01456 g010
Table 1. Characteristics of the sample trees.
Elevation (m)NumberBasal Diameter (cm)Diameter at Breast Height (cm)Height (cm)Age (years)
360013225125058
22116.5110027
32318120045
42015.5115051
52217116040
380064535120032
73225105024
81612118020
93427130024
102217102018
400011201751027
12574468055
13191550027
141914.539022
15211652020
Mean ± SE 25.87 ± 2.9320.97 ± 2.27947.33 ± 83.9332.66 ± 3.50
Table 2. Mean, maximum, and minimum temperature and humidity at different elevations of Jiaozi Mountain, Yunnan, China, in 2021.
Elevation (m)Air Temperature (°C) Humidity (%)
AverageMaximumMinimumDirect Reduction Rate (°C m−1)AverageMaximumMinimumDirect Reduction Rate (°C m−1)
36006.5213.28−4.06 83.5910025.74
38004.9111.84−5.210.0060 ± 0.002185.7610025.000
40004.1412.18−5.54 85.2410022.63
Table 3. The earlywood to latewood transition timing in different parts of Smith fir trees at 3600 m, 3800 m, and 4000 m. DOY represents the day of the year.
Elevation (m)T-Onset T-Duration T-Ending
BranchesStempFnBranchesStempFnBranchesStempFn
3600 m167 ± 9190 ± 90.00416.2351030 ± 1020 ± 20.0654.56710197 ± 11211 ± 90.0784.08810
3800 m163 ± 4184 ± 110.00514.3011027 ± 421 ± 30.0376.22810190 ± 8205 ± 130.0376.22810
4000 m169 ± 15179 ± 90.2011.9411022 ± 918 ± 50.4530.62110191 ± 20198 ± 140.5670.35610
p0.6890.236 0.3070.566 0.7050.292
F0.3841.635 1.3060.597 0.3601.367
n1515 1515 1515
Note: T-Onset indicates the beginning of the earlywood to latewood transition, T-Duration represents the transition duration, and T-Ending denotes the end of the transition. The p-value indicates the level of statistical significance, with p < 0.05 representing statistical significance, while p < 0.01 suggests a higher degree of statistical significance. The F-value represents the degrees of freedom associated with a statistical test. The n-value represents the sample size.
Table 4. Wood anatomy and developmental characteristics of the different parts of Smith fir trees in an altitudinal gradient.
Elevation (m)Cell Wall Thickness (μm)Cell Diameter (μm)Cell Enlargement Duration (d)Wall Deposition Rate (μm2d−1)
BranchesStempFnBranchesStempFnBranchesStempFnBranchesStempFn
36000.61 ± 0.131.30 ± 0.180.00149.65107.91 ± 1.3014.13 ± 3.200.00416.17103.28 ± 3.153.56 ± 2.910.6770.175108.668 ± 1.6823.23 ± 3.560.00123.21510
38000.61 ± 0.041.21 ± 0.140.00182.12107.41 ± 1.5715.82 ± 3.390.00125.31102.64 ± 3.513.35 ± 4.720.7340.1161011.21 ± 1.8335.50 ± 2.000.0314.76610
40000.44 ± 0.041.09 ± 0.310.00221.65107.22 ± 1.7811.99 ± 2.530.00911.87103.54 ± 3.104.11 ± 3.470.2121.584105.304 ± 1.2017.76 ± 3.370.00140.95410
p0.0080.349 0.7750.183 0.5540.166 0.0010.001
F7.3731.151 0.2601.960 0.5941.820 42.28821.123
n1515 1515 1515 1515
Note: The p-value indicates the level of statistical significance, with p < 0.05 representing statistical significance, while p < 0.01 suggests a higher degree of statistical significance. The F-value represents the degrees of freedom associated with a statistical test. The n-value represents the sample size.
Table 5. Generalized linear mixed model (pooled results of the imputed datasets) of the effects of climatic factors on the earlywood to latewood transition.
OrganDaylengthTemperatureHumidity
Odd Ratio (95%CI)p ValueOdd Ratio (95%CI)p ValueOdd Ratio (95%CI)p Value
Branch12.44<0.010.60<0.010.87<0.01
Stem79.49<0.010.80<0.010.90<0.01
Note: The p-value indicates the level of statistical significance, with p < 0.01 suggesting a higher degree of statistical significance.
Table 6. Generalized linear mixed model (pooled results of the imputed datasets) for the effects of branch developmental factors on the stem transition from earlywood to latewood.
StageCell Enlargement Duration of the Branches (d)Cell Wall Deposition Rate of the Branches (μm2d−1)
Odd Ratio (95%CI)p ValueOdd Ratio (95%CI)p Value
Stem transition0.59<0.011.030.03
Note: The p-value indicates the level of statistical significance, with p < 0.05 representing statistical significance, while p < 0.01 suggests a higher degree of statistical significance.
Disclaimer/Publisher’s Note: The statements, opinions and data contained in all publications are solely those of the individual author(s) and contributor(s) and not of MDPI and/or the editor(s). MDPI and/or the editor(s) disclaim responsibility for any injury to people or property resulting from any ideas, methods, instructions or products referred to in the content.