
The Future of European Beech in Northern Germany—Climate Change Vulnerability and Adaptation Potential

Abstract
1. Introduction
2. Methods
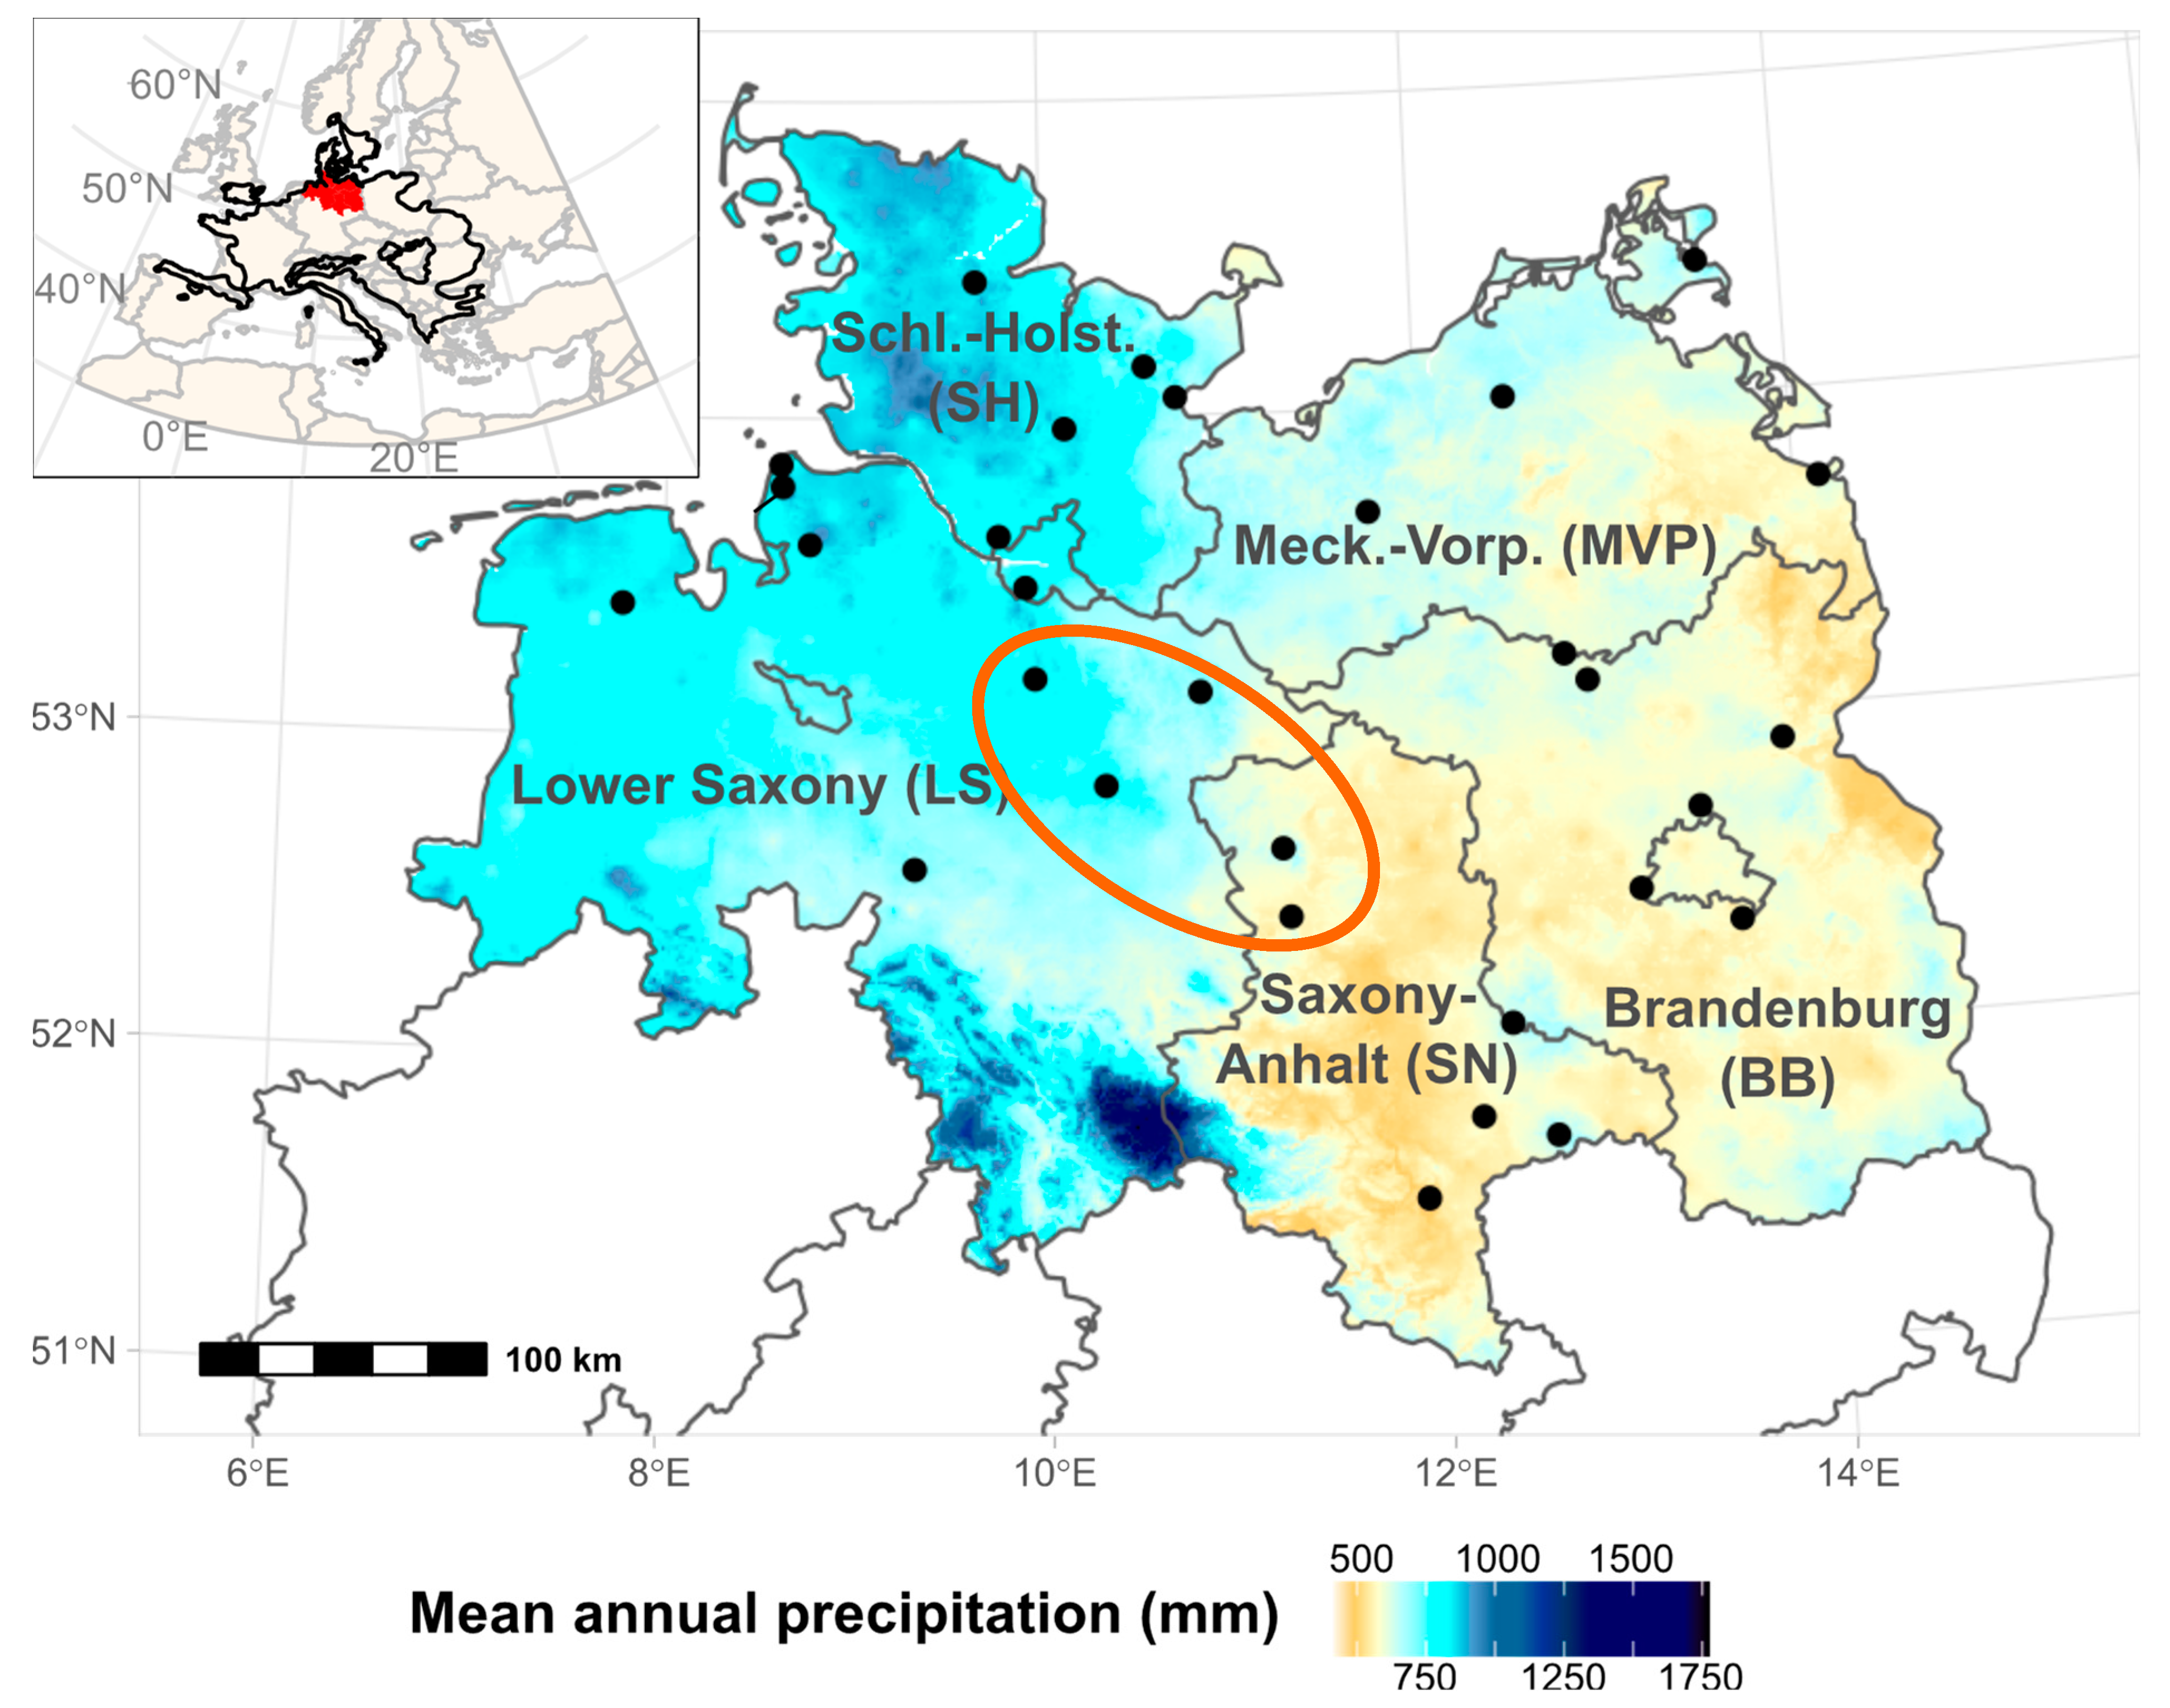
2.1. Study Region
2.2. Tree Sampling and Dendrochronological Analyses
2.3. Hydraulic and Physiological Measurements
3. Natural and Recent Distribution of Beech Forests in Northern Germany
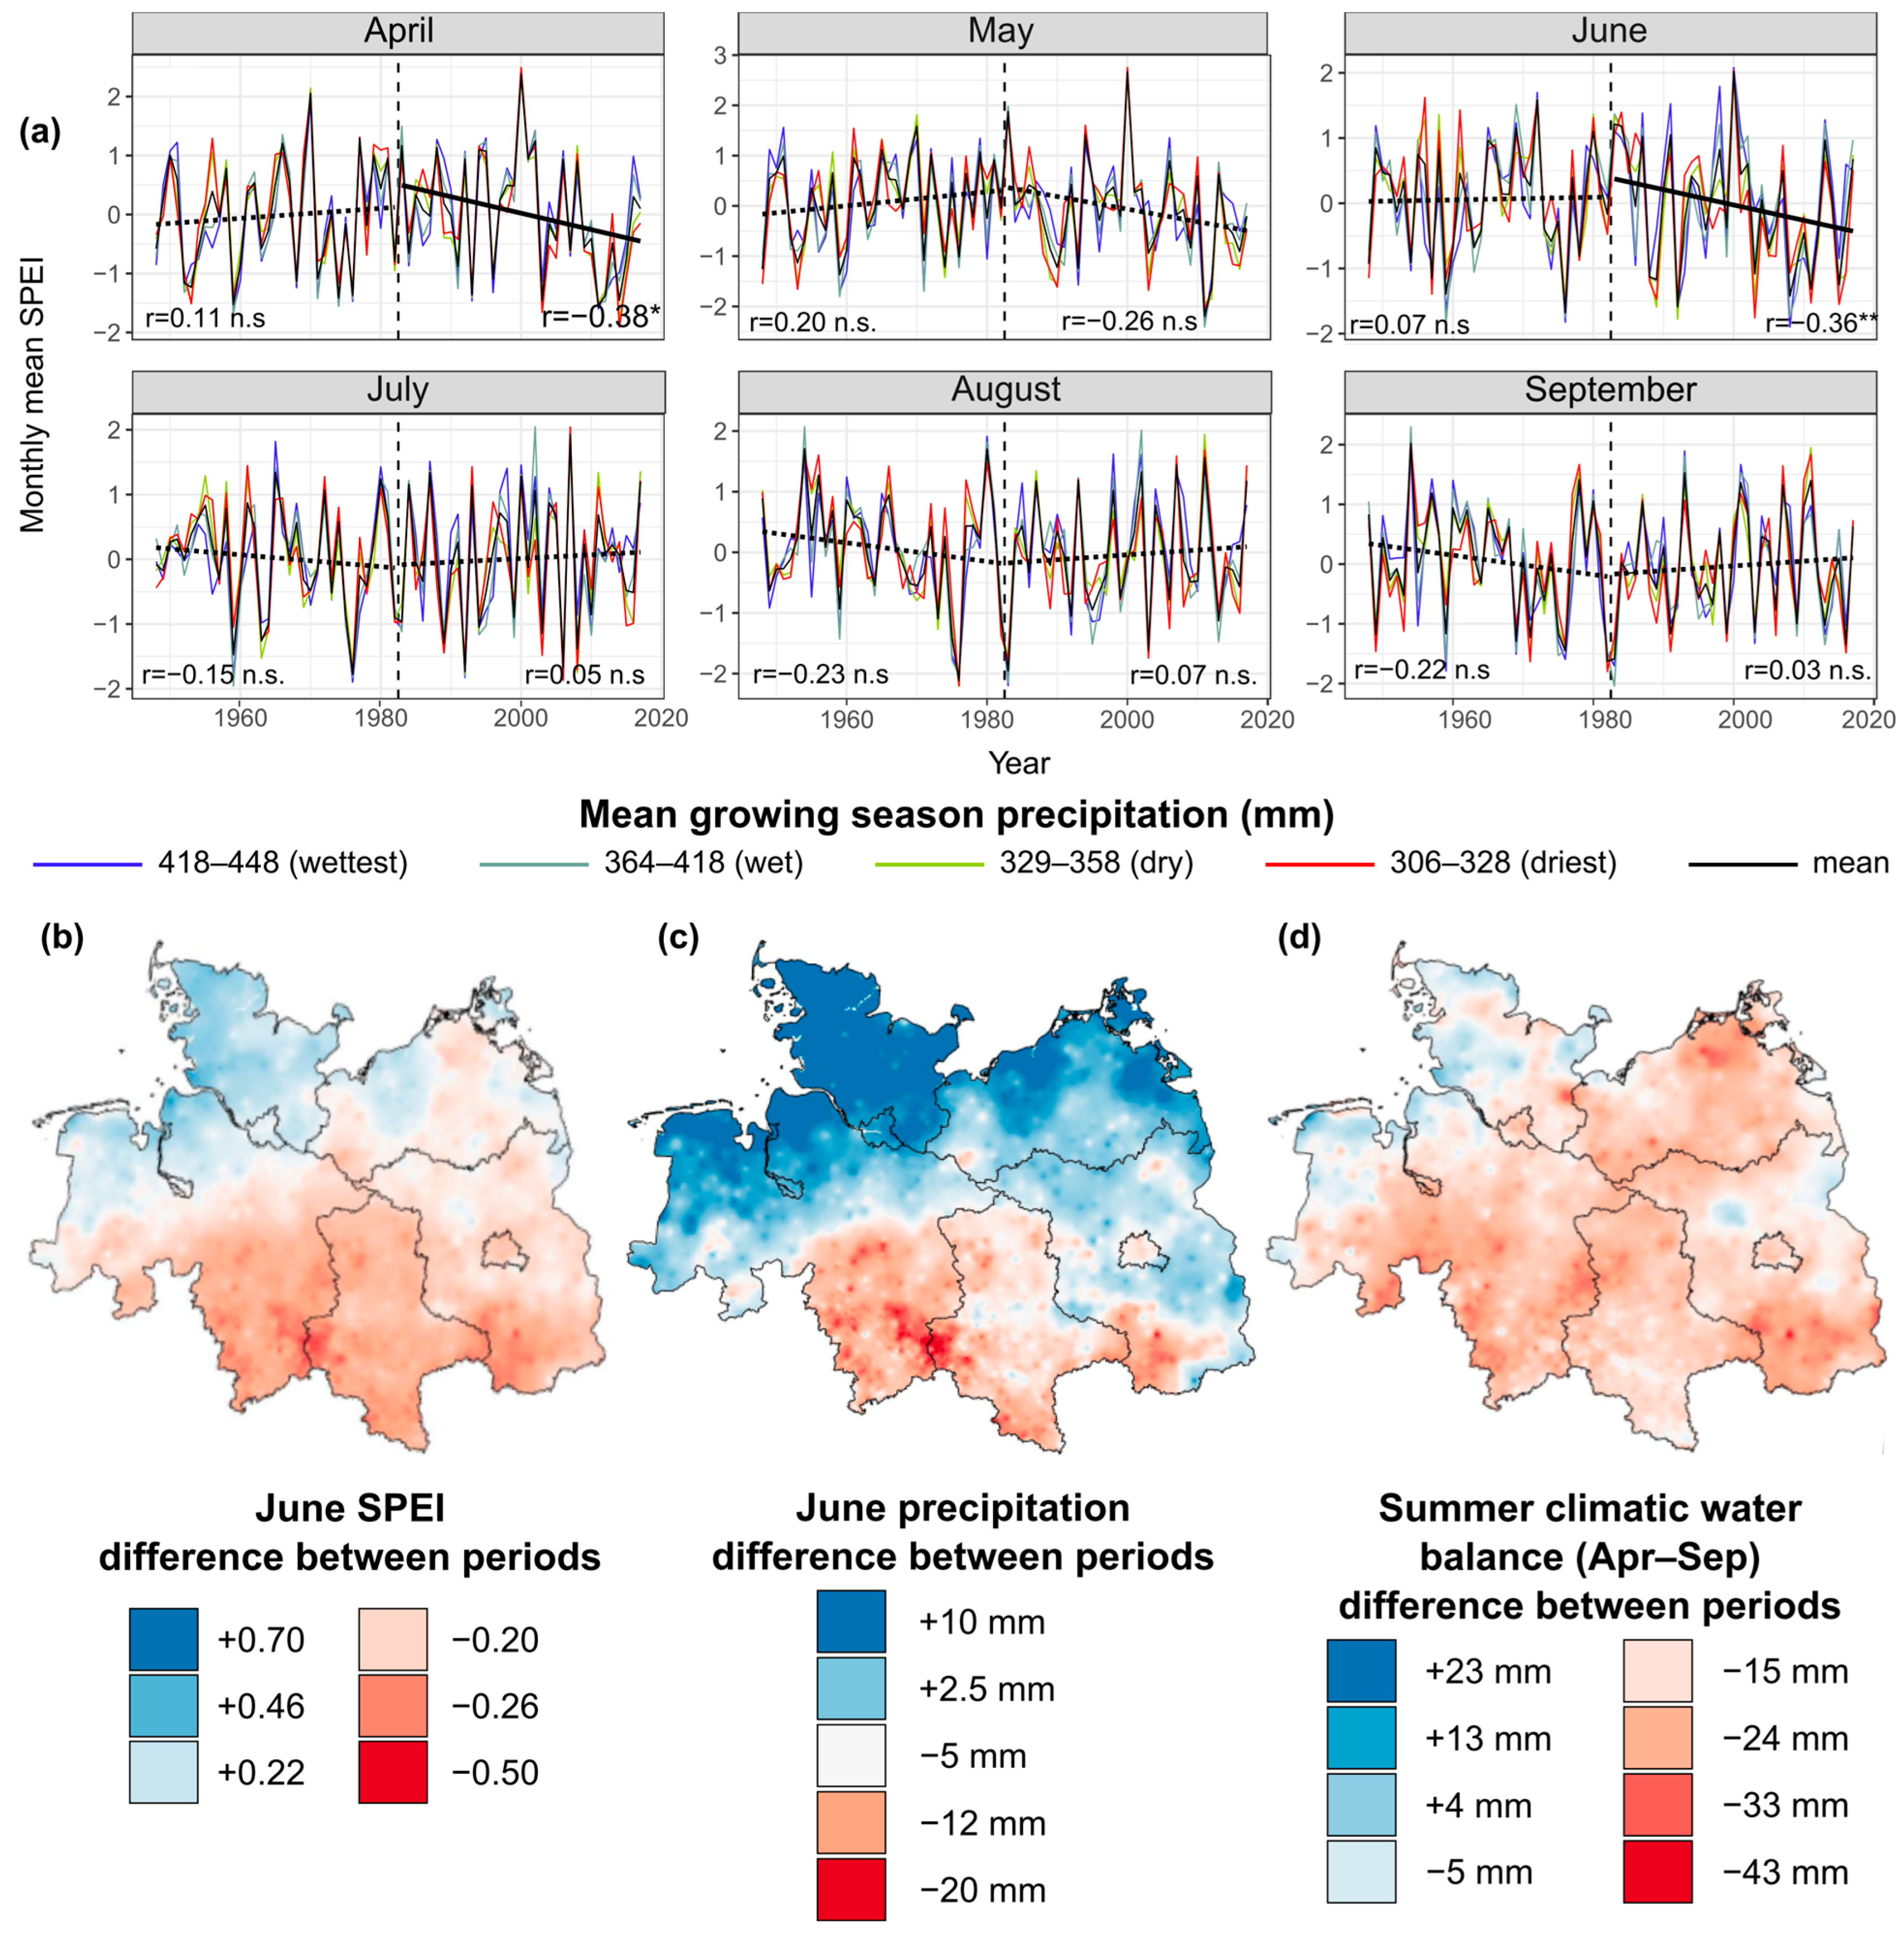
4. Climate Trends with Relevance for Beech Forest Health
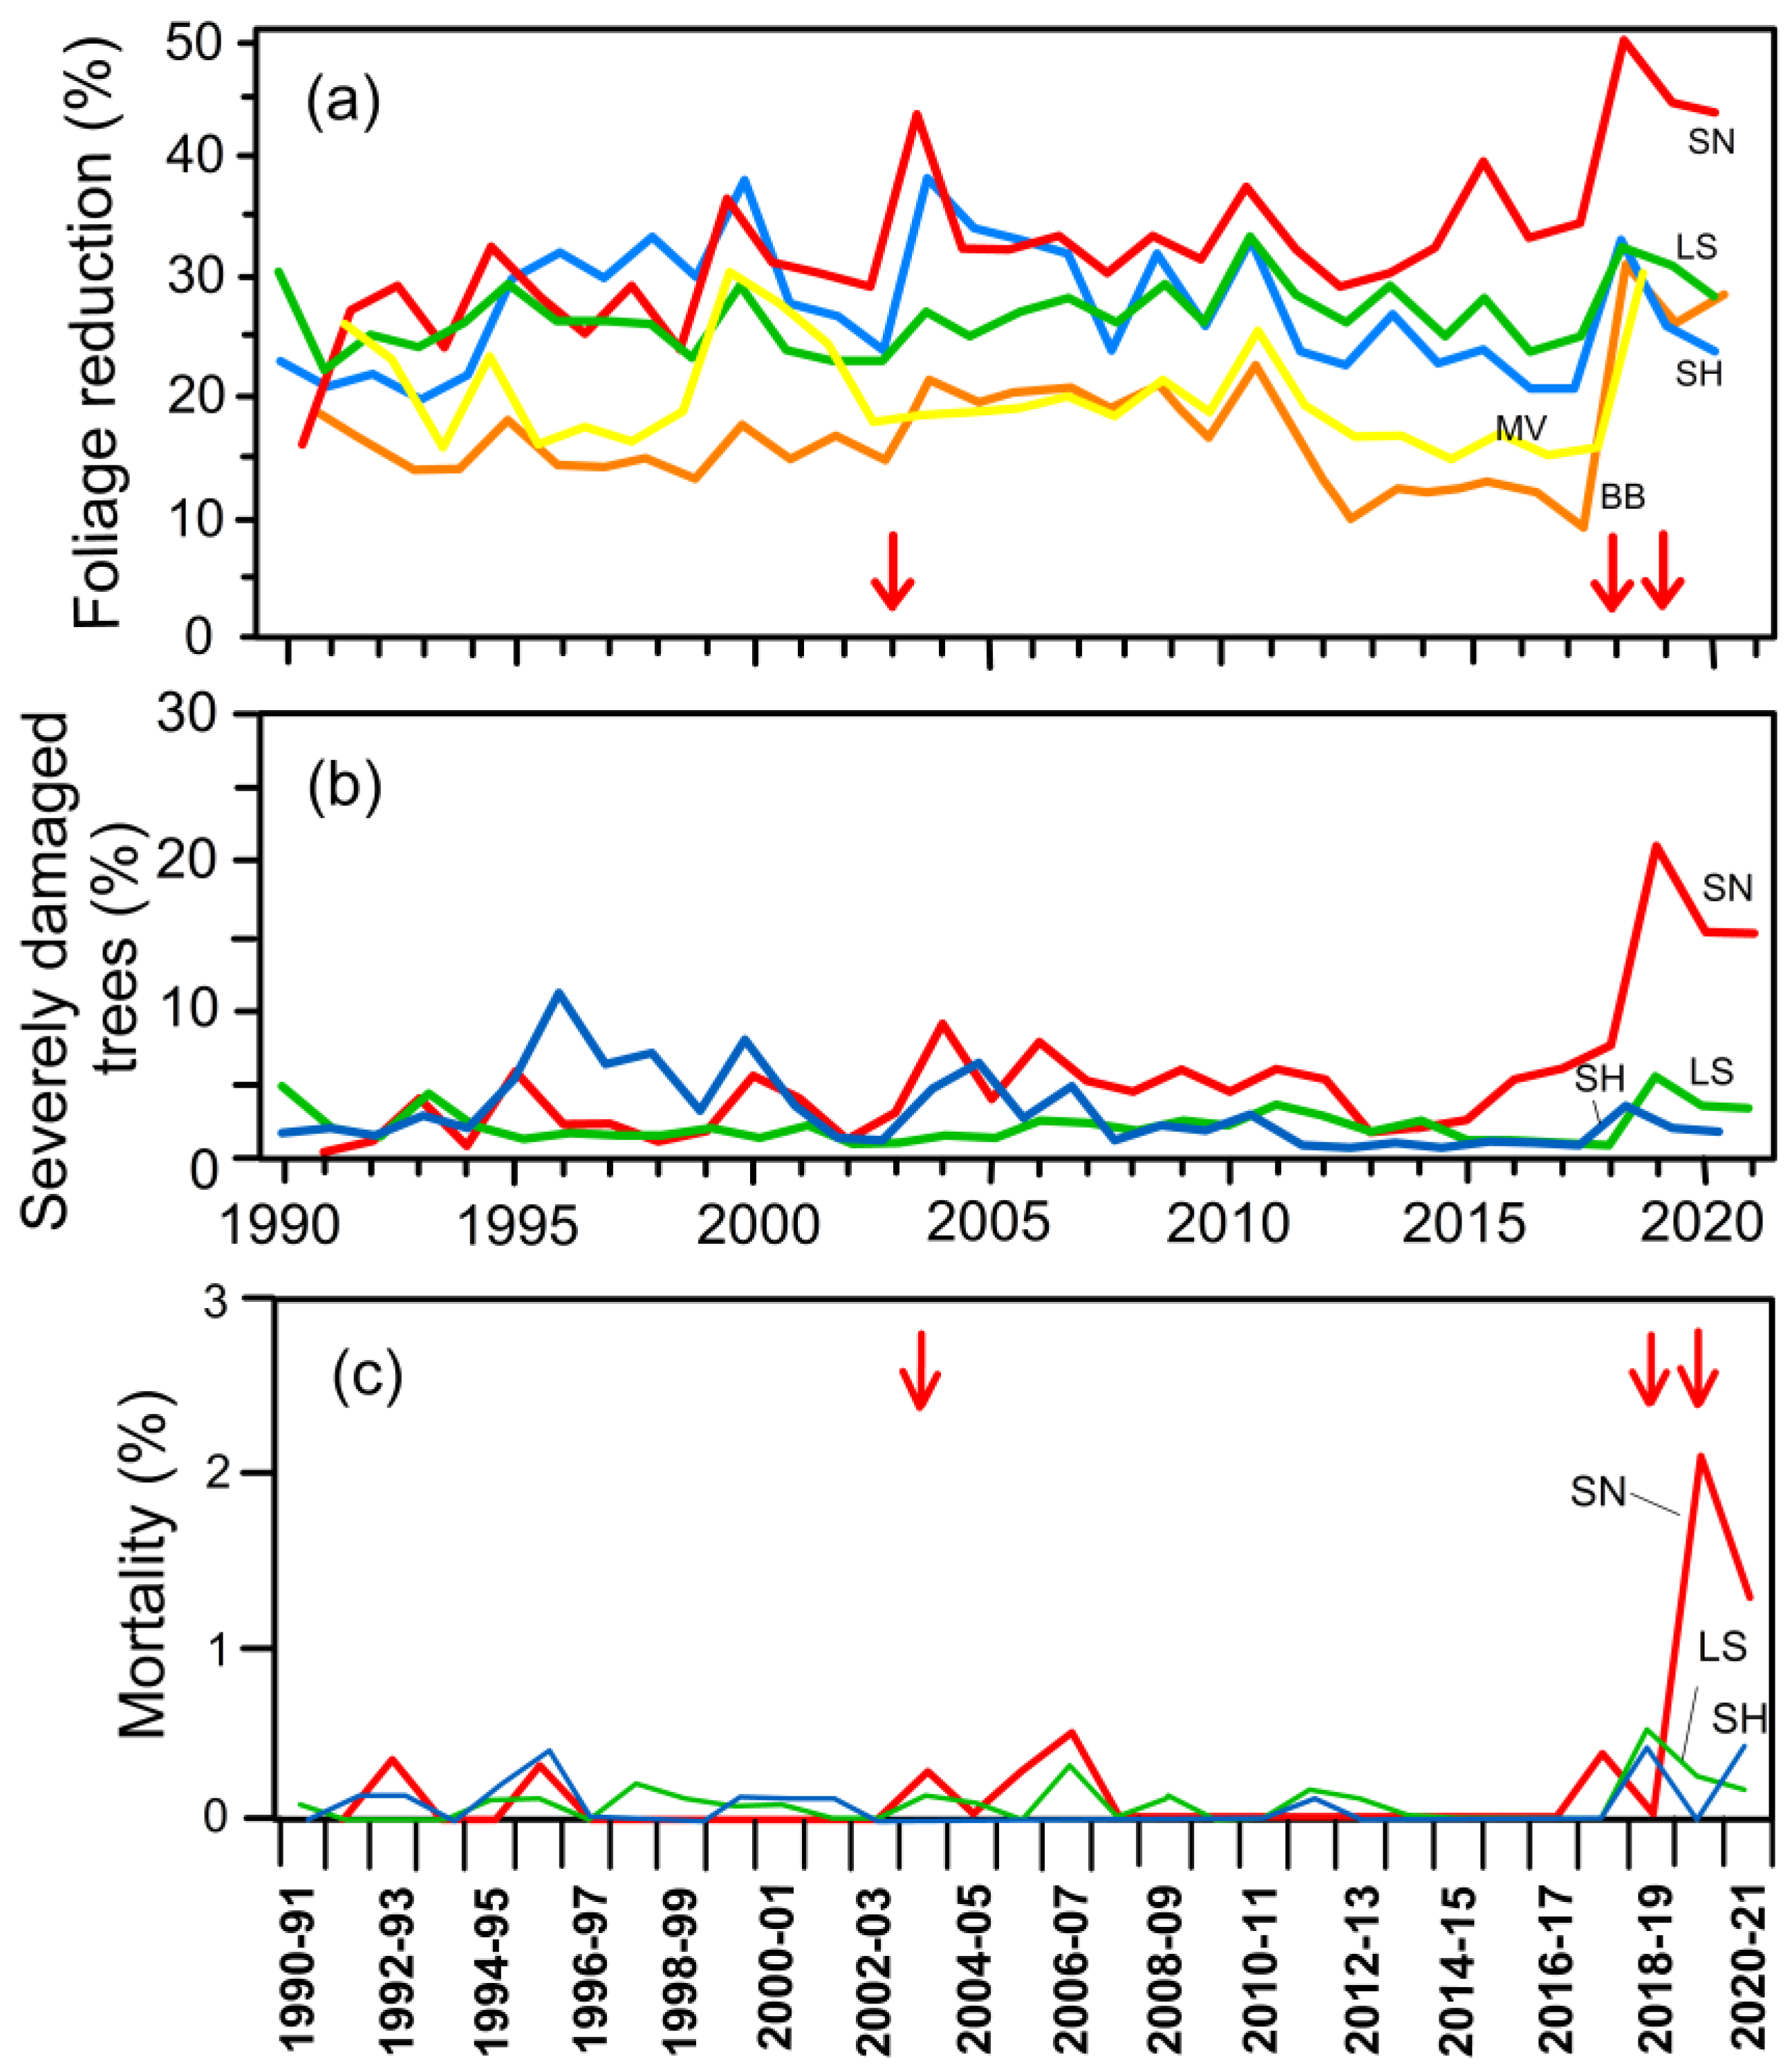
5. Drought-Related Foliage Reduction, Crown Damage, and Mortality Rate: Long-Term Trends and Influence of Site Conditions
6. Evidence of Climate Vulnerability of Beech: Radial Growth Dynamics and Growth Trends
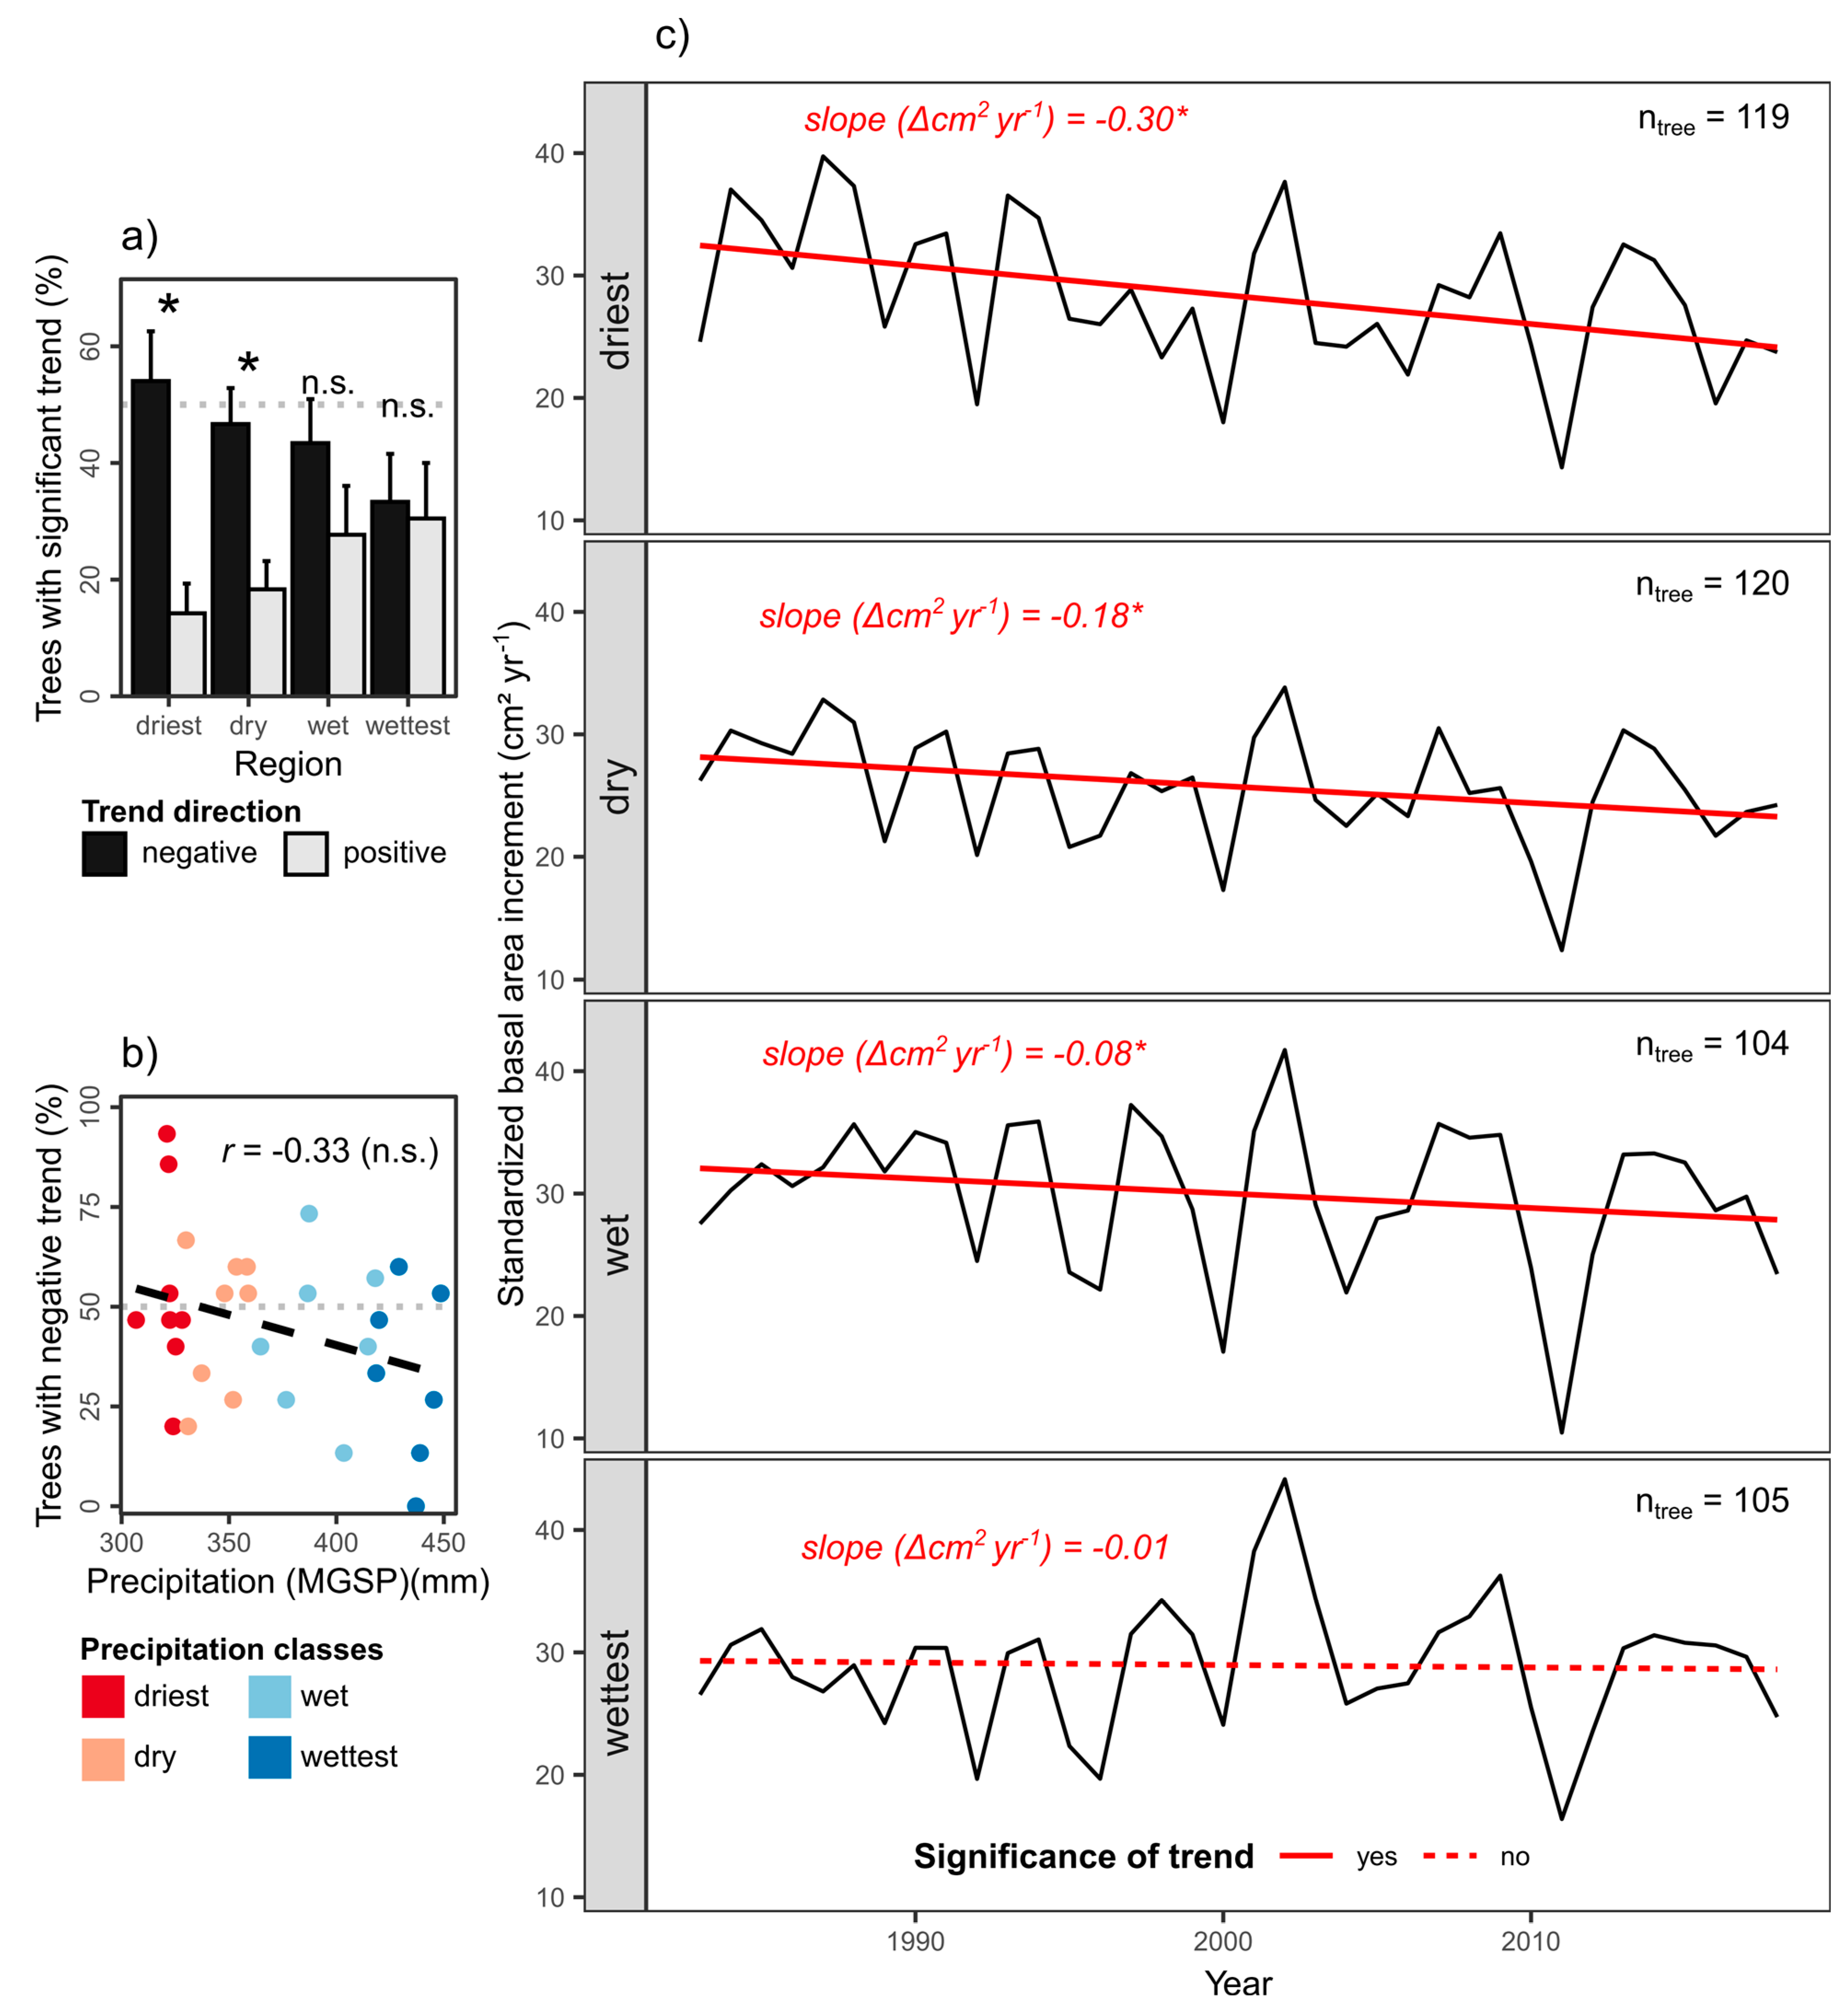
6.1. Long-Term Growth Trends and Their Dependence on Climatic and Edaphic Factors
6.2. Drivers of Negative Growth Trends
6.3. Spatial and Temporal Variation in the Climate Sensitivity of Growth
6.4. Growth Synchrony
7. Leaf-, Branch-, Stem-, and Root-Level Responses as Possible Causes of the Growth Decline
8. The Climate Change Acclimation and Adaptation Potential of Beech
9. The Future of Beech in Northern Germany
10. Conclusions
Supplementary Materials
Author Contributions
Funding
Data Availability Statement
Acknowledgments
Conflicts of Interest
References
- Allen, C.D.; Breshears, D.D.; McDowell, N.G. On underestimation of global vulnerability to tree mortality and forest die-off from hotter drought in the Anthropocene. Ecosphere 2015, 6, 129. [Google Scholar] [CrossRef]
- Adams, H.D.; Zeppel, M.J.B.; Anderegg, W.R.L.; Hartmann, H.; Landhäusser, S.M.; Tissue, D.T.; Huxman, T.E.; Hudson, P.J.; Franz, T.E.; Allen, C.D.; et al. A multi-species synthesis of physiological mechanisms in drought-induced tree mortality. Nat. Ecol. Evol. 2017, 1, 1285–1291. [Google Scholar] [CrossRef] [PubMed]
- Senf, C.; Buras, A.; Zang, C.S.; Ramming, A.; Seidl, R. Excess forest mortality is consistently linked to drought across Europe. Nat. Commun. 2020, 11, 1–8. [Google Scholar] [CrossRef] [PubMed]
- George, J.-P.; Bürkner, P.-C.; Sanders, T.G.M.; Neumann, M.; Cammalleri, C.; Vogt, J.V.; Lang, M. Long-term forest monitoring reveals constant mortality rise in European forests. Plant Biol. 2022, 24, 1108–1119. [Google Scholar] [CrossRef]
- Anderegg, W.R.L.; Hicke, J.A.; Fisher, R.A.; Allen, C.D.; Aukema, J.; Bentz, B.; Hood, S.; Lichstein, J.W.; Macalady, A.K.; McDowell, N.; et al. Tree mortality from drought, insects, and their interactions in a changing climate. New Phytol. 2015, 208, 674–683. [Google Scholar] [CrossRef]
- Corcobado, T.; Cech, T.L.; Brandstetter, M.; Daxer, A.; Hüttler, C.; Kudlacek, T.; Jung, M.H.; Jung, T. Decline of European beech in Austria: Involvement of Phytophthora spp. and contributing biotic and abiotic factors. Forests 2020, 11, 895. [Google Scholar] [CrossRef]
- Gessler, A.; Keitel, C.; Kreuzwieser, J.; Matyssek, R.; Seiler, W.; Rennenberg, H. Potential risks for European beech (Fagus sylvatica L.) in a changing climate. Trees 2007, 21, 1–11. [Google Scholar] [CrossRef]
- Köcher, P.; Gebauer, T.; Horna, V.; Leuschner, C. Leaf water status and stem xylem flux in relation to soil drought in five temperate broad-leaved tree species with contrasting water use strategies. Ann. For. Sci. 2009, 66, 101–111. [Google Scholar] [CrossRef]
- Leuschner, C. Drought response of European beech (Fagus sylvatica L.)—A review. Perspec. Plant Ecol. Evol. Syst. 2020, 47, 125576. [Google Scholar] [CrossRef]
- Meyer, P.; Spinu, A.P.; Mölder, A.; Bauhus, J. Management alters drought-induced mortality patterns in European beech (Fagus sylvatica L.) forests. Plant Biol. 2022, 24, 1157–1170. [Google Scholar] [CrossRef]
- Chuste, P.-A.; Maillard, P.; Bréda, N.; Levillain, J.; Thirion, E.; Wortemann, R.; Massonnet, C. Sacrificing growth and maintaining a dynamic carbohydrate storage are key processes for promoting beech survival under prolonged drought conditions. Trees 2020, 34, 381–394. [Google Scholar] [CrossRef]
- Chakraborty, T.; Saha, S.; Matzarakis, A.; Reif, A. Influence of multiple biotic and abiotic factors on the crown die-back of European beech trees at their drought limit. Flora 2017, 229, 58–70. [Google Scholar] [CrossRef]
- NW-FVA. Waldzustandsbericht 2022 für Sachsen-Anhalt; Nordwestdeutsche Forstliche Versuchsanstalt, Ministerium für Wirtschaft, Tourismus, Landwirtschaft und Forsten des Landes Sachsen-Anhalt: Göttingen, Germany, 2022. [Google Scholar] [CrossRef]
- Gossner, M.M.; Vitasse, Y.; Queloz, V.; Wohlgemuth, T. Laubfall im Sommer als Indiz für späteres Buchensterben. Wald und Holz 2022, 9/22, 10–13. [Google Scholar]
- Obladen, N.; Dechering, P.; Skiadaresis, G.; Tegel, W.; Keßler, J.; Höllerl, S.; Kaps, S.; Hertel, M.; Dulamsuren, C.; Seifert, T.; et al. Tree mortality of European beech and Norway spruce induced by 2018–2019 hot droughts in central Germany. Agric. For. Meteorol. 2021, 307, 108482. [Google Scholar] [CrossRef]
- Frei, E.R.; Gossner, M.M.; Vitasse, Y.; Queloz, V.; Dubach, V.; Gessler, A.; Ginzler, C.; Hagedorn, F.; Meusburger, K.; Moor, M.; et al. European beech dieback after premature leaf senescence during the 2018 drought in northern Switzerland. Plant Biol. 2022, 24, 1132–1145. [Google Scholar] [CrossRef]
- Weigel, R.; Bat-Enerel, B.; Dulamsuren, C.; Muffler, L.; Weithmann, G.; Leuschner, C. Summer drought exposure, stand structure, and soil properties jointly control the growth of European beech along a steep precipitation gradient in northern Germany. Glob. Change Biol. 2023, 29, 763–779. [Google Scholar] [CrossRef]
- Diers, M.; Weigel, R.; Leuschner, C. Both climate sensitivity and growth trend of European beech decrease in the North German Lowlands, while Scots pine still thrives, despite growing sensitivity. Trees 2023, 37, 523–543. [Google Scholar] [CrossRef]
- Bunn, A.G. A dendrochronology program library in R (dplR). Dendrochronologia 2008, 26, 115–124. [Google Scholar] [CrossRef]
- Zang, C.S.; Biondi, F. Treeclim: An R package for the numerical calibration of proxy-climate relationships. Ecography 2015, 38, 431–436. [Google Scholar] [CrossRef]
- Cochard, H.; Damour, G.; Bodet, C.; Tharwat, I.; Poirier, M.; Améglio, T. Evaluation of a new centrifuge technique for rapid generation of xylem vulnerability curves. Physiol. Plant 2005, 124, 410–418. [Google Scholar] [CrossRef]
- Weithmann, G.; Schuldt, B.; Leuschner, C. Soil water availability and branch age explain variability in xylem safety of European beech in Central Europe. Oecologia 2022, 198, 629–644. [Google Scholar] [CrossRef] [PubMed]
- Weithmann, G.; Schuldt, B.; Link, R.M.; Heil, D.; Hoeber, S.; John, H.; Müller-Haubold, H.; Schüller, L.-M.; Schumann, K.; Leuschner, C. Leaf trait modification in European beech trees in response to climatic and edaphic drought. Plant Biol. 2022, 24, 1272–1286. [Google Scholar] [CrossRef] [PubMed]
- Meier, I.C.; Leuschner, C. Leaf size and leaf area index in Fagus sylvatica forests: Competing effects of precipitation, temperature and nitrogen availability. Ecosystems 2008, 11, 655–669. [Google Scholar] [CrossRef]
- Hertel, D.; Strecker, T.; Müller-Haubold, H.; Leuschner, C. Fine root biomass and dynamics in beech forests across a precipitation gradient—is optimal resource partitioning theory applicable to water-limited mature trees? J. Ecol. 2013, 101, 1183–1200. [Google Scholar] [CrossRef]
- Bundesamt für Naturschutz. Karte der potentiellen natürlichen Vegetation Deutschlands. Maßstab 1:500000; Bonn-Bad: Godesberg, Germany, 2010. [Google Scholar]
- Leuschner, C.; Förster, A.; Diers, M.; Culmsee, H. Are Northern German Scots pine plantations climate smart? The impact of large-scale conifer planting on climate, soil and the water cycle. For. Ecol. Manag. 2022, 507, 120013. [Google Scholar] [CrossRef]
- Kremser, W. Niedersächsische Forstgeschichte; Rotenburger Schriften (Rotenburg/W.): Rotenburg, Germany, 1990; Volume 32, 965p. [Google Scholar]
- Bat-Enerel, B.; Weigel, R.; Leuschner, C. Changes in the thermal and hydrometeorological forest growth climate during 1948–2017 in northern Germany. Front. For. Glob. Change 2022, 5, 830977. [Google Scholar] [CrossRef]
- Čufar, K.; Prislan, P.; de Luis, M.; Gričar, J. Tree-ring variation, wood formation and phenology of beech (Fagus sylvatica) from a representative site in Slovenia, SE Central Europe. Trees 2008, 22, 749–758. [Google Scholar] [CrossRef]
- Büntgen, U.; Urban, O.; Krusic, P.J.; Rybníček, M.; Kolář, T.; Kyncl, T.; Ač, A.; Koňasová, E.; Čáslavský, J.; Esper, J.; et al. Recent European drought extremes beyond the Common Era background variability. Nat. Geosci. 2021, 14, 190–196. [Google Scholar] [CrossRef]
- Braun, S.; Hopf, S.-E.; Tresch, S.; Remund, J.; Schindler, C. 37 years of forest monitoring in Switzerland: Drought effects on Fagus sylvatica. Front. For. Glob. Change 2021, 4, 765782. [Google Scholar] [CrossRef]
- Klesse, S.; Wohlgemuth, T.; Meusburger, K.; Vitasse, Y.; von Arx, G.; Lévesque, M.; Neycken, A.; Braun, S.; Dubach, V.; Gessler, A.; et al. Long-term soil water limitation and previous tree vigor drive local variability of drought-induced crown dieback in Fagus sylvatica. Sci. Total Environ. 2022, 851, 157926. [Google Scholar] [CrossRef]
- Neycken, A.; Scheggia, M.; Bigler, C.; Lévesque, M. Long-term growth decline precedes sudden crown dieback of European beech. Agric. For. Meteorol. 2022, 324, 109103. [Google Scholar] [CrossRef]
- Schuldt, B.; Buras, A.; Arend, M.; Vitasse, Y.; Beierkuhnlein, C.; Damm, A.; Gharun, M.; Grams, T.E.E.; Hauck, M.; Hajek, P.; et al. A first assessment of the impact of the extreme 2018 summer drought on Central European forests. Basic Appl. Ecol. 2020, 45, 86–103. [Google Scholar] [CrossRef]
- Arend, M.; Link, R.M.; Zahnd, C.; Hoch, G.; Schuldt, B.; Kahmen, A. Lack of hydraulic recovery as a cause of post-drought foliage reduction and canopy decline in European beech. New Phytol. 2022, 234, 1195–1205. [Google Scholar] [CrossRef] [PubMed]
- Wohlgemuth, T.; Kistler, M.; Aymon, C.; Hagedorn, F.; Gessler, A.; Gossner, M.M.; Queloz, V.; Vögtli, I.; Wasem, U.; Vitasse, Y.; et al. Früher Laubfall der Buche während der Sommertrockenheit 2018: Resistenz oder Schwächesymptom? Schweiz. Z. Fur Forstwes. 2020, 171, 257–269. [Google Scholar] [CrossRef]
- Dulamsuren, C.; Bat-Enerel, B.; Meyer, P.; Leuschner, C. Did stand opening 60 years ago predispose a European beech population to death? Trees For. People 2022, 8, 100265. [Google Scholar] [CrossRef]
- Piovesan, G.; Biondi, F.; Di Filippo, A.; Alessandrini, A.; Maugeri, M. Drought-driven growth reduction in old beech (Fagus sylvatica L.) forests of the central Apennines, Italy. Glob. Change Biol. 2008, 14, 1265–1281. [Google Scholar] [CrossRef]
- Thonfeld, F.; Gessner, U.; Holzwarth, S.; Kriese, J.; da Ponte, E.; Huth, J.; Kuenzer, C. A first assessment of canopy cover loss in Germany’s forests after the 2018–2020 drought years. Remote Sens. 2022, 14, 562. [Google Scholar] [CrossRef]
- MLUK. Waldschutzbericht 2019—Landeskompetenzzentrum Forst Eberswalde, Fachbereich Waldschutz und Wildökologie; Ministry for Rural Development, Environment and Climate Protection, Federal State of Brandenburg (MLUK): Potsdam, Germany, 2020. [Google Scholar]
- Knutzen, F.; Dulamsuren, C.; Meier, I.C.; Leuschner, C. Recent climate warming-related growth decline impairs European beech in the center of its distribution range. Ecosystems 2017, 20, 1494–1511. [Google Scholar] [CrossRef]
- Stolz, J.; van der Maaten, E.; Kalanke, E.; Martin, J.; Wilmking, M.; van der Maaten-Theunissen, M. Increasing climate sensitivity of beech and pine is not mediated by adaptatzion and soil characteristics along a precipitation gradient in northeastern Germany. Dendrochronologia 2021, 67, 125834. [Google Scholar] [CrossRef]
- Zolina, O.; Simmer, C.; Belyaev, K.; Gulev, S.K.; Koltermann, O. Changes in the duration of European wet and dry spells during the last 60 years. J. Clim. 2013, 26, 2022–2047. [Google Scholar] [CrossRef]
- Hanel, M.; Rakovec, O.; Markonis, Y.; Máca, P.; Samaniego, L.; Kyselý, J.; Kumar, R. Revisiting the recent European droughts from a long-term perspective. Sci. Rep. 2018, 8, 9499. [Google Scholar] [CrossRef] [PubMed]
- Meier, I.C.; Knutzen, F.; Eder, L.M.; Müller-Haubold, H.; Göbel, M.; Bachmann, J.; Hertel, D.; Leuschner, C. The deep root system of Fagus sylvatica on sandy soil: Structure and variation across a precipitation gradient. Ecosystems 2018, 21, 280–296. [Google Scholar] [CrossRef]
- Müller-Haubold, H.; Hertel, D.; Seidel, D.; Knutzen, F.; Leuschner, C. Climate responses of aboveground productivity and allocation in Fagus sylvatica: A transect study in mature forests. Ecosystems 2013, 16, 1498–1516. [Google Scholar] [CrossRef]
- Drobyshev, I.; Niklasson, M.; Mazerolle, M.J.; Bergeron, Y. Reconstruction of a 253-year long mast record of European beech reveals its association with large scale temperature variability and no long-term trend in mast frequencies. Agric. For. Meteorol. 2014, 192–193, 9–17. [Google Scholar] [CrossRef]
- Hacket-Pain, A.J.; Ascoli, D.; Vacchiano, G.; Biondi, F.; Cavin, L.; Conedera, M.; Drobyshev, I.; Dorado Liñán, I.; Friend, A.D.; Grabner, M.; et al. Climatically controlled reproduction drives inter-annual growth variability in a temperate tree species. Ecol. Lett. 2018, 21, 1833–1844. [Google Scholar] [CrossRef]
- DeSoto, L.; Cailleret, M.; Sterck, F.; Jansen, S.; Kramer, K.; Robert, E.M.R.; Aakala, T.; Amoroso, M.M.; Bigler, C.; Camarero, J.J.; et al. Low growth resilience to drought is related to future mortality risk in trees. Nat. Commun. 2020, 11, 545. [Google Scholar]
- Zimmermann, J.; Link, R.M.; Hauck, M.; Leuschner, C.; Schuldt, B. A 60-year record of stem xylem anatomy and related hydraulic modification under increasing summer drought in ring-and diffuse-porous temperate broad-leaved tree species. Trees 2021, 35, 917–937. [Google Scholar] [CrossRef]
- Ghirardo, A.; Blande, J.D.; Ruehr, N.K.; Balestrini, R.; Külheim, C. Editorial: Adaptation of trees to climate change: Mechanisms behind physiological and ecological resilience and vulnerability. Front. For. Glob. Change 2022, 4, 831701. [Google Scholar] [CrossRef]
- Carsjens, C.; Ngoc Quynh, N.; Knutzen, F.; Meier, I.C.; Müller, M.; Finkeldey, R.; Leuschner, C.; Polle, A. Intra-specific variations in expression of stress-related genes in beech progenies are stronger than drought-induced responses. Tree Physiol. 2014, 34, 1348–1361. [Google Scholar] [CrossRef]
- Meger, J.; Ulaszewski, B.; Burczyk, J. Genomic signatures of natural selection at phenology-related genes in a widely distributed tree species Fagus sylvatica L. BMC Genom. 2021, 22, 583. [Google Scholar] [CrossRef]
- Weithmann, G.; Paligi, S.S.; Schuldt, B.; Leuschner, C. Branch xylem vascular adjustments in European beech in response to decreasing water availability across a precipitation gradient. Tree Physiol. 2022, 42, 2224–2238. [Google Scholar] [CrossRef] [PubMed]
- Aranda, I.; Bahamonde, H.A.; Sánchez-Gómez, D. Intra-population variability in the drought response of a beech (Fagus sylvatica L.) population in the southwest of Europe. Tree Physiol. 2017, 37, 938–949. [Google Scholar] [CrossRef] [PubMed]
- Bossdorf, O.; Richards, C.L.; Pigliucci, M. Epigenetics for ecologists. Ecol. Lett. 2008, 11, 106–115. [Google Scholar] [CrossRef]
- Herrel, A.; Joly, D.; Danchin, E. Epigenetics in ecology and evolution. Funct. Ecol. 2020, 34, 381–384. [Google Scholar] [CrossRef]
- Kozlowski, T.T.; Pallardy, S.G. Acclimation and adaptive responses of woody plants to environmental stresses. Bot. Rev. 2002, 68, 270–334. [Google Scholar]
- Sanders, G.J.; Arndt, S.K. Osmostic adjustment under drought conditions. In Plant Responses to Drought Stress; Aroca, R., Ed.; Springer: Berlin/Heidelberg, Germany, 2012; pp. 199–229. [Google Scholar]
- Leuschner, C.; Schipka, F.; Backes, K. Stomatal regulation and water potential variation in European beech: Challenging the iso/anisohydry concept. Tree Physiol. 2021, 42, 365–378. [Google Scholar] [CrossRef]
- Schuldt, B.; Knutzen, F.; Delzon, S.; Jansen, S.; Müller-Haubold, H.; Burlett, R.; Clough, Y.; Leuschner, C. How adaptable is the hydraulic system of European beech in the face of climate change-related precipitation reduction? New Phytol. 2016, 210, 443–458. [Google Scholar] [CrossRef]
- Robson, T.M.; Garzón, M.B.; Miranda, R.A.; Egido, D.B.; Bogdan, S.; Borovics, A.; Božič, G.; Brendel, O.; Clark, J.; De Vries, S.M.; et al. Phenotypic trait variation measured on European genetic trials of Fagus sylvatica L. Sci. Data 2018, 5, 180149. [Google Scholar] [CrossRef]
- Stojnić, S.; Orlović, S.; Ballian, D.; Ivankovic, M.; Šijačić-Nikolić, M.; Pilipović, A.; Bogdan, S.; Kvesić, S.; Mataruga, M.; Daničić, V.; et al. Provenance by site interaction and stability analysis of European beech (Fagus sylvatica L.) provenances grown in common garden experiments. Silvae Genet. 2015, 64, 133–147. [Google Scholar] [CrossRef]
- Hajek, P.; Kurjak, D.; von Wühlisch, G.; Delzon, S.; Schuldt, B. Intraspecific variation in wood anatomical, hydraulic, and foliar traits in ten European beech provenances differing in growth yield. Front. Plant Sci. 2016, 7, 791. [Google Scholar] [CrossRef]
- Gessler, A.; Bottero, A.; Marshall, J.; Arend, M. The way back: Recovery of trees from drought and its implication for acclimation. New Phytol. 2020, 228, 1704–1709. [Google Scholar] [CrossRef] [PubMed]
- Cavin, L.; Jump, A.S. Highest drought sensitivity and lowest resistance to growth suppression are found in the range core of the tree Fagus sylvatica L. not the equatorial range edge. Glob. Change Biol. 2017, 23, 362–379. [Google Scholar] [CrossRef]
- Magri, D.; Vendramin, G.G.; Comps, B.; Dupanloup, I.; Geburek, T.; Gömöry, D.; Latalowa, M.; Litt, T.; Paule, L.; Roure, J.M.; et al. A new scenario for the Quaternary history of European beech populations: Palaeobotanical evidence and genetic consequences. New Phytol. 2006, 171, 199–221. [Google Scholar] [CrossRef] [PubMed]
- Muffler, L.; Weigel, R.; Hacket-Pain, A.J.; Klisz, M.; van der Maaten, E.; Wilmking, M.; Kreyling, J.; van der Maaten-Theunissen, M. Lowest drought sensitivity and decreasing growth synchrony towards the dry distribution margin of European beech. J. Biogeogr. 2020, 47, 1910–1921. [Google Scholar] [CrossRef]
- Buhk, C.; Kämmer, M.; Beierkuhnlein, C.; Jentsch, A.; Kreyling, J.; Jungkunst, H.F. On the influence of provenance to soil quality enhanced stress reaction of young beech trees to summer drought. Ecol. Evol. 2016, 6, 8276–8290. [Google Scholar] [CrossRef]
- Thiel, D.; Kreyling, J.; Backhaus, S.; Beierkuhnlein, C.; Buhk, C.; Egen, K.; Huber, G.; Konnert, M.; Nagy, L.; Jentsch, A. Different reactions of central and marginal provenances of Fagus sylvatica to experimental drought. Eur. J. For. Res. 2014, 133, 247–260. [Google Scholar] [CrossRef]
- Jump, A.S.; Peñuelas, J. Running to stand still. Adaptation and the response of plants to rapid climate change. Ecol. Lett. 2005, 8, 1010–1020. [Google Scholar] [CrossRef]
- Lee, J.-Y.; Marotzke, J.; Bala, G.; Cao, L.; Corti, S.; Dunne, J.P.; Engelbrecht, F.; Fischer, E.; Fyfe, J.C.; Jones, C.; et al. Future Global Climate: Scenario-Based Projections and Near-Term Information. In Climate Change 2021: The Physical Science Basis. Contribution of Working Group I to the Sixth Assessment Report of the Intergovernmental Panel on Climate Change; Masson-Delmotte, V., Zhai, P., Pirani, A., Connors, S.L., Péan, C., Berger, S., Caud, N., Chen, Y., Goldfarb, L., Gomis, M.I., et al., Eds.; Cambridge University Press: Cambridge, UK, 2021; pp. 553–672. [Google Scholar]
- Gillner, S.; Rüger, N.; Roloff, A.; Berger, U. 2013. Low relative growth rates predict future mortality of common beech (Fagus sylvatica L.). For. Ecol. Manag. 2013, 302, 372–378. [Google Scholar] [CrossRef]
- Martinez del Castillo, E.; Zang, C.; Buras, A.; Hacket-Pain, A.; Esper, J.; Serrano-Notivoli, R.; Hartl, C.; Weigel, R.; Klesse, S.; de Dios, V.R.; et al. Climate-change-driven growth decline of European beech forests. Commun. Biol. 2022, 5, 163. [Google Scholar]
- Pretzsch, H.; Bieber, P.; Schütze, G.; Uhl, E.; Rötzer, T. Forest stand growth dynamics in Central Europe have accelerated since 1870. Nat. Commun. 2014, 5, 4967. [Google Scholar] [CrossRef]
- Cailleret, M.; Jansen, S.; Robert, E.M.R.; Desoto, L.; Aakala, T.; Antos, J.A.; Beikircher, B.; Bigler, C.; Bugmann, H.; Caccianniga, M.; et al. A synthesis of radial growth patterns preceding tree mortality. Glob. Change Biol. 2017, 23, 1675–1690. [Google Scholar] [CrossRef] [PubMed]
- Keen, R.W.; Voelker, S.L.; Wang, S.-Y.S.; Bentz, B.J.; Goulden, M.L.; Dangerfield, C.R.; Reed, C.C.; Hood, S.M.; Csank, A.Z.; Dawson, T.E.; et al. Changes in tree drought sensitivity provided early warming signals to the California drought and forest mortality event. Glob. Change Biol. 2021, 28, 1119–1132. [Google Scholar] [CrossRef] [PubMed]
- Leuschner, C.; Hohnwald, S.; Petritan, A.; Walentowski, H. Vertical temperature and air humidity gradients in beech and oak forests, and the forest interior climate created by beech. Flora 2023, 305, 152317. [Google Scholar] [CrossRef]


Disclaimer/Publisher’s Note: The statements, opinions and data contained in all publications are solely those of the individual author(s) and contributor(s) and not of MDPI and/or the editor(s). MDPI and/or the editor(s) disclaim responsibility for any injury to people or property resulting from any ideas, methods, instructions or products referred to in the content. |
© 2023 by the authors. Licensee MDPI, Basel, Switzerland. This article is an open access article distributed under the terms and conditions of the Creative Commons Attribution (CC BY) license (https://creativecommons.org/licenses/by/4.0/).
Share and Cite
Leuschner, C.; Weithmann, G.; Bat-Enerel, B.; Weigel, R. The Future of European Beech in Northern Germany—Climate Change Vulnerability and Adaptation Potential. Forests 2023, 14, 1448. https://doi.org/10.3390/f14071448
Leuschner C, Weithmann G, Bat-Enerel B, Weigel R. The Future of European Beech in Northern Germany—Climate Change Vulnerability and Adaptation Potential. Forests. 2023; 14(7):1448. https://doi.org/10.3390/f14071448
Chicago/Turabian StyleLeuschner, Christoph, Greta Weithmann, Banzragch Bat-Enerel, and Robert Weigel. 2023. "The Future of European Beech in Northern Germany—Climate Change Vulnerability and Adaptation Potential" Forests 14, no. 7: 1448. https://doi.org/10.3390/f14071448
APA StyleLeuschner, C., Weithmann, G., Bat-Enerel, B., & Weigel, R. (2023). The Future of European Beech in Northern Germany—Climate Change Vulnerability and Adaptation Potential. Forests, 14(7), 1448. https://doi.org/10.3390/f14071448