Article

Developing Growth and Harvest Prediction Models for Mixed Coniferous and Broad-Leaved Forests at Different Ages

1
Forestry College, Fujian Agriculture and Forestry University, Fuzhou 350002, China
2
Department of College of Ecology and Resource Engineering, Wuyi University, Wuyishan 354300, China
3
Forest Seed and Seedling General Station of Fujian Province, Fuzhou 350003, China
4
Survey Planning and Design Institute, State Forestry and Grassland Administration, Beijing 100714, China
*
Author to whom correspondence should be addressed.
Forests 2023, 14(7), 1416; https://doi.org/10.3390/f14071416
Submission received: 28 May 2023 / Revised: 8 July 2023 / Accepted: 10 July 2023 / Published: 11 July 2023
(This article belongs to the Special Issue Advances in Forest Growth and Site Productivity Modeling—Series II)

Abstract

:
In order to clarify the combined impact of tree species composition, site quality, and stand age on the growth and harvest of mixed forests, the prediction models of average DBH and stand volume for mixed forests were established, respectively. The interval period and tree species composition coefficient (TSCC) were considered as independent variables. These models were then optimized by using the particle swarm optimization algorithm for reparameterization and evaluating their applicability. It was found that after introducing the site quality grade and TSCC, the average stand height prediction model showed a better fitting result. The fit accuracy of the average DBH prediction model and the stand volume prediction model were both improved with the help of the TSCC, mainly because the tree species composition affects the growth rate of the average stand height and average DBH and the maximum growth rate of the stand volume. The degree of the impact can be sorted as Cunninghamia lanceolata > Pinus massoniana > hard broad-leaved tree species (group). Overall, the established growth and harvest prediction models for mixed forests with the interval period and TSCC as independent variables have high fit accuracy and applicability.

1. Introduction

The growth and harvest prediction model is a mathematical function that describes the relationship between stand growth, stand status, and stand condition variables. Based on this model, the stand growth, harvest, and dieback can be predicted using the ratio and derivation methods [1,2]. There are two main types of growth and harvest prediction models. One is the single tree model, established based on traditional linear regression or nonlinear mixed effects. This type of model can accurately predict the growth pattern of a single tree, but it cannot directly estimate the growth and harvest at the forest level due to the lack of density indicators. The forest yield can only be determined through accumulation calculation, with low model estimation accuracy. This is mainly because the impact of differences in site conditions and other factors on forest growth is not considered. The other is the artificial forest or ancient woodland model, established with site quality, age, and density as independent variables. This kind of stand growth model can directly predict the growth and harvest at the stand level and reduce the error accumulation of individual trees.
Since the 1970s, growth and harvest prediction models have become an internationally recognized independent research direction. The research mainly focuses on the construction of theoretical frameworks for forest multi-scale random growth simulation, spatial evaluation models of site quality growth, harvest and management models for natural mixed forests [3,4], etc. However, the existing research on growth and harvest prediction models is mainly conducted on artificial forests or natural pure forests.
Natural mixed, uneven-aged forests have diverse tree species compositions, varying ages, and complex site environments. It is necessary to take into account these issues when constructing a growth and harvest prediction model for natural, mixed, uneven-aged forests [4,5]. However, previous studies have not proposed a model that involves or addresses all three issues simultaneously. Therefore, it is of great valuableness and practicality to construct a growth and harvest prediction model for natural mixed, uneven-aged forests, with the consideration of stand age, site quality, and tree species composition [6,7].
Natural mixed, uneven-aged forests are one of the most important forest stand types. The importance of natural mixed forests in terms of biodiversity conservation, productivity, and carbon sequestration capacity has been recognized worldwide. Many related studies have shown that natural mixed forests have higher ecological resilience than pure forests, especially mixed coniferous and broad-leaved forests, which show more resilience after disturbance [8,9,10,11]. According to the results of the Ninth Continuous Forest Inventory in Fujian, the area of mixed coniferous and broad-leaved forests accounts for 8% of total forests, with a storage volume of 1.24 × 10⁷ m3. How to operate and manage mixed coniferous and broad-leaved forests well is an important question to guide the practice of forestry production. Basic research on mixed coniferous and broad-leaved forests such as growth and harvest prediction models and mixing effects can provide references for the formulation of scientific and reasonable forest management guidelines. However, a large number of research methods on growth and harvest prediction models for mixed coniferous and broad-leaved heterogeneous forests are mainly for pure plantations [12,13,14,15], focusing on the improvement in model parameter estimation methods, such as mixed effects models and intelligent optimization algorithms [16].
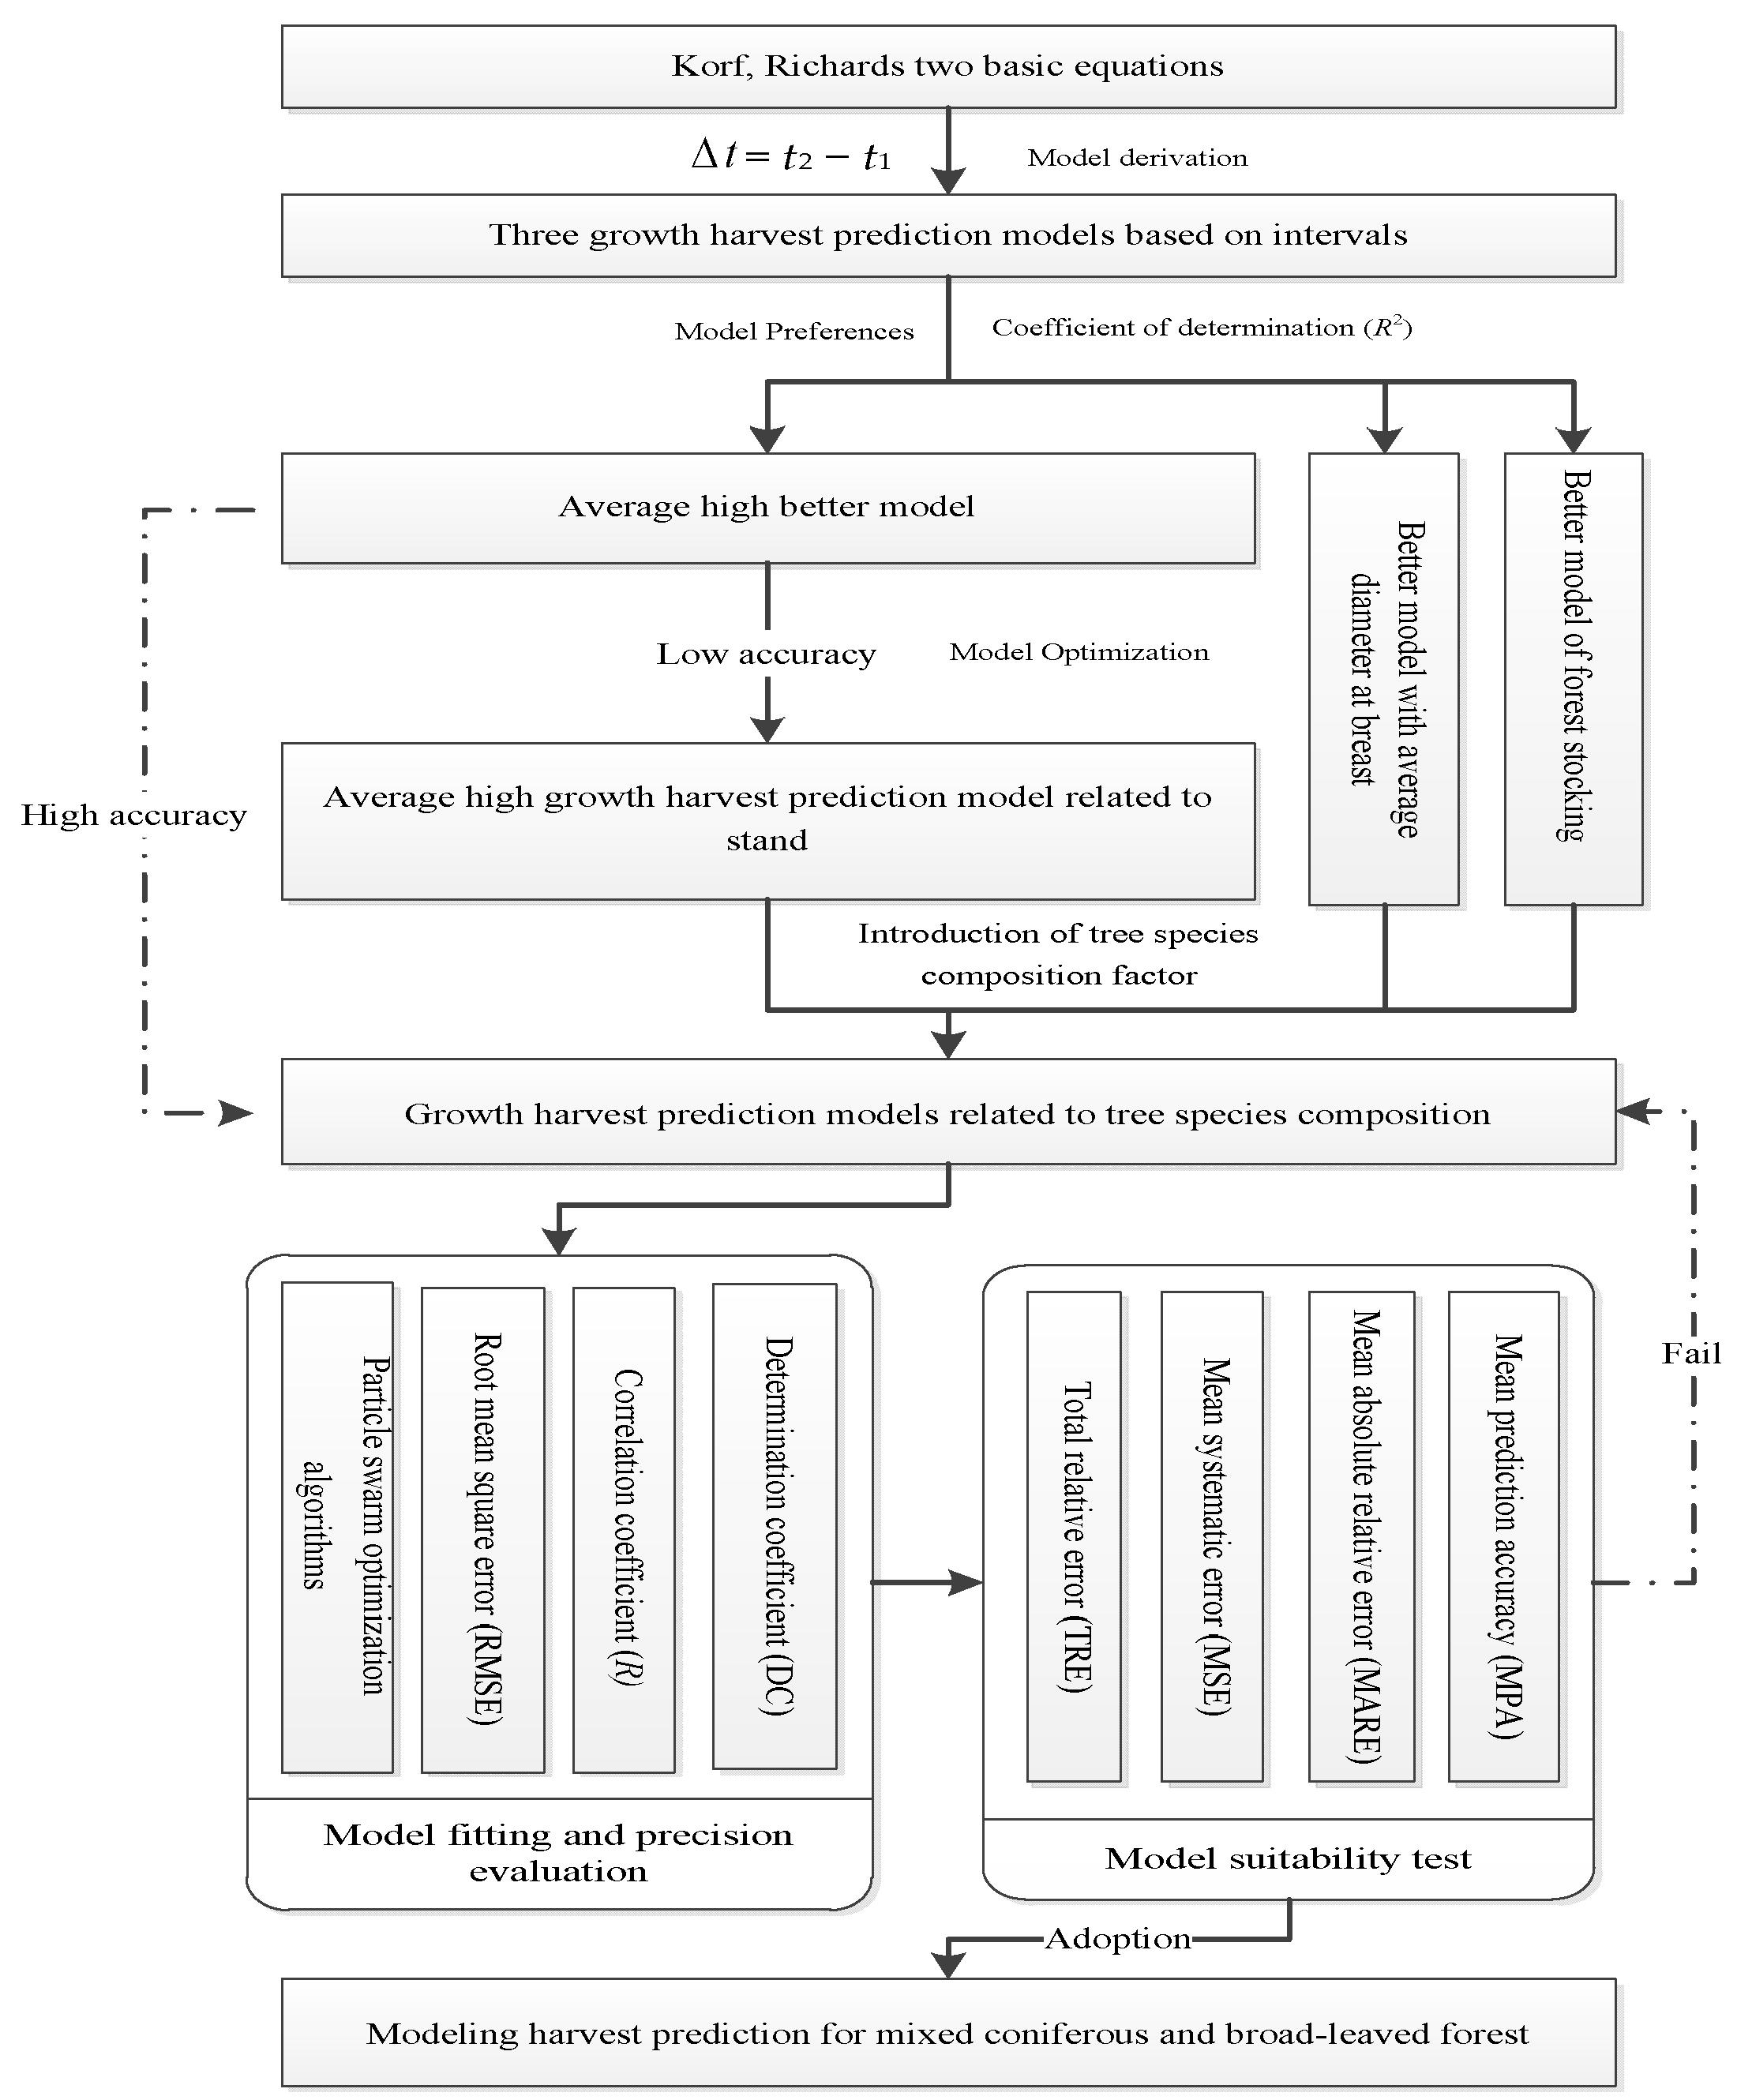
Fujian Province, which has the highest forest coverage rate in China, was selected as the study area, and mixed coniferous and broad-leaved forests of different ages were chosen as the study objects. With such a study area as the basis, the issues of stand age, site quality, and tree species composition in mixed coniferous and broad-leaved forests could be simultaneously addressed [6]. Two theoretical growth equations, i.e., Korf and Richards, were used to build the growth and harvest prediction models for the mixed coniferous and broad-leaved forests. The interval period (referred to as interval, Δ t = t2t1,) rather than the stand age was considered as an independent variable [9]. Site quality grade and the tree species composition coefficient (TSCC) were introduced to optimize the models. Using these models, the growth and dynamic changes in the mixed coniferous and broad-leaved forests at different ages were revealed, which solved the problems of diverse species composition, varying ages of uneven-aged forests, and complex site environments. The models are conducive to improving the modern management of forest resources, and the specific technical route of the models is shown in Figure 1.

2. Materials and Methods

2.1. Study Area and Survey Data

The study area is located in southeastern China (23°33′–28°20′ N, 115°50′–120°40′ E). This area has a subtropical monsoon climate and is warm and humid, with an average annual rainfall of 1400–2000 mm, which makes it one of the most rainfall-rich provinces in China. It is rich in forest resources, and the forest coverage is 66.80%. The forest area is divided into the subtropical broad-leaved evergreen forest area in the central and western regions and the subtropical monsoonal forest area in the eastern region. It is a research hotspot for scholars specializing in forestry and ecology and an important place for forestry production practices (Figure 2).
The data of multi-period samples in this study came from the national forest resources continuous inventory (abbreviated as Class I) and the second category survey of forest resources (abbreviated as Class II) in Fujian Province. The data in Class I survey include 5 periods, i.e., 1998, 2003, 2008, 2013, and 2018, and the data in Class II survey include 2 periods, i.e., 2007 and 2017. The distribution of samples is shown in Figure 2, and the main factors of forest stands are shown in Table 1 and Table A1. After excluding abnormal data via the triple standard deviation method, a total of 3563 sample data were collected, of which 30% were reserved for the model test. The test samples were sorted based on the stand quality grades in terms of average DBH, average stand height, and stand volume, respectively. The data were repeatedly marked 1, 2, and 3, and those marked as 3 were used as test samples.
From Figure 2, it can be seen that a large number of samples are distributed in Nanping, Sanming, Longyan, and other mountainous areas and some coastal areas. Each of the samples has an area of 0.067 ha, with a length × width of 25.82 m × 25.82 m. The average DBH of each tree was measured and determined using a girth ruler. The average stand height was determined by estimating the standard tree height. The TSCC was determined using the stand volume, in which the stand volume can be calculated via the binary volume formula. The stand age was determined by drilling cores of standard trees at 0.3 m from the ground with a growth cone, and the sampled stand data are shown in Table 2.

2.2. Construction of an Interval-Based Growth and Harvest Prediction Model for Different-Aged Forests

For certain types of stands in the same stand environment, a basic model for average DBH (D), average stand height (H), and stand volume (M) can be established as y = f ( t , β ^ , δ ) [17], where y is the dependent variable, t is the mean age of stand, β ^ is the model prediction parameter, δ is the error term, and f is the growth and harvest prediction model. In the asset evaluation of natural uneven-aged forests, it is necessary to determine the cutting cycle. However, in reality, the commonly used method for evaluation is the present value method of selection income, and the corresponding cutting cycle is not considered in the growth of and changes in the forest. A fixed cutting cycle is often used, which affects the correctness and fairness of the evaluation conclusions of natural uneven-aged forests. At the same time, the growth of natural uneven-aged forests is a complex process with changes, and the age structure is also complex. Therefore, the mean age of stand (t) in this study was changed to the stand growth interval ( Δ t , referred to as interval period), i.e., Δ t = t2t1, to solve the problem that the mean age of a stand is not easy to determine. By choosing two common theoretical growth equations, i.e., Korf and Richards, as the base models [18], the interval-based growth and harvest prediction model can be derived by Δ t = t2t1 as follows:
y 2 = a 1 1 y 1 a × e c × Δ t + δ
y 2 = a 1 1 y 1 a 1 b × e c × Δ t b + δ
In the formulas, y1 and y2 are the stand factors at the beginning and end of the period, respectively, and a, b, and c are the estimated parameters of the model.
All data were used as the basic modeling data of D, H, and M regardless of TSCC, and the model parameters were solved using the particle swarm optimization algorithm. The model was then optimized according to the coefficient of determination (R2). It was found that the model based on the Richards equation can better describe the growth patterns of stand average DBH and stand volume, while the model based on the Korf equation can better describe the growth patterns of stand average height.

2.3. Construction of the Average Stand Height Growth and Harvest Prediction Model Related to Site Quality Grade

The three base models are not as effective as D and M in describing the growth regularity of coniferous and broad-leaved trees, and related studies have shown that the average stand height is significantly correlated with the site quality of stand. Therefore, the site quality grade, which is commonly used to evaluate site quality in Chinese forestry production practices, was introduced as a dummy variable into model (1) to construct the average stand height growth and harvest prediction model, in which the site quality grade was used as a dummy variable and the interval period was used as an independent variable.
H 2 = f 1 ( S i , a i ) { 1 [ 1 H 1 f 1 ( S i , a i ) ] } × e f 2 ( S i , c i ) × Δ t + δ
where f1 (Si, ai) = a1 S1 +a2 S2 +a3 S3 +a4 S4, f2 (Si, ci) = c1 S1 +c2 S2 +c3 S3 +c4 S4, ai and ci are model prediction parameters, i = 1, 2, 3, 4. Si is the dummy variable, which can be 0 or 1. When S1 = 1, S2, S3, and S4 are 0, and so on. S1 indicates a medium fertile site quality grade, and S4 indicates a barren site quality grade.

2.4. Construction of the Growth and Harvest Prediction Model Related to TSCC

The TSCC is in the range of [0, 10]. In forestry production practice, the mixed coniferous and broad-leaved forests are represented by a number from 1 to 10+ tree species, such as 6 hard broad-leaved tree species (group), 2 Cunninghamia lanceolata, 2 Pinus massoniana, etc., to describe the tree species composition. In order to improve the prediction accuracy of the growth and harvest model for mixed forests, the TSCC was introduced to optimize the growth and harvest prediction models with regard to D, H, and M, and each model was re-parameterized. The re-parameterized form of the growth and harvest prediction model for H is:
H 2 = f 1 1 ( S i , L i , a i , ka i j ) { 1 [ 1 H 1 f 1 1 ( S i , L i , a i , ka i j ) ] } × e f 2 ( S i , c i ) × Δ t + δ
H 2 = f 1 ( S i , L i ) { 1 [ 1 H 1 f 1 ( S i , L i ) ] × e f 21 ( S i , L i , c i , k a i j ) × Δ t } + δ
H 2 = f 1 1 ( S i , L i , a i , ka i j ) { 1 [ 1 H 1 f 1 1 ( S i , L i , a i , ka i j ) ] } × e f 21 ( S i , L i , c i , k c i j ) × Δ t + δ
where f 11 ( S i , L i , a i , ka i j ) = i = 1 4 a i S i j = 1 3 ka i j L j , f 21 ( S i , L i , c i , kc i j ) = i = 1 4 c i S i j = 1 3 kc i j L j , kaij is the estimated parameter of the model; Li is the tree species composition coefficient (TSCC). i = 1, 2, and 3, representing Cunninghamia lanceolata, Pinus massoniana, and hard broad-leaved tree species (group), respectively. In this study, the TSCC is divided by 10, so that Li is in the range of [0, 1] and is more in line with the meaning of the TSCC in forestry production, i.e., the stand volume (cross-sectional area) of the target tree species/the total stand volume or cross-sectional area of the stand.
The re-parameterized form of the growth and harvest prediction model with regard to D and M is:
y 2 = f 12 ( L i , a i ) 1 1 y 1 f 12 ( L i , a i ) 1 b × e c × Δ t b + δ
y 2 = f 12 ( L i , a i ) 1 1 y 1 f 12 ( L i , a i ) 1 f 3 ( L i , b i ) × e c × Δ t f 3 ( L i , b i ) + δ
y 2 = f 12 ( L i , a i ) 1 1 y 1 f 12 ( L i , a i ) 1 f 3 ( L i , b i ) × e f 22 ( L i , c i ) × Δ t ) f 3 ( L i , b i ) + δ
y 2 = a 1 1 y 1 a 1 f 3 ( L i , b i ) × e c × Δ t ) f 3 ( L i , b i ) + δ
y 2 = a 1 1 y 1 a 1 f 3 ( L i , b i ) × e f 22 ( L i , c i ) × Δ t ) f 3 ( L i , b i ) + δ
y 2 = a 1 1 y 1 a 1 b × e f 22 ( L i , c i ) × Δ t ) b + δ
where f12(Li, ai) = a1L1 + a2L2 + a3L3, f22(Li, ci) = c1L1 + c2L2 + c3L3, and f3(Li, bi) = b1L1 + b2L2 + b3L3.

2.5. Solution and Applicability Evaluation of Model Parameters

The model parameters were solved using the particle swarm optimization algorithm, which is a stochastic evolutionary method based on swarm intelligence [19]. It has a simple operation, good scalability, and certain robustness. Its basic principle is that each particle is assumed to know the best position it experiences in the current space and is denoted as gbest(T). When looking for the minimization optimization problem, there is gbest(T) = min{kbest1(T), kbest2(T), … kbestn(T)}. When the algorithm goes to the next generation, the particles in the space will update the speed and position according to the information of the previous generation and the current information. The updated formula is:
x a T + 1 = x a T + z a T + 1
z a T + 1 = z a T + c 1 × r 1 × kbest a T x a T + c 2 × r 2 × ( kbest a T x a T )
Substituting the updated velocity into Equations (13) and (14) to obtain a new position, the particles will update their positions by continuously iterating until the optimal position is found.
The fit accuracy of the model was evaluated using the root mean square error (RMSE). The applicability was assessed based on the model accuracy evaluation indicators, including the total relative error (TRE), mean systematic error (MSE), mean absolute percentage systematic error (MPSE), and mean prediction error (MPE). The respective calculation formulas are as follows:
RMSE = 1 n i = 1 n ( y i y ^ i ) 2
TRE = i = 1 n y i i = 1 n y ^ i i = 1 n y ^ i × 100 %
MSE = 1 n i = 1 n y i y ^ i y ^ i × 100 %
MPSE = 1 n i = 1 n y i y ^ i y ^ i × 100 %
MPE = 1 t α i = 1 n ( y i y ^ i ) 2 y ¯ ^ n ( n m ) × 100 %
where yi is the measured value, y ^ i is the estimated value, n is the sample size, ta is the t-distribution value at the confidence level of a = 0.05, y ¯ ^ is the mean estimated value and y ¯ ^ = 1 n y ^ i , and i = 1, 2, 3,..., n.

3. Results

3.1. Modeling the Average Stand Height Growth and Harvest Prediction

The TSCC were parametrized differently in model (2) to obtain the results of fit accuracy for different forms of parametrized models, as shown in Table 3. The re-parameterized model (4) fitted best and outperformed the models before parameterization. Thus, the re-parameterized model (4) was chosen to describe the average stand height growth pattern of the mixed coniferous and broad-leaved forests, and the model parameters are shown in Table 4.
ai and ci are the original parameters of the model and have certain biological significances. ai and ci are larger than ai + 1 and ci + 1; that is, the average stand height and growth rate of stands in mixed coniferous forests with good site quality are higher. a1 is closer to a2, a3 is closer to a4, c1 has the highest value, and c3 is closer to c4, indicating that the average stand height maxima of site quality grades S1 and S2 are closer, but the average stand height growth rate of site quality grade S1 is the highest. The average stand height of S3 and S4 are close to each other, and so is the growth rate. kaij is the TSCC parameter, and different site quality grades have different kaij values. However, kaij is greater than kai(j+1) at the same site quality grade, showing a pattern of Cunninghamia lanceolata > Pinus massoniana > hard broad-leaved tree species (group). The average stand height shows a general pattern of stand height growth under different site quality grades (Figure 3), with an initial average stand height of 2 m and a tree species composition of 2 fir, 2 horsetail pine, and 6 hard broad-leaved tree species (group).
The applicability test was conducted on 30% of the sample data that do not participate in the modeling, a residual plot was drawn, as shown in Figure 4, and residuals were compared against predicted values of the average stand height growth, as shown in Figure A1. After calculation, the TRE was 4.26, MSE was 5.18, MPE was 2.24, and MARE was 4.97, and each index value was within ±10%. It can be seen from the residual plot that the residual points are randomly distributed and there is no tendency in the direction of the abscissa, and the distribution of each residual point is not heterogeneous. That is to say, the average stand height growth and harvest prediction model not only fits the average stand height of mixed coniferous and broad-leaved uneven-aged forests well, but also eliminates the homoscedasticity and heteroscedasticity of the model. Therefore, the average stand height growth and harvest prediction models established in this study can be used for the average stand height prediction of mixed coniferous and broad-leaved forests in forest production practice.

3.2. Establishment of Growth and Harvest Prediction Models for Average DBH and Stand Volume

After fitting and calculation, the fit accuracy results of six growth and harvest prediction models for average DBH and stand volume were obtained, as shown in Table 5. The fit accuracy of the growth and harvest prediction model for the average DBH was higher than that for the stand volume, mainly because the DBH was measured by each wood check, while the stand volume was derived from the binary wood volume model. The fitted RMSE and R2 values of the six growth and harvest prediction models for the average DBH and stand volume did not show a significant difference. The R2 value for the average DBH was greater than 0.839, and the RMSE value was less than 1.615, whereas the R2 value for the stand volume was greater than 0.658, and the RMSE value was less than 57.000. This result indicated that the growth and harvest prediction models for the average DBH and stand volume performed better. The best prediction model of the average DBH for mixed coniferous and broad-leaved forests with the tree species composition and interval period as independent variables is model (11), and the model prediction parameters a, b1, b2, b3, c1, c2, and c3 are 26.071, 0.405, 0.451, 0.758, 0.017, 0.012, and 0.011, respectively. Model (8) is the best prediction model of the stand volume for mixed coniferous and broad-leaved trees with different ages, which is related to the tree species composition, whose interval period is an independent variable. However, its parameter values were not satisfactory and appeared negative. Therefore, model (7) was chosen in this study, and the model parameters a1, a2, a3, b, and c are 401.099, 350.913, 304.586, 0.815, and 0.009, respectively.
According to the optimized model and parameter values, as shown in Table 6, the average DBH and stand volume both showed significant Richards model growth patterns, in which the average DBH parameters bi and ci varied as Cunninghamia lanceolata < Pinus massoniana < hard broad-leaved tree species (group), Cunninghamia lanceolata > Pinus massoniana > hard broad-leaved tree species (group), respectively. The results indicated that the growth rate in the mixed coniferous forests was Cunninghamia lanceolata > Pinus massoniana > hard broad-leaved tree species (group), the maximum stand DBH can be replaced by the mean value, and there is no need to introduce TSCC for description. The effect of tree species composition on stand volume was mainly on the maximum stand growth, and the effect was in the order of Cunninghamia lanceolata > Pinus massoniana > hard broad-leaved tree species (group).
The applicability test was conducted on 30% of the sample data that did not participate in the modeling, a residual plot was drawn, as shown in Figure 5 and Figure 6, and residuals were compared against predicted values of the average stand height growth and stand volume, as shown in Figure A2 and Figure A3. After calculation, the applicability evaluation value of the average DBH growth and harvest prediction model was 3.14 of TRE, 4.01 of MSE, 0.99 of MPE, and 3.82 of MARE. Each value was within the range of ±5%. The applicability value of the stand volume growth and harvest prediction model was −6.24 of TRE, 5.97 of MSE, 3.26 of MPE, and 7.19 for MARE, all within the range of ±10%. It can been seen from Figure 5 and Figure 6 that the residual points are randomly distributed and show no tendency in the direction of the abscissa, and the distribution of residual points exhibits no heterogeneity. That is to say, the average DBH and the stand volume growth and harvest prediction models not only fit the average DBH and the stand volume of mixed coniferous and broad-leaved forests at different ages well, but also eliminate the homoscedasticity and heteroscedasticity of the models. Therefore, the average DBH and stand volume growth and harvest prediction models developed in this study can be used for forecasting the average DBH and stand volume in mixed coniferous and broad-leaved forests in forestry production practice.

4. Discussion

Generally, the average age of a stand is usually considered as the forest age, no matter whether it is a same-aged forest or a different-aged forest. There are three main ways to determine the average age: ① Use a growth cone to drill the core at a standard wood 0.3 m from the ground. ② Cut the forest points of the standard wood; the disk at the root neck of the sawn tree is No. 0, and the number of annual rings is counted as the age of the tree. ③ Establish the mathematical relationship between stand age (dependent variable) and average DBH (or crown width, independent variable) [20]. However, the age structure of different-aged forests is complex and has a large distribution range. For example, Meng Xianyu [21] studied the age structure of natural Xing’an larch forests and found that the age structure of stands presents a single-peak mountain curve, which is more complex than that of plantations. Hua Weiping [22] built a dynamic prediction model of the volume of natural stands of Pinus taiwanensis by replacing the age of stands with intervals, with a correlation coefficient of 0.970. The fitting effect is higher than the goodness-of-fit value of the stand volume prediction model established in this study. The main reason is that there are differences between the modeling objects and the number of samples, but the fitting has passed the applicability test. Therefore, this study uses two biologically significant theoretical growth equations, i.e., Korf and Richards, as the base models to derive a stand growth and harvest prediction model with the interval period as an independent variable. This model can predict the future yield only through the initial yield and interval, solving the problem that the age is not easy to determine in the growth and harvest process of heterogeneous forests.
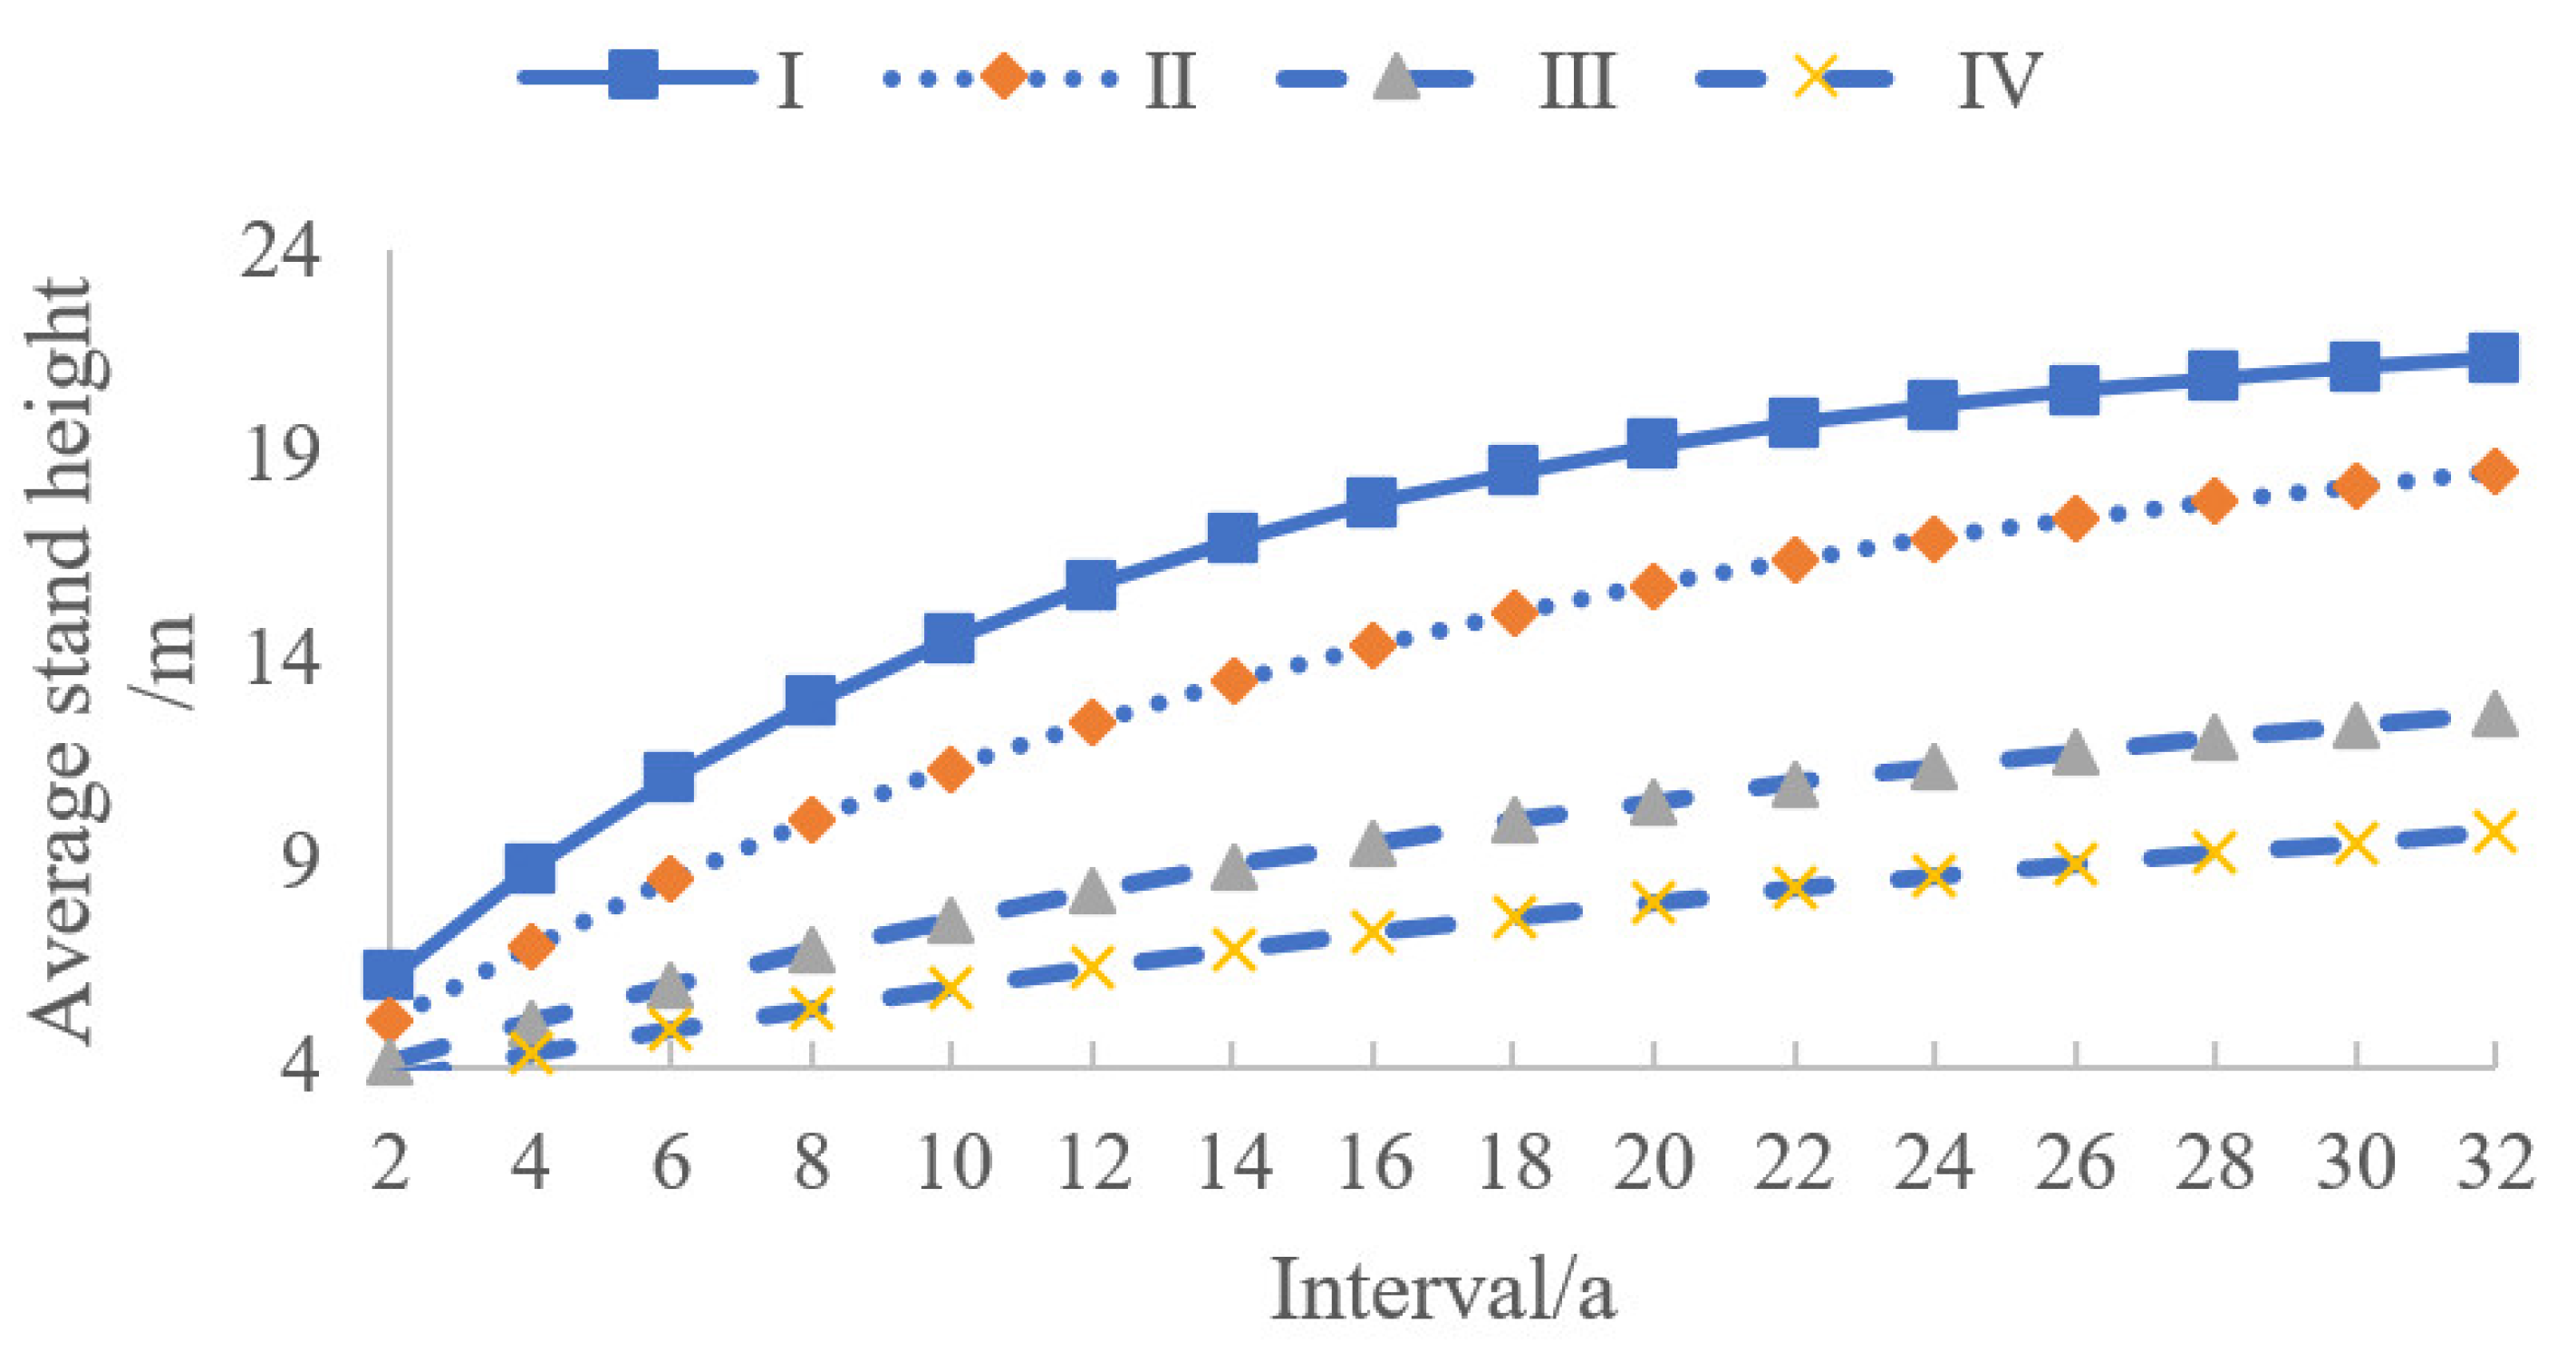
The site quality is the productive potential of a given forest or other vegetation type on a site. The site quality of a plantation is generally evaluated using the site grade index or site index. For an uneven-aged forest, the dominant height or average stand height growth model [23,24,25,26] with the site quality grade as a dummy variable has been constructed. The experimental results are similar to the fitting results of the average stand height growth and harvest prediction model established in this study, with high fitting accuracy and better expression of the dynamic growth pattern. It solves the problem that the site environment of different-aged forests is complex and difficult to evaluate.
Different-aged forests generally exist in realistic stands in the form of mixed forests, forming stands with higher ecological resilience. In forest resource management databases, the tree species composition structure is often expressed by species composition coefficients, and the species types are mainly divided into Cunninghamia lanceolata, Pinus massoniana, and hard broad-leaved tree species (group). Previous studies have shown that the intensities of intraspecific competition and interspecific competition among trees in different mixed proportions are different, which may lead to differences in the growth rates of tree species, such as the average DBH, average stand height, and stand volume in different periods [27,28,29,30]. This study found that the TSCC (or mixing ratio) of mixed coniferous and broad-leaved forests differed in the average stand height, average DBH, and stand volume of the stand growth, and the tree species composition mainly affected the maximum growth and growth rate of the average stand height, the growth rate of the average DBH, and the maximum growth of the stand volume. The effect is in the order of Cunninghamia lanceolata > Pinus massoniana > hard broad-leaved tree species (group). That is, increasing the mixing ratio of Cunninghamia lanceolata can obtain higher stand productivity, which is consistent with the results of most studies that showed the increase in the mixing ratio of conifers or fir can improve the stand productivity [31,32]. Therefore, in forestry production, increasing the mixing ratio of hard broad-leaved tree species (group) not only can increase stand productivity but also improve the ecological resilience of forests.
As an important ecological asset, the asset evaluation business of mixed coniferous and broad-leaved uneven-aged forests is increasing with the continuous improvement in their property rights systems and the development of forest tree circulation and trading systems. However, in the process of using the selective cutting income method to evaluate the mixed coniferous and broad-leaved uneven-aged forests, asset evaluation practitioners always ignore the changes in the growth of the forest and adopt a fixed selective cutting intensity and cycle rather than the corresponding selective cutting intensity and cycle. This unscientific approach will affect the correctness and fairness of the evaluation conclusions of the mixed coniferous and broad-leaved uneven-aged forests. This study is based on a dynamic growth model with the interval period as an independent variable. By analyzing the cutting cycle and selection intensity, the selection income method can be improved to determine the asset evaluation value of the mixed coniferous and broad-leaved uneven-aged forests, providing technical support for scientifically determining the cutting cycle.
In this study, the site quality grade was introduced as a dummy variable into the average stand height growth and harvest prediction model, which improved the fit accuracy of the model. This indicates that the dummy variable can effectively integrate the mixed coniferous and broad-leaved uneven-aged forests and enhance the compatibility of the model. After re-parameterization by introducing the TSCC into the interval-based growth and harvest prediction model, the issues in terms of stand age, site quality, tree species composition, etc., in the mixed coniferous and broad-leaved uneven-aged forests were solved. In addition, there are also limitations of the established models; for instance, the TSCC should be in the range of 1~10. Due to the limitation of the sample plot, attention should be paid to the applicable area of the model. At present, the model is only applicable to Fujian, China, where the dominant tree species are hard broad-leaved tree species (group). In future research, the applicability of the model can be increased by increasing the number of samples from different regions.

5. Conclusions

In this study, an average stand height growth and harvest prediction model of mixed coniferous and broad-leaved stands was established, with site quality grade as a dummy variable and interval period and tree species composition coefficient (TSCC) as independent variables. With interval period and TSCC as independent variables, the growth and harvest prediction model for the average DBH of mixed coniferous and broad-leaved forests had a fit accuracy of the root mean square error (RMSE) of 1.600 and the coefficient of determination (R2) of 0.841. The applicability evaluation indicators, i.e., total relative error (TRE), mean systematic error (MSE), mean prediction error (MPE), and mean absolute percentage systematic error (MARE), were within the range of [−4.01%, 3.82%], indicating that the model is suitable. With interval period and TSCC as independent variables, the fit accuracy of the growth and harvest prediction model for the stand volume of mixed coniferous and broad-leaved forests were 49.290 of RMSE and 0.719 of R2. The applicability evaluation indicators, i.e., TRE, MSE, MPA, and MARE, were within the range of [−6.24%, 7.19%], indicating that the model is suitable.
Using these models, the interval period instead of stand age can be used to determine the age in the growth and harvest process. After re-parameterization by introducing TSCC, the fit accuracy became higher than before. Overall, the established growth and harvest prediction models related to the TSCC of mixed coniferous and broad-leaved heterogeneous forests can better describe the forest growth patterns and provide a basis for further research on the forest growth succession and growth simulation.

Author Contributions

Conceptualization, X.J., W.H. and C.Z.; methodology, X.J. and W.H.; software, X.P., D.Z. and C.W.; validation, X.J., S.C., C.Z. and J.L.; formal analysis, X.J., W.H. and C.Z.; investigation, X.J., W.H., X.P., D.Z., C.W. and S.C.; resources, W.H., D.Z., C.Z. and J.W.; data curation, X.J.; writing—original draft preparation, W.H.; writing—review and editing, X.J., W.H. and C.Z.; visualization, X.J., X.P. and C.W.; supervision, X.J., W.H. and C.Z.; project administration, W.H. and C.Z.; funding acquisition, W.H. and C.Z. contributed equally to this work and should be considered the co-first author. All authors have read and agreed to the published version of the manuscript.

Funding

This research was funded by the Fujian Natural Science Foundation (2021J011141), the Fujian Forestry Science and Technology Project (2022FKJ08,2023FKJ21), and the Open Project of Fujian Provincial Key Laboratory of Ecological Industry Green Technology (WYKF-EIGT2021-4).

Data Availability Statement

Not applicable.

Acknowledgments

The authors express their gratitude and appreciation to the Fujian Provincial Forestry Survey and Planning Institute for the finance, facilities, and opportunity to conduct this research. The authors also thank Junzhong Pan and Tian Qiu for their technical support during the data survey and analysis.

Conflicts of Interest

The authors declare no conflict of interest.

Appendix A

Table A1. Statistics of specific stand volume data of sample land.
Dominant SpeciesTree Species Composition Coefficient (TSCC)Number of SamplesAverage Stand Volume
(m³/ha)
Hard broad-leaved tree species (group)433265
544274
638766
744287
8354102
9608105
10996129
Cunninghamia lanceolata015710
178615
268122
317537
434951
Pinus massoniana013150
166515
256222
329637
428151
544359
Figure A1. Residuals against predicted values of the average stand height growth.
Forests 14 01416 g0a1
Figure A2. Residuals against predicted values of the average DBH.
Forests 14 01416 g0a2
Figure A3. Residuals against predicted values of the stand volume.
Forests 14 01416 g0a3

References

  1. Hong, L.X.; Lei, X.D.; Li, Y.C. Integrated stand growth model of Mongolian oak and it’s application. For. Res. 2012, 25, 201–206. [Google Scholar]
  2. Zhang, J.; Lu, Y.; Yuan, L. Tree growth model simulation system based on the overall theory. Cent. S. For. Univ. 2010, 30, 70–72. [Google Scholar]
  3. Luo, B.Y. Individual Tree Growth Model of Main Tree Species in Coniferous and Broad-Leaved Mixed Forest in Jiaohe, Jilin; Beijing Forestry University: Beijing, China, 2020. [Google Scholar]
  4. Zhang, H.R.; Lei, X.D.; Li, F.R. Research progress and prospects of forest management science in China. Sci. Silvae Sin. 2020, 56, 130–142. [Google Scholar]
  5. Sun, H.G.; Zhang, J.G.; Duan, A.G.; He, C.Y. A review of stand basal area growth models. For. Stud. China 2007, 9, 85–94. [Google Scholar] [CrossRef]
  6. Zhu, G.Y.; Hu, S.; Fu, L.Y. Basal area growth model for oak natural forest in Hunan Province based on dummy variable. J. Nanjing For. Univ. (Nat. Sci. Ed.) 2018, 42, 155–162. [Google Scholar]
  7. Du, J.S. Research trends in trees growth and yield prediction models. World For. Res. 1999, 12, 19–22. [Google Scholar]
  8. Jactel, H.; Bauhus, J.; Boberg, J.; Bonal, D.; Castagneyrol, B.; Gardiner, B.; Brockerhoff, E.G. Tree diversity drives forest stand resistance to natural disturbances. Curr. For. Rep. 2017, 3, 223–243. [Google Scholar] [CrossRef]
  9. Lei, C. Estimating Stand Age of Quercus mongolica Natural Forests in Jilin Based on Diameter Data of Periodical Measurements; Chinese Academy of Forestry Sciences: Beijing, China, 2020. [Google Scholar]
  10. Li, T.T.; Wu, S.R.; Wang, L.L.; Lv, F.L.; Lan, Z.P. Research progress of mixed forests at home and abroad. World For. Res. 2022, 35, 42–48. [Google Scholar]
  11. Pardos, M.; Del Río, M.; Pretzsch, H.; Jactel, H.; Bielak, K.; Bravo, F.; Calama, R. The greater resilience of mixed forests to drought mainly depends on their composition: Analysis along a climate gradient across Europe. For. Ecol. Manag. 2021, 481, 118687. [Google Scholar] [CrossRef]
  12. Fan, G. Study on Growth and Ecological Function of Pinus Massoniana-Quercus Large-Leaf Mixed Forest with Different Ages; Guangxi University: Nanning, China, 2020. [Google Scholar]
  13. Li, W.H. Ingrowth Model of Larix Gmelinii-Betula Platyphylla Mixed Forest in Eastern Daxing’an Mountains; Northeast Forestry University: Harbin, China, 2021. [Google Scholar]
  14. Peng, L.Q.; Chen, Z.F.; Chen, D.L. A Study on the Growth Model of Individual Trees in Natural Mixed Forests of Oak and Pinus Massoniana in Hunan. For. Resour. Wanagement 2020, 2, 94–102+134. [Google Scholar]
  15. Zhou, M.L. Development Stage Dominant Height and Competitive Relationship of Natural Spruce-fir-broadleaf Mixed Forest; Chinese Academy of Forestry Sciences: Beijing, China, 2020. [Google Scholar]
  16. Wang, D.Z.; Zhang, D.Y.; Zhang, Z.; Huang, X.R. Height-diameter relationship for conifer mixed forest based on non-linear mixed-effects model. Sci. Silvae Sin. 2016, 52, 30–36. [Google Scholar]
  17. Lei, X.D.; Fu, L.Y.; Li, H.K.; Li, Y.; Tang, S. Methodology and applications of site quality assessment based on potential mean annual increment. Sci. Silvae Sin. 2018, 54, 116–126. [Google Scholar]
  18. Hua, W.P.; Chi, S.P.; Li, X.W.; Jiang, X.D.; Gai, X.M.; Huang, L.Z. Harvest model of natural Pinus taiwanensis forest and its application in the income approach of selective cutting. J. For. Environ. 2014, 34, 220–224. [Google Scholar]
  19. Shi, Y.; Eberhart, R. A modified particle swarm optimizer. In Proceedings of the 1998 IEEE International Conference on Evolutionary Computation Proceedings. IEEE World Congress on Computational Intelligence (Cat. No. 98TH8360), Anchorage, AK, USA, 4–9 May 1998; IEEE: Piscataway, NJ, USA, 1998; pp. 69–73. [Google Scholar]
  20. Long, S.S.; Zeng, S.Q.; Gan, S.S.; Xiao, H.S.; Liu, X.; Xiang, B.W. Age estimation method Ⅱ of uneven-aged forest based on the data of multistage diameter measurement. J. Cent. South Univ. For. Technol. 2019, 39, 23–29+59. [Google Scholar]
  21. Meng, X.Y. Analysis for structures of age in natural Larix gmelinii stands. J. Beijing For. Univ. 1989, 3, 17–23. [Google Scholar]
  22. Hua, W.P.; Ye, H.M.; Rau, J.Y.; Qiu, T. Dynamic prediction of uneven-aged natural forest for yield of Pinus taiwanensis using joint modelling. Environ. Monit. Assess. 2020, 192, 192–239. [Google Scholar] [CrossRef] [PubMed]
  23. Gao, D.Q.; Deng, H.F.; Wang, H.B.; Cheng, Z.C. Growth model of Quercus mongolica stand based on dummy variables. J. Northeast. For. Univ. 2014, 42, 61–64. [Google Scholar]
  24. Hua, W.P.; Qiu, T.; Jiang, X.D.; Huang, Y.Z.; Gai, X.M. Development of the site grade index model of Pinus taiwanensis with the site quality grade as a dummy variable. J. Wuyi Univ. 2015, 34, 15–18. [Google Scholar]
  25. Luo, T.L.; Fan, S.H.; Liu, G.L.; Shen, J.X.; Wu, C.M. Study on site quality evaluation and classification of phyllostachys pubescens in central Fujian. J. Cent. South Univ. For. Technol. 2020, 40, 48–57. [Google Scholar]
  26. Zhu, G.Y.; Luo, X.L. Study on the dummy variable model of dominant tree height curve of natural oak mixed forest in Hunan. For. Resour. Manag. 2017, 42, 22–29. [Google Scholar]
  27. Jolliffe, P.A. Are mixed populations of plant species more productive than pure stands? Oikos 1997, 80, 595–602. [Google Scholar] [CrossRef]
  28. Morin, X.; Fahse, L.; Scherer-Lorenzen, M.; Bugmann, H. Tree species richness promotes productivity in temperate forests through strong complementarity between species. Ecol. Lett. 2011, 14, 1211–1219. [Google Scholar] [CrossRef] [PubMed]
  29. Toïgo, M.; Vallet, P.; Perot, T.; Bontemps, J.D.; Piedallu, C.; Courbaud, B. Overyielding in mixed forests decreases with site productivity. J. Ecol. 2015, 103, 502–512. [Google Scholar] [CrossRef]
  30. Wang, H.R.; Guan, M.S.; Zhang, S.S.; Li, A.Q.; Zhao, X.Y.; Xu, X.N. Effects of mixing on forest growth: A meta-analysis. J. Northwest A F Univ. (Nat. Sci. Ed.) 2020, 48, 56–63+72. [Google Scholar]
  31. Chen, Q.W. Analysis of afforestation effect of 25-year-old tree lotus and Cunninghamia lanceolata mixed forest. Prot. For. Sci. Technol. 2022, 3, 27–29. [Google Scholar]
  32. Wu, H.; Zhu, L.; Li, H.; Luo, C.; Wu, X. Stand basal area growth models for 4 main coniferous species in Kunming. J. Southwest For. Univ. 2018, 38, 119–125. [Google Scholar]
Figure 1. Technical route.
Forests 14 01416 g001
Figure 2. Study area and distribution of samples.
Forests 14 01416 g002
Figure 3. Average stand height growth family at different site quality grades.
Forests 14 01416 g003
Figure 4. Residual distribution of forest stands using the average stand height growth and harvest prediction model.
Forests 14 01416 g004
Figure 5. Residual distribution of forest stands using the average DBH growth and harvest prediction model.
Forests 14 01416 g005
Figure 6. Residual distribution of forest stands using the stand volume growth and harvest prediction model.
Forests 14 01416 g006
Table 1. Investigation factor statistics of mixed coniferous and broad-leaved forests.
Site Quality GradeTree Species CompositionAdvantageous Tree SpeciesOriginsClass IClass IINumber of SamplesAverage AgeAverage DBHAverage Stand HeightAverage Stand Volume
Survey YearSurvey Year(Year)(cm)(m)(m³/ha)
ICunninghamia lanceolataPinus massonianaHard broad-leaved tree species (group)Hard broad-leaved tree species (groups)Natural1998 6462614.711.9150.0
20032007
2008
20132017
2018
IICunninghamia lanceolataPinus massonianaHard broad-leaved tree species (group)Hard broad-leaved tree species (groups)Natural1998 11432413.610.3134.0
20032007
2008
20132017
2018
IIICunninghamia lanceolataPinus massonianaHard broad-leaved tree species (group)Hard broad-leaved tree species (groups)Natural1998 12542712.89.6116.0
20032007
2008
20132017
2018
IVCunninghamia lanceolataPinus massonianaHard broad-leaved tree species (group)Hard broad-leaved tree species (groups)Natural1998 5202312.58.783.0
20032007
2008
20132017
2018
Note: The hard broad-leaved tree species (groups) are mainly Schima superba, Castanopsis fargesii, Alniphyllum fortune, Quercus glauca, Cas-tanopsis sclerophylla, Liquidambar formosana, Castanopsissclerophylla (Lindl.) Schott., Quercus L., Cinnamomum camphora, Phoebe bourne, Lithocarpus glaber, Castanopsis fissa, Cinnamomum camphora, Elaeocarpus sylvestris, Castanopsis eyrie, Phoebe bourne, Liquidambar for-mosana, Castanopsis fissa, Loropetalum chinense, Castanopsis kawakamii, and other natural hard broad-leaved tree species.
Table 2. Statistics of sampled stand data for determining stand age.
Site Quality GradeNumber of SamplesAge (Year)DBH (cm)Tree Height (m)
AverageMaxMinSTDAverageMaxMinSTDAverageMaxMinSTD
137245193.315.245.913.62.512.325.711.23.8
145254873.214.940.112.12.611.424.810.73.2
109264663.413.135.710.82.99.622.58.62.9
103225182.712.936.811.22.28.923.29.42.7
Table 3. Goodness-of-fit value of the average stand height prediction model.
Number of ModelsRoot Mean Square Error (RMSE)/mCoefficient of Determination (R2)
(5)1.2520.729
(6)2.0490.452
(7)11.8940.251
Table 4. Parameter values of model (4) calculated using particle swarm optimization algorithm.
ParametersFitted ValueParametersFitted Value
a16.1150ka133.4420
a25.5006ka215.2570
a33.9131ka224.8320
a43.3187ka233.0180
c10.0889ka315.3810
c20.0615ka324.2990
c30.0454ka334.5980
c40.0344ka415.0210
ka115.0390ka424.2940
ka124.0200ka433.4580
Root mean square error (RMSE)/m2.049
Coefficient of determination (R2)0.452
Table 5. Goodness-of-fit values of the average DBH and stand volume prediction models calculated using particle swarm optimization algorithm.
Number of Re-Parameterized ModelsAverage DBHStand Volume
Root Mean Square Error (RMSE)/cmCoefficient of Determination (R2)Root Mean Square Error (RMSE)/m3Coefficient of Determination (R2)
(8)1.6110.83949.290.719
(9)1.6070.84148.5920.728
(10)1.6120.83956.2180.658
(11)1.6010.84149.2740.717
(12)1.6000.84152.8130.674
(13)1.6020.84149.4560.714
Table 6. Optimized model parameters and accuracy evaluation value of the average DBH and stand volume prediction models.
Parametersab1b2b3c1c2c3Root Mean Square Error (RMSE)/cmCoefficient of Determination (R2)
Average DBH26.0710.4050.4510.7580.0170.0120.0111.6000.841
Parametersa1a2a3bc Root mean square error (RMSE)/mCoefficient of determination (R2)
Stand volume401.099350.913304.5860.8150.009 49.290.719
Disclaimer/Publisher’s Note: The statements, opinions and data contained in all publications are solely those of the individual author(s) and contributor(s) and not of MDPI and/or the editor(s). MDPI and/or the editor(s) disclaim responsibility for any injury to people or property resulting from any ideas, methods, instructions or products referred to in the content.

