Article

Features of Scots Pine Mortality Due to Incursion of Pine Bark Beetles in Symbiosis with Ophiostomatoid Fungi in the Forest-Steppe of Central Siberia

1
Institute of Ecology and Geography, Siberian Federal University, 660036 Krasnoyarsk, Russia
2
V.N. Sukachev Institute of Forest, Siberian Branch of the Russian Academy of Science, 660036 Krasnoyarsk, Russia
3
Forest Protection Centre of Krasnoyarsk Krai, Branch of the FFA FBI RCFH, 660036 Krasnoyarsk, Russia
4
Center for Forest Pyrology, Branch of the FBI “ARRISMF”, 660062 Krasnoyarsk, Russia
5
EiFAB, Universidad de Valladolid, 42004 Soria, Spain
*
Author to whom correspondence should be addressed.
Forests 2023, 14(7), 1301; https://doi.org/10.3390/f14071301
Submission received: 10 May 2023 / Revised: 15 June 2023 / Accepted: 21 June 2023 / Published: 24 June 2023
(This article belongs to the Special Issue Climate and Tree Growth Response: Advances in Plant Sciences)

Abstract

:
Forest decline is a significant issue affecting critical ecosystem processes worldwide. Here, we describe mortality in Pinus sylvestris L. monitored trees caused by the inhabitation of pine bark beetles (Tomicus minor Hart.) in symbiosis with ophiostomatoid fungi (Ophiostoma piceae (Munch) H. et P. Sydow) infection in the forest-steppe of central Siberia. Stem sap flow (Q) and stem diameter fluctuations (dRc) were monitored in eight pine trees during seven consecutive growing seasons (2015–2021). In addition, microcore sampling every ten days allowed the determination of stem wood formation in monitored trees in the 2021 growing season. During 2020 and 2021, two cases of Q termination were recorded among the monitored trees, with microcores revealing no cambium formation. Thus, the seasonal Q onset matches the beginning of the beetle dispersal period when they attack and inhabit tree stems. The decline of circumferential stem size began 10–12 days after Q onset, during the massive inhabitation of beetles into the stems. The disturbance of Q in trees occurred in 21–23 days, and total cessation of Q was observed 23–26 days after the Q onset at the beetle’s egg development phase. The timing of dRc disturbance and Q cessation observed directly coincides with the beetle life cycle. Thus, the phenology of pine trees and T. minor beetles is driven by seasonal weather conditions, particularly the cumulative air temperature (>0 °C).

1. Introduction

Forests decline due to biotic and abiotic disturbances is a significant problem on a global scale, with important consequences on carbon dynamics and other ecosystem services. The dieback of tree species in the Northern Hemisphere, linked to insect invasions and pathogenic diseases [1,2], has accelerated during the last decades [3]. Becoming widespread in forest loss [4], with the boreal forest as the focus of the alert [1,2]. Siberia represents ca. 60% of the world’s boreal forests (Kayes and Mallik, 2020), and in recent decades, has been severely affected by the Siberian silk moth (Dendrolimus sibiricus Chetverikov; Lepidoptera: Lasiocampodae) [5,6] and the four-eyed bark beetle (Polygraphus proximus Blandford) outbreaks [7,8], usually acting in symbiosis with associated fungi [9,10]. Moreover, the pine bark beetle (Tomicus minor Hartig; Coleoptera: Curculionidae: Scolytinae) has also been recently recognized as an invasive species in the Russian Northwest [11]. Moreover, insect activity (i.e., phenology, migration, and population dynamic) is environmentally driven [5], as well as climate extremes may also lead to drought-induced pine forest mortality [12,13]. Therefore, all forest decline causes should be comprehensively studied and descriptively reported for better actions in future forest protection.
The number of publications about forest pathogens is growing, but the mechanisms of pest-induced harmful influence on trees remain unclear. Fungi of the ophiostomataceae family, a group of wood blue-stain fungi [14], represent the first stage of fungal succession in plant tissues of conifers when bark beetles inhabit living trees. Their primary way of dispersion is by entomochory—the fungi spores easily stick to the exoskeletons of xylophagous insects [15]. Thus, the beetles penetrating under the bark of trees transfer the fungi spores to the phloem layer, from where the mycelium actively spreads into the conductive tissues (xylem and sapwood) and clogs them. As a result, the transport of water and nutrients along the trunk is disrupted, leading to tree stress and death [16].
Enlarging a worldwide network of research sites for long-term environmental and ecophysiological monitoring of terrestrial ecosystems increases the possibility of studying forest vulnerability to pest-related impacts on the level of individual tree responses. Although different methodologies have been applied in multiple forest health monitoring and assessment studies (e.g., [17,18,19]), here we focused on dendrometry, sap flow, and wood anatomy tools as indicators of vital physiological processes in trees. We aimed to analyze and compare water/growth-related processes in three conifer species of trees [20], for what a combination of in situ monitoring (i.e., dendrometers and sap flow measurements) was established; however, while monitoring the trees, we recorded the dieback of two studied Pinus sylvestris L. (Pinales: Pinacea: Pinoidae) trees caused by the inhabitation of pine bark beetles in the area during 2020 and 2021. Although similar cases in the USA showed how pine trees died due to pine beetles incursion in terms of physiological processes either from dendrometer records [21] or combined with sap flow measurements [22], to the best of our knowledge, this is the first time in which tree dieback is instrumentally monitored in Siberia, providing a great opportunity to study this phenomenon. Moreover, additional proxies such as wood anatomy may be used to detect early signs of pine mortality in the xylem and phloem at the upper parts of trees [23], and also, when applied in combination with dendrometer measurements, became a promising approach in tree growth studies [24,25,26,27].
Here, we combined evidence from in situ physiological monitoring (i.e., circumferential stem variations and sap flow measurements), dendrochronological measurements, seasonal growth monitoring, entomology, and mycology to increase our understanding of P. sylvestris dieback induced by pine bark beetles’ outbreak during 2020 and 2021. We theorize that (1) an environmental factor may lead to the weakening of trees allowing the infestation by the beetle-fungi symbiosis; (2) the cessation of sap flow and cambial activity in infested trees will be linked to the pine bark beetle life cycle, which in turn will be influenced by weather conditions.

2. Materials and Methods

2.1. Study Area

The study was carried out at the Pogorelsky bor experimental field station (56°22′ N, 92°57′ E, 247 m a.s.l.; Figure 1a) located in the forest-steppe zone of Central Siberia, 37 km northward from Krasnoyarsk (Russia). A research plot of about 450 m2 in size with 50-year-old Scots pine (P. sylvestris) adjoins with cultivated Larix provenance trial plot [28]. The climate of the region is cold continental subarctic (Dfc) [29] with cold winters, warm summers, and relatively low precipitation (Figure 1b). The site shows a mean annual temperature of 1.18 °C and total annual precipitation of 440 mm during the 2005–2017 period. The average height of pine trees within the research plot was 21 m, the mean tree diameter at breast height was 25 cm, and the stem basal area of the plot was 58 m2/ha.

2.2. Instrumental In Situ Measurements

Physiological monitoring was carried out in eight trees over the 2015–2021 period, with an increasing amount of instrumentally measured pines from three trees in 2015–2016 to eight trees in 2020–2021 (Figure 1c,d; see Table S1 for further details). Precise stem circumference length changes (dRc, mm) at 1.8 m were obtained from DR-26 band dendrometers (EMS, Brno, Czech Republic). Stem upward sap flow rate (Q, kg/h/cm) measurements at 1.3 m were performed following the trunk segment heat balance (THB) method [30] with SF-51 and SF-81 (Microset 8x, EMS, Brno, Czech Republic) sensors. In addition, local micrometeorological variables (i.e., precipitation, air temperature, relative air humidity, and photosynthetic radiation (EMS QTHi)) and soil variables (i.e., moisture, temperature, and water deficit) were recorded with 10 min temporal resolution. Further, all initial data were preprocessed in a few steps, including verification, correction of errors, and noise reduction by averaging to hourly mean values. Preprocessing raw sap flow data also included correction of Q values considering heat losses from the point of measurements to the environment, known as sap flow baseline [31], and averaging to hourly time series. In 2020, after the death of tree PP1, monitoring instruments were installed in tree PP10.

2.3. Dendrochronological Measurements and Seasonal Growth

One diametral wood core was taken at breast height using a 5 mm diameter increment borer per monitored tree in the summer of 2022 (1 August). Cores were polished using a belt sanding machine with successive sandpaper (up to 800 grit), and their surfaces were scanned at 3200 dpi with an Epson Perfection V800 scanner (Epson, Suwa, Japan). Tree-ring width (RW) was measured on the scanned cores using CooRecorder version 9.3 (Cybis Elektronik & Data AB, Saltsjöbaden, Sweden). A master chronology previously produced for the area (including 17 trees sampled at 700 m from the research plot [32,33]) was used to accurately cross-date the trees, verified using COFECHA [34]. Individual raw series were standardized using ARSTAN [35]. Pearson’s correlations between monthly climatic data (temperature, precipitation, and water balance) and RW residual chronologies were used to evaluate the pine growth response to climate for the 1979–2021 period (this period covers the age of sampled monitored trees). Correlations were performed with a temporal resolution ranging from the previous year, July, to the growth year, September. The water balance (WB) was estimated as WB = P − PET, where P is the precipitation, and PET is the potential evapotranspiration calculated by the Thornthwaite equation [36].
Microcores for seasonal wood formation monitoring were collected every ten days, from 14 May 2021 to 30 September 2021, with a “Trephor” [37] and placed into Eppendorf tubes (four mL) containing an ethanol–glycerol solution and stored at five degrees (°C) for further processing. Due to the small size of the microcores, thick barks were removed from the trees before the sampling to extract only living tissues following the methodology proposed by Rossi et al. [37]. Next, microcores were dehydrated with ethanol in different consecutive concentrations (70%, 90%, and 96%) and cleared with Sub-X previous infiltration (Leica TP1020 tissue processor, Wetzlar, Germany) and embedding (Leica HistoCore Arcadia, Wetzlar, Germany) in paraffin. Finally, 10 µm thick cross-sections were prepared with a rotary microtome (Leica RM2235, Wetzlar, Germany), stained with a safranin-alcian blue solution, fixed with Eukitt, and digitized with a NanoZoomer slide scanner (Hamamatsu, Shizuoka, Japan).

2.4. Beetles and Fungi Monitoring

Boring dust, the first sign of beetles’ attacks on the trees, was seen one week after the vegetation season began in two of the monitored years (2020 and 2021). In situ inspections of the dead pines, performed in October 2020, June and October 2021, and May 2022, allowed the recognition of the past activity of the pine bark beetle T. minor. Considering the presence of multiple entrance and exit holes in the bark, abundant longitudinal egg galleries with perpendicular (to the stem) larval tunnels, and the occasional dead beetle bodies in the phloem layer. Therefore, different approaches were followed to determine the severity of T. minor beetle activity: (1) A quantitative estimation of the T. minor seasonal population after the emergence of beetles from stems was carried out in October 2021 on two of three colonized trees, including PP6 (Figure 1c, the tree died in 2021). Firstly, the total number of beetle entrance and exit holes was accounted for in the bark, on the lower part of the stems, at 1.5 m height in segments with an area determined by a height of 25 cm multiplied by the circumference length of the trunks. Secondly, the bark was removed, and the numbers of mother galleries and larvae tunnels of beetles were counted and converted to pcs/dm2. (2) A collateral estimation of T. minor population density considering their intensity of maturation (secondary) feeding in pine shoots was carried out in May 2022 by counting damaged shoots that fell on the ground after the 2021 season. The falling shoots pruned by T. minor were calculated in five random plots with a size of 1 m2 within the research plot. (3) Determination of intraseasonal phenological phases of beetles development and activity in the research plot was based on the calculation of accumulated positive air temperature (Taccu), calculating daily average (Tavg) from 10 min air temperature records for every single day and progressively summed positive Tavg values, skipping Tavg < 0 °C, starting from 1 January for the years 2020 and 2021), matching the Taccu values with previously reported ranges accordingly to A.I. Yakovenko [38]. The calculated timing of T. minor intra-annual life cycle periods consisted of the following phases: flight, egg layout, egg development, feeding of larvae, pupae development, young beetles under the bark, secondary feeding, and hibernation, with the division of each phase period to the intensity stages—onset, massive, and ending.
Samples of fine and thick roots, bark, and pieces of underlying stem wood (approximately 4 × 5 × 6 cm) were taken to determine the species of fungi infecting and its dispersion rate in the pine wood. In October 2020, from PP1 and two control trees (all the trees died in 2020), and in June 2021, from PP6 and another no monitored dead tree, PPx, (both trees died in 2021). Cultivation and determination of fungi species from the bark and stem sapwood samples containing the galleries of T. minor were carried out in the laboratory. First, the initial presence of fungal sporulation in the samples was checked under magnification (Micros MC100 with digital camera Levenhuk C1400NG, Gewerbezone, Austria). Then, isolation of pure spores of fungi culture was performed with a sterile bacteriological needle from beetle galleries into Petri dishes with filter paper impregnated with custom medium made of unhopped beer wort agar diluted to a sugar concentration of three degrees according to Balling with the addition of lactic acid (4 mL/L of medium) to inhibit the growth of bacteria. Pure cultures were incubated in a dark chamber at 22 °C for 42 days with subculturing. Cultivated fungi were identified based on visual recognition of their morphological structures in sporulation.
Finally, to evaluate the dispersion of fungi in the stems, two dead trees, the nonmonitored PPx (with visible boring dust and canopy yellowing signs) and the monitored PP6, were felled in June and October 2021, respectively. Stem discs were extracted at different heights from each felled tree. In total, five discs from PPx (i.e., 0, 1.3, 5.3, 9.3, 17.3 m; Figure S1) and twelve discs from PP6 (i.e., 0, 1.3, 3.3, 5.3, 7.3, 9.3, 11.3, 13.3, 15.3, 17.3, 19.3, 21.3 m; Figure S2). Discs from both trees were digitized in high image resolution. Measurements of stem wood area affected by fungi in each stem disc were performed on the corresponding pictures in the image editor GIMP 2.10 as the ratio of a blue stain area to a total area of a given disc with semiautomatic contouring (contrast-based threshold masking) of particular areas.

3. Results

3.1. Stem Sap Flow and Radial Size Changes

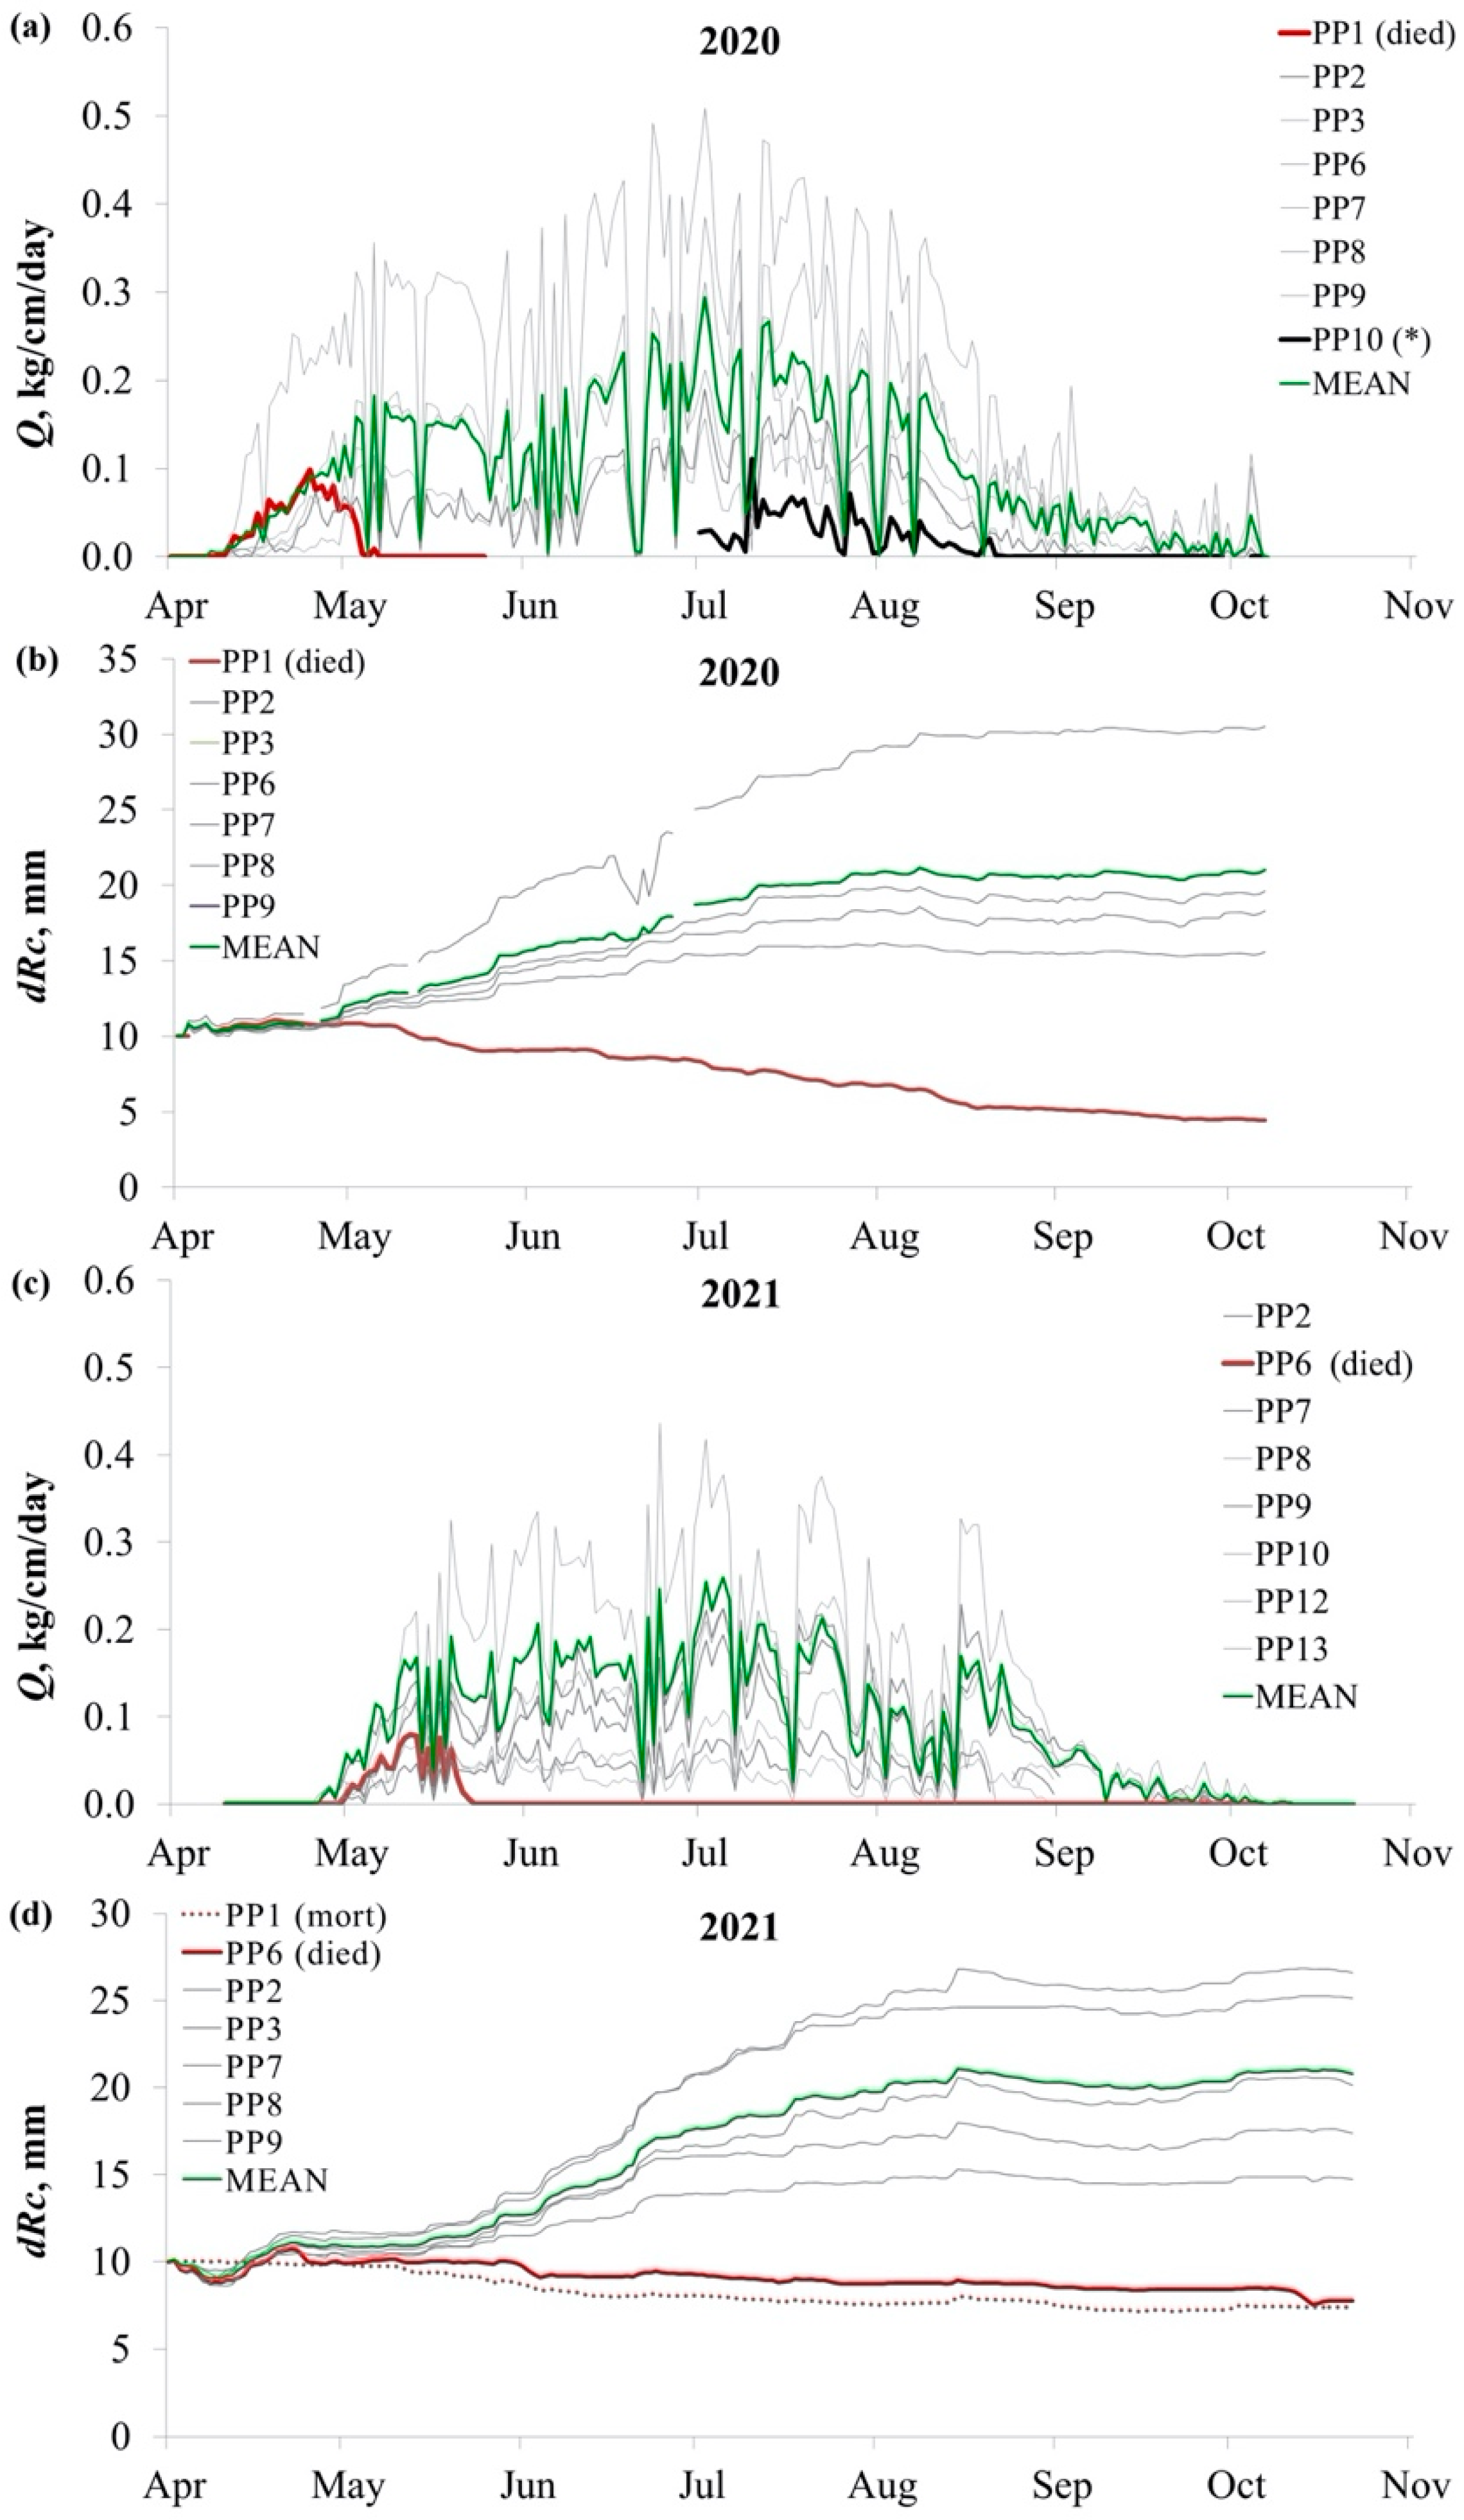
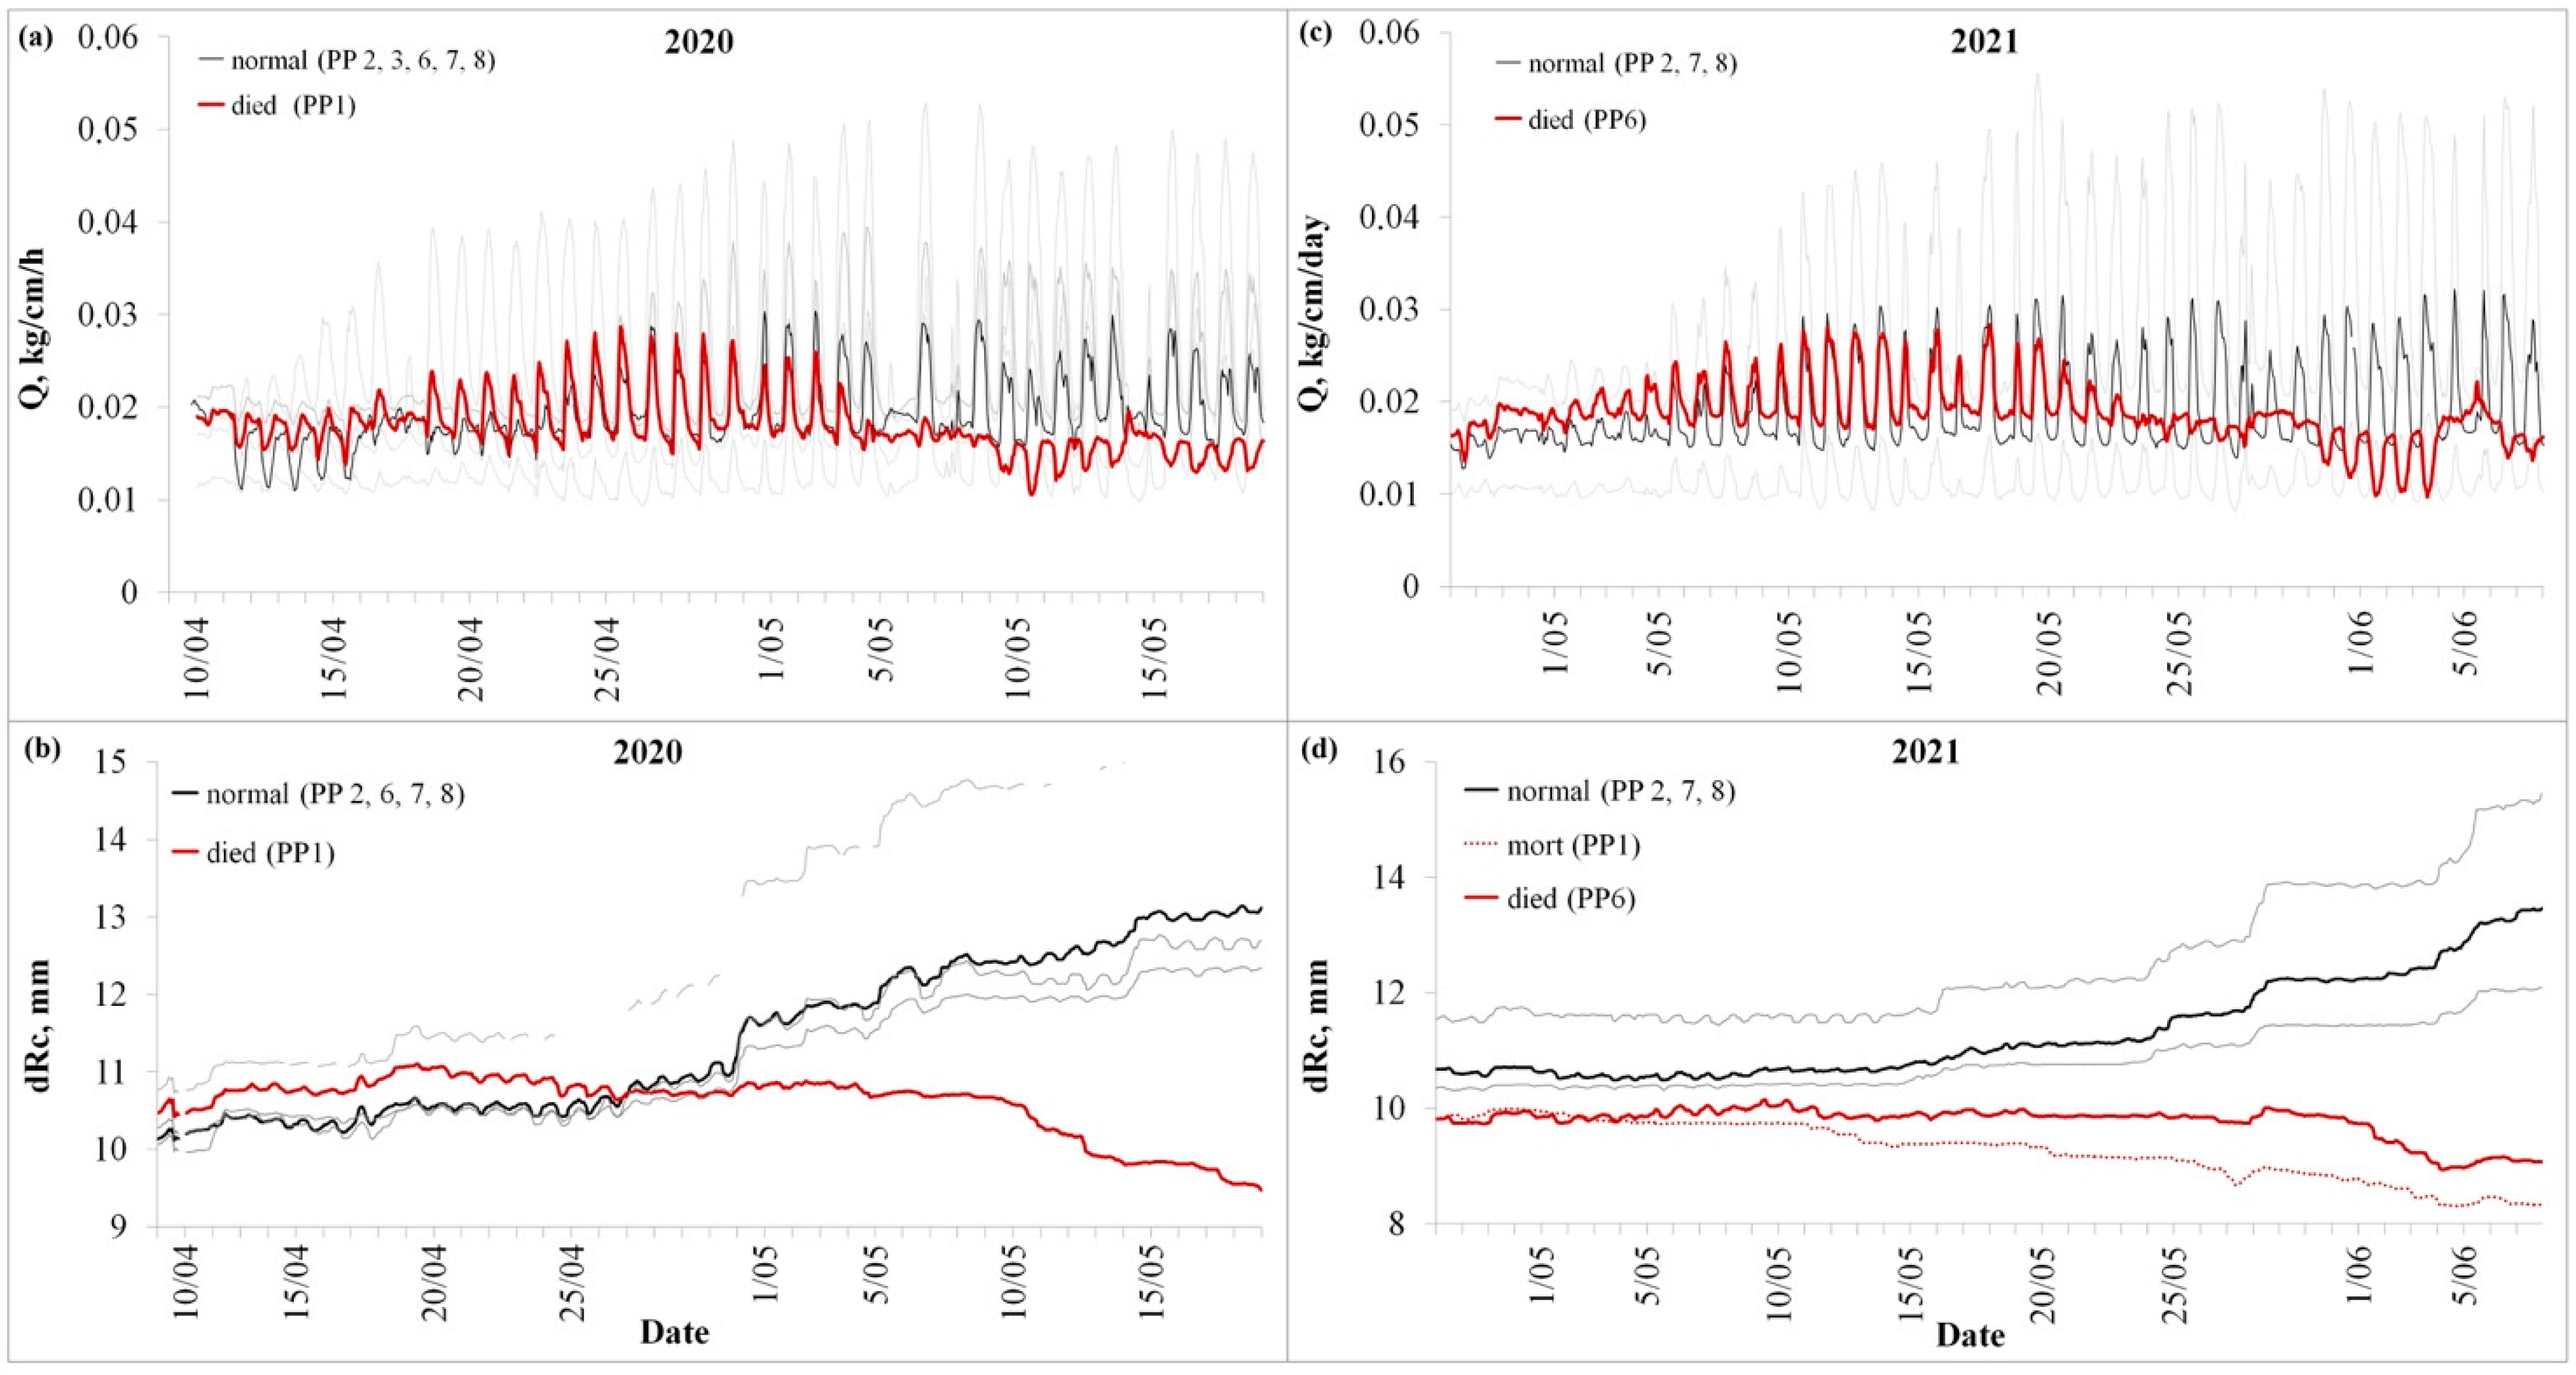
During the in situ monitoring carried out in 2020 and 2021, the dieback of two trees (one each year) was documented by the abrupt cessation of upward stem sap flow (Q) occurring in the late spring (Figure 2). First, a temporal shift of 18 days in the vegetation season beginning was observed from 2020 to 2021. Seasonal sap flow in pine stems started on 12 April 2020 (day of the year (DOY) 103) and on 30 April 2021 (DOY 121), and the beginning of tree water transport in 2020 occurred earlier in comparison to the Q onset dates range observed in previous years (2015–2019). Thus, sap flow unalterably stopped on 8 May 2020, in tree PP1 and on 23 May 2021, in tree PP6, matching the timing of 26 and 23 days after the beginning of pine transpiration activity periods in each year (Figure 2a,c and Figure 3a,c), respectively. After these dates, the diurnal data pattern of Q reversed to the opposite (Figure 3a,c), corresponding to the data signature of Q measurements in dead wood obtained experimentally long before in cameral tests of the equipment. Finally, the sap flow cessation led to the canopy browning in the midsummer, complete defoliation, and total dieback of those trees by the end of the vegetation seasons. Interestingly, sap flow stopped in the tree PP10 on 21 August 2020, at three-quarters of the vegetation season (Figure 2a), a year with an average of 177 days of sap flow, the longest compared to the previously observed range (144–173 days) during the 2015–2019 period, where the rest of trees showed the stop of sap flow on 6 October. Nevertheless, the tree remained alive in 2021 without any visible signs of weakening, and Q measurements on the side part of the tree stem in the season of 2021 showed normal sap flow data patterns (Figure 2c).
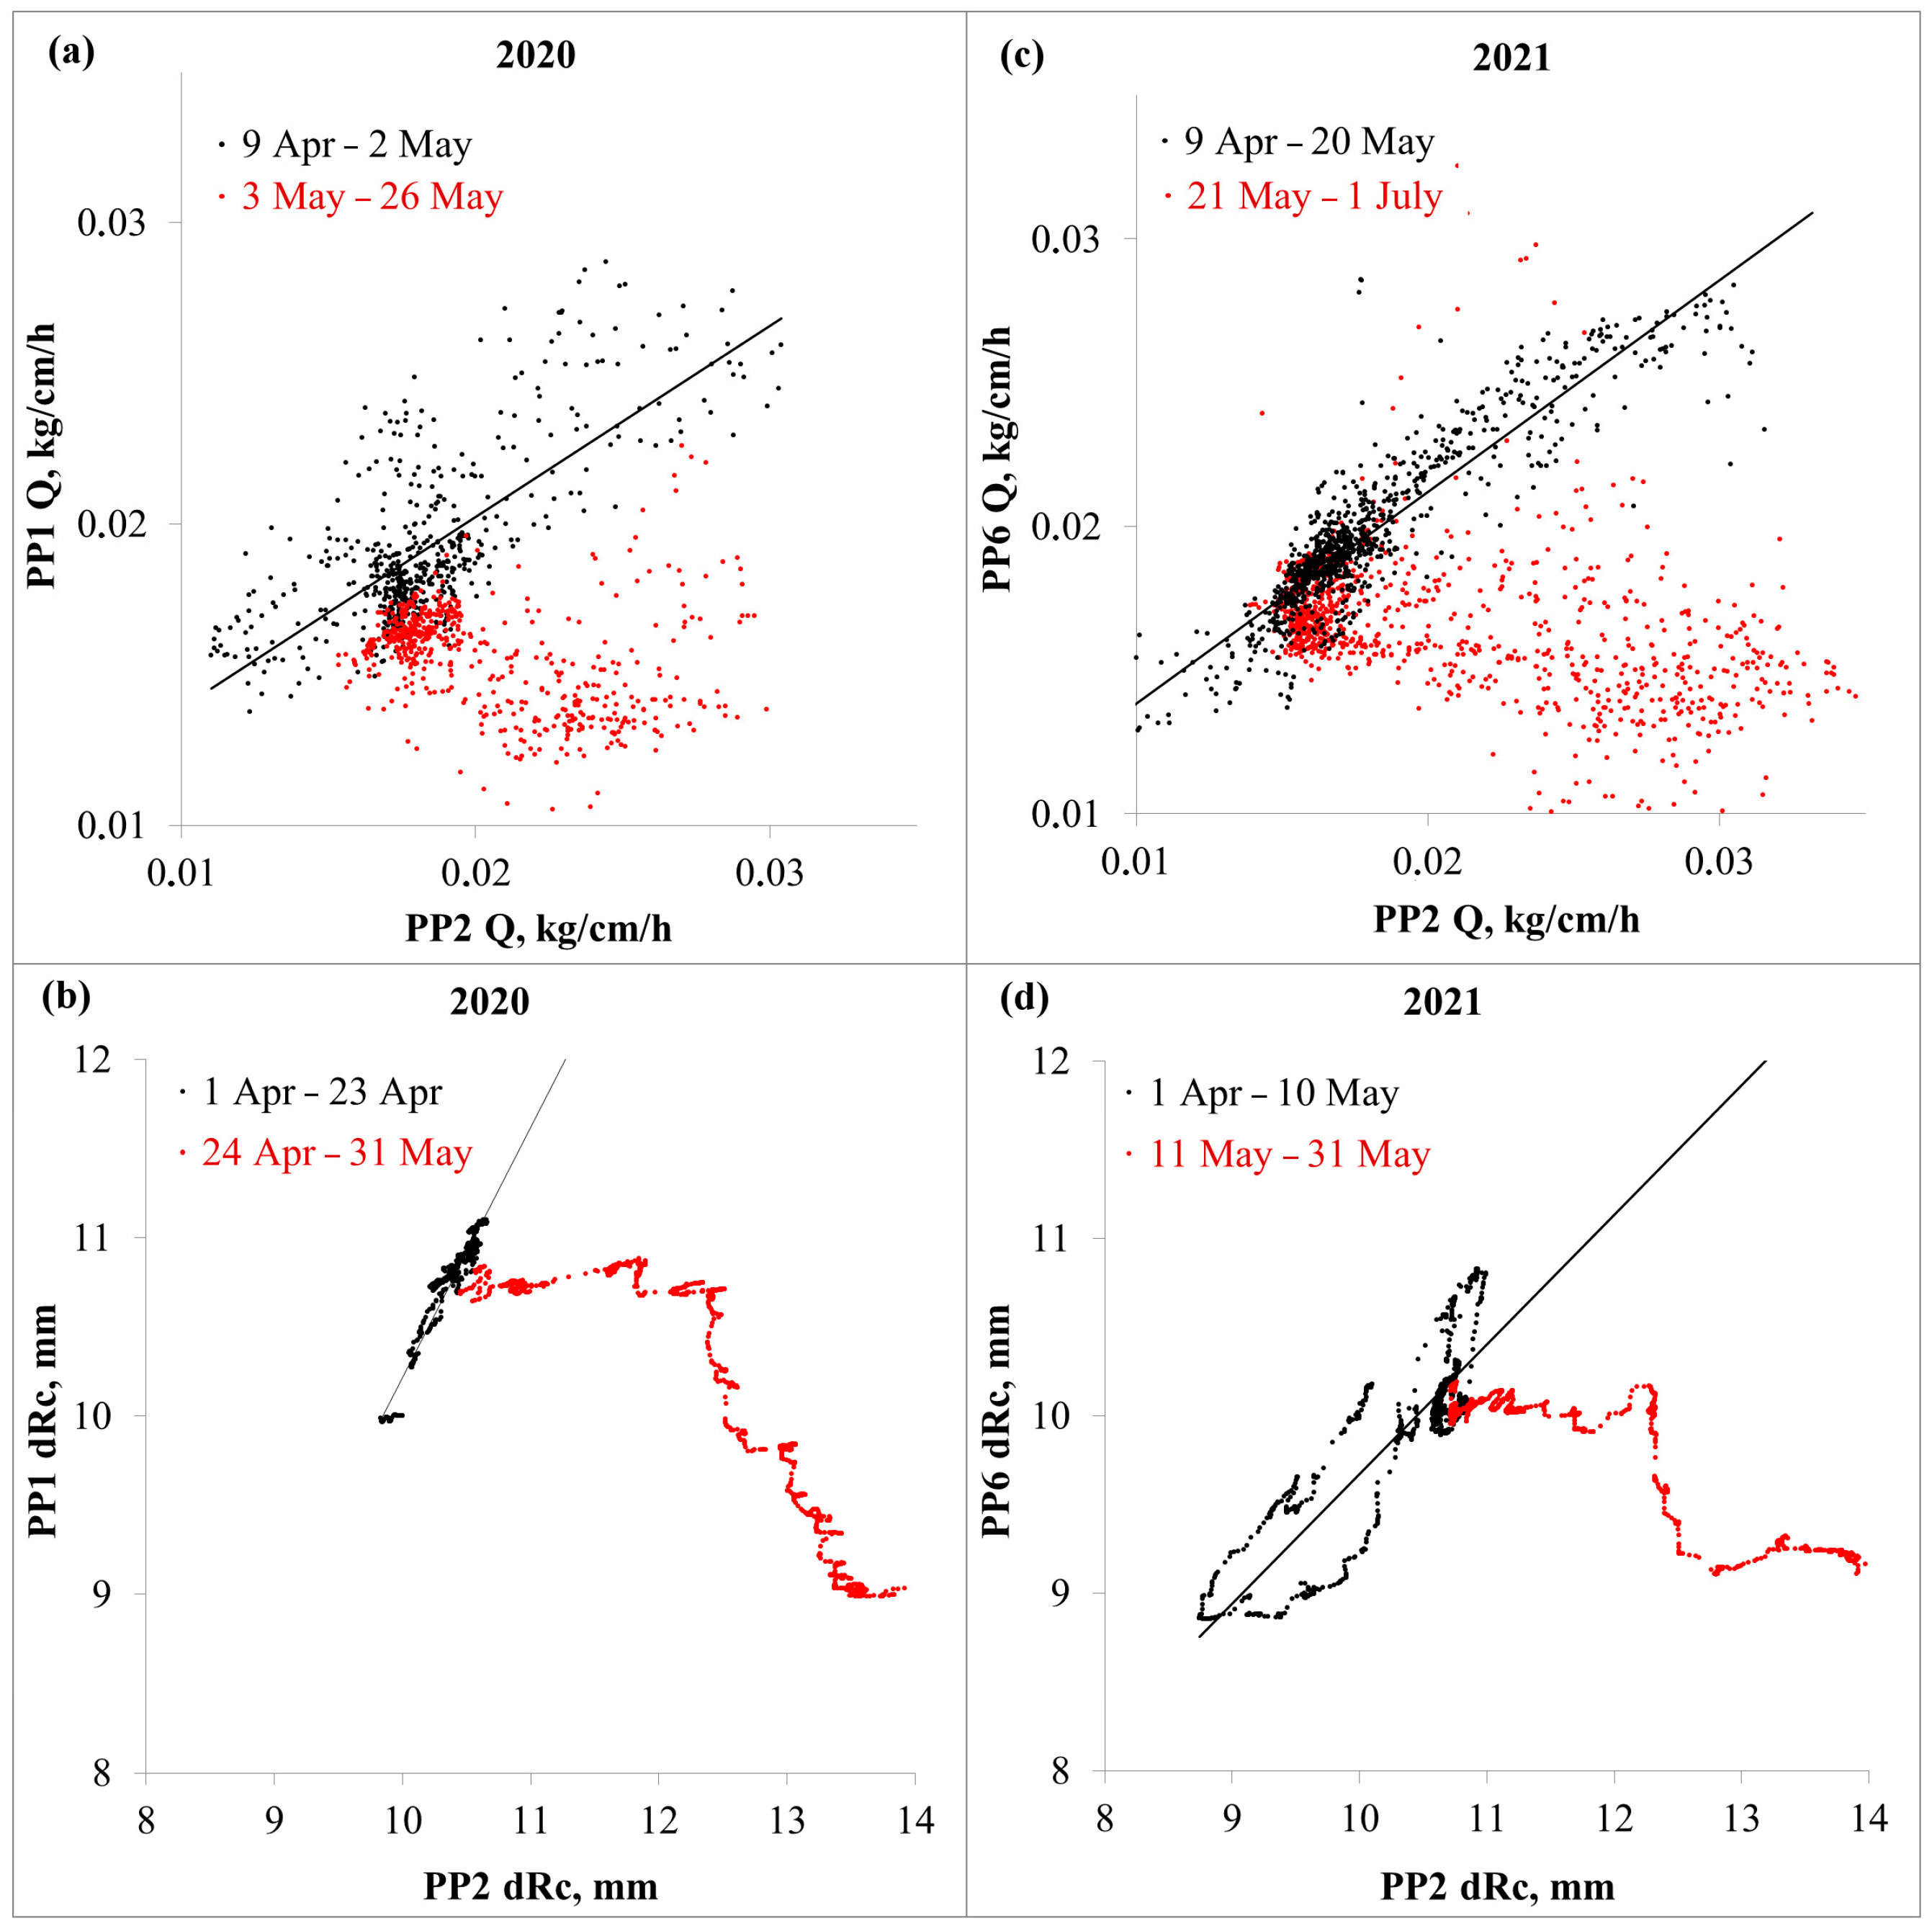
Diurnal cycles of stem circumference size variations (dRc) of the infected trees started to differ from the dRc of healthy trees 10–12 days before the sap flow termination, showing a continuous stem shrinkage in time (Figure 3b,d) and deviation in their regression (Figure 4b,d). A diurnal dRc data pattern change to the opposite of the normal water/growth-related cycle occurred on the first day of Q termination. Healthy trees showed diurnal dRc dynamics corresponding to the day/night transpiration cycle, reaching the daily minimum at the peak sap flow with high atmospheric vapor pressure deficit and daily maximum at night [39], while dRc of the infested trees started to follow the air temperature variations. Later, a permanent decline of mean daily stem circumference size was observed in the trees PP1 and PP6 after the sap flow stop dates (Figure 2).

3.2. Development of Beetles and Fungi

The quantitative estimation of the T. minor seasonal population, after the emergence of beetles from stems carried out in October 2021, showed a population density of 22.4 beetles per dm2 of the parental generation and 37 pcs/dm2 of the young generation in the lower part of the stems. At the same time, the estimation of T. minor population density, considering their intensity of maturation (secondary) feeding in pine shoots during the season of 2021 (data obtained in May 2022), resulted in an average number of seven shoots per 1 m2, characterizing the young generation of beetles population as high [40], capable of reaching 25–40 thousand beetles per hectare.
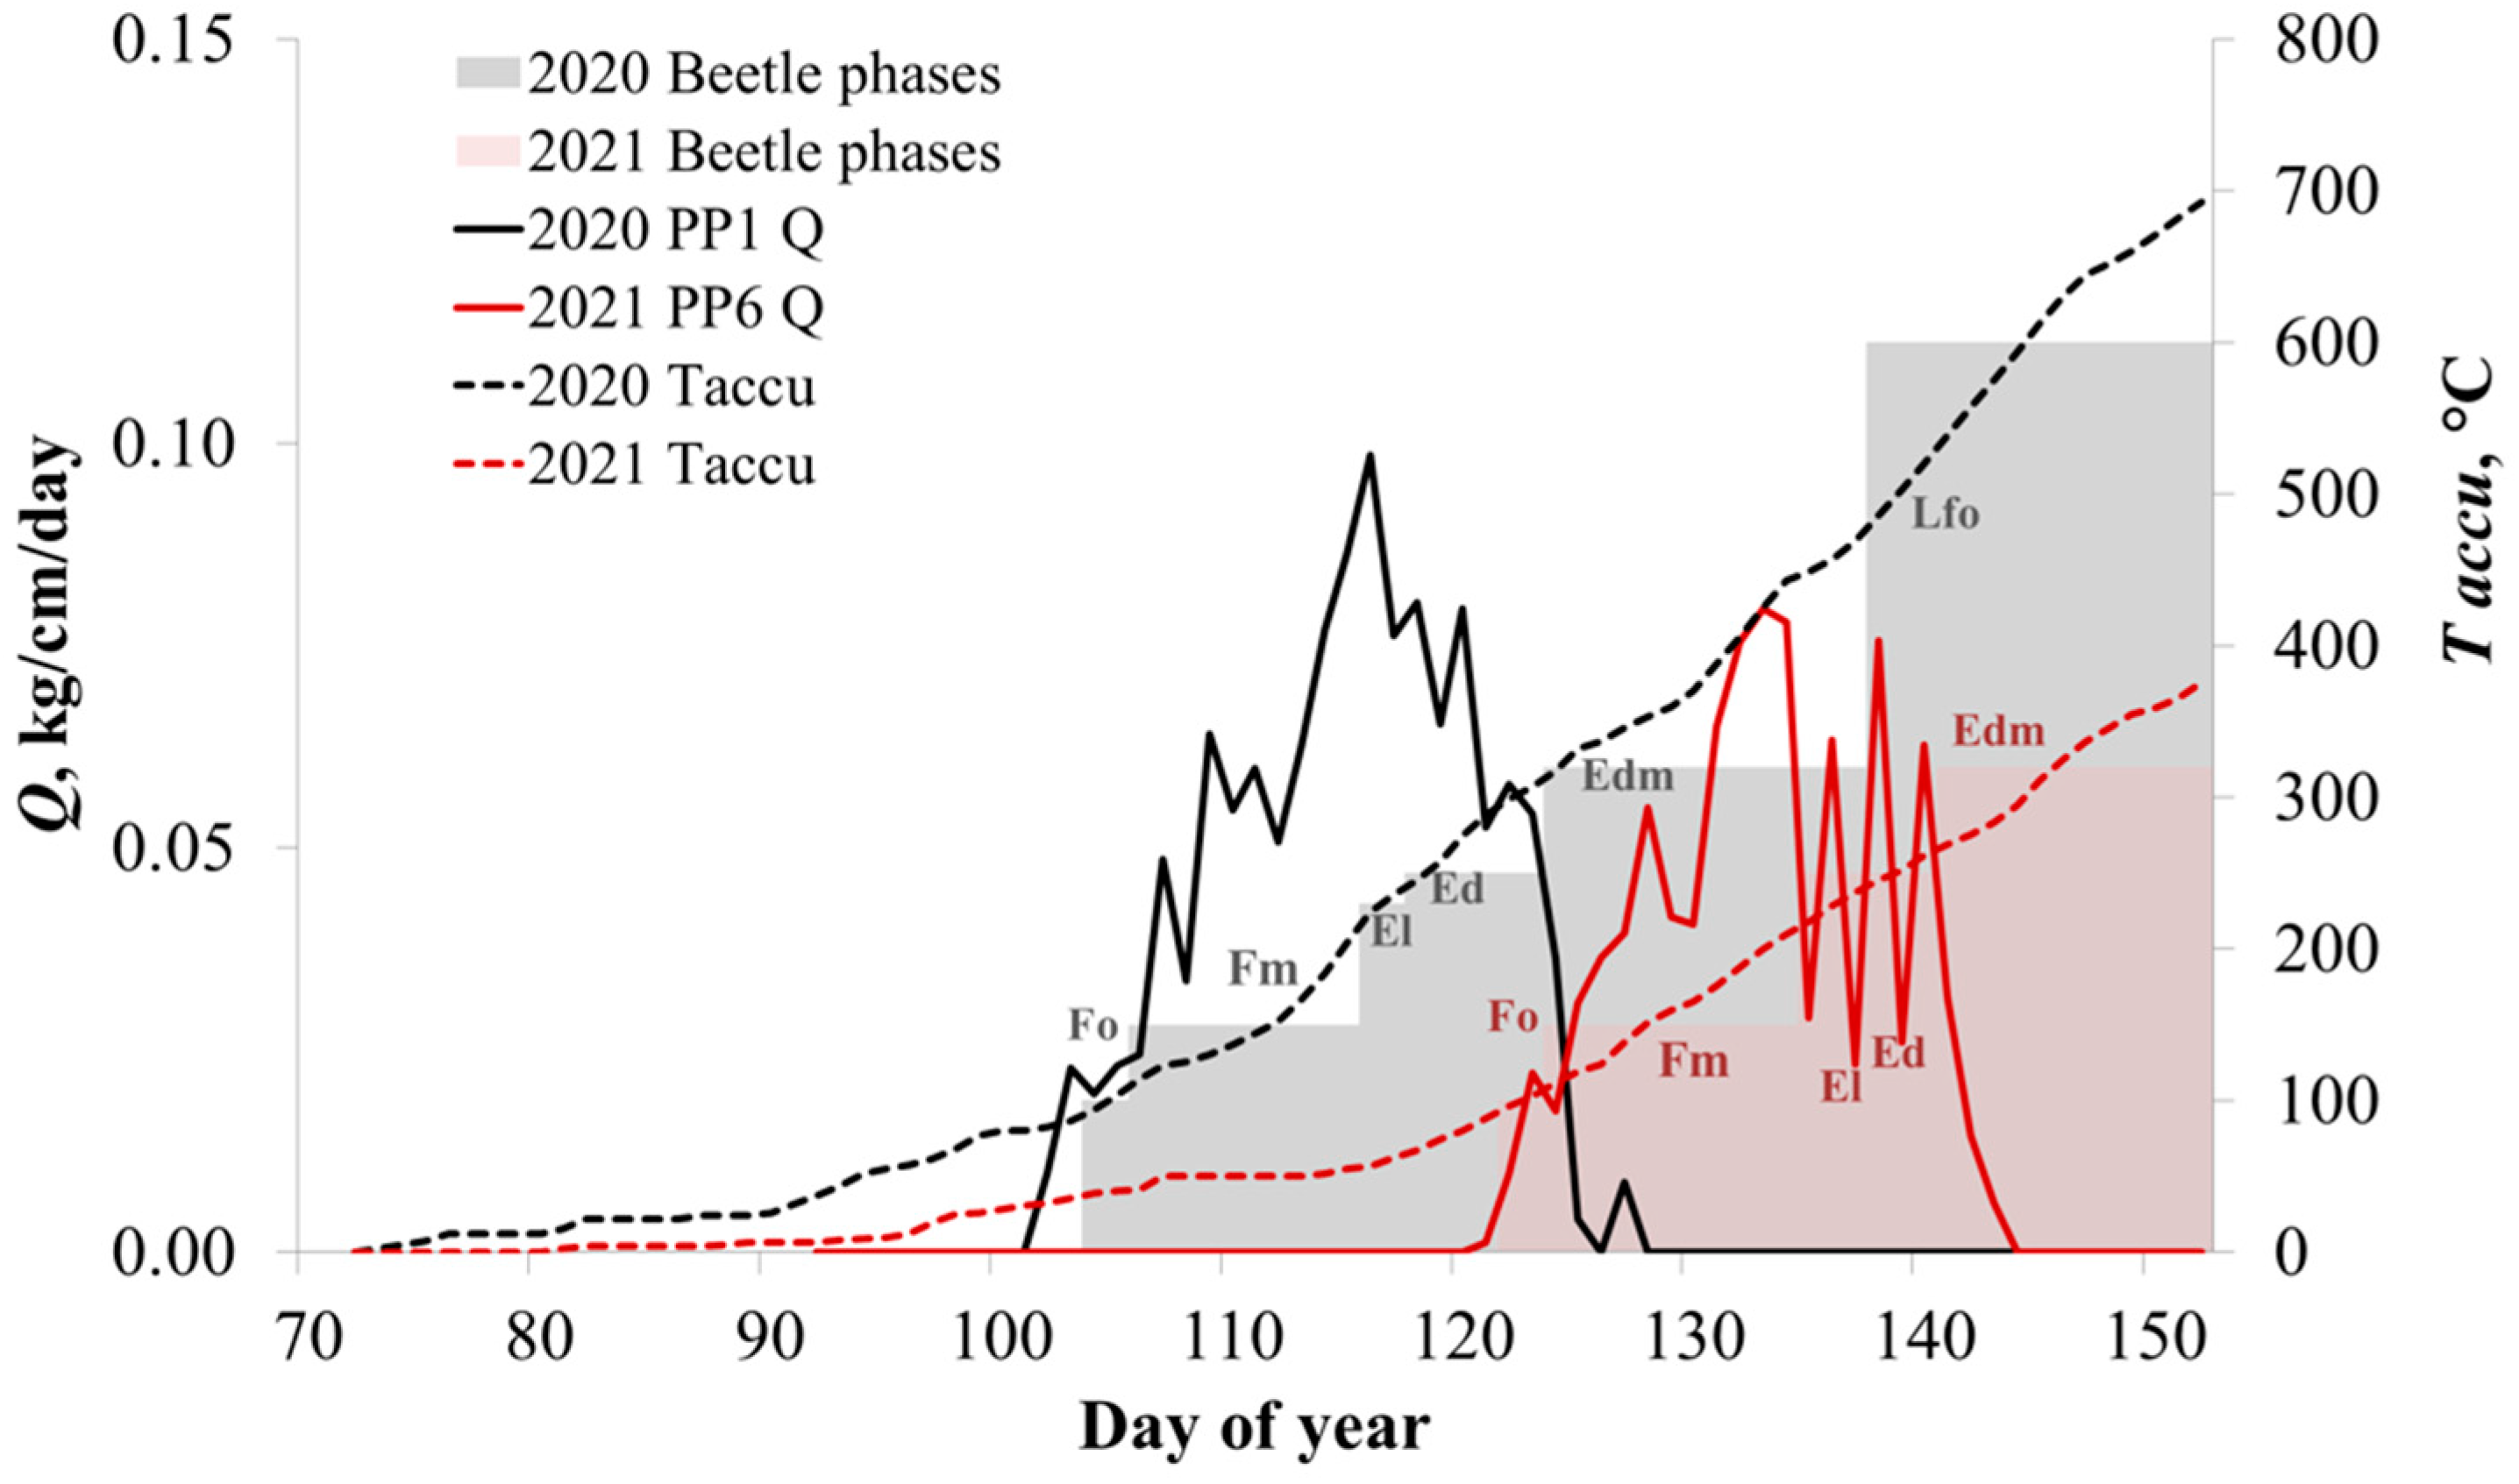
The reconstruction of the beetle’s lifecycle stages using Taccu let to assign the timing of Q and dRc disturbance in the monitored colonized trees with certain phenological phases of T. minor (Figure 5). The beginning of T. minor seasonal activity—the dispersal phase, when some mature beetles start to fly and attack pine trees, occurred on the next day after the seasonal Q onset (SoS) in both years, on 13 April 2020 (DOY 104) and on 1 May 2021 (DOY 122) at Taccu = 94–96 °C, respectively. The massive flight phase occurred two days later (Taccu = 111–114 °C), and the diurnal fluctuations of dRc in the colonized trees started to deviate from healthy trees (Figure 4c,d) after 23 April 2020 (DOY 114) and 11 May 2021 (DOY 131) in the ending of this phase at Taccu = 176–184 °C (i.e., 10–12 days after SoS). Further, the egg layout phase began simultaneously with the egg development phase on 25 April 2020 (DOY 116) and 14 May 2021 (DOY 135) at Taccu = 224–228 °C. The sap flow diurnal patterns started to decline (Figure 4a,b) on 3 May 2020 (DOY 124) and 21 May 2021 (DOY 142) at Taccu = 275–332 °C when the beetle’s eggs switched to the massive development phase. The upward sap flow termination in the PP1 and PP6 trees occurred on 8 May 2020 (DOY 128) and 23 May 2021 (DOY 144), 23–26 days since the SoS, and it corresponds to the massive egg development phase of T. minor at Taccu = 300–350 °C.
The fungus in the stem wood samples was identified as Pesotum piceae Crane & Schoknecht, Sporothrix Hektoen & Perkins, an anamorph of Ophiostoma piceae (Munch) H. et P. Sydow (Ophiostomatales: Ophiostomataceae). Conidial sporulation obtained during the cultivation formed a bunch of brown septate conidiophores united in coremia (Figure S3). Conidia were located in a large mucous droplet at the apex of the coremia. Analysis for fungi detection in the sampled pine roots did not reveal the presence of any fungi.
The analysis of stem disc cuts at several heights of the dead trees PP6 and PPx showed significant differences in the profile of the O. piceae fungi spread along and across the stem tissues in two-time intervals since the incursion of T. minor. About 60% of blue-stain lesions on wood tissues in the stem cross-area of the tree PPx at 1.3 and 5.3 m heights were observed at the end of June 2021 when the tree was felled. While only 4–8% are in the middle (9.3 m) and bottom (0 m) parts, but not at the upper part (0% at 17.3 m; Figure S1). Later by the end of the season, in October 2021, the tree PP6 showed blue-stain lesions in most of the stem, where fungi occupied 64–97% of the total cross-section areas. In contrast, only one part of the stem (at 13.3 m) showed to be much less (14%) affected by the fungi (Figure S2). Because T. minor beetles are the vector carriers of O. piceae fungi spores, the distribution of fungi in PPx provided an example of how the lower part of the stem was more accessible for T. minor beetles to penetrate through the bark, and it may also coincide with lower intensity of beetle attacks to this particular tree. The entire round spread of the fungi in the conductive tissues in the lower part of the stem led to the mortality of this tree. In contrast, the tree PP6 showed a higher effect of the fungal activity with the almost total detriment of sapwood along the stem length after ca. six months since the infestation and ca. five months since the sap flow termination. A less blue wood area at the height of 13.3 m in PP6 can only provide an assumption that the beetles did not inhabit this part of the trunk, but it is likely that the O. piceae later could eventually occupy this part of the trunk as well.

3.3. Wood Formation and Climate Response

Wood formation monitoring revealed the onset of cell enlargement in 2021 between 10 June and 22 June (DOY 161–173). However, when comparing a healthy tree (e.g., PP2) with the infested tree PP6, no cambial activity was observed in the affected (died) tree (Figure 6). By this time, the beetle’s phenological cycle already passed to the larvae feeding phase at Taccu = 520–650 °C.
Secondary growth from monitored trees was controlled by environmental factors during the growing season (Figure S4), favored by temperature during the mid-spring (April, r = 0.47; p < 0.001) and early autumn (September, r = 0.28; p < 0.05), whereas precipitation and water balance negatively affected tree secondary growth in the mid-spring (April, r = −0.38 and; p < 0.05 and r = −0.5 and; p < 0.001, respectively).

4. Discussion

The dataset presented in this manuscript shows, for the first time in Siberian forests, a multidisciplinary approach that combines in situ tree physiology monitoring, dendrochronology, entomology, and mycology to provide a broader understanding of Pinus dieback linked the inhabitation of the pine bark beetle Tomicus minor in symbiosis with the ophiostomatoid fungi Ophiostoma piceae. The natural origin of the monitored dieback was related to the infestation of the O. piceae fungi in the tree tissues, transported to the trees by the penetration of the T. minor beetles as vector insects [39]. Generally, this association is not recognized as pathogenic [41,42], and the spatial scale of their spread in Siberia has not yet been reported as a massive outbreak.
In general, the mechanism of tree mortality of the studied pine trees passes the following stages: (1) Tree weakening due to the effect of some environmental or individual factors. Although the tree-weakening source for the studied plot has yet to be identified, it may be related to water availability. On the one hand, monitored trees negatively responded to spring precipitation and water balance, which may provide excess soil moisture soaking the roots and limiting growth [43]. On the other hand, summer drought may also limit tree growth by water deficit, as was previously reported in a nearby mature pine forest stand [32,33] and in other regions of the Siberian forest-steppe [44]. (2) In spring, after the winter hibernation phase, pine bark beetles carrying the ophiostomatoid fungi spores begin to fly one or two days after the date of seasonal transpiration onset in pines, attack weak trees, and enter the tree phloem layer through the bark. (3) The fungi spores start developing and infest a tree in the xylem (live bark and cambium) and sapwood vertically and radially from the entrance points. (4) The beetles pass to the egg layout phase and massively start to develop galleries destroying the phloem layer structure and functionality. (5) As the process develops in time and across the stem area, the tracheid occlusion occurs in infested parts of the stem xylem affected by the fungi. (6) When the beetle’s cycle passes to the egg development phase, the sap flow intensity starts to decrease, the tree suffers an insufficient water supply from the roots, and the functionality of the infested tree is disturbed, increasing the tree’s weakening. In three to four days, sap flow stops. (7) Finally, a colonized tree does not pass through the secondary growth process, canopy degradation (yellowing and defoliation) occurs, and continuous stem shrinkage due to water loss (dehydration) terminates the process. This model is applied to O. piceae, and although many other fungal species may infect trees, we focused on O. piceae due to its abundance in the collected material, and the theoretical model may be extrapolated to other species.
Here, we have recorded two response scenarios of the studied pines to the pest attacks: (1) total mortality of two trees (PP1 and PP6) with complete termination of sap flow and (2) successful defense of one tree (PP10) with the resumption of normal functionality in terms of seasonal stem growth and water transport in the next season after initial pest incursion (from 2020 to 2021, Figure 2). The alive state of the tree PP10 in 2021 provided a guess that insect inhabitation and fungi spread is continuous and, in the beginning, cause partial damage to the stem tissues. It is related to the life cycle of pine bark beetles and the defense capability of trees [45,46], including several mechanisms, such as changes in bark [47] and resin duct production [48,49,50,51], involved in the production and storage of terpenoid-rich oleoresin in the secondary xylem throughout trees lifespan, acting as a chemical and physical defensive barrier against wounds and pathogens. Additionally, the fungi spread cannot be uniform in different parts (roots, stem, and branches) of pine trees and not complete (sectional) in the circumferential stem area [52], which probably explains the case of partial sap flow cessation in tree PP10, occurring in a year with the longest recorded growing season.
Scots pine dieback was observed at the research plot over several years (since 2017), and although it may be assumed that it could be related to human-caused disturbances as the installation of equipment and sampling (electrodes of the sap flow sensors, dendrometer bands, and TRW cores extraction, etc.), the origin of tree weakening and its following dieback is natural since it has also been observed in nonmanipulated individuals in a nearby pine forest stand and different locations in the region. The attenuation of the studied trees could be induced by drought periods that occurred in previous years. Drought decreases pine resistance to bark beetle attacks [53,54] and, in cases of high severity, also can lead to tree mortality as the environmental factor [12]. Nevertheless, Scots pine trees consume water reservoirs for transpiration in a safe (“economy”) mode in comparison with larch trees, as it was shown in previous studies [28,55]. Thus pine is assumed to be drought-resistant tree species [56] and can survive severe drought events [57].
Spring weather anomalies in the last decade caused significant variations in the phenological cycle of the studied trees [33], also affecting the timing of phenological phases in the lifecycle of T. minor beetles, as was shown in this study. One of several environmental factors impacting the population dynamics of T. minor is the survival rate in the overwintering phase of mature beetles, which depends on winter temperature and snow cover depth [58]. In the last decade, we observed warmer winters in the region (Figure S5), potentially increasing the beetle population and, consequently, the number of their attacks per year, which may exceed a defense threshold for some trees. The decline markers in the colonized trees were observed and recognized from dRc and Q measurements only within the process of pine bark beetle incursion and fungi infestation two weeks prior to the trees’ mortality. Nevertheless, it is planned to continue monitoring Scots pine dieback at the research plot and perform a more detailed analysis on recognition of preceding signs of tree decline (weakening) from the point of long-term climatic changes in addition to short-term weather anomalies in previous seasons before the tree mortality events.

5. Conclusions

A multidisciplinary approach in complex monitoring of water/growth processes in Pinus sylvestris trees provided a deeper understanding of the mechanism of tree mortality caused by the incursion of pine bark beetle (T. minor) with the infestation of associated ophiostomatoid fungi (O. piceae). In this work, through stem sap flow and dendrometer measurements complemented with periodic microcoring, we recorded and recognized specific data patterns and timing of water transport cessation and stem growth (wood formation) failure of the pine trees disturbed by the pests in comparison to control trees. Two scenarios of possible tree responses to the pine bark beetle attacks were proposed: mortality and defense, which provides some examples and hints about the possible survival and sustainability (resistance) of pines to the pest-harsh environment. Furthermore, the dates of stem radial shrinkage in junction with sap flow disturbance and termination in attacked pines correspond to the dispersal and reproduction phases in the life cycle of the genus Tomicus. Finally, these results complement a modern knowledge of pine mortality obtained from field observations and laboratory experiments. However, since many other fungal species may affect tree growth, a more complex analysis should be performed in the future accurately identify other pathogens. In this sense, an internal transcribed spacer (ITS) region analysis may be applied as a universal DNA barcode marker. Ideally, the number of affected monitored trees may be increased to provide more solid evidence of the parameters leading to (1) the weakening of the affected trees and (2) the triggering of the insect attacks. Nevertheless, our results suggest a theoretical model of the mechanism of tree mortality by T. minor in symbiosis with O. piceae, linked to increasing temperatures and setting a solid starting point for future research.
Pine bark beetles dynamics are driven by multiple factors, including weather conditions and tree resistance capabilities [59]. Hence, warmer winters in Siberia will likely lead to an increase in the T. minor beetle population, their faster migration, and conquering new territories by widening its habitat. Therefore, the economic and ecological impact of pine forest damage caused by different species of bark beetles will play a much more important role in the future.

Supplementary Materials

The following supporting information can be downloaded at https://www.mdpi.com/article/10.3390/f14071301/s1, Table S1: Calendar of dendrometer (dRc)/sap flow rate (Q) measurements at the research site. * (X)—tree died: PP4 and PP5 in 2017; PP1 in 2020; PP6 in 2021; Figure S1: Disc cuts of the PPx (control) tree stem logged in June 2021 showing the distribution of ophiostomatoid fungi in wood (percent of total disc area) at the following trunk heights: (a) 17.3 m—0%, (b) 9.3 m—4%, (c) 5.3 m—66%, (d) 1.3 cm—57%, and (e) 0 m—8%. Figure S2: Disc cuts of the PP6 tree stem logged in October 2021 showing the distribution of ophiostomatoid fungi in wood (percent of total disc area) at the following trunk heights: (a) 21.3 m—97%, (b) 19.3 m—92%, (c) 17.3 m—89%, (d) 15.3 cm—39%, (e) 13.3 m—14%, (f) 11.3 m—75%, (g) 9.3 m—71%, (h) 7.3 m—69%, (i) 5.3 m—68%, (j) 3.3 m—67%, (k) 1.3 m—64%, and (l) 0 m—72%. Figure S3: Microscope images of conidia droplets of ophiostomoid fungi Pesotum piceae cultivated from the stem wood samples extracted from the tree PP6. The images were taken in (a) filament lamp light and (b) led lamp light using the Micros MC100 microscope equipped with a Levenhuk C1400NG digital camera. Figure S4: Correlations (Pearson’s coefficient) between tree-ring width residual chronology of Pinus sylvestris with mean monthly temperature (T), total monthly precipitation (P), and water balance (WB) for the 1979–2021 period at Pogorelsky bor. Correlations were calculated from June of the previous year (uppercase letters) to September of the current growth year (lowercase letters). Dashed lines indicate p < 0.05, and dotted lines indicate p < 0.01. Figure S5: Mean November–March air temperature calculated from meteorological data recorded in the village of Sukhobuzimskoe (25 km northeast of the research plot).

Author Contributions

Conceptualization, A.R. and A.A.; in situ equipment installation and measurements, A.R., A.B. and E.A.; dendrochronological and seasonal growth samplings, A.A., E.A. and A.B.; microcore section preparations, K.T. and K.B.; beetle monitoring, S.A.; fungi determination, I.S.; writing—original draft preparation, A.R.; writing—review and editing, A.A.; funding acquisition, A.A. All authors have read and agreed to the published version of the manuscript.

Funding

This research was funded by the Ministry of Science and Higher Education of the Russian Federation, grant number FSRZ-2020-0014 and the Russian Science Foundation, grant number 18-74-10048 [monitoring and data analysis]. A.A. was supported by a mobility grant from Universidad de Valladolid.

Institutional Review Board Statement

Not applicable.

Informed Consent Statement

Not applicable.

Data Availability Statement

The data presented in this study are available from the authors upon reasonable request.

Acknowledgments

The authors are grateful to all participants of the fieldwork at the research plot in the period of 2014–2021. Special acknowledgments we address to Viktor Ivanov, Alexander Shashkin, and Vera Benkova (V.N. Sukachev Institute of Forest SB RAS).

Conflicts of Interest

The authors declare no conflict of interest. The funders had no role in the design of the study; in the collection, analyses, or interpretation of data; in the writing of the manuscript; or in the decision to publish the results.

References

  1. Gauthier, S.; Bernier, P.; Kuuluvainen, T.; Shvidenko, A.Z.; Schepaschenko, D.G. Boreal Forest Health and Global Change. Science 2015, 349, 819–822. [Google Scholar] [CrossRef] [PubMed]
  2. Wei, X.; Giles-Hansen, K.; Spencer, S.A.; Ge, X.; Onuchin, A.; Li, Q.; Burenina, T.; Ilintsev, A.; Hou, Y. Forest Harvesting and Hydrology in Boreal Forests: Under an Increased and Cumulative Disturbance Context. For. Ecol. Manag. 2022, 522, 120468. [Google Scholar] [CrossRef]
  3. Bytnerowicz, A.; Omasa, K.; Paoletti, E. Integrated Effects of Air Pollution and Climate Change on Forests: A Northern Hemisphere Perspective. Environ. Pollut. 2007, 147, 438–445. [Google Scholar] [CrossRef]
  4. Allen, C.D. Climate-Induced Forest Dieback: An Escalating Global Phenomenon? Unasylva 2009, 60, 43–49. [Google Scholar]
  5. Kharuk, V.I.; Im, S.T.; Ranson, K.J.; Yagunov, M.N. Climate-Induced Northerly Expansion of Siberian Silkmoth Range. Forests 2017, 8, 301. [Google Scholar] [CrossRef] [PubMed] [Green Version]
  6. Kharuk, V.I.; Im, S.T.; Soldatov, V.V. Siberian Silkmoth Outbreaks Surpassed Geoclimatic Barrier in Siberian Mountains. J. Mt. Sci. 2020, 17, 1891–1900. [Google Scholar] [CrossRef]
  7. Pavlov, I.N.; Litovka, Y.A.; Golubev, D.V.; Astapenko, S.A.; Chromogin, P.V.; Usoltseva, Y.V.; Makolova, P.V.; Petrenko, S.M. Mass Reproduction of Polygraphus proximus Blandford in Fir Forests of Siberia Infected with Root and Stem Pathogens: Monitoring, Patterns, and Biological Control. Contemp. Probl. Ecol. 2020, 13, 71–84. [Google Scholar] [CrossRef]
  8. Krivets, S.A.; Bisirova, E.M.; Kerchev, I.A.; Pats, E.N.; Chernova, N.A. Transformation of Taiga Ecosystems in the Western Siberian Invasion Focus of Four-Eyed Fir Bark Beetle Polygraphus proximus Blandford (Coleoptera: Curculionidae, Scolytinae). Russ. J. Biol. Invasions 2015, 6, 94–108. [Google Scholar] [CrossRef]
  9. Pashenova, N.V.; Kononov, A.V.; Ustyantsev, K.V.; Blinov, A.G.; Pertsovaya, A.A.; Baranchikov, Y.N. Ophiostomatoid Fungi Associated with the Four-Eyed Fir Bark Beetle on the Territory of Russia. Russ. J. Biol. Invasions 2018, 9, 63–74. [Google Scholar] [CrossRef]
  10. Linnakoski, R.; de Beer, Z.W.; Ahtiainen, J.; Sidorov, E.; Niemelä, P.; Pappinen, A.; Wingfield, M.J. Ophiostoma Spp. Associated with Pine- and Spruce-Infesting Bark Beetles in Finland and Russia. Persoonia Mol. Phylogeny Evol. Fungi 2010, 25, 72–93. [Google Scholar] [CrossRef] [Green Version]
  11. Mandelshtam, M.Y.; Selikhovkin, A.V. Bark and Ambrosia Beetles (Coleoptera, Curculionidae: Scolytinae) of Northwest Russia: History of the Study, Composition and Genesis of the Fauna. Entomol. Rev. 2020, 100, 800–826. [Google Scholar] [CrossRef]
  12. Preisler, Y.; Tatarinov, F.; Grünzweig, J.M.; Yakir, D. Seeking the “Point of No Return” in the Sequence of Events Leading to Mortality of Mature Trees. Plant. Cell Environ. 2020, 44, 1315–1328. [Google Scholar] [CrossRef]
  13. Kharuk, V.I.; Im, S.T.; Oskorbin, P.A.; Petrov, I.A.; Ranson, K.J. Siberian Pine Decline and Mortality in Southern Siberian Mountains. For. Ecol. Manag. 2013, 310, 312–320. [Google Scholar] [CrossRef]
  14. De Beer, Z.W.; Seifert, K.A.; Wingfield, M.J. A Nomenclator for Ophiostomatoid Genera and Species in the Ophiostomatales and Microascales. Biodivers. Ser. 2013, 12, 245–322. [Google Scholar]
  15. Kirisits, T. Fungal Associates of European Bark Beetles with Special Emphasis on the Ophiostomatoid Fungi. In Bark and Wood Boring Insects in Living Trees in Europe, a Synthesis; Springer: Dordrecht, The Netherlands, 2007; pp. 181–236. [Google Scholar]
  16. Salle, A.; Ye, H.; Yart, A.; Lieutier, F. Seasonal Water Stress and the Resistance of Pinus yunnanensis to a Bark-Beetle-Associated Fungus. Tree Physiol. 2008, 28, 679–687. [Google Scholar] [CrossRef] [Green Version]
  17. Steppe, K.; von der Crone, J.S.; De Pauw, D.J.W. TreeWatch.Net: A Water and Carbon Monitoring and Modeling Network to Assess Instant Tree Hydraulics and Carbon Status. Front. Plant Sci. 2016, 7, 993. [Google Scholar] [CrossRef] [PubMed] [Green Version]
  18. Poyatos, R.; Granda, V.; Molowny-Horas, R.; Mencuccini, M.; Steppe, K.; Martínez-Vilalta, J. SAPFLUXNET: Towards a Global Database of Sap Flow Measurements. Tree Physiol. 2016, 36, 1449–1455. [Google Scholar] [CrossRef] [Green Version]
  19. Zweifel, R.; Etzold, S.; Basler, D.; Bischoff, R.; Braun, S.; Buchmann, N.; Conedera, M.; Fonti, P.; Gessler, A.; Haeni, M.; et al. TreeNet–The Biological Drought and Growth Indicator Network. Front. For. Glob. Chang. 2021, 4, 776905. [Google Scholar] [CrossRef]
  20. Rubtsov, A.; Arzac, A.; Knorre, A.; Shashkin, A.; Benkova, V.; Vaganov, E. Stem Growth and Stem Sap Flow Measurements of Three Conifer Tree Species in Siberia. IOP Conf. Ser. Earth Environ. Sci. 2020, 611, 012028. [Google Scholar] [CrossRef]
  21. Biondi, F.; Hartsough, P.C.; Estrada, I.G. Daily Weather and Tree Growth at the Tropical Treeline of North America. Arctic Antarct. Alp. Res. 2005, 37, 16–24. [Google Scholar] [CrossRef] [Green Version]
  22. Wullschleger, S.D.; McLaughlin, S.B.; Ayres, M.P. High-Resolution Analysis of Stem Increment and Sap Flow for Loblolly Pine Trees Attacked by Southern Pine Beetle. Can. J. For. Res. 2004, 34, 2387–2393. [Google Scholar] [CrossRef]
  23. Kiorapostolou, N.; Camarero, J.J.; Carrer, M.; Sterck, F.; Brigita, B.; Sangüesa-Barreda, G.; Petit, G. Scots Pine Trees React to Drought by Increasing Xylem and Phloem Conductivities. Tree Physiol. 2020, 40, 774–781. [Google Scholar] [CrossRef] [PubMed]
  24. Vieira, J.; Rossi, S.; Campelo, F.; Nabais, C. Are Neighboring Trees in Tune? Wood Formation in Pinus Pinaster. Eur. J. For. Res. 2014, 133, 41–50. [Google Scholar] [CrossRef]
  25. Mäkinen, H.; Seo, J.-W.; Nöjd, P.; Schmitt, U.; Jalkanen, R. Seasonal Dynamics of Wood Formation: A Comparison between Pinning, Microcoring and Dendrometer Measurements. Eur. J. For. Res. 2008, 127, 235–245. [Google Scholar] [CrossRef]
  26. Cocozza, C.; Palombo, C.; Tognetti, R.; La Porta, N.; Anichini, M.; Giovannelli, A.; Emiliani, G. Monitoring Intra-Annual Dynamics of Wood Formation with Microcores and Dendrometers in Picea abies at Two Different Altitudes. Tree Physiol. 2016, 36, 832–846. [Google Scholar] [CrossRef] [Green Version]
  27. Ziaco, E.; Biondi, F.; Rossi, S.; Deslauriers, A. Environmental Drivers of Cambial Phenology in Great Basin Bristlecone Pine. Tree Physiol. 2016, 36, 818–831. [Google Scholar] [CrossRef] [Green Version]
  28. Urban, J.; Rubtsov, A.V.; Urban, A.V.; Shashkin, A.V.; Benkova, V.E. Canopy Transpiration of a Larix Sibirica and Pinus Sylvestris Forest in Central Siberia. Agric. For. Meteorol. 2019, 271, 64–72. [Google Scholar] [CrossRef]
  29. Kottek, M.; Grieser, J.; Beck, C.; Rudolf, B.; Rubel, F. World Map of the Köppen-Geiger Climate Classification Updated. Meteorol. Zeitschrift 2006, 15, 259–263. [Google Scholar] [CrossRef]
  30. Čermák, J.; Kučera, J.; Nadezhdina, N. Sap Flow Measurements with Some Thermodynamic Methods, Flow Integration within Trees and Scaling up from Sample Trees to Entire Forest Stands. Trees 2004, 18, 529–546. [Google Scholar] [CrossRef]
  31. Trcala, M.; Čermák, J. Improvement of the Trunk Heat Balance Method Including Measurement of Zero and Reverse Sap Flows. Agric. For. Meteorol. 2012, 166–167, 120–126. [Google Scholar] [CrossRef]
  32. Arzac, A.; Tabakova, M.A.; Khotcinskaia, K.; Koteneva, A.; Kirdyanov, A.V.; Olano, J.M. Linking Tree Growth and Intra-Annual Density Fluctuations to Climate in Suppressed and Dominant Pinus sylvestris L. Trees in the Forest-Steppe of Southern Siberia. Dendrochronologia 2021, 67, 125842. [Google Scholar] [CrossRef]
  33. Arzac, A.; Tychkov, I.; Rubtsov, A.; Tabakova, M.A.; Brezhnev, R.; Koshurnikova, N.; Knorre, A.; Büntgen, U. Phenological Shifts Compensate Warming-Induced Drought Stress in Southern Siberian Scots Pines. Eur. J. For. Res. 2021, 140, 1487–1498. [Google Scholar] [CrossRef]
  34. Grissino-Mayer, H.D. Evaluating Crossdating Accuracy: A Manual and Tutotial for the Computer Program COFECHA. Tree-Ring Res. 2001, 57, 205–221. [Google Scholar]
  35. Cook, E.R.; Holmes, R. Guide for Computer Program ARSTAN. In The International Tree-Ring Data Bank Program Library Version 2.0; Grissino-Mayer, H.D., Holmes, R.L., Fritts, H.C., Eds.; Laboratory of Tree-Ring Research: Tucson, AZ, USA, 1996; pp. 75–87. [Google Scholar]
  36. Thornthwaite, D.W. An Approach toward a Rational Classification of Climate. Geogr. Rev. 1948, 38, 55–94. [Google Scholar] [CrossRef]
  37. Rossi, S.; Anfodillo, T.; Menardi, R. Trephor: A New Tool for Sampling Microcores from Tree Stems. IAWA J. 2006, 27, 89–97. [Google Scholar] [CrossRef] [Green Version]
  38. Yakovenko, A.I. Phenological Features of Pine Shoot Beetles (Tomicus piniperda L. and T. Minor Hart.) at the Moscow Region. For. Bull. 2014, 18, 154–163. (In Russian) [Google Scholar]
  39. Jankowiak, R. Fungi Associated with Tomicus Minor on Pinus sylvestris in Poland and Their Succession into the Sapwood of Beetle-Infested Windblown Trees. Can. J. For. Res. 2008, 38, 2579–2588. [Google Scholar] [CrossRef]
  40. Borkowski, A. Spatial Distribution of Fallen Shoots of Scots Pine Pruned by Pine Shoot Beetles (Tomicus Spp.), and Evaluation of Methods of Shoot Collection in Central Poland. J. For. Res. 2007, 12, 358–364. [Google Scholar] [CrossRef]
  41. Solheim, H.; Krokene, P.; Långström, B. Effects of Growth and Virulence of Associated Blue-Stain Fungi on Host Colonization Behaviour of the Pine Shoot Beetles Tomicus Minor and T. Piniperda. Plant Pathol. 2001, 50, 111–116. [Google Scholar] [CrossRef]
  42. Krokene, P.; Solheim, H. Pathogenicity of Four Blue-Stain Fungi Associated with Aggressive and Nonaggressive Bark Beetles. Phytopathology 1998, 88, 39–44. [Google Scholar] [CrossRef] [PubMed] [Green Version]
  43. Li, Y.; Liu, H.; Zhu, X.; Yue, Y.; Xue, J.; Shi, L. How Permafrost Degradation Threatens Boreal Forest Growth on Its Southern Margin? Sci. Total Environ. 2021, 762, 143154. [Google Scholar] [CrossRef]
  44. Tabakova, M.; Arzac, A.; Martínez, E.; Kirdyanov, A. Climatic Factors Controlling Pinus sylvestris Radial Growth along a Transect of Increasing Continentality in Southern Siberia. Dendrochronologia 2020, 62, 125709. [Google Scholar] [CrossRef]
  45. Lieutier, F.; Yart, A.; Salle, A. Stimulation of Tree Defenses by Ophiostomatoid Fungi Can Explain Attack Success of Bark Beetles on Conifers. Ann. For. Sci. 2009, 66, 801. [Google Scholar] [CrossRef] [Green Version]
  46. Rosner, S.; Hannrup, B. Resin Canal Traits Relevant for Constitutive Resistance of Norway Spruce against Bark Beetles: Environmental and Genetic Variability. For. Ecol. Manag. 2004, 200, 77–87. [Google Scholar] [CrossRef]
  47. Franceschi, V.R.; Krokene, P.; Christiansen, E.; Krekling, T. Anatomical and Chemical Defenses of Conifer Bark against Bark Beetles and Other Pests. New Phytol. 2005, 167, 353–376. [Google Scholar] [CrossRef] [PubMed]
  48. Valor, T.; Hood, S.M.; Piqué, M.; Larrañaga, A.; Casals, P. Resin Ducts and Bark Thickness Influence Pine Resistance to Bark Beetles after Prescribed Fire. For. Ecol. Manag. 2021, 494, 119322. [Google Scholar] [CrossRef]
  49. DeRose, R.J.; Bekker, M.F.; Long, J.N. Traumatic Resin Ducts as Indicators of Bark Beetle Outbreaks. Can. J. For. Res. 2017, 47, 1168–1174. [Google Scholar] [CrossRef]
  50. Kane, J.M.; Kolb, T.E. Importance of Resin Ducts in Reducing Ponderosa Pine Mortality from Bark Beetle Attack. Oecologia 2010, 164, 601–609. [Google Scholar] [CrossRef]
  51. Ferrenberg, S.; Kane, J.M.; Mitton, J.B. Resin Duct Characteristics Associated with Tree Resistance to Bark Beetles across Lodgepole and Limber Pines. Oecologia 2014, 174, 1283–1292. [Google Scholar] [CrossRef]
  52. Heiniger, U.; Theile, F.; Rigling, A.; Rigling, D. Blue-Stain Infections in Roots, Stems and Branches of Declining Pinus sylvestris Trees in a Dry Inner Alpine Valley in Switzerland. For. Pathol. 2011, 41, 501–509. [Google Scholar] [CrossRef]
  53. Jaime, L.; Batllori, E.; Ferretti, M.; Lloret, F. Climatic and Stand Drivers of Forest Resistance to Recent Bark Beetle Disturbance in European Coniferous Forests. Glob. Chang. Biol. 2022, 28, 2830–2841. [Google Scholar] [CrossRef]
  54. Gaylord, M.L.; Kolb, T.E.; Pockman, W.T.; Plaut, J.A.; Yepez, E.A.; Macalady, A.K.; Pangle, R.E.; McDowell, N.G. Drought Predisposes Piñon–Juniper Woodlands to Insect Attacks and Mortality. New Phytol. 2013, 198, 567–578. [Google Scholar] [CrossRef] [PubMed]
  55. Urban, J.; Rubtsov, A.V.; Shashkin, A.V.; Benkova, V.E. Growth, Transpiration and Water Use Efficiency of Larix sibirica, Larix gmelinii and Pinus sylvestris Forest in Siberia. Acta Hortic. 2018, 1222, 125–131. [Google Scholar] [CrossRef]
  56. Lévesque, M.; Saurer, M.; Siegwolf, R.; Eilmann, B.; Brang, P.; Bugmann, H.; Rigling, A. Drought Response of Five Conifer Species under Contrasting Water Availability Suggests High Vulnerability of Norway Spruce and European Larch. Glob. Chang. Biol. 2013, 19, 3184–3199. [Google Scholar] [CrossRef] [PubMed]
  57. Guada, G.; Camarero, J.J.; Sánchez-Salguero, R.; Cerrillo, R.M.N. Limited Growth Recovery after Drought-Induced Forest Dieback in Very Defoliated Trees of Two Pine Species. Front. Plant Sci. 2016, 7, 418. [Google Scholar] [CrossRef] [PubMed] [Green Version]
  58. Bakke, A. Ecological Studies on Bark Beetles (Coleoptera: Scolytidae) Associated with Scots Pine (Pinus sylvestris L.) in Norway with Particular Reference to Influence of Temperature. Meddelelser Nor. Skogforsøksves. 1968, 21, 443–602. [Google Scholar]
  59. Lieutier, F.; Långström, B.; Faccoli, M. The Genus Tomicus. In Bark Beetles: Biology and Ecology of Native and Invasive Species; Vega, F.E., Hofstette, R.W., Eds.; Elsevier: Amsterdam, The Netherlands, 2015; pp. 371–426. ISBN 9780124171732. [Google Scholar]
Figure 1. Description of the research site: (a) site location (red circle); (b) mean monthly air temperature (°C, red line), relative air humidity (%, green line), and precipitation (mm, blue columns) for the 2005–2017 period; (c,d) photographs of the studied trees (photo by A. Rubtsov).
Forests 14 01301 g001
Figure 2. Daily base-lined stem sap flow rates ((a,c)—Q, kg/cm/day) and daily stem circumference size changes ((b,d)—dRc, mm, adjusted) of the studied pine trees (PP1–PP13) at the POG site in the vegetation seasons of 2020 (a,b) and 2021 (c,d). Red lines represent the Q and dRc time series of the dead trees PP1 (a,b) and PP6 (c,d); bold black line represents Q in the tree PP10. Dark green lines represent the mean Q and dRc values of healthy trees each year.
Forests 14 01301 g002
Figure 3. Hourly raw stem sap flow rate (Q, kg/cm/h, (a,c)) and stem radial size change (dRc, mm, (b,d)) data of the studied pine trees, representing the dieback of the trees PP1 in 2020 (a,b) and PP6 in 2021 (c,d).
Forests 14 01301 g003
Figure 4. Scatterplots of raw (not base-lined) hourly sap flow (Q, (a,c)) and stem circumference change (dRc, (b,d)) hourly values measured in the trees PP1 (a,b) died in 2020, PP6 (c,d) died in 2021 versus corresponding values measured in the healthy (control) tree PP2. Red dots represent data from died/alive trees posterior to the start dates of irreversible dRc and Q changes in each year related to the trees’ mortality, black dots show the ratios of the same values prior to it, and black lines show linear regression in these periods.
Forests 14 01301 g004
Figure 5. Dynamics of daily stem sap flow (Q) of the infested PP1 (black solid line) and PP6 (red solid line) trees and accumulated daily mean positive air temperature (Taccu, dashed lines). Black lines—the data from 2020; red lines—the data from 2021. Columns represent the T.minor beetle phases (dimensionless): Fo—flight onset, Fm—massive flight, El—egg layout, Ed—egg development, Edm—massive egg layout/development, and Lfo—larvae feeding onset; grey columns—in 2020, purple—2021.
Forests 14 01301 g005
Figure 6. Comparison of wood formation in one healthy tree (PP2) and one infested/dead tree (PP6) over different periods of the growing season in 2021: (a) 31 May, (b) 22 June, and (c) 30 September. Dashed lines represent tree-ring borders.
Forests 14 01301 g006
Disclaimer/Publisher’s Note: The statements, opinions and data contained in all publications are solely those of the individual author(s) and contributor(s) and not of MDPI and/or the editor(s). MDPI and/or the editor(s) disclaim responsibility for any injury to people or property resulting from any ideas, methods, instructions or products referred to in the content.